Effect of Inductance and Requirements for Surge Current ... · Source of Acquisition NASA Goddard...
15
Source of Acquisition NASA Goddard Space Flight Center Effect of Inductance and Requirements for Surge Current Testing of Tantalum Capacitors Alexander Teverovsky QSS Group, Inc. Code 562, NASA GSFC, Greenbelt, MD 20771 A1exander.A.Teverovsky. l@i)p.sfc.nasa.gov Abstract. Surge current testing is considered one of the most important techniques to evaluate reliability and/or screen out potentially defective tantalum capacitors for low-impedance applications. Analysis of this test, as it is described in the MIL-PRF-55365 document, shows that it does not address several issues that are important to assure adequate and reproducible testing. This work investigates the effect of inductance of the test circuit on voltage and current transients and analyzes requirements for the elements of the circuit, in particular, resistance of the circuit, inductance of wires and resistors, type of switching devices, and characteristics of energy storage bank capacitors. Simple equations to estimate maximum inductance of the circuit to prevent voltage overshooting and minimum duration of chargingdischarging cycles to avoid decreasing of the effective voltage and overheating of the parts during surge current testing are suggested. I. Introduction. High current spikes caused by power supply transients might result in short-circuit failures of tantalum capacitors and cause catastrophic consequences for electronic systems, including igniting the system. The probability of this type of failure is especially high for low-impedance circuits when inrush currents are limited mostly by the impedance of the capacitor itself [l]. Recently, these problems have gained yet more importance due to proliferation of distributed-power architecture systems and low-voltage DC-DC converters. Failures due to surge currents always have been a serious concern for manufacturers of tantalum capacitors and for design engineers. To bound inrush currents, application of limiting resistors was strongly recommended. First, in the 1960s, the requirement was 3 Ohms per each volt of operating voltage, but by the 1980s, due to improvement in reliability of the parts and strong commercial need to increase the efficiency of power supply systems, this requirement was reduced to 1 Ohm and in the 1990s even to 0.1 Ohm per volt [2, 31. To further assure reliable operation of tantalum capacitors in low-impedance applications, derating of the voltage to 50% and even 25% of the capacitor’s rated voltage is recommended [I]. However, in [4, 51 the authors argue that this rule for derating is not necessarily correct for new high-quality products. These trends clearly indicate a tendency of both designers and manufacturers to further decrease minimal values of limiting resistors and to relax requirements for derating, thus increasing operating voltages of tantalum capacitors in low-impedance applications. In this situation, it is important to have a clearly understood and proven methodology allowing reproducible and reliable evaluation of performance of the capacitors under high surge current stress conditions. The capability of tantalum capacitors to withstand high current transients is evaluated during surge current testing described for chip tantalum capacitors in the MIL-PRF-55365 standard. For hermetically sealed tantalum capacitors, similar test (with some minor variations) is described in MIL-PRF-39003. Surge current testing according to these standards is also recommended to screen out potentially weak parts for high-reliability space applications [6]. According to MIL-PRF-55365, the part is subjected to 10 surge cycles in a circuit similar to the one shown in Figure 1. Each cycle includes charging a bank energy storage capacitor, CB, to the rated voltage for 4 seconds and then discharging it to the device under test for 4 seconds and changing the switch to the upper position. The purpose of capacitor CB, which is required to be not less than 50,000 pF, is to simulate a power supply with low impedance. The standard requires that the total DC resistance of the circuit, &, including the wiriig, fixturing, and output impedance of the power supply, shall be a maximum of 1.2 Ohms. https://ntrs.nasa.gov/search.jsp?R=20060022606 2020-03-23T07:22:20+00:00Z
Transcript of Effect of Inductance and Requirements for Surge Current ... · Source of Acquisition NASA Goddard...
Source of Acquisition NASA Goddard Space Flight Center
Effect of Inductance and Requirements for Surge Current Testing of Tantalum Capacitors
Alexander Teverovsky Q S S Group, Inc.
Code 562, NASA GSFC, Greenbelt, MD 20771 A1exander.A.Teverovsky. l@i)p.sfc.nasa.gov
Abstract.
Surge current testing is considered one of the most important techniques to evaluate reliability and/or screen out potentially defective tantalum capacitors for low-impedance applications. Analysis of this test, as it is described in the MIL-PRF-55365 document, shows that it does not address several issues that are important to assure adequate and reproducible testing. This work investigates the effect of inductance of the test circuit on voltage and current transients and analyzes requirements for the elements of the circuit, in particular, resistance of the circuit, inductance of wires and resistors, type of switching devices, and characteristics of energy storage bank capacitors. Simple equations to estimate maximum inductance of the circuit to prevent voltage overshooting and minimum duration of chargingdischarging cycles to avoid decreasing of the effective voltage and overheating of the parts during surge current testing are suggested.
I. Introduction.
High current spikes caused by power supply transients might result in short-circuit failures of tantalum capacitors and cause catastrophic consequences for electronic systems, including igniting the system. The probability of this type of failure is especially high for low-impedance circuits when inrush currents are limited mostly by the impedance of the capacitor itself [l]. Recently, these problems have gained yet more importance due to proliferation of distributed-power architecture systems and low-voltage DC-DC converters.
Failures due to surge currents always have been a serious concern for manufacturers of tantalum capacitors and for design engineers. To bound inrush currents, application of limiting resistors was strongly recommended. First, in the 1960s, the requirement was 3 Ohms per each volt of operating voltage, but by the 1980s, due to improvement in reliability of the parts and strong commercial need to increase the efficiency
of power supply systems, this requirement was reduced to 1 Ohm and in the 1990s even to 0.1 Ohm per volt [2, 31. To further assure reliable operation of tantalum capacitors in low-impedance applications, derating of the voltage to 50% and even 25% of the capacitor’s rated voltage is recommended [I]. However, in [4, 51 the authors argue that this rule for derating is not necessarily correct for new high-quality products.
These trends clearly indicate a tendency of both designers and manufacturers to further decrease minimal values of limiting resistors and to relax requirements for derating, thus increasing operating voltages of tantalum capacitors in low-impedance applications. In this situation, it is important to have a clearly understood and proven methodology allowing reproducible and reliable evaluation of performance of the capacitors under high surge current stress conditions.
The capability of tantalum capacitors to withstand high current transients is evaluated during surge current testing described for chip tantalum capacitors in the MIL-PRF-55365 standard. For hermetically sealed tantalum capacitors, similar test (with some minor variations) is described in MIL-PRF-39003. Surge current testing according to these standards is also recommended to screen out potentially weak parts for high-reliability space applications [6].
According to MIL-PRF-55365, the part is subjected to 10 surge cycles in a circuit similar to the one shown in Figure 1. Each cycle includes charging a bank energy storage capacitor, CB, to the rated voltage for 4 seconds and then discharging it to the device under test for 4 seconds and changing the switch to the upper position. The purpose of capacitor CB, which is required to be not less than 50,000 pF, is to simulate a power supply with low impedance. The standard requires that the total DC resistance of the circuit, &, including the wiriig, fixturing, and output impedance of the power supply, shall be a maximum of 1.2 Ohms.
https://ntrs.nasa.gov/search.jsp?R=20060022606 2020-03-23T07:22:20+00:00Z

Figure 1. A simplified schematic of the surge current test per MIL-PRF-55365.
Some authors [2, 7, 81 have indicated that inductance of the circuit might increase the probability of failures during surge current testing. However, no analyses of conditions that would cause failures andor requirements to limit the value of the inductance have been given.
Note that in spite of obvious importance of the surge current testing, this test is optional per MIL-PRF- 55365, which probably reflects a degree of uncertainty in the value of this test. This uncertainty might be due to a not hlly understood mechanism of surge current failures and ambiguity about the types of flaws in the parts this testing reveals. Another possible reason might be related to problems with reproducibility of the test results in different laboratories.
The purpose of this work is to address issues of reproducibility of the testing by evaluating effects of inductance of circuit elements, discussing requirements for components used, and analyzing test conditions to assure more adequate and repeatable results. Analysis of failure mechanisms in tantalum capacitors caused by high current spikes is out of the scope of this work and will be discussed in a separate paper.
Content of this paper: I. Introduction. II. Inductance of elements of the test circuit.
II.1. Inductance of capacitors. 11.2. Inductance of wires and resistors.
III. Transients during surge testing. III. 1. Overdamped conditions. 111.2. Underdamped conditions. III.3. Critical damping conditions. 111.4. R-C model. III.5. Comparison with experiment.
N, Analysis of transients. N. I . Effect of inductance. N.2. Effect of resistance. N.3. Effect of capacitance.
Requirements for surge cuwent testing. V. 1. External resistance of the circuit. V.2. External inductance of the circuit. V.3. Type of switch.
V.
V.4. Energy storage bank capacitor. V.5. Charging time. V.6. Discharging time. V. 7. Number of surge cycles.
VI. Conclusions. VII. Acknowledgments VIII. References.
11. Inductance of elements of the test circuit.
II. 1. Inductance of capacitors. Frequency dependencies of impedance, Z, of tantalum capacitors have a so-called self-resonance frequency, f n at which the impedance reaches minimum. The value o f 5 for these parts is considered to be in the range from 0.2 to 1 h4Hz [9]; however, recent data indicate that5 might be as high as 2 to 3 MHZ [lo].
The behavior of Z-f characteristics can be explained assuming that the equivalent circuit of a tantalum capacitor can be represented as a capacitor, inductor, and resistor connected in series. For this circuit the impedance Z and its modulus IZI can be calculated as:
w x (ESL) - - w x c
where o is the radian frequency and ESR and ESL are the effective series resistance and inductance of the capacitor, respectively. The self-resonant frequency can be defied as:
1 = 2 n x j z -@Ej
At relatively low frequencies, f < f,, the part behaves as a capacitor, and at f > f,. as an inductor.
Ceramic capacitors show similar characteristics and also have self-resonant frequencies, which are typically greater compared to tantalum capacitors. This is due to both lower C and lower ESL values of ceramic parts. An overview of inductive properties of different types of low-voltage capacitors is given by Ewe11 [ll]. An increasing need for decoupling of signals in advanced high-frequency microcircuits and processors stimulated multiple theoretical and experimental studies of inductance characteristics of chip ceramic capacitors. Typically, the inductance of these parts varies from 4 to 5 nanohenries (nH) for leaded [12] to 1.1 to 1.7 nH for 2225-style chip capacitors [13], to 0.18 nH for 1206-style capacitors [14], and to 0.4 - 0.9 nH for 0805-style capacitors [ 1 11. Special-design, small-value
2

ceramic capacitors might have inductance as low as 50
Much less is known about the inductance of tantalum capacitors. According to Derksen at al. [16], both chip ceramic and tantalum capacitors have similar inductance in the order of 1-3 nH depending on their size. However, Martin [17], using a fast edge rate current pulse technique, has shown that 0.1 pF ceramic capacitors have 2.5 times less inductance compared to the same nominal tantalum capacitors, which had L - 12.5 nH. This value is consistent with 10.9 nH for 5.6 OF low ESR tantalum capacitors reported in [l l] . Similar results were obtained in [18], where ceramic capacitors had lower ESL compared to tantalum parts of similar size. For example, 10 uF/25V X5R MLCC/1206 had inductance of 2.5 nH, whereas 10 uF 35 V tantalum capacitor with a size of 1.3 X 4.3 mm had ESL = 6 nH.
ESL values of tantalum capacitors do not correlate with values of capacitance and/or rated voltage and remain within relatively narrow limits for a given size of the parts [ 191. However, inductive characteristics of tantalum chip capacitors have not been studied properly yet and there are no specifications for ESL measurements.
The inductance of a capacitor consisting of two parallel plates of width W, length 1, and distance between the plates d, can be calculated as [20]:
d x l
PH [W.
L = P P o w 
where po = 1.26~10.~ Wm is the permeability of free space and p is the permeability of the dielectric.
Note that according to this equation, for a given value of the capacitor diminishing of the length 1 (the size along the current flow) and increasing of the width, W would reduce L. This is an effective means for reduction of inductance in application of ceramic capacitors [ll], which can not be used for tantalum parts.
Considering that for a tantalum pentoxide dielectric p f: 1 and the effective area typically is -100 cm2 and d - 0.1 pm, for rough estimations it is possible to assume I = 1,000 mm and W = 10 mm. At these conditions calculations yield L = 13 pH. This is an extremely small value, and even considering inductance of the terminals, which typically does not exceed one nanohenry, the discrepancy between the calculations and experimental data remains rather significant. It is quite possible that the heterogeneity of the cathode and, in particular, micro-irregularities in the conductivity of the manganese layer, do not allow for identical
distribution of the current density in tantalum and manganese electrodes, so that the magnetic field outside the capacitor is not compensated completely. This might increase the inductance and cause higher ESL values of tantalum capacitors compared to ceramic parts of a similar size.
A simple method for ESL evaluation would be direct measurements of frequency dependencies of active and reactive resistances of the part. In our experiments these measurements were carried out in the range of frequencies from 0.1 kHz to 10 MHz on several CWR09-style capacitors using an impedance analyzer HP4192A with a direct coupled test fixture. Calculations based on these experiments showed that the inductance increases with frequency and levels off at f above - 2 MHz resulting in ESL varying from 80 nH to 110 nH. However, during discussion with Erik Reed (EL), he has indicated that these values are not consistent with the data obtained by direct measurements of high-frequency impedance for these parts and suggested a simple technique for ESL assessment.
Figure 2 shows a schematic for Z-f measurements using a high-frequency generator with the output limited by a 50-Ohm resistor and oscilloscope connected directly to the terminals of the capacitor with short coaxial cables.
I I Figure 2. A set-up for measurements of high-
frequency characteristics of tantalum capacitors.
Measurements of the input and output signals allowed for the phase shift and impedance calculations. Results of these calculations for two T495X156M050AS capacitors in the rage of frequencies from 1 kHz to 20 M H z are shown in Figure 3. Assuming that in the range from 3 to 6 M H z the impedance is mostly related to the inductance of the part and the skin effect is negligible, so that IZI = o xL, the calculated ESL values are in the range from 2.5 to 3 nH. These values are far below those obtained with hp4192A measurements and match the data reported by the manufacturer [lo].
The discrepancy compared to the results obtained using the impedance analyzer is presumably due to parasitic inductance and inadequate compensation of the fixture used for HP4192A measurements. Based on the available data, ESL of chip tantalum capacitors are likely in the range from 2 to 15 nH.
3

0.3
2 0.15 'p
al In z o n
-0.15
-a- 22, Ohm
0.45 I i 100
i 10 0 al
I : ! m U a,
-,: 0.1 .-
0 01 1 10 100 1000 10000 100000
frequency, kHz
Figure 3. Frequency dependence of the impedance and phase shift for two T495X156M050AS capacitors.
11.2. Inductance of wires and resistors.
Wires connecting elements of the circuit also have inductance, which can be calculated as [21]:
L, = 2 x 1 x [ l n ( p . 7 5 ] ,
where Lw is the low-frequency inductance of a straight piece of wire in nanohenries, 1 is the length of the wire in cm, and r is the radius of the wire in cm. Figure 4 shows variations of the Lw with the length for different wire diameters (AWG).
1 Low-frequency inductance of wires 1
F a? 0
5 a U S .-
600
500
400
300
200
100
0 0 3 6 9 12 15 18
length, inch
Figure 4. Variation of the inductance with length for wires of different diameters.
A total effective length of all wires used should be taken into account when the inductance of the testing circuit is estimated. A total effective length of the wire in a typical surge current test circuit can vary from 6 inches to -1.5 feet, which would result in inductance varying from -1 50 nH to -600 nH. Testing of the parts in temperature chambers might require even longer
wires, up to 2 to 2.5 feet, and would result in higher inductances, up to 900 or 1,200 nH. Power wire-wound resistors, which might be used to limit inrush currents during the surge testing, also have relatively high inductances. Measurements of several power resistors of 1 Ohm nominal gave inductances varying from 150 to 300 nH.
Estimations show that the total inductance of the external circuit used for surge current testing, L,, can vary from -150 nH to -1,500 nH.
111. Transients during surge testing.
The rise time of transients during surge current testing is in the microsecond range, which corresponds to the megahertz range in the frequency domain. For this reason, the inductance of capacitors cannot be neglected, and the equivalent circuit of the part should be represented as a capacitor, resistor, and inductor connected in series. Considering also inductance of external elements of the circuit, the schematic of the test shown in Figure 1 should be replaced with the circuit shown in Figure 5.
Figure 5. A schematic of the surge current test with consideration of inductance.
Transients in a circuit consisting of a capacitor C, inductor L, and resistor R, connected in series to a power supply Vo are described thoroughly in many handbooks on electrical circuits and can be calculated using the following differential equations:
d2u du LC--yj-+ RC- +U = V, dt dt
du dt
i( t) = c-, where u(t) is the voltage across the capacitor C and i(t) is the current through the part. For the circuit shown in Figure 5, R = ESR + R, and L = ESL + L,. Because the bank energy storage capacitor CJ, is much larger than the capacitance of device under test, Cy the total capacitance of the circuit is equal to C with sufficient accuracy.
4
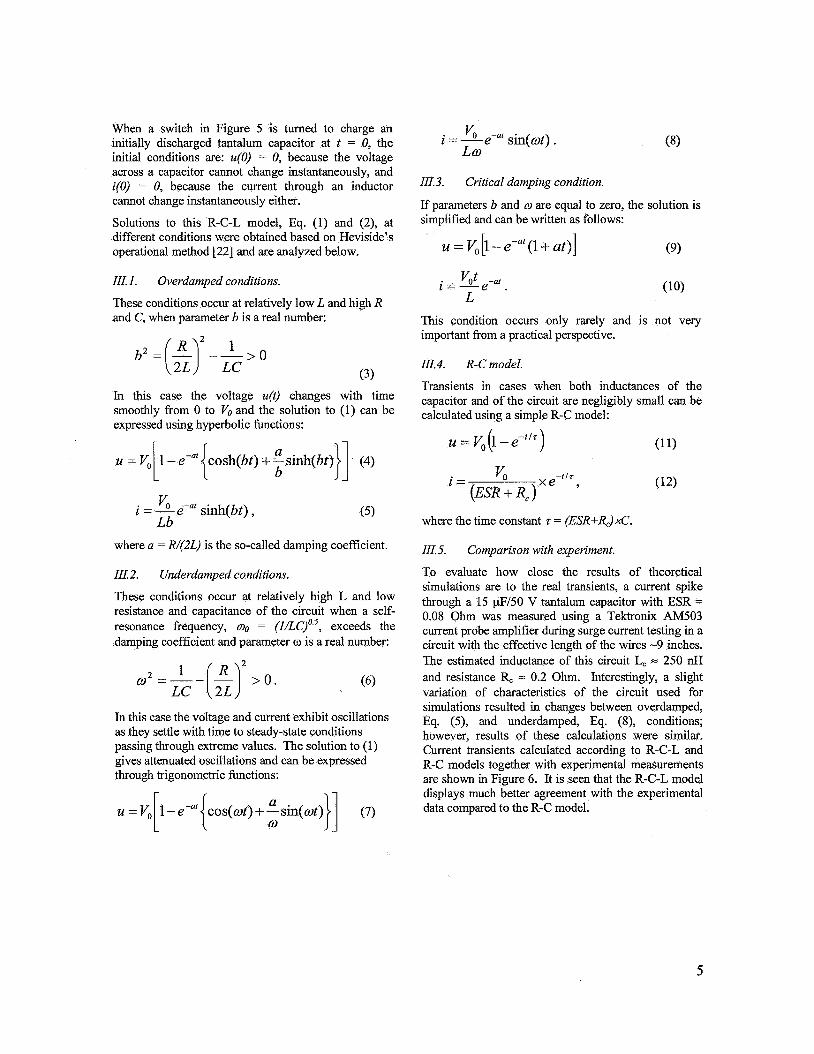
When a switch in Figure 5 is turned to charge an initially discharged tantalum capacitor at t = 0, the initial conditions are: u(0) = 0, because the voltage across a capacitor cannot change instantaneously, and i(0) = 0, because the current through an inductor cannot change instantaneously either.
Solutions to this R-C-L model, Eq. (1) and (2), at different conditions were obtained based on Heviside's operational method [22] and are analyzed below.
III. I . Overdamped conditions.
These conditions occur at relatively low L and high R and C, when parameter b is a real number:
(3) In this case the voltage u(t) changes with time smoothly from 0 to Vo and the solution to (1) can be expressed using hyperbolic functions:
cosh(bt) +- 5 sinh(bt) (4) b 11
i = s e - a f sinh(bt) , Lb
where a = lU(2L) is the so-called damping coefficient.
111.2. Underdamped conditions.
These conditions occur at relatively high L and low resistance and capacitance of the circuit when a self- resonance frequency, wo = (I/LC)"', exceeds the damping coefficient and parameter w is a real number:
In this case the voltage and current exhibit oscillations as they settle with time to steady-state conditions passing through extreme values. The solution to (1) gives attenuated oscillations and can be expressed through trigonometric functions:
11 a (7)
IIl.3. Critical damping condition.
If parameters b and w are equal to zero, the solution is simplified and can be written as follows:
. Vot -at I=-e . L
This condition occurs only rarely and is not very important from a practical perspective.
111.4. R-C model.
Transients in cases when both inductances of the capacitor and of the circuit are negligibly small can be calculated using a simple R-C model:
(11)
where the time constant z = (ESR+RJxC.
III.5. Comparison with experiment.
To evaluate how close the results of theoretical simulations are to the real transients, a current spike through a 15 pF/50 V tantalum capacitor with ESR = 0.08 Ohm was measured using a Tektronix AM503 current probe amplifier during surge current testing in a circuit with the effective length of the wires -9 inches. The estimated inductance of this circuit L, = 250 nH and resistance R, = 0.2 Ohm. Interestingly, a slight variation of characteristics of the circuit used for simulations resulted in changes between overdamped, Eq. (S), and underdamped, Eq. (8), conditions; however, results of these calculations were similar. Current transients calculated according to R-C-L and R-C models together with experimental measurements are shown in Figure 6. It is seen that the R-C-L model displays much better agreement with the experimental data compared to the R-C model.
5

180 160 140
*- 100 80
3 60 40 20 0
* 120
S
0 5 I O . 15 20 time, us
Figure 6. Experimental and calculated transients in a 15 pF, 50 V tantalum capacitor. The legend indicates values of R, and L, used for calculations according to
the R-L-C and R-C models. OD and UD means overdamped and underdamped conditions in the R-L-C
model.
IV. Analysis of transients.
It! I . Effect of inductance.
As an example of the effect of inductance on transients, Figure 7 shows results of a simulation of surge current testing calculated according to Eq. (4), (5), (7), and (8) for a capacitor under test having C = 1 pF, ESR = 0.1 Ohm, and ESL = 10 nH. The external resistance of the circuit, Rc = 0.6 Ohm, and inductance is assumed to vary from 0 to 2 pH. The charts show also transients calculated using a simple R-C model.
It is seen that increasing inductance in the circuit has three major effects: 1 . A decrease in the amplitude of current spike, I,,.
The value of I,, decreases more than 40% as the circuit inductance increases from 0 to 500 nH and more than 60% at L, = 2,000 nH.
2. An increase in the time to maximum, zma, and duration of the current spike, zSp. The value of zSp can be estimated as the width of the I(t) curve at I = 0.5~1,~. For the 1 pF capacitor, an increase of L, from 0 to 1,000 nH increases zSp from 0.5 ps to 2.2 ps and q,,= from 0.05 ps to 1.5 ps.
3. An increase of the possibility of voltage overshooting. As inductance of the circuit increases, the voltage transient transforms from the overdamped to underdamped condition, which results in oscillations and increase of the voltage across the capacitor to values above the nominal (or applied) voltage, Vo.
C = 1 uF, ESR=0.1 Ohm, ESL = 10 nH, Rc = 0.6 Ohm
1.5
1.2
0.9
0.6
0.3
0
-0.3
-Lc=500 nH
5
time, us
Rc = 0.6 Ohm
1.5
1.2 0 $ 0.9 ’ 0.6
0.3
0
Lc=300 nH - 1000nH -
time, us
b) Figure 7. Simulation of current (a) and voltage across the dielectric (b) transients during surge testing for a 1 pF capacitor at different values of circuit inductance L,. The resistance of the circuit, R, = 0.6 Ohm, was chosen in the middle of the range allowed per MIL-
PRF-55365.
This overshooting might be rather substantial and, for the considered case, the voltage amplitude increases more than 20% at L, above -500 nH and more than 45% above 2,000 nH. This might result in breakdown of the capacitor. Overshooting up to 70% has been observed experimentally in a set-up used by H. Holland [8] and increased the rate of failures during surge current testing significantly.
A decrease of I,, with increasing inductance goes along with increase of zSp, so that the total energy dissipated in the capacitor remains constant. However, instantaneous rise of the current might result in adiabatic local overheating, causing damage to the electrodes and dielectric and failure of the part. It is quite possible that at lower and wider current spikes this condition would not have been reached. The effect
6
of inductance-induced variations of the shape of current spikes on the results of surge current testing requires additional analysis. However, the implications of overshooting are quite obvious: increased probability of capacitors' breakdown and failures. In any case, different test laboratories using different surge current test set-ups might have different failure rates due to uncontrolled inductance of the circuits.
A simple Visual Basic program was developed to calculate variation of the three major parameters
C = 1 uF, ESL = 5 nH, ESR = 0.05 Ohm
" 1.5 - 2 -2.5 -
1 10 100 1 oc circuit inductance, nH - I
C = 1 uF, ESL = 5 nH, ESR = 0.05 Ohm 4.5 I I
4 y 3.5 2 3
'5 2
$ 1
% 2.5
.- 8 1.5
'.' 1000 2000 3i001
circuit inductance, nH c)
I
C = l uF,ESL=5nH, ESR = 0.05 Ohm 2
g d S O > 1.8 1.6 =:/ e 8 ~
$ $ 1.4
1.2
1 25 -
-
0 1000 2000 3000
circuit inductance, nH I
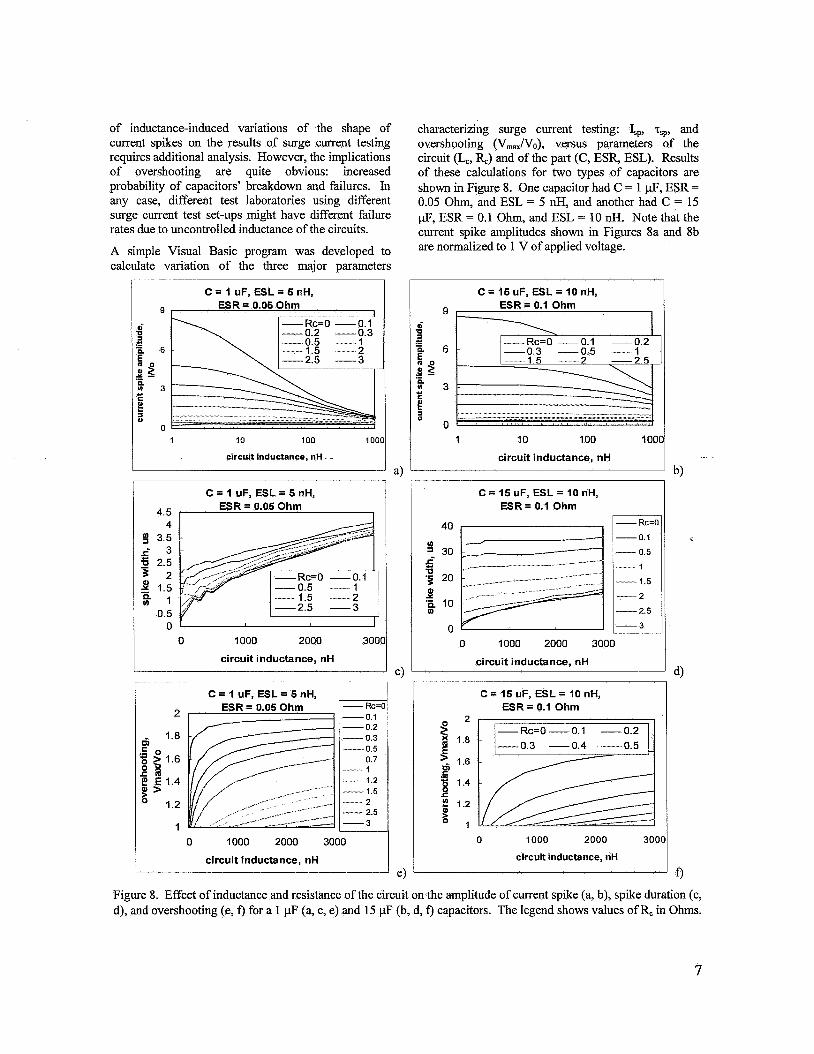
characterizing surge current testing: Isp, zsp, and overshooting (V,,N~), versus parameters of the circuit (Lo RJ and of the part (C, ESR, ESL). Results of these calculations for two types of capacitors are shown in Figure 8. One capacitor had C = 1 pF, ESR = 0.05 Ohm, and ESL = 5 nH, and another had C = 15 pF, ESR = 0.1 Ohm, and ESL = 10 nH. Note that the current spike amplitudes shown in Figures 8a and 8b are normalized t o 1 V of applied voltage.
C = 15 uF, ESL = 10 nH, ESR= 0.1 Ohm
-Rc=O -0.1 - 0.2 I
1 10 100 1 oot
circuit inductance, nH
C = 15 uF, ESL = 10 nH, ESR= 0.1 Ohm
C = 15 uF, ESL = I O nH, ESR= 0.1 Ohm
2
1.8
? 1.6 P 5 1.4
c 1.2 L:
0 1000 2000 3001
circuit inductance, nH
Figure 8. Effect of inductance and resistance of the circuit on the amplitude of current spike (a, b), spike duration (c, d), and overshooting (e, f ) for a 1 pF (a, c, e) and 15 pF (by d, f) capacitors. The legend shows values of R, in Ohms.
7
It is seen that the effect of inductance is especially significant for circuits with low resistances. At R, = 0 an increase of L, from 0 to 500 nH almost five times decreases I,, for a 1 pF capacitor, whereas at R, = 1.2 Ohms (maximum external resistance per MIL-PRF- 55365) this decrease was - 40% only.
Contrary to the R-C model, in which the amplitude of current spike depends on ESR and R, only, see Eq. (12), for the R-C-L model Is, depends also on the value of the capacitor. For example, at L, = 500 nH and R, in the range from 0.2 Ohm to 1 Ohm, Isp for a 15 pF capacitor is 2.1 to 1.3 times greater than for a 1 pF capacitor.
The pulse width increases virtually linearly with the external inductance and has a relatively weak dependence on R, for 1 pF capacitors but varies much more significantly for 15 pF parts.
As expected, overshooting increases with an increase of inductance and decrease of resistance of the circuit. For example, for 1 pF parts at R, = 0.1 Ohm, the overshooting increases from 5% at L, = 0 to -85% at L, = 1 pH. Theoretically, at large enough L,, the voltage would oscillate with amplitude of Vo around an average value of Vo, thus resulting in voltage across the capacitor rising up to 2xVO. These results indicate that the inductance-induced overshooting might be a major reason for failures during surge current testing and that the value of external inductance of the circuit should be limited to assure adequate and reproducible results of testing.
It is quite possible that in practice, when a low- impedance circuit operates with a load having a large enough inductance, overvoltage conditions on a tantalum capacitor would occur. For these cases it is reasonable to evaluate the capability of the part to withstand short, microsecond-level voltage spikes up to two times the rated voltage. This might necessitate development of a special “surge voltage” testing, which would require different test conditions compared to the existing surge current testing.
N.2. Effect of resistance.
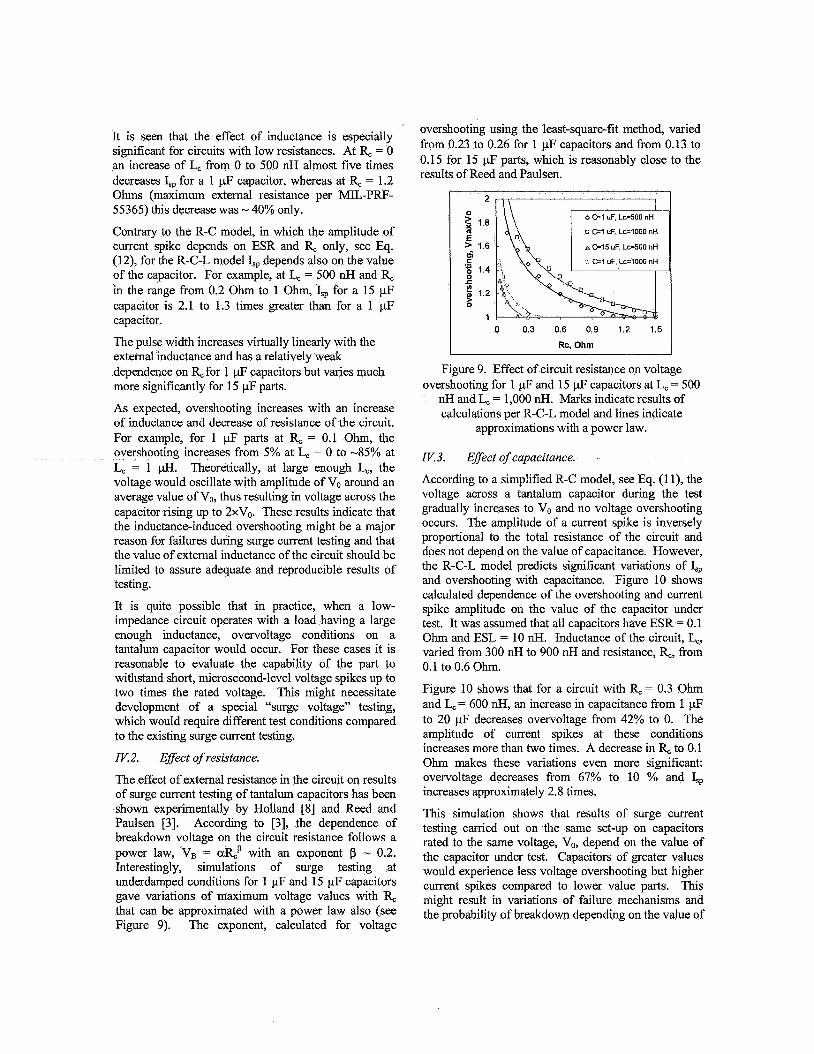
The effect of external resistance in the circuit on results of surge current testing of tantalum capacitors has been shown experimentally by Holland [8] and Reed and Paulsen [3]. According to [3], the dependence of breakdown voltage on the circuit resistance follows a power law, V, = asp with an exponent p - 0.2. Interestingly, simulations of surge testing at underdamped conditions for 1 pF and 15 pF capacitors gave variations of maximum voltage values with R, that can be approximated with a power law also (see Figure 9). The exponent, calculated for voltage
overshooting using the least-square-fit method, varied from 0.23 to 0.26 for 1 pF capacitors and from 0.13 to 0.15 for 15 pF parts, which is reasonably close to the results of Reed and Paulsen.
2 I I : I
> 1.6 d Z 1.4 .- r ff 1.2 0
0 GI uF, Lc=lOOO nH
d e 1 5 uF8 Lc=500 nH
1
I I 0 0 3 0.6 0 9 1 2
Rc, Ohm
Figure 9. Effect of circuit resistance on voltage overshooting for 1 pF and 15 pF capacitors at L, = 500
nH and L, = 1,000 nH. Marks indicate results of calculations per R-C-L model and lines indicate
approximations with a power law.
IV.3. Effect of capacitance.
According to a simplified R-C model, see Eq. (1 l), the voltage across a tantalum capacitor during the test gradually increases to Vo and no voltage overshooting occurs. The amplitude of a current spike is inversely proportional to the total resistance of the circuit and does not depend on the value of capacitance. However, the R-C-L model predicts significant variations of Isp and overshooting with capacitance. Figure 10 shows calculated dependence of the overshooting and current spike amplitude on the value of the capacitor under test. It was assumed that all capacitors have ESR = 0.1 Ohm and ESL = 10 nH. Inductance of the circuit, L,, varied &om 300 nH to 900 nH and resistance, %, from 0.1 to 0.6 Ohm.
Figure 10 shows that for a circuit with R, = 0.3 Ohm and L, = 600 nH, an increase in capacitance from 1 pF to 20 pF decreases overvoltage from 42% to 0. The amplitude of current spikes at these conditions increases more than two times. A decrease in R, to 0.1 Ohm makes these variations even more significant: overvoltage decreases from 67% to 10 % and 4, increases approximately 2.8 times.
This simulation shows that results of surge current testing carried out on the same set-up on capacitors rated to the same voltage, Vo, depend on the value of the capacitor under test. Capacitors of greater values would experience less voltage overshooting but higher current spikes compared to lower value parts. This might result in variations of failure mechanisms and the probability of breakdown depending on the value of
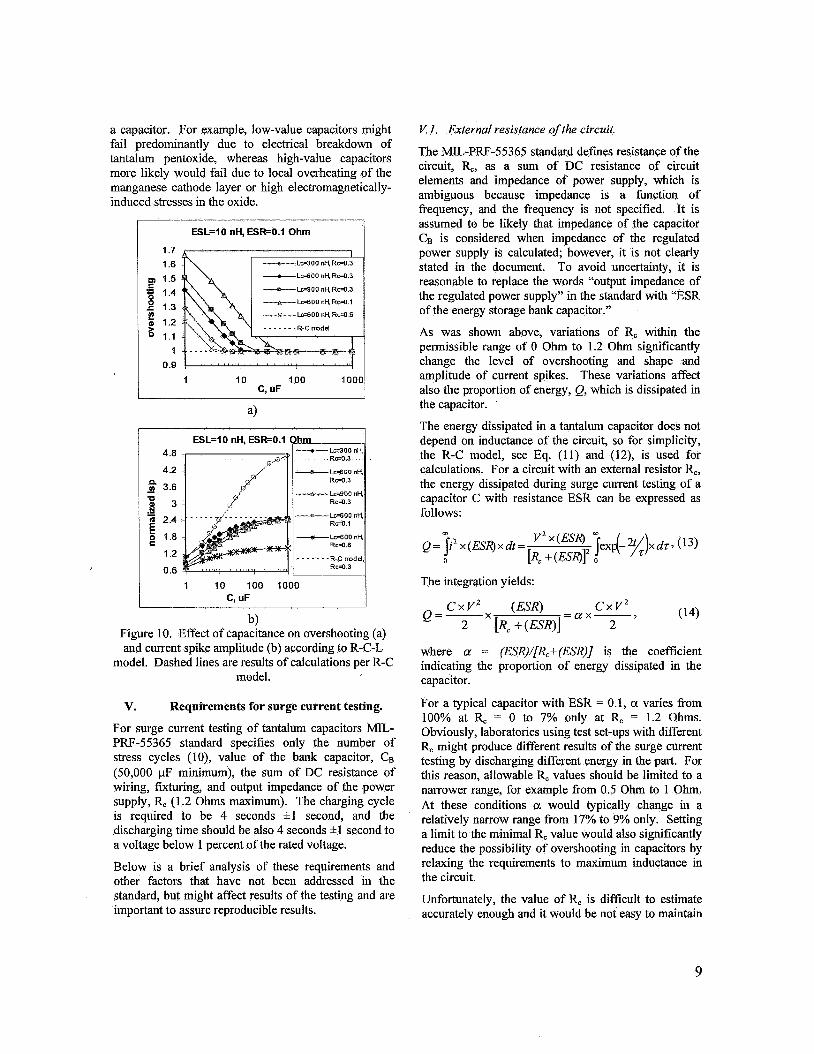
a capacitor. For example, low-value capacitors might V: I . External resistance of the circuit fail predominantly due to electrical breakdown of tantalum pentoxide, whereas high-value capacitors more likely would fail due to local overheating of the manganese cathode layer or high electromagnetically- induced stresses in the oxide.
C, UF
ESL=lO nH, ESR=O.I Ohm
-%---Lc=9OOn~Rc=O 3
- M O O ntt R d 1
ESL=IO nH, ESR=O.I Ohm
-----m----LC=900 nH, 3.6
U 0 3 .Y
2.4
0 1.8
1.2
0.6
- - E
The MIL-PRF-55365 standard defines resistance of the circuit, R,, as a sum of DC resistance of circuit elements and impedance of power supply, which is ambiguous because impedance is a function of frequency, and the frequency is not specified. It is assumed to be likely that impedance of the capacitor C, is considered when impedance of the regulated power supply is calculated; however, it is not clearly stated in the document. To avoid uncertainty, it is reasonable to replace the words “output impedance of the regulated power supply” in the standard with “ESR of the energy storage bank capacitor.”
As was shown above, variations of R, within the permissible range of 0 Ohm to 1.2 Ohm significantly change the level of overshooting and shape and amplitude of current spikes. These variations affect also the proportion of energy, Q, which is dissipated in the capacitor.
The energy dissipated in a tantalum capacitor does not depend on inductance of the circuit, so for simplicity, the R-C model, see Eq. (11) and (12), is used for calculations. For a circuit with an external resistor R,, the energy dissipated during surge current testing of a capacitor C with resistance ESR can be expressed as follows:
V. Requirements for surge current testing.
For surge current testing of tantalum capacitors MIL- PRF-55365 standard specifies only the number of stress cycles (lo), value of the bank capacitor, CB (50,000 pF minimum), the sum of DC resistance of wiring, fixturing, and output impedance of the power supply, R, (1.2 Ohms maximum). The charging cycle is required to be 4 seconds k l second, and the discharging time should be also 4 seconds + l second to a voltage below 1 percent of the rated voltage.
Below is a brief analysis of these requirements and other factors that have not been addressed in the standard, but might affect results of the testing and are important to assure reproducible results.
For a typical capacitor with ESR = 0.1, a varies from 100% at R, = 0 to 7% only at R, = 1.2 Ohms. Obviously, laboratories using test set-ups with different R, might produce different results of the surge current testing by discharging different energy in the part. For this reason, allowable R, values should be limited to a narrower range, for example from 0.5 Ohm to 1 Ohm. At these conditions a would typically change in a relatively narrow range from 17% to 9% only. Setting a limit to the minimal R, value would also significantly reduce the possibility of overshooting in capacitors by relaxing the requirements to maximum inductance in the circuit.
Unfortunately, the value of R, is difficult to estimate accurately enough and it would be not easy to maintain
9
R, within the tighter limits. However, the amplitude and shape of current spikes, which directly depend on &, can be measured relatively easily using a current probe or a small-value current shunt resistor connected in series with the capacitor under test. Using current spike oscillograms, the effective values of R, could be estimated and these values and/or the oscillograms should be reported together with the results of surge current testing for reference purposes.
V.2. External inductance of the circuit.
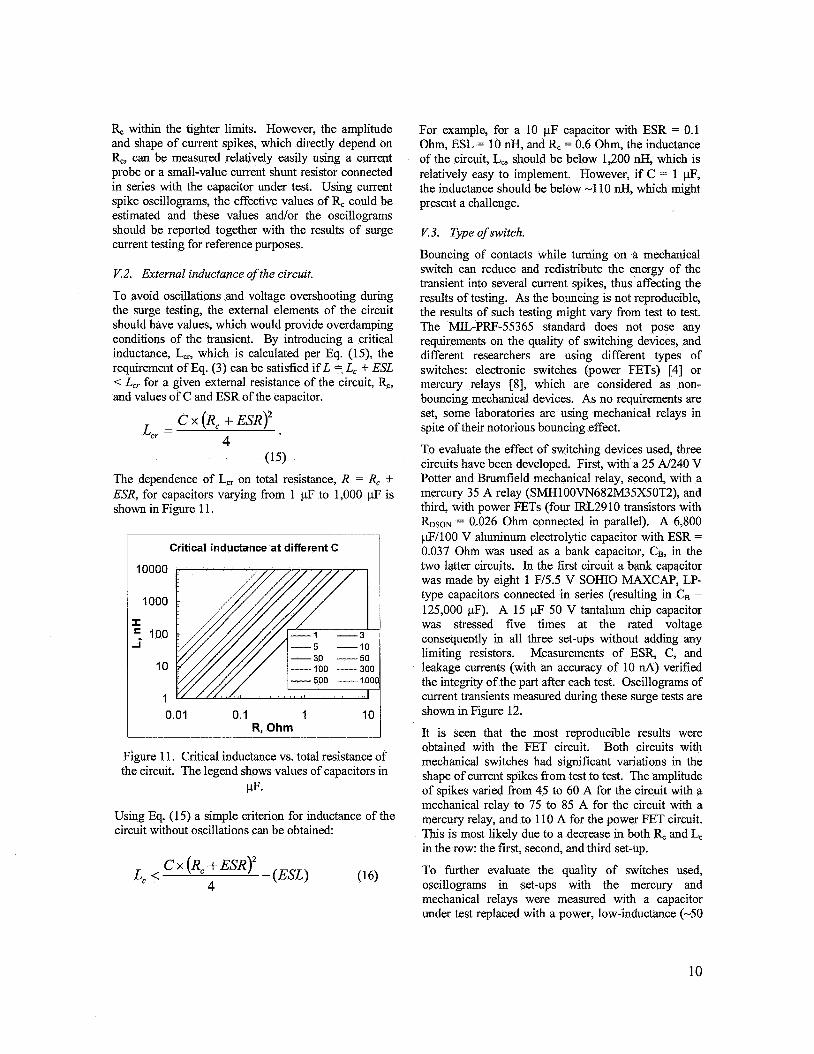
To avoid oscillations and voltage overshooting during the surge testing, the external elements of the circuit should have values, which would provide overdamping conditions of the transient. By introducing a critical inductance, L,, which is calculated per Eq. (15), the requirement of Eq. (3) can be satisfied if L =. L, + ESL < L, for a given external resistance of the circuit, K, and values of C and ESR of the capacitor.
c x (R, + ESR)’ 4 Lc, =
(15) The dependence of L, on total resistance, R = R, + ESR, for capacitors varying from 1 pF to 1,000 pF is shown in Figure 11.
Critical inductance at different C
10000
1000
I
-I =- 100
10
1 0.01 0.1 1 I(
R, Ohm
Figure 11. Critical inductance vs. total resistance of the circuit. The legend shows values of capacitors in
PF.
Using Eq. (15) a simple criterion for inductance of the circuit without oscillations can be obtained
- (ESL) (16) c x ( R ~ + ESR)’
4 Lc
For example, for a 10 pF capacitor with ESR = 0.1 Ohm, ESL = 10 nH, and R, = 0.6 Ohm, the inductance of the circuit, L,, should be below 1,200 nH, which is relatively easy to implement. However, if C = 1 pF, the inductance should be below -1 10 nH, which might present a challenge.
K3. Type of switch.
Bouncing of contacts while turning on a mechanical switch can reduce and redistribute the energy of the transient into several current spikes, thus affecting the results of testing. As the bouncing is not reproducible, the results of such testing might vary fiom test to test. The MIL-PRF-55365 standard does not pose any requirements on the quality of switching devices, and different researchers are using different types of switches: electronic switches (power FETs) [4] or mercury relays [8], which are considered as non- bouncing mechanical devices. As no requirements are set, some laboratories are using mechanical relays in spite of their notorious bouncing effect.
To evaluate the effect of switching devices used, three circuits have been developed. First, with a 25 A/240 V Potter and Bnunfield mechanical relay, second, with a mercury 35 A relay (SMHlOOVN682M35X50T2), and third, with power FETs (four IRL2910 transistors with RosoN = 0.026 Ohm connected in parallel). A 6,800 pF/lOO V aluminum electrolytic capacitor with ESR =
0.037 Ohm was used as a bank capacitor, CB, in the two latter circuits. In the first circuit a bank capacitor was made by eight 1 FE.5 V SOHIO MAXCAP, LP- type capacitors connected in series (resulting in CB =
125,000 pF). A 15 pF 50 V tantalum chip capacitor was stressed five times at the rated voltage consequently in all three set-ups without adding any limiting resistors. Measurements of ESR, C, and leakage currents (with an accuracy of 10 nA) verified the integrity of the part after each test. Oscillograms of current transients measured during these surge tests are shown in Figure 12. It is seen that the most reproducible results were obtained with the FET circuit. Both circuits with mechanical switches had significant variations in the shape of current spikes from test to test. The amplitude of spikes varied from 45 to 60 A for the circuit with a mechanical relay to 75 to 85 A for the circuit with a mercury relay, and to 110 A for the power FET circuit. This is most likely due to a decrease in both & and L, in the row: the first, second, and third set-up.
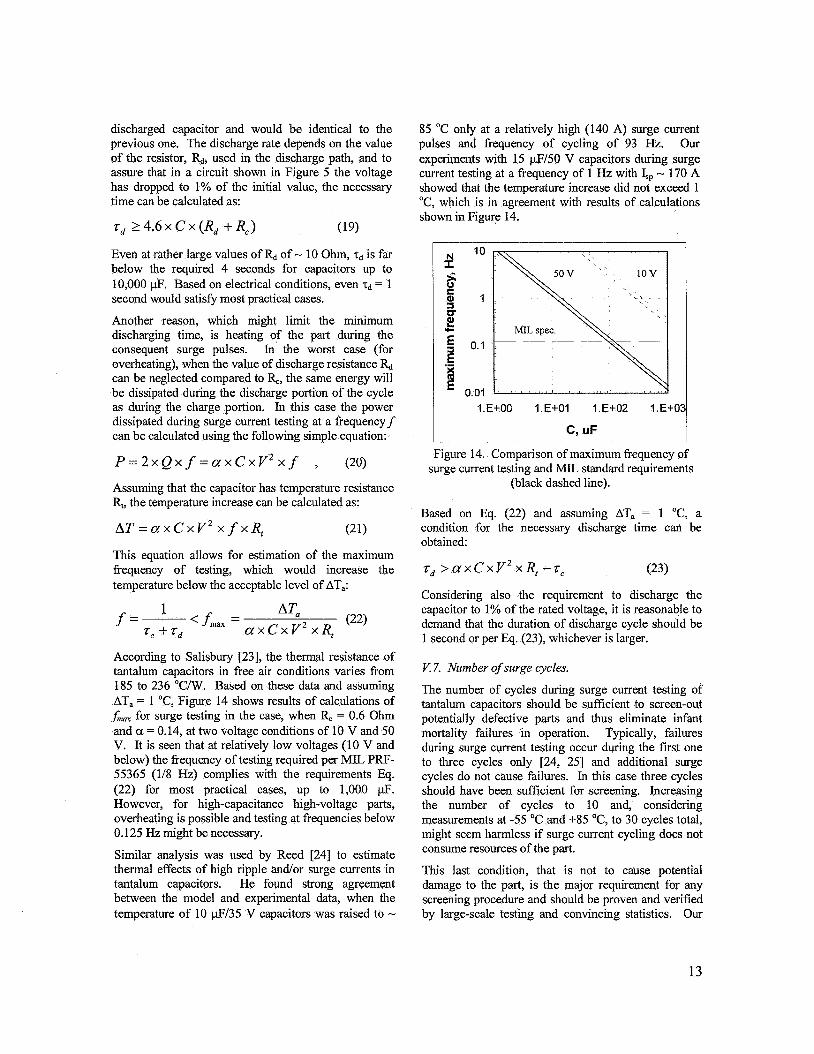
To further evaluate the quality of switches used, oscillograms in set-ups with the mercury and mechanical relays were measured with a capacitor under test replaced with a power, low-inductance (-50
10
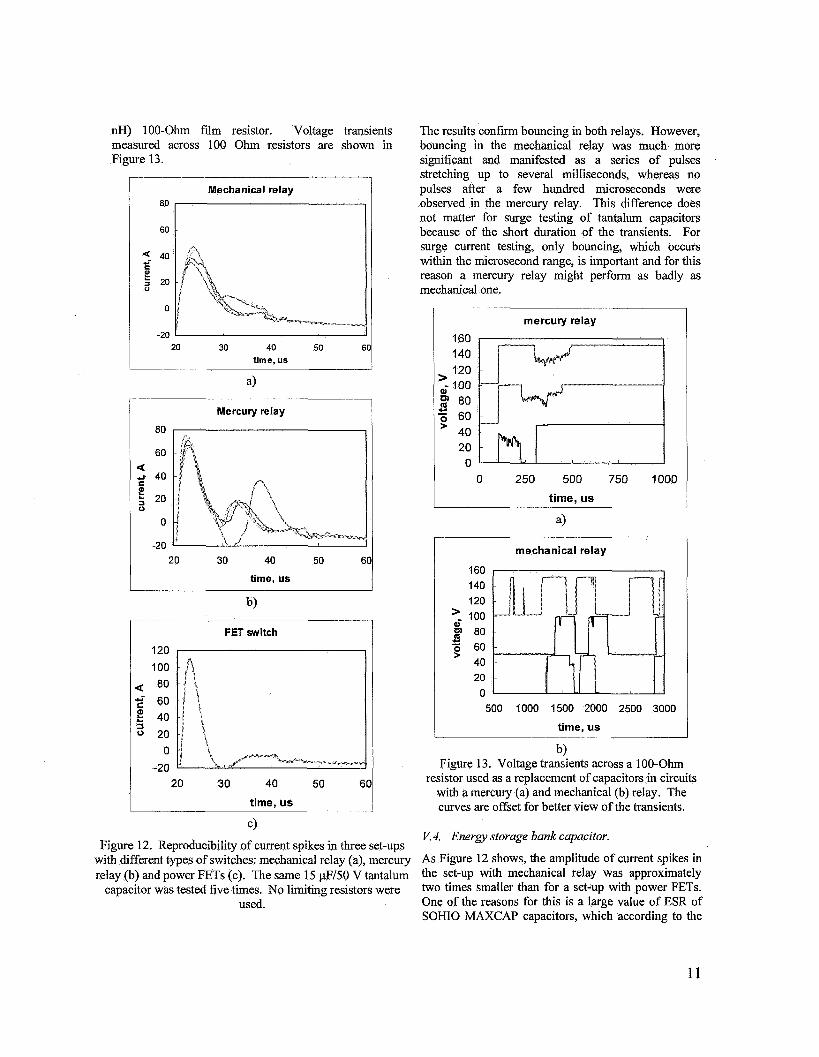
nH) 100-Ohm film resistor. Voltage transients measured across 100 Ohm resistors are shown in Figure 13.
Mechanical relay
8o I 6o I
-20 I 20 30 40 50 61
time, us
Mercury relay
80 I
60
+t- 40 a
5 20 S 0
0
0
-20 20 30 40 50
time, us
b)
FET switch
120 I I
100
a 80 f 60
40 0 20
0 -20
20 30 40 50 60
time, us
c) Figure 12. Reproducibility of current spikes in three set-ups
The results confirm bouncing in both relays. However, bouncing in the mechanical relay was much more significant and manifested as a series of pulses stretching up to several milliseconds, whereas no pulses after a few hundred microseconds were observed in the mercury relay. This difference does not matter for surge testing of tantalum capacitors because of the short duration of the transients. For surge current testing, only bouncing, which occurs within the microsecond range, is important and for this reason a mercury relay might perform as badly as mechanical one.
I mercury relay
160 140 120 100 80 60 40 20
0
r-----l I
0 250 500 750 1000
time, us
mechanical relay
160 I I
140 120
> 100 2 80 i
5 60 40 20 0
>
500 1000 1500 2000 2500 3000
time, us
Figure 13. Voltage transients across a 100-Ohm resistor used as a replacement of capacitors in circuits
with a mercury (a) and mechanical (b) relay. The curves are offset for better view of the transients.
V. 4. Energy storage bank capacitor.
with different types of switches: mechanical relay (a), mercury As Figure 12 shows, the amplitude of current spikes in relay (b) and power FETs (c). The same 15 @/50 V tantalum the Set-UP With m~hanica l relay Was approximately
capacitor was tested five times. No limiting resistors were two times smaller than for a Set-UP with Power FETs. used. One of the reasons for this is a large value of ESR of
SOH10 MAXCAP capacitors, which according to the
11

data sheet might exceed 1 Ohm. Connecting several of these capacitors in series increases the effective resistance of the circuit even further. This indicates the importance of limiting of the value of ESR of the bank capacitor and confirms the necessity to include this value in calculations of %. Aluminum electrolytic capacitors have low ESR values, and parts with large capacitances and voltages are readily available. This makes them good candidates for energy storage for the surge testing.
The purpose of using of the bank storage capacitor CB is to simulate a power supply with a virtually unlimited current source so that the set voltage would be maintained constant during the test. When a capacitor CB, which had been precharged to a voltage Vo, is discharged to a capacitor-under-test C, the charge initially stored in CB will be distributed in two capacitors, CB and C, and the resulting voltage after transient, V, would be lower than Vo:
This allows estimation of the necessary value of CB:
V e, = c x - , 1-v
where v = V/V, is a parameter indicating voltage stability during the test.
It is reasonable to require that the value of CB is great enough so the voltage across the capacitor under test does not drop below v = 95% to 99%. For this, the bank capacitor should be approximately 20 to 100 times greater than C. The existing requirement for CB to be more than 50,000 pF is evidently excessive for tantalum capacitors of less than 500 pF, which is the majority of the parts employed in most applications.
Using excessively large energy storage bank capacitors might have negative consequences for surge current testing for the following reasons:
Connecting several capacitors with C << 50,000 pF in parallel increases the effective length of the wires and inductance of the circuit.
Connecting several capacitors with C >> 50,000 pF and low-rated voltage in series to increase the effective voltage of CB also increases the inductance. Besides, it sums up ESR values, thus increasing resistance of the circuit, &. To avoid damage to bank capacitors and/or power supplies, capacitor CB is charged through a resistor RPs (see Figure 5), which is presumably in the range from -30 to 300 Ohms (assuming that 3
Ohms per volt is necessary to avoid damage to CB and the rated voltage of the capacitor is in the range from 10 V to 100 V). At CB = 50,000 @ the characteristic time of charging, T = CBX Rps, varies from 1.5 sec. to 15 sec. In this case, for an initially discharged capacitor to be charged to 95% of the set voltage, the time of charging should exceed 3r. This means that the charging time should be more than 4.5 to 45 sec., which is far greater than 4 seconds per MILPRF-55365. Maintaining the 4-second charging time in this case would significantly reduce the effective voltage and result in inadequate testing of the parts.
The necessity to maintain the rated voltage within f5% limits during the testing by using large enough energy storage capacitors, instead of setting the minimal value of CB, should be explicitly stated in the standard for the surge current testing.
V.5. Charging time.
MIL-PRF-55365 requires the charging time, T= = 4 seconds. As was shown above, in some cases this time might not be enough to Mly charge the bank capacitor. Instead of setting a fixed charging time, it would be more reasonable to require that the charging time is sufficient enough to charge capacitor CB to at least 95% of the nominal voltage. In the case when CB is initially discharged, the following charging time is required:
zc > 3 x C B x R , (18)
For the test circuit shown in Figure 5, much less time to restore the voltage on CB might be necessary for cycles following the first one because normally, when no failure occurs, only a small portion of the charge will be lost. However, in cases when discharging of the capacitor under test occurs along with discharging of the bank capacitor, violation of condition (18) would decrease the effective voltage at which the test is performed.
Note that if the compliance current of the voltage power supply is set to a relatively low value, Icomp VdRps, the current will not depend on Rps and the necessary charging time should exceed zcc =
CxVdIcomp In this case, a use of Eq. (1 8) might result in a substantial decrease of the effective voltage during the test.
V. 6. Discharging time.
The discharging time, Td, should be great enough to assure that the tantalum capacitor is discharged sufficiently (to 1 % of the rated voltage), so that the next current surge would be applied to a fully
12
discharged capacitor and would be identical to the previous one. The discharge rate depends on the value of the resistor, &, used in the discharge path, and to assure that in a circuit shown in Figure 5 the voltage has dropped to 1% of the initial value, the necessary time can be calculated as:
zd 2 4.6 x C x (Rd + R,) (19)
Even at rather large values of & of - 10 ohm, Td is far below the required 4 seconds for capacitors up to 10,000 pF. Based on electrical conditions, even Td = 1 second would satisfy most practical cases.
Another reason, which might limit the minimum discharging time, is heating of the part during the consequent surge pulses. In the worst case (for overheating), when the value of discharge resistance & can be neglected compared to &, the same energy will be dissipated during the discharge portion of the cycle as during the charge portion. In this case the power dissipated during surge current testing at a frequency f can be calculated using the following simple equation:
P = 2 x Q x f = a x C x V 2 x f , (20)
Assuming that the capacitor has temperature resistance ft, the temperature increase can be calculated as:
This equation allows for estimation of the maximum frequency of testing, which would increase the temperature below the acceptable level of AT,:
According to Salisbury [23], the thermal resistance of tantalum capacitors in free air conditions varies from 185 to 236 "C/W. Based on these data and assuming AT, = 1 "C, Figure 14 shows results of calculations of
fmm for surge testing in the case, when R, = 0.6 Ohm and CL = 0.14, at two voltage conditions of 10 V and 50 V. It is seen that at relatively low voltages (10 V and below) the frequency of testing required per ME PRF- 55365 (118 Hz) complies with the requirements Eq. (22) for most practical cases, up to 1,000 pF. However, for high-capacitance high-voltage parts, overheating is possible and testing at frequencies below 0.125 Hz might be necessary.
Similar analysis was used by Reed [24] to estimate thermal effects of high ripple and/or surge currents in tantalum capacitors. He found strong agreement between the model and experimental data, when the temperature of 10 pFl35 V capacitors was raised to -
85 "C only at a relatively high (140 A) surge current pulses and frequency of cycling of 93 Hz. Our experiments with 15 pF150 V capacitors during surge current testing at a frequency of 1 Hz with &, - 170 A showed that the temperature increase did not exceed 1 "C, which is in agreement with results of calculations shown in Figure 14.
Figure 14. Comparison of maximum frequency of surge current testing and ME standard requirements
(black dashed line).
Based on Eq. (22) and assuming AT, = 1 "C, a condition for the necessary discharge time can be obtained
zd > C X ~ C X V ~ X R , - T , (23)
Considering also the requirement to discharge the capacitor to 1% of the rated voltage, it is reasonable to demand that the duration of discharge cycle should be 1 second or per Eq. (23), whichever is larger.
V. 7. Number of surge cycles.
The number of cycles during surge current testing of tantalum capacitors should be sufficient to screen-out potentially defective parts and thus eliminate infant mortality failures in operation. Typically, failures during surge current testing occur during the first one to three cycles only [24, 251 and additional surge cycles do not cause failures. In this case three cycles should have been sufficient for screening. Increasing the number of cycles to 10 and, considering measurements at -55 "C and +85 "Cy to 30 cycles total, might seem harmless if surge current cycling does not consume resources of the part.
This last condition, that is not to cause potential damage to the part, is the major requirement for any screening procedure and should be proven and verified by large-scale testing and convincing statistics. Our
13

experience with multiple surge current testing, although limited, shows that when the stress voltage is close to the surge breakdown voltage (the voltage at which the part would fail at the first cycle, VBR) a substantial portion of samples might fail after more than 5 cycles. This indicates the possibility of wear- out degradation caused by surge testing at stress voltages close to VBR. Preliminary results suggest that the number of cycles to failure, Nf, might be a steep function of the ratio of the applied and breakdown voltages:
where the exponent n has a relatively large value, probably from 8 to 12. In this case at VNBR = 0.3, which is typical for n o m 1 parts, Nf varies from 2x10⁴ to 2x10⁶. In this case no resource will be consumed during screening. However, for "weak" parts with VNBR = 0.8, the number of cycles-to-failure is relatively small (from 6 to 15) and failures can be observed already after a few cycles.
Obviously, additional experiments and analysis are necessary to verify the validity of Eq. (24), but it the meantime, to avoid possible decreasing of the capability of parts to withstand surge current stresses in applications, it would be reasonable to limit the number of cycles during screening to three. Additional and important information about the stability of tantalum capacitors toward surge currents can be obtained by a surge step stress testing (SSST) [26], which might be a valuable addition to qualification testing of tantalum capacitors. However, a standard procedure for this testing has yet to be developed.
VI. Conclusions.
Inductance of tantalum capacitors, ESL, and especially elements of the circuit used for surge current testing, L,, might significantly affect the shape and amplitude of the current and voltage transients. Voltage overshooting up to 100% of the rated voltage might occur at large enough values of L,, causing failures due to breakdown of tantalum pentoxide dielectric.
Inductance of the circuit should be limited to avoid overshooting, reduce variations of the current spike shape, and assure reproducible results of the testing. The condition per Eq. (14) can be used to estimate maximum acceptable inductance for a given capacitor and test conditions.
According to the existing specifications only maximum value of the resistance of the circuit is
limited. This might result in unacceptably high variations of the portion of energy dissipated in the capacitor in different set-ups used for the testing. To make test results more reproducible and to relax requirements for inductance of the circuit, it is reasonable to tighten the limits for the resistance to the range from 0.5 to 1 Ohm. The value of R, should be estimated using a surge current oscillogram and reported together with the results of surge current testing for reference purposes.
The reproducibility of transients in three surge current test set-ups with different types of switching devices, a mechanical relay, a mercury relay, and a power FET, have been evaluated. Both mechanical devices exhibited contact bouncing, and the best reproducibility of current transients was achieved with power FETs.
The requirements for the energy storage bank capacitor, duration of chargeldischarge cycles, and the number of stress cycles are discussed. Simple equations are suggested to estimate the necessary CB, T,, and Td values to maintain adequate and reproducible conditions of the testing.
VII. Acknowledgments This work was sponsored by the Goddard Space
Flight Center Projects and NASA Electronic Parts and Packaging (NEPP) program. The author is thankful to Darryl Lakins, the head of code 562, and Michel Sampson, NEPP program manager, who recognized the need of this investigation, to Erick Reed (JPL) for inspiring discussions, and to Jeanne Beatty and Hang Ngin for editing the manuscript and assistance with testing.
VIII. References.
J. Gill, "Surge in solid tantalum capacitors", AVX technical information, 1994. http://www.avxcorp.com/docs/techinfo/surgtant.pd f D. Mattingly, "Increasing reliability of SMD tantalum capacitors in low impedance applications", AVX technical information, 1995. http://www.avxcorp.com/docs/techinfo/tantimp.pd f E.K. Reed and J.L. Paulsen, "Impact of circuit resistance on the breakdown voltage of tantalum chip capacitors", in Proceedings of the CARTS,
T. Zednicek and J. Gill, "Voltage derating rules for solid tantalum and niobium capacitors", in Proceedings of the CARTS EUROPE 2003,2003,
2001, pp. 150-156.
14
5.
6.
7.
8.
9.
J.D.Prymak, "Performance issues for polymer cathodes in A1 and Ta capacitors", in Proceedings of the CARTS USA 2001,2001, pp. 25-34. "EEE-LNST-002: Instructions for EEE parts selection, screening, qualification, and derating", NASA, Goddard Space Flight Center, 2003. R.W. Franklin, "Surge current testing of resin dipped tantalum capacitors", AVX technical information. http://www.avxcorp.com/docs/techinfo/dipd f H.W. Holland, "Effect of high current transients on solid tantalum capacitors", KEh4ET Engineering bulletin, 1996(9). J.P. Stroud, "Equivalent series resistance-the fourth parameter for tantalum capacitors", in Proceedings of the 40th Electronic Components and Technology Conference, 1990., 1990,
10. Kemet, TANi%LuMCHZP CAPACZTORS. 2005. 1 1. G. Ewe11 and B. Stevenson, "A capacitor's
inductance", in Proceedings of the 19th Capacitors and Resistors Technology Symposium, 1999,March 15-19, New Orleans, LA, pp. 186- 202.
12. A.G. Martin and R.K. Keenan, Ymproved noise suppression via multilayer ceramic capacitors (MLCs) in power-entry decoupling", AVX technical information. httu://www.avxcorp.com/docs/techinfo/supvmk.p df
andlor filtering", AVX technical information. ht&x/lwww.avxcorp.com/docs/tech info/Deseries.pd f
14. B. Smith, "Inductance measurements for multi- terminal devices", AVX technical information. http://www.avxcom.com/docs/tecliinfo/immtd.pdf
15. J. Galvagni, "Low inductance capacitors for digital circuits", AVX technical information. http://www.avxcorp.com/docs/techinfo/supvmlc.D df
16. E Derksen, P.V. Oppen, and G.Stollman, "How to select your optimal multilayer ceramic capacitor in competition with tantalum capacitor", in Proceedings of the 17th Capacitors and Resistors Technology Symposium, 1997,March 24-27, Jupiter, FL, pp. 204-21 1.
17. A.G. Martin, "Decoupling: basics", AVX technical information. http://www.avxcorp.com/docs/techinfo/dcplbsc.pd f
18. g. Harayda, A. Omi, and A. Yamamoto, Ymprove Your Designs with Large Capacitance Value Multi-Layer Ceramic Chip ( MLCC ) Capacitors", Panasonic Publication # PG33.08/10/04,2004.
13. KD. Prymak, "PE series capacitors decoupling
19. J.D. Prymak, "New tantalum capacitors in power supply applications", in Proceedings of the The 1998 E E E Industry Applications Conference, 1998. Thirty-Third IAS Annual Meeting.,
20. C.R. Sullivan and A.M. Kern, "Capacitors with fast current switching require distributed models", in Proceedings of the 32nd AnnualPower Electronics Specialists Conference. PESC 2001, 2001,17-21 June 2001, pp. 1497 - 1503.
21. F.W. Grover, Inductance calculations. 1946, NY: D.Van Nostrand Company, Inc. 286.
22. D.K. Mccleery, Introduction to transients. 1961, New York: John Wiley & sons, Inc. 23 1.
23. I. Salisbury, "Thermal management of surface mounted tantalum capacitors", AVX technical information. httd/m.avxcorp.com/docs/techin fo/dip ptant. pd f
24. E.K. Reed, "Tantalum chip capacitor reliability in high surge and ripple current applications", in Proceedings of the Electronic Components and Technology Conference, 1994. Proceedings., 44th, 1994,l-4 May 1994, pp. 861-868.
25. J.D. Moynihan and A.M. Holladay, "Effectiveness of surge current screening of solid tantalum capacitors", in Proceedings of the CARTS 1983, 1983,March 8 - 10 1983, Phoenix AZ, pp. 53-60.
testing of tantalum capacitors", in Proceedings of the 21st Capacitors and Resistors Technology Symposium, CARTS'01,2001, pp. 181-187.
1998,12-15 Oct., pp. 1129 - 1137.
26. J. Marshall and J. Primak, "Surge step stress
15