
The lack of aspirin resistance in patients with coronary ...

EFFECT OF HIGH CORONARY CALCIUM SCORE ON THE ASSESSMENT OF
CORONARY ARTERY DISEASE USING CORONARY COMPUTED
TOMOGRAPHY ANGIOGRAPHY: AN INVESTIGATION OF
THE CLINICAL VALUE OF 3D VIRTUAL
INTRAVASCULAR ENDOSCOPY
DR WOO SZE YANG
MASTER OF RADIOLOGY
UNIVERSITY OF MALAYA
2013 – 2017
EFFECT OF HIGH CORONARY CALCIUM SCORE ON THE ASSESSMENT OF
CORONARY ARTERY DISEASE USING CORONARY COMPUTED
TOMOGRAPHY ANGIOGRAPHY: AN INVESTIGATION OF
THE CLINICAL VALUE OF 3D VIRTUAL
INTRAVASCULAR ENDOSCOPY
By
DR WOO SZE YANG
M.B.B.S.
INTERNATIONAL MEDICAL UNIVERSITY (IMU)
2008
Submitted to the Department of Biomedical Imaging
Faculty of Medicine, University of Malaya
in partial fulfilment of
the requirement for
the Degree of
MASTER OF RADIOLOGY
Year 2017

TABLE OF CONTENTS PAGES
DISCLAIMER ......................................................................................................................... I
ACKNOWLEDGEMENT ...................................................................................................... II
ABSTRACT ........................................................................................................................... III
LIST OF TABLES .................................................................................................................. V
LIST OF FIGURES ............................................................................................................. VII
ABBREVIATIONS AND ACRONYMS ..............................................................................IX
CHAPTER ONE ...................................................................................................................... 1
1.0 INTRODUCTION .......................................................................................................... 1
CHAPTER TWO ..................................................................................................................... 4
2.0 OBJECTIVES ................................................................................................................ 4 2.1 GENERAL OBJECTIVE ............................................................................................. 4 2.2 SPECIFIC OBJECTIVES ............................................................................................ 4
CHAPTER THREE ................................................................................................................. 5
3.0 LITERATURE REVIEW .............................................................................................. 5 3.1 ANATOMY AND PHYSIOLOGY OF THE HEART ................................................ 5 3.2 CORONARY ARTERY DISEASE ........................................................................... 19 3.3 IMAGING MODALITIES ........................................................................................ 26
CHAPTER FOUR .................................................................................................................. 37
4.0 METHODOLOGY ....................................................................................................... 37 4.1 STUDY DESIGN ....................................................................................................... 37 4.2 PATIENT SELECTION AND FOLLOW UP ........................................................... 37 4.3 CCTA IMAGING TECHNIQUE .............................................................................. 41 4.4 CCTA DATA EVALUATION .................................................................................. 42 4.5 VIRTUAL INTRAVASCULAR ENDOSCOPY (VIE) DATA EVALUATION ..... 44
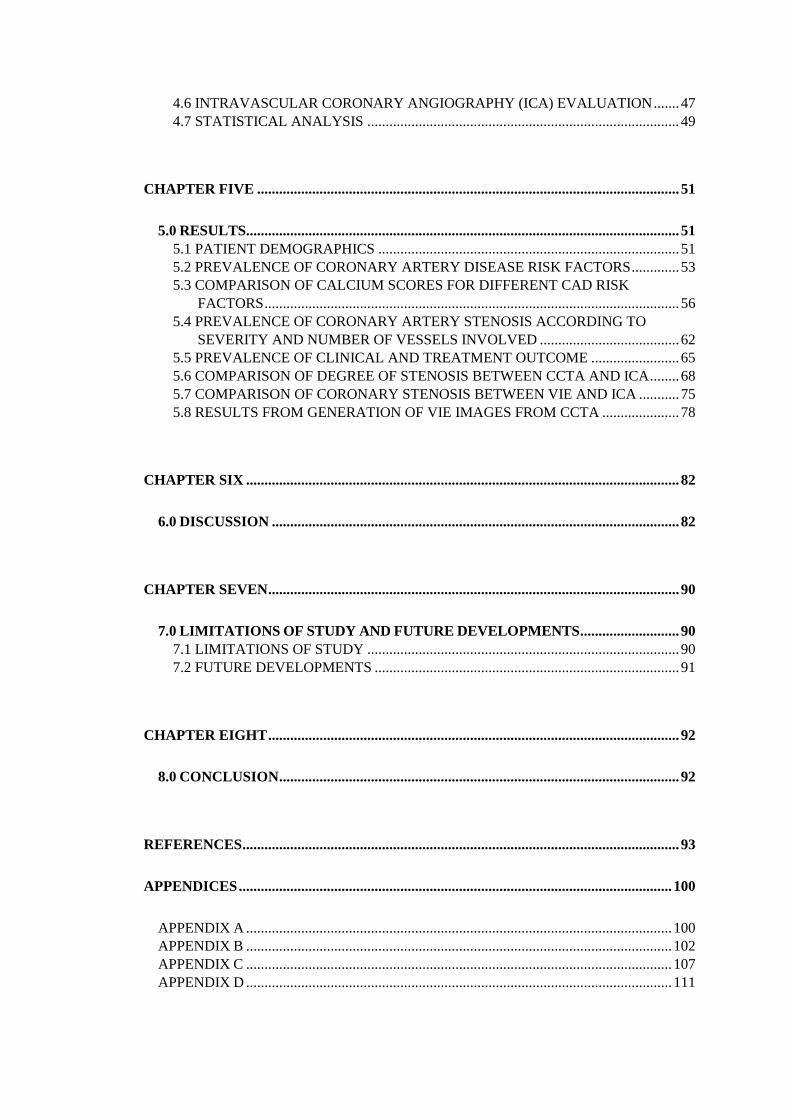
4.6 INTRAVASCULAR CORONARY ANGIOGRAPHY (ICA) EVALUATION ....... 47 4.7 STATISTICAL ANALYSIS ..................................................................................... 49
CHAPTER FIVE ................................................................................................................... 51
5.0 RESULTS...................................................................................................................... 51 5.1 PATIENT DEMOGRAPHICS .................................................................................. 51 5.2 PREVALENCE OF CORONARY ARTERY DISEASE RISK FACTORS ............. 53 5.3 COMPARISON OF CALCIUM SCORES FOR DIFFERENT CAD RISK
FACTORS ................................................................................................................. 56 5.4 PREVALENCE OF CORONARY ARTERY STENOSIS ACCORDING TO
SEVERITY AND NUMBER OF VESSELS INVOLVED ...................................... 62 5.5 PREVALENCE OF CLINICAL AND TREATMENT OUTCOME ........................ 65 5.6 COMPARISON OF DEGREE OF STENOSIS BETWEEN CCTA AND ICA ........ 68 5.7 COMPARISON OF CORONARY STENOSIS BETWEEN VIE AND ICA ........... 75 5.8 RESULTS FROM GENERATION OF VIE IMAGES FROM CCTA ..................... 78
CHAPTER SIX ...................................................................................................................... 82
6.0 DISCUSSION ............................................................................................................... 82
CHAPTER SEVEN ................................................................................................................ 90
7.0 LIMITATIONS OF STUDY AND FUTURE DEVELOPMENTS ........................... 90 7.1 LIMITATIONS OF STUDY ..................................................................................... 90 7.2 FUTURE DEVELOPMENTS ................................................................................... 91
CHAPTER EIGHT ................................................................................................................ 92
8.0 CONCLUSION ............................................................................................................. 92
REFERENCES ....................................................................................................................... 93
APPENDICES ...................................................................................................................... 100
APPENDIX A .................................................................................................................... 100 APPENDIX B .................................................................................................................... 102 APPENDIX C .................................................................................................................... 107 APPENDIX D .................................................................................................................... 111

I
DISCLAIMER
I declare that this dissertation records the result of the study performed by me and that it is of
my own composition.
……………………………………
DR. WOO SZE YANG
Date: 28th February 2017.

II
ACKNOWLEDGEMENT
I would like to express my thanks and appreciation to my thesis supervisor Professor Dr Yang
Faridah Abdul Aziz and Professor Dr Ng Kwan Hoong for the continuous support throughout
my Master of Radiology study as well as providing their extensive knowledge and guidance
in successfully completing my thesis. Without their enthusiasm, encouragement, support and
optimism this thesis would not have been completed.
My sincere gratitude to Professor Sun Zhong Hua (Professor of Medical Imaging, Curtin
University, Australia) and Dr Nor Ashikin Md Sari (Cardiologist, Department of Medicine,
University of Malaya, Malaysia). Their guidance in their respective field have helped me
immensely in providing insight and steered me to the right direction whenever I needed it.
I also want to express my warmest gratitude to Dr Yeong Chai Hong who has made available
her support especially during the crucial times. With her committed participation and input,
my thesis and data analysis have been successfully conducted. Special appreciation is also
directed to the UMRIC members for their assistance in completing my thesis.
Finally, I am thankful to my family especially to my beloved wife, Dr Rachel Wong Su Gwen
for her continuous guidance, help and love throughout my course of my Master of Radiology
study and in completing my thesis. I am forever indebted to my parents for giving me the
opportunities and experiences that have shaped me who I am today. This journey would not
have been possible if not for them.

III
ABSTRACT
Objectives:
The objective of the study is to investigate the relationship between a high calcium score of >
400 and the diagnostic capability of coronary computed tomography angiography (CCTA) in
comparison with the conventional invasive coronary angiogram. Secondary objectives are to
investigate the diagnostic value of 3D virtual intravascular endoscopy (VIE) in patients with
high calcium score with regards to the coronary wall changes from coronary plaques and
assessment of coronary lumen stenosis.
Method:
Over a period of 3 years and 6 months, 103 patients underwent coronary calcium score and
CCTA. A questionnaire regarding associated cardiac risk factors and clinical outcome was
provided to each patient and demographic data was collected. A total of 35 patients
subsequently underwent invasive coronary angiography (ICA) for further evaluation and
management. Out of these patients whom underwent ICA, coronary 3D VIE reconstruction
and evaluation was done for 14 patients. Three main coronary artery branches were assessed
for coronary artery stenosis. Degree of coronary artery stenosis was measured and comparison
was made between CCTA with ICA as the gold standard. Subsequently, comparison was also
made between VIE and ICA for the assessment of coronary artery stenosis. Reconstruction
and analysis of VIE images were done in Australia by an experienced professor in medical
imaging. Subsequently statistical analysis comparing the coronary artery stenosis for CCTA,
VIE and ICA were done.
IV
Results:
There was reduced sensitivity of CCTA compared to ICA in determining distal left
circumflex artery stenosis at 50.0%; however the accuracy is significantly high at 84.0%. The
overall sensitivity, specificity and accuracy in the rest of the coronary vessels were not
significantly reduced in this group of patients with high calcium score ranging from 62.5% -
100.0%, 54.2% - 91.7% and 61.8% - 87.5% respectively. Specificity of VIE in determining
LAD artery stenosis was significantly low at 20%, however the sensitivity and accuracy were
high at 100% and 92.3% respectively (p = 0.125). The sensitivity, specificity and accuracy for
the left circumflex artery (p = 1.000) and right coronary artery (p = 1.000) were not
significantly reduced. Additional information of the coronary wall changes can be obtained
via VIE based on the composition of coronary plaques. A smooth intraluminal appearance on
VIE is usually observed for a simple calcified or non-calcified plaque. However, irregular
intraluminal appearance is seen in heavily calcified or mixed calcified and non-calcified
plaques.
Conclusion:
A high calcium score of > 400 does not significantly reduced the accuracy, sensitivity and
specificity of CCTA; however, it decreases the sensitivity of detecting significant stenosis at
the distal left circumflex artery. VIE images clearly demonstrate the coronary wall changes
with significant accuracy and sensitivity in determining significant coronary artery stenosis.
Therefore, VIE could be used as a complementary tool to CCTA for coronary artery analysis.
Keywords:
3D Virtual intravascular endoscopy, coronary artery stenosis, coronary CT angiogram,
coronary wall changes, high calcium score, invasive coronary angiography.
V
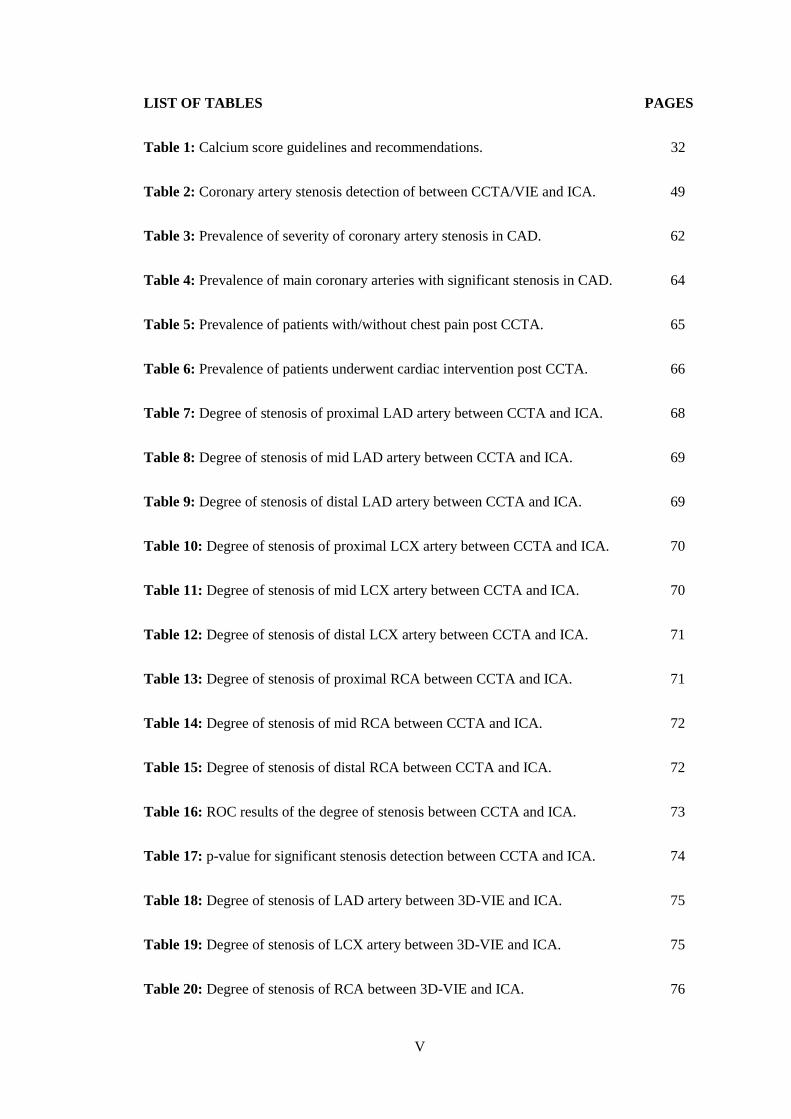
LIST OF TABLES PAGES
Table 1: Calcium score guidelines and recommendations. 32
Table 2: Coronary artery stenosis detection of between CCTA/VIE and ICA. 49
Table 3: Prevalence of severity of coronary artery stenosis in CAD. 62
Table 4: Prevalence of main coronary arteries with significant stenosis in CAD. 64
Table 5: Prevalence of patients with/without chest pain post CCTA. 65
Table 6: Prevalence of patients underwent cardiac intervention post CCTA. 66
Table 7: Degree of stenosis of proximal LAD artery between CCTA and ICA. 68
Table 8: Degree of stenosis of mid LAD artery between CCTA and ICA. 69
Table 9: Degree of stenosis of distal LAD artery between CCTA and ICA. 69
Table 10: Degree of stenosis of proximal LCX artery between CCTA and ICA. 70
Table 11: Degree of stenosis of mid LCX artery between CCTA and ICA. 70
Table 12: Degree of stenosis of distal LCX artery between CCTA and ICA. 71
Table 13: Degree of stenosis of proximal RCA between CCTA and ICA. 71
Table 14: Degree of stenosis of mid RCA between CCTA and ICA. 72
Table 15: Degree of stenosis of distal RCA between CCTA and ICA. 72
Table 16: ROC results of the degree of stenosis between CCTA and ICA. 73
Table 17: p-value for significant stenosis detection between CCTA and ICA. 74
Table 18: Degree of stenosis of LAD artery between 3D-VIE and ICA. 75
Table 19: Degree of stenosis of LCX artery between 3D-VIE and ICA. 75
Table 20: Degree of stenosis of RCA between 3D-VIE and ICA. 76

VI
LIST OF TABLES PAGES
Table 21: ROC results of the degree of stenosis between VIE and ICA. 76
Table 22: p-value for significant stenosis detection between VIE and ICA. 77
VII
LIST OF FIGURES PAGES
Figure 1: Anatomy and location of the heart. 7
Figure 2: Anatomy of the heart. 9
Figure 3: Chambers and circulation of the heart. 10
Figure 4: Coronary vessels from the anterior and posterior heart views. 15
Figure 5: The cardiac conduction system. 18
Figure 6: Cardiac enzymes. 25
Figure 7: Flow chart of data collection and analysis. 40
Figure 8: Recommended quantitative grading of coronary artery stenosis by CCTA. 44
Figure 9: Coronary VIE views of the left main stem, LAD and LCX arteries. 45
Figure 10: Coronary VIE view of the RCA. 46
Figure 11: Recommended quantitative grading of coronary artery stenosis by ICA. 48
Figure 12: Age distribution of patients in the study. 52
Figure 13: Ethnicity distribution of patients in the study. 52
Figure 14: Sex distribution of patients in the study. 53
Figure 15: Prevalence of CAD risk factors. 54
Figure 16: Prevalence of CAD risk factors according to sex. 55
Figure 17: Box plot showing comparison of calcium score with history of smoking. 56
Figure 18: Box plot showing comparison of calcium score with diabetes mellitus. 57
Figure 19: Box plot showing comparison of calcium score with dyslipidaemia. 58
Figure 20: Box plot showing comparison of calcium score with hypertension. 59

VIII
LIST OF FIGURES PAGES
Figure 21: Box plot showing comparison of calcium score with history of stroke. 60
Figure 22: Box plot showing comparison of calcium score with family history of CAD. 61
Figure 23: Prevalence of severity of coronary artery stenosis in CAD. 63
Figure 24: Prevalence of main coronary arteries with significant stenosis in CAD. 64
Figure 25: Prevalence of patients with/without chest pain with CAD. 67
Figure 26: Prevalence of patients with/without chest pain underwent cardiac intervention. 67
Figure 27: Coronary VIE views of LAD artery plaque with smooth luminal appearance. 79
Figure 28: Coronary VIE views of LCX artery plaque with smooth luminal appearance. 79
Figure 29: Coronary VIE views of RCA plaque with smooth luminal appearance. 80
Figure 30: Coronary VIE views of LAD artery plaque with irregular luminal appearance. 80
Figure 31: Coronary VIE views of LCX artery plaque with irregular luminal appearance. 81
Figure 32: Coronary VIE views of RCA plaque with irregular luminal appearance. 81
Figure 33: CCTA and VIE views of a calcified plaque at the LAD artery. 87
Figure 34: CCTA and VIE views of extensively calcified plaques at the LAD artery. 88
Figure 35: CCTA and VIE views of mixed plaques at the LAD artery. 88

IX
ABBREVIATIONS AND ACRONYMS
2D 2 Dimensions
3D 3 Dimensions
3D VIE 3 Dimension Virtual Intravascular Endoscopy
ACS Acute coronary syndrome
AV node Atrioventricular node
CABG Coronary artery bypasses graft
CAC Coronary artery calcium
CAD Coronary artery disease
CCTA Coronary computed tomography angiography
CK Creatinine kinase
CT Computed tomography
DICOM Digital imaging and communications in medicine
EBCT Electron-beam computed tomography
ECG Electrocardiography
FRS Framingham Risk Score
GRACE Global Registry of Acute Coronary Events
GTN Glyceryl trinitrate
HDL High-density lipoprotein
ICA Invasive coronary angiography

X
LAD artery Left anterior descending artery
LBBB Left bundle branch block
LCX artery Left circumflex coronary artery
LDL Low-density lipoprotein
MDCT Multidetector computed tomography
mGy miliGray
MI Myocardial infarction
MIP Maximum intensity projection
MPR Multiplanar reconstruction
MRI Magnetic resonance imaging
NSTEMI Non-ST elevation myocardial infarction
PET Positron emission tomography
RCA Right coronary artery
ROC Receiver operating characteristic
SA node Sinoatrial node
SPECT Single-photon emission computed tomography
SPSS Statistical Package for Social Sciences
STEMI ST elevation myocardial infarction
UA Unstable angina
WHO World Health Organization
1
CHAPTER ONE
1.0 INTRODUCTION
Coronary artery disease (CAD) is a known cause of mortality and morbidity with the disease
reaching endemic proportions (1). It is the most important cause of death in Malaysia with the
mortality rate of 20-25% in public hospitals (2). The gold standard investigative diagnosis for
CAD is invasive coronary angiography (ICA) as it provides an assessment of the coronary
anatomy as well as the degree of luminal stenosis. However, the limitation of coronary
angiography is that it is an invasive procedure with a potential for complications such as peri-
procedural myocardial infarction (0.1%) and stroke (0.2-0.4%) (3). Furthermore, it only offers
a two dimensional visualization of the coronary lumen and is unable to demonstrate the
atherosclerotic changes within the vessel wall which is important when correlating with the
clinical outcome (4).
Due to technological advances in computed tomography (CT) scanner over the recent years,
coronary computed tomographic angiography (CCTA) has emerged as a less invasive
imaging modality for coronary artery assessment with high sensitivity and negative predictive
value in determining the site and degree of coronary artery luminal stenosis (5-7). In addition,
CCTA enables visualization and quantitative assessment of atherosclerotic plaques thus
assisting in characterization of the different types of plaque (7). As CCTA rapidly expands,
this technique will be utilized in predicting patients with high risk of cardiac events and in
assisting in the management of patients based on the morphological features of plaques and
coronary luminal stenosis (6).

2
Despite the very high negative predictive value of CCTA, the diagnostic accuracy of CCTA is
limited by extensive coronary artery calcification when present (taken as coronary calcium
score >400), resulting in blooming artefacts. These blooming artefacts will cause the calcified
lesions to appear larger in size and leading to a perceived narrower coronary lumen (7).
However, it still remains a controversy that a high calcium score should be regarded as a
limiting factor on whether a patient warrants a CCTA scan. The main impact of a high
calcium score on the diagnostic capability of CCTA is due to overestimation of coronary
luminal stenosis which results in a high false positive finding. Multiple studies have
concluded that there is a significant reduction in specificity in patients with a high calcium
score >400 as compared to other patients with calcium score <400 (8). Alternatively, Chen et
al. (9) found that the overall diagnostic accuracy for a coronary artery assessment in a patient
with a high calcium score was not drastically impaired with no significant difference in
sensitivity. The main objective of this study is to determine the diagnostic capability of CCTA
and to correlate the clinical outcomes of these patients with high calcium scores.
The CCTA offers 2D axial and multiplanar reformatted images for the assessment of the
coronary plaques. However, it still lacks the direct visualization of the coronary artery lumen
of plaques (if present) that is afforded by ICA. This limitation can be overcome by using a
reconstruction tool known as 3D virtual intravascular endoscopy (3D VIE) which is purported
to be able to provide a more extensive diagnostic evaluation of the coronary tree (6). With this
imaging tool, a more accurate assessment can be done with regards to the plaque location in
relation to the coronary ostium, plaque composition and coronary wall stenosis due to the
presence of plaque within the coronary artery. Identification of intraluminal appearances of
calcified plaques is considered to allow more accurate assessment of coronary stenosis by
detecting superficial and deep calcified plaques (7). This study will also investigate the
feasibility of using 3D VIE as a supplementary tool to CCTA and determine the accuracy of
assessing coronary lumen stenosis in patients with high calcium score.

3
Since CCTA is continuously evolving, hopefully in the near future this technique will become
a mainstay in CT scanning and be used as risk stratification for patients developing cardiac
events, based on the plaque morphology and associated coronary lumen changes (6).
4
CHAPTER TWO
2.0 OBJECTIVES
2.1 GENERAL OBJECTIVE
To evaluate the diagnostic values of CCTA for the assessment of coronary artery disease in
patients with high calcium score in comparison with the conventional invasive coronary
angiogram.
2.2 SPECIFIC OBJECTIVES
a) To investigate the diagnostic value of 3D VIE in the visualisation of coronary wall
changes due to the effect of coronary plaques in high CAC scores
b) To correlate 3D VIE findings with conventional 2D and 3D visualisations in terms of
the degree of coronary lumen stenosis or occlusion caused by high CAC scores
c) To explore the potential role of 3D VIE as a supplementary tool to conventional
coronary CT angiography in improving diagnostic evaluation of patients with high
CAC scores
d) To investigate the relationship between the CCTA and the clinical outcome of these
patients with high CAC scores
5
CHAPTER THREE
3.0 LITERATURE REVIEW
3.1 ANATOMY AND PHYSIOLOGY OF THE HEART
3.1.1 Anatomy of the heart
The heart is one of the most important organs in the human body. Heart is shaped almost
similar to a pyramid, wide superiorly and tapering towards the apex. Size of a heart is
approximately that of a closed fist. The weight of an average heart is between 7 and 15
ounces (200 to 425 grams), depending on the size of the human host.
The normal rate of contraction of the heart ranges from 50-90 beats per minute. Given the
average rate of contraction of 75 beats per minute, a human heart expand and contract about
108,000 times in one day, more than 39 million times in one year and nearly 3 billion times
during an average 75 year lifespan. This equates to approximately 70 ml of blood per
contraction in a resting adult in each of the heart chamber. That in turn would be equal to
5.25 litres of blood per minute and approximately 14,000 litres per day and 10,000,000
litres over a year.
The main function of the heart is that of the body’s circulatory pump. The heart consists of
the right and left atrium and right and left ventricle. In summary, the right atrium accepts
deoxygenated blood via the veins, flows to the right ventricle and delivers to the lungs for
oxygenation. The oxygenated blood is then returned to the left atrium which subsequently

6
flows to the left ventricle before pumping it into the various arteries to deliver the oxygen and
nutrition to the entire body.
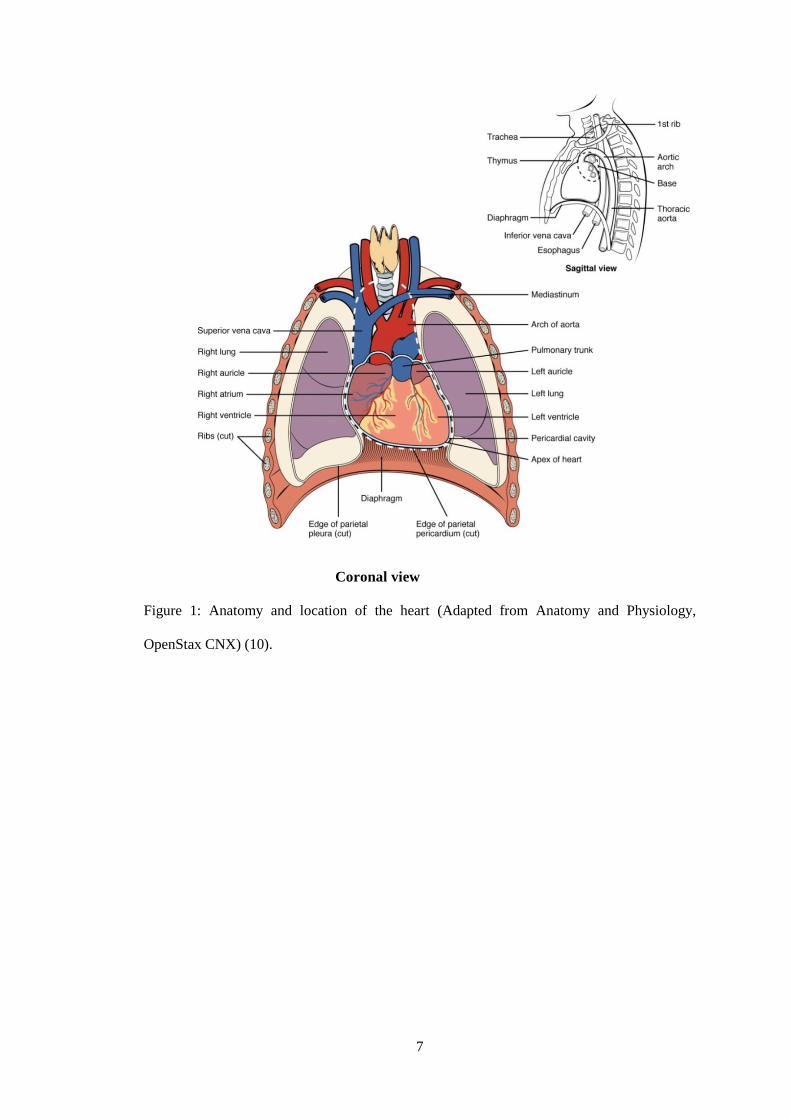
3.1.2 Location of the heart
The heart is located in the middle of the thoracic cavity known as the middle mediastinum.
It lies obliquely in between the right and left lungs. The oblique nature of the heart causes
the ventricles to locate antero-inferiorly to the atria. As the heart is rotated clockwise about its
axis, the right atrium and ventricle is higher than the left atrium and ventricle.
The base or posterior aspect of the heart is formed by the left atrium while the anterior
aspect is formed by the right ventricle. Right border of the heart is formed by the right
atrium while the left border and apex is formed by the left ventricle. Inferior aspect of the
heart is formed by both ventricles anteriorly and right atrium posteriorly. The posterior
aspect of the heart is in close approximation to the thoracic vertebral bodies while the
anterior aspect of the heart is located just behind the sternum and costal cartilages. Figure 1
shows the anatomy and location of the heart within the thoracic cavity.
7
Coronal view
Figure 1: Anatomy and location of the heart (Adapted from Anatomy and Physiology,
OpenStax CNX) (10).

8
3.1.3 Heart chambers
The heart is divided into the left and right heart which contains two main chambers in each
side. There are one atrial and one ventricular chamber in each side. The upper chambers
which consists of the right and left atrium serves as a receiving chamber for blood and
contracts to divert the blood to the lower chambers which are the right and left ventricles. The
ventricles function as the main pumping mechanism to supply blood to the lungs via the right
ventricle and rest of via the left ventricle.
The right atrium receives blood that returns from the systemic circulation via two major
systemic veins, the superior and inferior vena cava as well as the coronary sinus. The superior
vena cava empties into the superior and posterior surface of the right atrium while the inferior
vena cava also empties into the posterior surface of the atrium, but inferior to the opening of
the superior vena cava. The opening of the coronary sinus is located superior and medial to
the opening of the inferior vena cava on the posterior surface of the atrium. Function of the
coronary sinus is to return systemic blood from the heart. The atrium receives continuous
venous flow and pump blood into the right ventricle prior to ventricular contraction. The
blood flow between the right atrium and ventricle is controlled by the tricuspid valve.
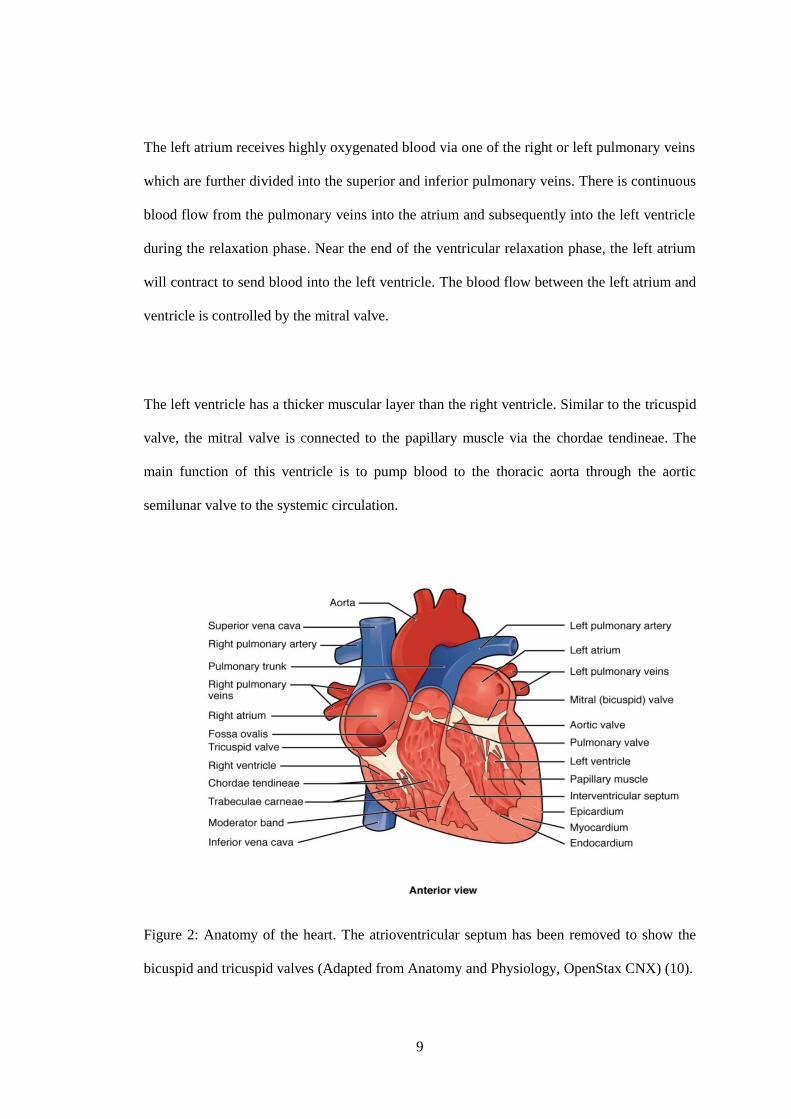
The right ventricle receives blood during contraction of the right atrium through the tricuspid
valve. When the right ventricle is filled with blood and begins to contracts, there is increased
in intraventricular pressure. To prevent backflow of blood into the right atrium, the papillary
muscles also contract causing tension to the chordae tendineae which holds the closed valve
in place. Therefore, blood flows towards the pulmonary trunk through the patent pulmonary
semilunar valve at the base of the pulmonary trunk into the pulmonary circulation. Figure 2
shows papillary muscles and chordae tendineae attached to the tricuspid valve.
9
The left atrium receives highly oxygenated blood via one of the right or left pulmonary veins
which are further divided into the superior and inferior pulmonary veins. There is continuous
blood flow from the pulmonary veins into the atrium and subsequently into the left ventricle
during the relaxation phase. Near the end of the ventricular relaxation phase, the left atrium
will contract to send blood into the left ventricle. The blood flow between the left atrium and
ventricle is controlled by the mitral valve.
The left ventricle has a thicker muscular layer than the right ventricle. Similar to the tricuspid
valve, the mitral valve is connected to the papillary muscle via the chordae tendineae. The
main function of this ventricle is to pump blood to the thoracic aorta through the aortic
semilunar valve to the systemic circulation.
Figure 2: Anatomy of the heart. The atrioventricular septum has been removed to show the
bicuspid and tricuspid valves (Adapted from Anatomy and Physiology, OpenStax CNX) (10).
10
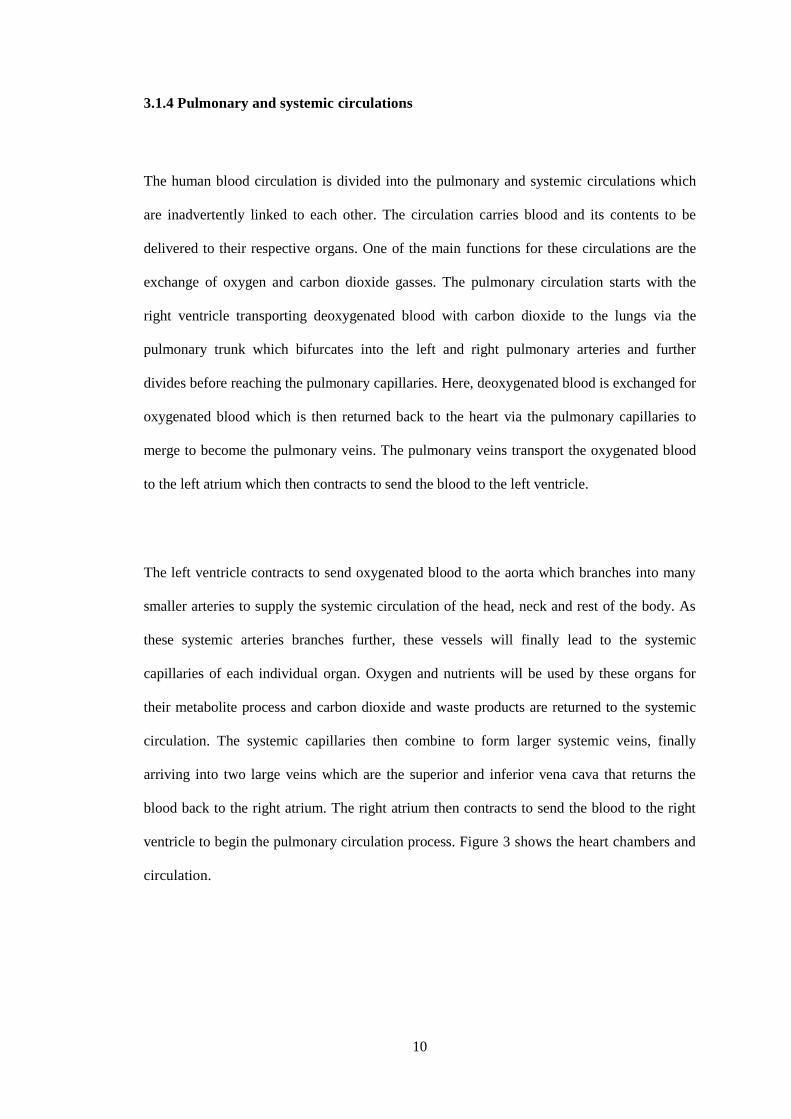
3.1.4 Pulmonary and systemic circulations
The human blood circulation is divided into the pulmonary and systemic circulations which
are inadvertently linked to each other. The circulation carries blood and its contents to be
delivered to their respective organs. One of the main functions for these circulations are the
exchange of oxygen and carbon dioxide gasses. The pulmonary circulation starts with the
right ventricle transporting deoxygenated blood with carbon dioxide to the lungs via the
pulmonary trunk which bifurcates into the left and right pulmonary arteries and further
divides before reaching the pulmonary capillaries. Here, deoxygenated blood is exchanged for
oxygenated blood which is then returned back to the heart via the pulmonary capillaries to
merge to become the pulmonary veins. The pulmonary veins transport the oxygenated blood
to the left atrium which then contracts to send the blood to the left ventricle.
The left ventricle contracts to send oxygenated blood to the aorta which branches into many
smaller arteries to supply the systemic circulation of the head, neck and rest of the body. As
these systemic arteries branches further, these vessels will finally lead to the systemic
capillaries of each individual organ. Oxygen and nutrients will be used by these organs for
their metabolite process and carbon dioxide and waste products are returned to the systemic
circulation. The systemic capillaries then combine to form larger systemic veins, finally
arriving into two large veins which are the superior and inferior vena cava that returns the
blood back to the right atrium. The right atrium then contracts to send the blood to the right
ventricle to begin the pulmonary circulation process. Figure 3 shows the heart chambers and
circulation.
11
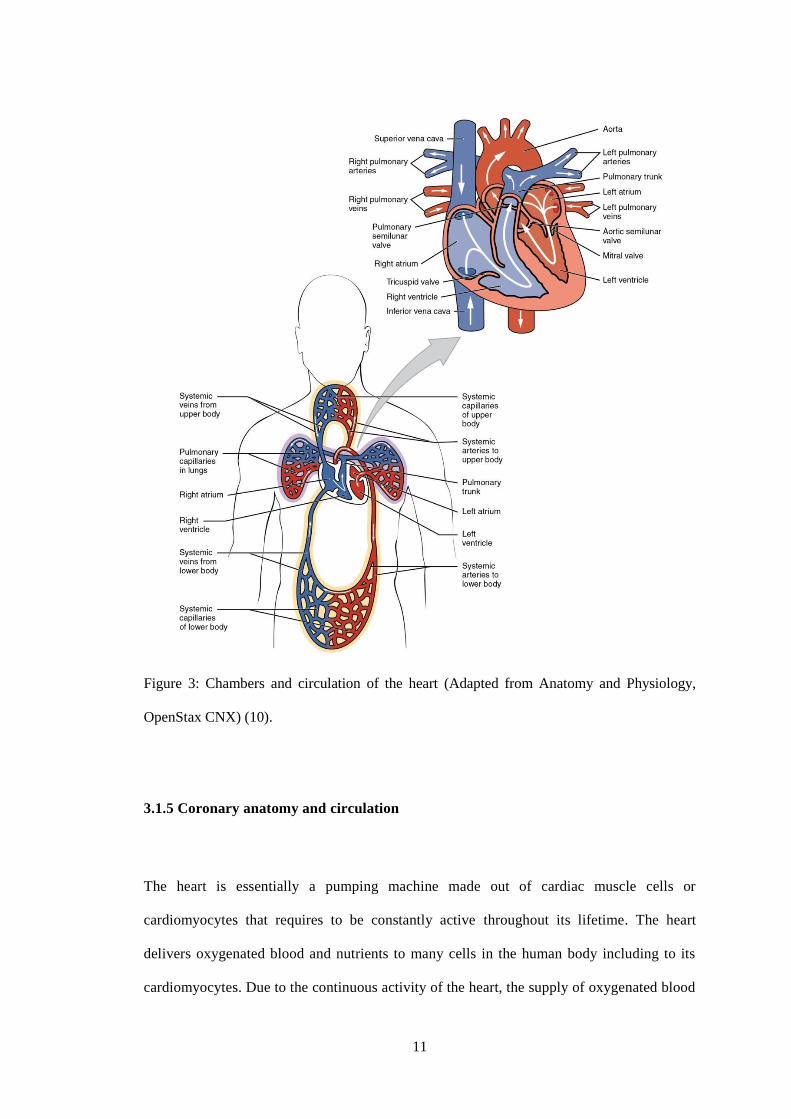
Figure 3: Chambers and circulation of the heart (Adapted from Anatomy and Physiology,
OpenStax CNX) (10).
3.1.5 Coronary anatomy and circulation
The heart is essentially a pumping machine made out of cardiac muscle cells or
cardiomyocytes that requires to be constantly active throughout its lifetime. The heart
delivers oxygenated blood and nutrients to many cells in the human body including to its
cardiomyocytes. Due to the continuous activity of the heart, the supply of oxygenated blood

12
is more crucial compared to other typical cells in the body. Therefore it has its own
complex and extensive circulation called the coronary circulation to do this job. The
coronary circulation is a cycle whereby it reaches a peak when the heart muscles are relaxed
and nearly halts when the muscles are fully contracted.
Coronary arteries functions to supply oxygenated blood and nutrients primarily to the
myocardium. The immediate division of the aorta after it arises from the left ventricle forms
the coronary arteries. The coronary arteries arise from the sinuses of Valsalva which are
actually dilatation above the semilunar cusps of the aortic valve. This comprises of three
cusps which are the anterior, left posterior and right posterior aortic sinuses. The left
coronary and right coronary arteries originate from the left posterior and anterior aortic
sinus respectively. The right posterior aortic sinus does not usually forms a vessel.
Epicardial arteries are coronary vessel that runs on the surface of the heart. Figure 4 shows
the coronary vessels on the surface of the heart.
The left coronary artery supplies mainly the left side of the heart; left atrium and ventricle
as well as the interventricular septum. It consists as the left main stem and courses
posteriorly and to the left of the pulmonary trunk to arrive at the left atrioventricular
groove. Two major branches of the left coronary artery which consists of the left circumflex
and left anterior descending artery. The left circumflex artery follows the atrioventricular
groove laterally, branch further distally and finally joins with the branches of the right
coronary artery. The larger left anterior descending artery follows the interventricular
groove. There are several branches from the left anterior descending artery which fuses
with the branches of the posterior interventricular artery forming anastomoses.

13
Branches of the left circumflex artery are as follows:
• Obtuse marginal branch – supply the lateral wall of the left ventricle
• Atrial branches
Branches of the left anterior descending artery are as follows:
• Septal branches
• Diagonal branches – supply the anterolateral wall of the left ventricle
• A branch to the right ventricle
The right coronary artery follows the coronary sulcus to the right and supplies blood to the
right atrium, part of the right and left ventricles as well as the heart conduction system.
There are usually more than one marginal artery from the right coronary artery just inferior
to the right atrium which supply blood to the superficial areas of the right ventricle. At the
posterior aspect of the heart, the right coronary artery give rise to the posterior
interventricular artery also called the posterior descending artery. This particular artery
courses along the posterior aspect of the interventricular sulcus towards the apex of the
heart supplying the interventricular septum and parts of both ventricles.
Branches of the right coronary artery are as follows:
• Conus artery to the pulmonary outflow tract
• Atrial and ventricular branches
• Branch to sinoatrial node
• Acute marginal branches - supplies the right ventricle
• Branch to atrioventricular node
• Posterior interventricular artery - supplies the inferior surface of the left ventricle
and the posterior two-thirds of the interventricular septum.
14
Coronary dominance is defined by the vessel which the posterior descending artery arises
from. This particular artery supplies the posterior and lateral walls of the left ventricle.
Majority of the population (80-85%) has a right dominance, in which the RCA gives rise to
the posterior descending artery and continues around in the atrioventricular groove, giving
branches to the posterolateral wall of the left ventricle. In left-dominant situations, the right
coronary artery is short. The posterior descending artery arises from the left circumflex
artery or less commonly from the left anterior descending artery. A co-dominant situation
occurs when a single or duplicated posterior descending artery is supplied by both the right
coronary artery and the left circumflex or left anterior descending artery.
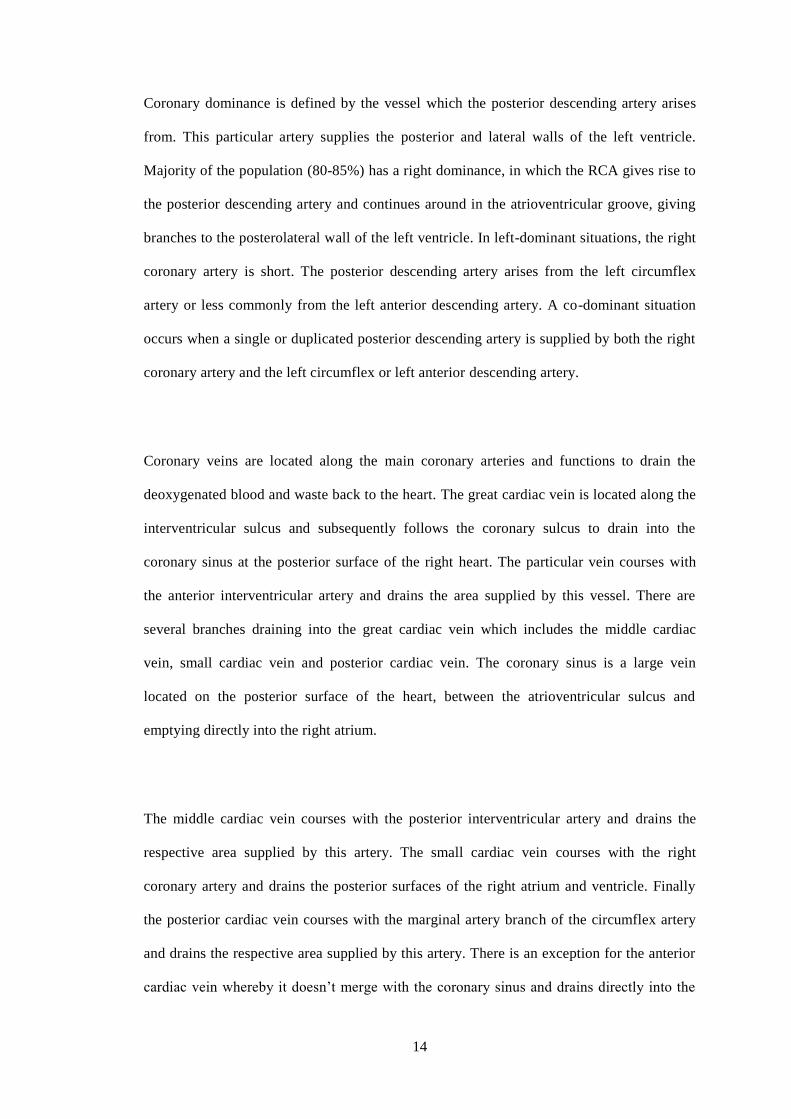
Coronary veins are located along the main coronary arteries and functions to drain the
deoxygenated blood and waste back to the heart. The great cardiac vein is located along the
interventricular sulcus and subsequently follows the coronary sulcus to drain into the
coronary sinus at the posterior surface of the right heart. The particular vein courses with
the anterior interventricular artery and drains the area supplied by this vessel. There are
several branches draining into the great cardiac vein which includes the middle cardiac
vein, small cardiac vein and posterior cardiac vein. The coronary sinus is a large vein
located on the posterior surface of the heart, between the atrioventricular sulcus and
emptying directly into the right atrium.
The middle cardiac vein courses with the posterior interventricular artery and drains the
respective area supplied by this artery. The small cardiac vein courses with the right
coronary artery and drains the posterior surfaces of the right atrium and ventricle. Finally
the posterior cardiac vein courses with the marginal artery branch of the circumflex artery
and drains the respective area supplied by this artery. There is an exception for the anterior
cardiac vein whereby it doesn’t merge with the coronary sinus and drains directly into the
15
right atrium. The anterior cardiac vein courses with the small cardiac arteries and drain the
anterior surface of the right ventricle.
Figure 4: Coronary vessels from the anterior and posterior heart views (Adapted from
Anatomy and Physiology, OpenStax CNX) (10).
3.1.6 Conduction System of the Heart
The contraction of the heart is controlled by the heart’s electrical system or better known as
the cardiac conduction system. This system comprises of the cardiomyocytes and their
respective conducting fibres that are specialized in initiating electrical impulses and

16
conducting these impulses rapidly and efficiently throughout the heart. This process
coordinates the heart contraction and thus initiates the normal cardiac cycle.
The cardiac conduction system is broadly classified into:
• sinoatrial (SA) node
• atrioventricular (AV) node
• bundle of His
• left and right bundle branches
• Purkinje fibres
Heart contractions is initiated when electrical stimulus are sent from the SA node which is
located 1mm from the epicardial surface in the right atrial sulcus terminalis at the junction of
the anteromedial aspect of the atrio-caval junction. The SA node is known as the pacemaker
of the heart as it initiates the cardiac cycle. With each stimulus, the SA node produces an
electrical impulse which passes to the cardiomyocytes of both atria causing a coordinated
wave of contraction. This causes the fully filled atria to contract and diverts the blood through
the patent valves into their respective ventricles.
The electrical stimulus from the SA node then passes to the AV node which is located just
inferior to the right atrium endocardium, anterior to the opening of the coronary sinus and
superior to the septal leaflet insertion of the tricuspid valve. There is a slight delay when the
stimulus travels from the SA node to the AV node to allow for the atria to contract adequately
in order to pump all the blood into the ventricles. As soon as the blood is completely emptied
from the atria, their respective valves close and the atria begins the refilling process again. At
the same time, the electrical stimulus passes through the AV node into the Bundle of His,
17
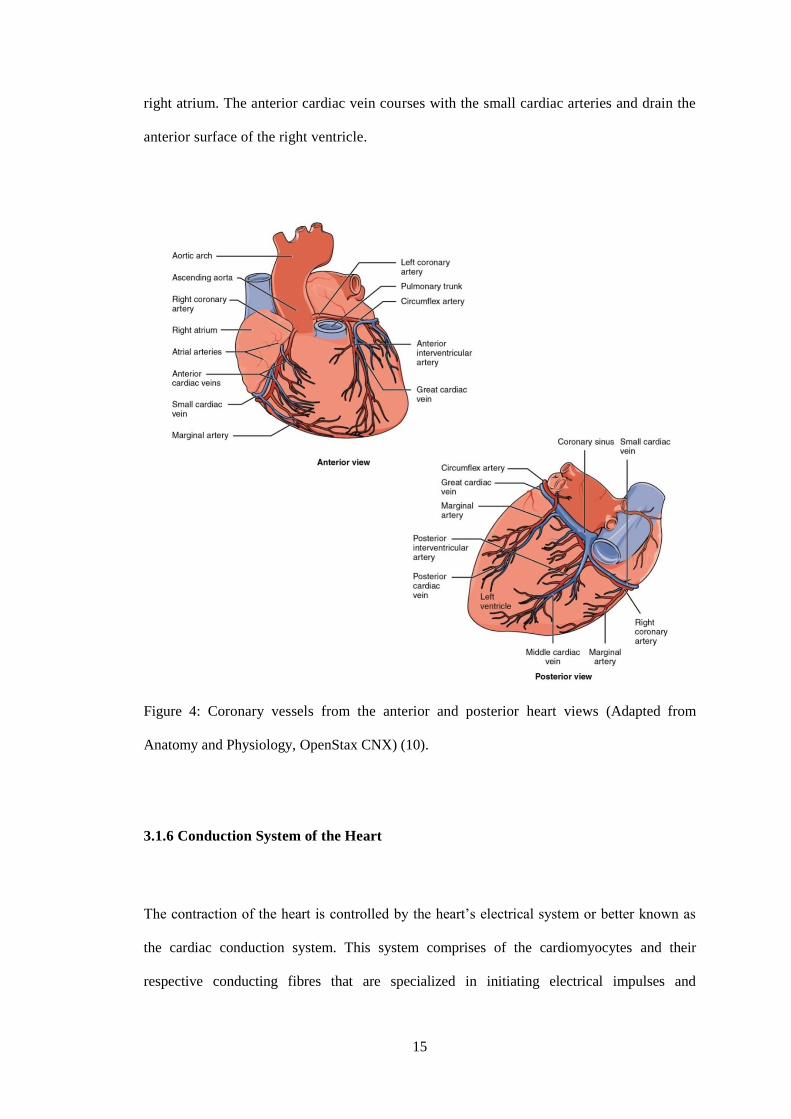
right and left bundle branches and to the Purkinje fibres within the ventricular walls. Figure 5
shows the cardiac conduction system.
Stimulation of these fibres causes both ventricles to contract almost simultaneously. However,
the left ventricle contracts slightly earlier than the right ventricle. Contraction of the ventricles
is called systole. During systole, the right ventricle pumps blood to the pulmonary circulation
while the left ventricle pumps blood to the systemic and coronary circulation.
Soon after ventricular contraction, the ventricles relax while waiting for the next impulse.
Relaxation of the ventricles is known as diastole. During diastole, both ventricles are void of
blood, both atria are filled with blood and the valves between them are closed. Subsequently
the SA node releases another electrical impulse and the cardiac conduction system reinitiates.
During each cycle, the SA and AV node only contain one stimulus. Therefore, the SA and AV
node recharges during the refilling of the atria and ventricles respectively before continuing
with the next cycle. This whole process of recharging takes less than one third of a second.
The term discharge or release of an electrical stimulus is known as depolarization and the
term for recharging is known as repolarization. In summary, the stages of a single heart beat
comprises of an initial atrial depolarization, followed by ventricular depolarization and finally
atrial and ventricular repolarization.
18
Figure 5: The cardiac conduction system (Adapted from StudyBlue, Biology Chapter 19 –
lecture. Chemeketa Community College, Oregon) (11).

19
3.2 CORONARY ARTERY DISEASE
Coronary artery disease (CAD) is one of the most common causes of mortality and morbidity
throughout the world with the disease increasing every year. Compilation of health statistics
from more than 190 countries revealed that heart disease is still the top cause of death with
17.3 million attributed deaths each year, according to “Heart Disease and Stroke Statistics —
2015 Update: A Report From the American Heart Association.” The report concluded that by
year 2030, the number is predicted to increase to more than 23.6 million (12).
According to the latest statistics obtained from World Health Organization (WHO) published
in May 2014, deaths from CAD has amounted to 29 363 which is approximately 23.10% of
total deaths. Malaysia is ranked number 33 in the world with an age adjusted death rate of
150.11 per 100 000 population. The trend of this disease in Malaysia is largely reflected by
most developing countries worldwide (1). Patients with CAD in Malaysia presents at a mean
age of 59±12 years, which is 6 years younger than those in the Global Registry of Acute
Coronary Events (GRACE). Therefore, the population of Malaysia has a high risk factor of
developing CAD (13).
3.2.1 Terminology
Patients with CAD may be classified into stable angina or as acute coronary syndrome (ACS).
Stable angina is a medical term used to define symptoms of chest discomfort that radiates to
the jaw, shoulder, back or arms and usually occurs during physical or emotional stress and
relieved by rest of sublingual glyceryl trinitrate (GTN). Less commonly the discomfort may
arise from the epigastric region. Stable angina is usually used to explain the symptoms which
are caused by myocardial ischaemia (14).

20
ACS is a broad spectrum of disease depending on severity of myocardial ischaemia and
degree of coronary artery stenosis. It occurs when the plaque buildup is unstable and causes
partial or total coronary artery occlusion. It is further classified into:
• unstable angina (UA)
• non-ST elevation myocardial infarction (NSTEMI)
• ST elevation myocardial infarction (STEMI)
A patient diagnosed with unstable angina may deteriorate and presents as NSTEMI or STEMI
depending on the severity of luminal stenosis and myocardial injury (15).
Unstable angina may present as:
• new onset severe exertional angina with no significant pain at rest
• non exertional angina within the past month but not within the last 48 hours (subacute
angina at rest)
• angina at rest within 48 hours (acute angina at rest) (15).
Unstable angina occurs when there is significant myocardial ischemia with absent myocardial
injury. The cardiac biochemical markers are usually normal as there is no myocardial damage.
In myocardial infarction (MI) which encompasses NSTEMI and STEMI, cardiac biomarkers
are raised due to significant myocardial damage. ECG changes are also evident in MI, while
in UA they are usually absent or only last for a brief moment if present (2).
21
3.2.2 Pathogenesis
ACS usually occurs when there is rupture or ulceration of the atherosclerotic plaque with
associated coronary vascular thrombosis and vasospasm. Therefore patient can present as UA,
NSTEMI or STEMI depending on the acuteness of the disease, degree of coronary luminal
stenosis and the presence of collaterals to supply the affected myocardial segment. Possible
causes atherosclerotic plaque rupture or ulceration has not been determined, however it is
hypothesized that underlying inflammation, infection, uncontrolled hypertension and chronic
smoking may lead to this phenomenon (15).
Further subdivisions of ACS are:
• Primary – unrelated to a non-cardiac condition and occurring de novo
• Secondary – directly related to a non-cardiac condition
• Post-infarct – occurs within two weeks of an acute MI
Secondary ACS may occur due to a precipitating condition such as in thyrotoxicosis with
tachycardia, high fever with increased myocardial oxygen demand, hypotension leading to
reduced myocardial blood flow and anemia or hypoxemia causing reduced myocardial
oxygen delivery (15).
3.2.3 Diagnosis
According to the WHO, a diagnosis of ACS is made when a patient satisfies at least two
criteria which indicate high probability or three criteria which indicate a definite diagnosis of:

22
• A typical clinical history of ischemic chest pain lasting more than 20 minutes
• Significant changes in serial ECG monitoring
• Significant rise and fall of serum cardiac biomarkers
3.2.3.1 Clinical history
Symptoms of UA and NSTEMI are very similar and may be difficult to tell apart from
STEMI. The chief complaint of patients with ACS is chest pain or discomfort. The location of
the pain felt is usually left sided, central or retrosternal and often radiates to the shoulder, jaw
or upper limb. It can present as a crushing, pressing or even burning pain with a variable
severity (15).
There are instances whereby patients, predominantly those with diabetes and the elderly
presents with atypical symptoms of shortness of breath without any prior chest pain. Other
atypical symptoms include profuse sweating, nausea, vomiting, syncope, and lethargy. High
risk patients of developing a cardiac event includes patients with a previous history of CAD
or stroke, family history of premature CAD, dyslipidemia, diabetes mellitus, hypertension and
long standing history of smoking (15).
3.2.3.2 Physical examination
A thorough physical examination is important for patients with ACS in order to identify:
• possible causes – cardiac or extra-cardiac causes
• precipitating causes
• consequences or complications related to ACS

23
Patients with uncontrolled hypertension, long standing anemia, severe thyrotoxicosis, severe
aortic stenosis, hypertrophic cardiomyopathy and chronic lung disease should be elicited.
Complications from ACS such as left ventricular failure and arrhythmias needs to be
identified as these signs indicate a poor prognosis. Other signs such as carotid bruits and
peripheral vascular disease are highly suggestive of an extensive atherosclerotic disease with
a possibility of concomitant CAD (15).
3.2.3.3 Electrocardiography (ECG)
ECG is an essential part of the investigation for the workup ACS. It supports the diagnosis of
ACS and to some extent, provides information regarding the outcome of the disease. The best
time for an ECG recording is during an episode of chest pain. ECG recording should also be
undertaken within 10 minutes of the patient’s admission at the Accident and Emergency
Department. Occasionally in the initial stages, the ECG findings may be non-diagnostic or
equivocal. Therefore, ECG should be repeated at least every 15 minutes to identify any
dynamic ST/T changes. Comparison with previous ECG recordings may be helpful in
obtaining a diagnosis (15).
Features suggestive of an ACS episode are:
• dynamic ST/T changes
• ST depression/ elevation > 0.5 mm in 2 or more contiguous leads
• T-wave inversion – deep symmetrical T-wave inversion
Other ECG findings include new onset left bundle branch block (LBBB) and cardiac
arrhythmias. Previous or recent myocardial infarctions can present as Q waves (15).
24
3.2.3.4 Cardiac biomarkers
For assessment of myocardial damage, the recommended cardiac biomarkers are troponin T
or I. These markers show high sensitivity and specificity in diagnosing myocardial injury.
Besides that, they also provides important prognosis for the patient as there is evidence of
correlation between the level of troponin with the extent of myocardial injury and related
cardiac complications. However, if the troponin markers are taken early in the initial few
hours of symptoms (< 6 hours), the troponin level may not be significant. Therefore, a repeat
troponin level needs to be done within 6-12 hours of admission to safely exclude an acute
coronary syndrome.
This investigation can be done in the laboratory which will display accurate levels or can be
tested with a hand held semi-quantitative assay for immediate results. Troponin levels are
elevated in the blood for at least 5 to14 days post myocardial injury. Other causes besides
cardiac causes of high troponin enzymes include acute myocarditis, acute pulmonary
embolism, a dissecting aortic aneurysm, heart failure, septic shock and severe renal
dysfunction. As with ACS, significantly high levels of troponin enzymes are indicative of an
increase in mortality in the affected patients.
Another cardiac enzyme that is routinely used is creatinine kinase (CK) and its MB fraction
(CKMB). The disadvantage of this biomarker compared to troponin is that they are less
sensitive and specific. The benefit of CK and CKMB is that they have a shorter half-life and
therefore helpful in diagnosing myocardial reinfarction. Almost all patients with NSTEMI
will have elevated troponins but the CKMB may be not elevated in about 10-20% of these
patients. No prognostic information can be obtained if there is a raised CKMB without an
associated elevated troponin level.
25
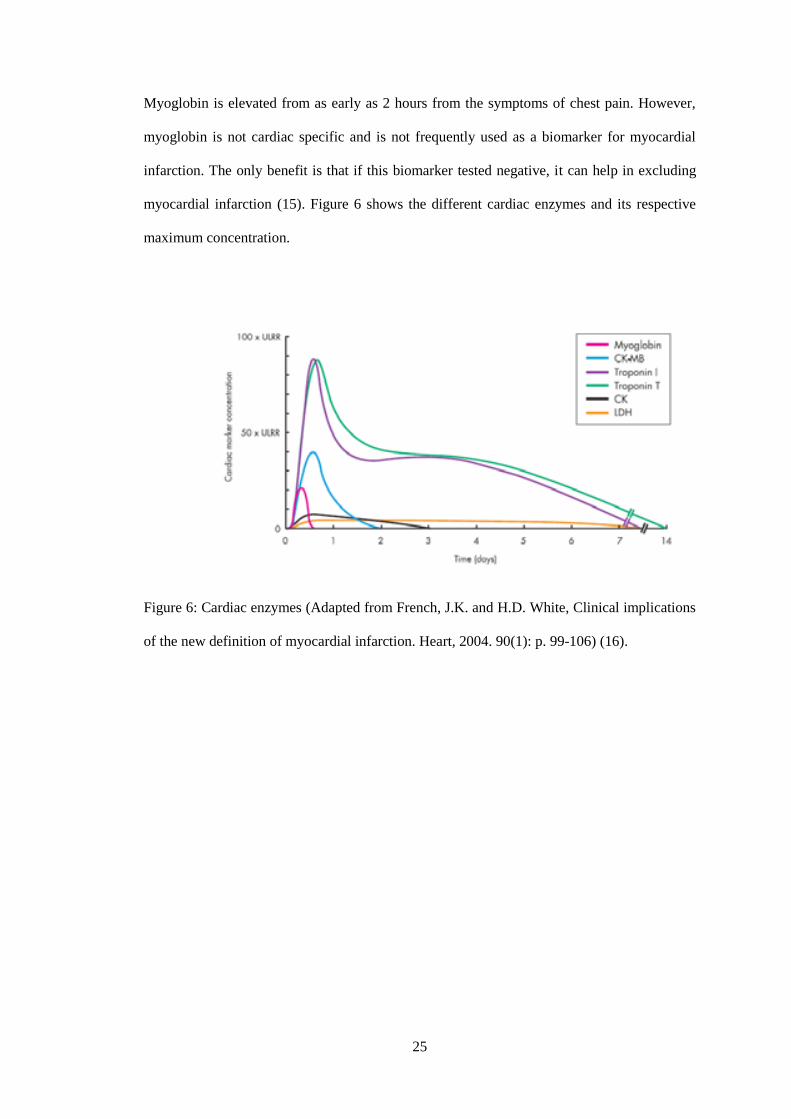
Myoglobin is elevated from as early as 2 hours from the symptoms of chest pain. However,
myoglobin is not cardiac specific and is not frequently used as a biomarker for myocardial
infarction. The only benefit is that if this biomarker tested negative, it can help in excluding
myocardial infarction (15). Figure 6 shows the different cardiac enzymes and its respective
maximum concentration.
Figure 6: Cardiac enzymes (Adapted from French, J.K. and H.D. White, Clinical implications
of the new definition of myocardial infarction. Heart, 2004. 90(1): p. 99-106) (16).
26
3.3 IMAGING MODALITIES
In patients presenting with symptoms of chest pain, initial clinical assessment is important to
confirm whether it is due to an underlying ACS. Once a preliminary diagnosis of ACS is
made, further assessment with imaging is made in order to:
• confirm the diagnosis of CAD
• assessment of the degree and functional significance of a coronary stenosis
• assessment of the viability of the affected myocardium
• assessment of global and regional ventricular function
CAD is not solely diagnosed based on the degree of coronary artery narrowing but includes
an assessment on the plaque volume and its characteristics. A significant stenosis usually
means that the coronary artery is narrowed to lead to ischemia of the cardiomyocytes.
Definition of viability is functioning live myocardium. Therefore, viability study is crucial in
assessing the chances for functional recovery after undergoing angioplasty. The left
ventricular function is important in determining the prognosis following an episode of
ischaemic heart disease (17).
The different types of cardiac imaging available for the investigation of a provisional
diagnosis of CAD can be classified as follows (17):
• Invasive techniques
o Invasive coronary angiography
o Intravascular endoscopic ultrasound
• Non-invasive techniques
o Direct visualization of the coronary arteries
▪ coronary calcium score

27
▪ coronary CT angiography
▪ MRI of the coronary arteries
o Assessment of the degree of coronary stenosis
▪ SPECT/PET myocardial perfusion scintigraphy
▪ stress echocardiography
▪ MRI cardiac including stress and delayed enhancement sequences
3.3.1 Invasive coronary angiography
The current practice for achieving the best images of coronary arteries in patients with
coronary artery disease is by venous catheterization, injection of contrast media and the using
a fluoroscopic machine (18). This technique is known as invasive coronary angiography
(ICA) and is considered the gold standard in the current practice. ICA is useful in providing a
thorough picture of the entire coronary vasculature as well as identifying the presence and
extent of atherosclerotic coronary artery disease. If a coronary angioplasty is needed for
treatment of coronary luminal stenosis, a prior ICA must be undertaken to guide the
cardiologist.
However, ICA has its own limitations namely that is an invasive procedure and is associated
with multiple complications which range from minor problems with minimal sequelae to life
threatening irreversible problems if the issue goes undetected. Complications can be grouped
into cardiac and non-cardiac complications. Examples of cardiac complications are acute
pulmonary oedema, myocardial infarction, conduction disturbances while non-cardiac
complications are embolic stroke, local vascular injury, nephropathy to name a few. Allergy
reaction can also arise from the use contrast media and local/general anaesthesia while
performing the procedure (19).

28
Moreover, ICA is can only offer a two-dimensional view of the coronary tree and cannot
reliably reveal the nature of the atherosclerotic plaques which are important in determining
the best method of treatment and the clinical outcome of the patient (4). Therefore, a
complementary CT or MRI cardiac may need to be employed to assist in overcoming the
shortcomings of the ICA (18).
3.3.2 Magnetic resonance imaging (MRI) cardiac
MRI cardiac is a non-invasive, non-ionizing, imaging technique that utilizes a powerful
magnetic field, radio frequency pulses and a computer to produce images of the heart. When
compared to cardiac nuclear scintigraphy, MRI has a better spatial and temporal resolution
with better tissue characterization. Furthermore, MRI does not require any ionizing radiation
when compared to CT scan or cardiac scintigraphy (20).
There are many functions of this imaging mainly consist of:
• evaluating the anatomy and function of the heart chambers, valves and blood flow
through major vessels and surrounding structures i.e. pericardium
• diagnosing cardiovascular related disorders such as tumors, infections and
inflammatory conditions
• evaluating the effects of a cardiac event such as expansion and late wall thinning of
infarcted segments, left ventricular volume and shape as well as hypertrophy of the
non-infarcted myocardium (20).
With the recent advances in MRI imaging, this method of imaging has been used extensively
in the diagnosis of coronary artery disease. Although there is significant overlap of function
29
with other cardiac imaging modalities, MRI cardiac is most often used as a complementary
tool to confirm or resolve diagnostic dilemmas. In the near foreseeable future, MRI cardiac
will play an important role in the diagnosis of cardiac diseases and assist in cardiac
interventions (20).
3.3.3 Coronary computed tomography angiography and CAC Score (Calcium Score)
CCTA technology has been advancing rapidly in the last few decades. In 1998, the first four
slice CT machines was used, followed by sixteen slice in 2001 and sixty four slice in 2004
(3). Currently, CCTA is already confirmed as a highly accurate, effective and less invasive
imaging modality in the diagnosis of coronary artery disease (CAD). This is mainly due to the
rapid technological advances which improves the spatial and temporal resolution of multi-
slice CT scanners (6, 7).
Considerable accuracy have been shown in the diagnostic capabilities in detecting significant
coronary artery luminal stenosis of CCTA compared to ICA in the recent years (21, 22).
According to Mollet, N.R. et al., significant coronary artery stenosis were detected by sixty
four slice CT scanners with a high sensitivity and specificity of 99% and 95% respectively
when compared to ICA (23). Further comparison made with sixty four slice CCTA with MRI
angiography and stress nuclear imaging has showed that CCTA has a higher accuracy in
detecting coronary artery stenosis (24). Early comparative studies between CCTA and ICA
have also suggested that CCTA has an advantage over ICA in certain groups of patients (25).
Framingham Risk Score (FRS) (26) is an established method and widely used by doctors in
predicting cardiovascular risk in asymptomatic patients with no underlying CAD (27).
30
According to Wilson et al. (28), the accuracy for FRS to predict a cardiovascular event is
stated to be approximately 75%. In order to improve the accuracy of FRS, other imaging
studies have been proposed. One such technique that is widely used is the detection of
coronary artery calcium score using a non-contrasted multidetector computed tomography
(MDCT) or electron-beam computed tomography (EBCT) (27). This particular investigation
has been recommended as a screening tool prior to ICA as it can assist in stratification of
patients with intermediate or high risk of developing coronary artery disease (9). Our hospital
at University Malaya Medical Centre uses non-contrasted MDCT to assess coronary artery
calcium (CAC) score.
CAC score has a high negative predictive value of 95-99%. This implies that if the CAC score
is 0 in an asymptomatic low risk patient, the presence of atherosclerotic plaque or significant
coronary artery stenosis is unlikely and this is associated with a very low risk of acute
coronary syndrome within 2-5 years (27, 29, 30). However, a positive CAC score means there
are calcium deposits within the coronary arteries identified on CT scan and confirm the
presence of atherosclerosis. The CAC score is directly proportional to the CAD risk
indicating that patients with higher CAC score, has higher risk of developing CAD (27). This
is particularly helpful for the cardiologists to avoid performing unnecessary ICA (9).
However, there are a few shortfalls when using CAC score as a screening tool. Firstly, there
are different types of atherosclerotic plaques namely calcified, non-calcified and mixed
plaques. Therefore, a plain CT scan cannot identify non-calcified or mixed plaques accurately
which may cause significant coronary artery disease. Secondly, CAC screening is not
recommended for very high risk, very low risk or even in patients with underlying CAD.
Next, CAC score does not give any reliable information regarding the degree of coronary
artery stenosis and patients may warrant further investigation such as contrasted coronary CT
31
angiography or ICA. Finally, there are no established guidelines for repeat calcium scoring
for re-evaluation of coronary artery disease risk (31-33).
The pathogenesis of coronary artery calcification is thought to be due to the formation of fatty
streaks within the vessel walls which progresses to fatty build up over the years forming a
non-calcified plaque. This particular plaque is known as an unstable plaque as only a thin
layer of arterial wall covering the fatty plaque. If the arterial wall is injured or ruptured, the
fatty material will be secreted into the vascular system causing aggregation of platelets to
plug the site of injury. As the platelets accumulates and forms a clot, it may obstruct the
lumen and impede the blood flow within the coronary artery leading to an acute coronary
syndrome. However, if the fatty plaque does not rupture, it will mature and develop into a
fibrous hard plaque and finally a calcified plaque. When the plaque calcifies, it is pushed
towards the outer vessel wall and can lead to significant stenosis if the plaque is large enough
(34).
Agatston score is the standard method in calculating the CAC score. This method was first
introduced by Arthur Agatston and his colleagues in 1990. A dedicated software is used to
identify any structures with calcified densities along the coronary artery measuring equal to or
more than 130 Hounsfield units (HU) and within an area of 1 mm2 or more. These calcified
densities are then recorded as calcified focus and these foci overlying the coronary arteries are
considered to represent calcified plaques. For every identified segmented calcified plaque, the
maximum density in HU was determined and a density scoring of 1 to 4 was assigned. The
assigned density scores of 1, 2, 3 and 4 represented the highest densities 130-199 HU, 200-
299 HU, 300-399 HU and ≥ 400 HU respectively. The weighted density score is calculated by
multiplying the density score with the total area of each calcified plaque. Finally the total

32
Agatston score or CAC score (also known as Calcium Score) is calculated by adding the
weighted density scores of each calcified plaque throughout the coronary arteries (35, 36).
Table 1 shows the significance of calcium score in relation to plaque burden, probability of
significant CAD, implications of cardiovascular risks and treatment recommendations.
Table 1: Calcium score guidelines and recommendations (37).
Calcium
score
Plaque burden Probability of
significant
CAD
Implications for
cardiovascular
risk
Recommendations
0 No
identifiable
plaque.
Very low,
generally
<5%.
Very low. Reassure patient.
Discuss general public
health guidelines for
primary prevention of
cardiovascular disease.
1-10 Minimal
identifiable
plaque burden.
Very unlikely,
<10%.
Low. Discuss general public
health guidelines for
primary prevention of
cardiovascular disease.
11-100 Definite, at
least mild
atherosclerotic
plaque burden.
Mild or
minimal
coronary
stenosis likely.
Moderate. Counsel about risk
factor modification,
strict adherence with
primary prevention
goals. Daily aspirin.
101-400 Definite, at
least moderate
atherosclerotic
plaque burden.
Non
obstructive
CAD highly
likely
although
obstructive
disease
possible.
Moderately high. Institute risk factor
modification and
secondary prevention
goals. Consider
exercise testing for
further risk
stratification. Daily
aspirin.
> 400 Extensive
atherosclerotic
plaque burden.
High
likelihood,
>50% of at
least one
significant
coronary
stenosis.
High. Institute very
aggressive risk factor
modification. Consider
exercise for non-
pharmacologic nuclear
stress testing to
evaluate for inducible
ischemia. Daily aspirin.
CAD: Coronary artery disease

33
While measuring the calcium burden of the coronary arteries has been shown to give an
indicator of the degree of the atherosclerotic disease present in the arteries; presence of a high
calcium burden in the coronary arteries had been used as a limiting factor to a subsequent
contrasted CCTA. This is due to the fact that the presence of abundant calcium causes
blooming artefacts that obscure the underlying vessels and hence objective analysis of
luminal patency would be hindered. Studies had shown that patients with calcium score of
more than 400 affects the diagnostic performance of CCTA and therefore has been suggested
that these patients should not proceed with CCTA (38). The cut off at 400 was chosen
because multiple studies have concluded that there is a significant reduction in specificity in
patients with a high calcium score >400 as compared to patients with calcium score <400 (8).
Alternatively, a more current literature suggests that a calcium score of 400 and above is not a
deterrent to a subsequent CCTA (9). Decisions on whether or not to pursue with a subsequent
CCTA should be based on composition, clustering and position of the calcium burden rather
than on the absolute calcium score value.
Apart from the assessment of the coronary luminal stenosis, CCTA is able to visualize the
atherosclerotic plaque therefore identifying its location and distribution in the coronary
arteries. Further advantage of CCTA lies in its ability to characterize the different types of
plaques as well as assess the composition of plaques (7). This is particularly helpful in
identifying the non-stenotic plaques that can go undetected by ICA (39). There are many
studies that have shown the capability of CT scanners in differentiating between calcified,
non-calcified and mixed plaques based on the CT attenuation value measured in Hounsfield
units (7). Classification of coronary plaque composition via CCTA is important in patients
with CAD. By identifying the high risk plaques, management can be target towards these
plaques (40). There are significant association of plaque composition with myocardial injury
which can assist in the prediction of future cardiac events and the prognosis of the patient (4).
34
Although significant technological advances have been made in MRI and CT scanners,
invasive coronary angiography still remains the gold standard in obtaining the diagnosis of
coronary artery stenosis (18). With continued improvement in the speed and resolution of
imaging, CCTA will still play an important role in the early detection and characterization of
coronary plaques thus preventing major adverse cardiac events through immediate treatment
strategy (40).
3.3.4 Coronary 3D virtual intravascular endoscopy
Coronary virtual intravascular endoscopy (VIE) is a specific intraluminal visualization
technique using 3-dimensional volume rendering technique with the help of computer
software. This technique is useful in the assessment of the normal coronary artery anatomy
and in patient with coronary artery disease. The advantage of coronary VIE compared to
conventional angioscopy is it is a less invasive procedure with very low complication rate
(41).
Coronary VIE images are generated using a CT number thresholding technique. The three
main coronary arteries which are the left anterior descending (LAD) artery, left circumflex
(LCX) artery and right coronary artery (RCA) are identified. The CT attenuation of these
arteries are measured and the CT number threshold when the contrast enhanced blood within
these vessels are not visualized is ascertained. Subsequently, the CT number threshold which
was obtained is applied into the computer software in order to generate the intraluminal
images of the coronary ostium, lumen surface and coronary wall. The method for post
processing coronary VIE images requires the accurate selection of CT number threshold as a
small difference in the value may lead to artefacts. These artefacts when present will affect
the VIE image quality leading to poor visualization and interpretation of the coronary artery

35
lumen, degree of arterial stenosis and plaque morphology if present. Besides acquiring the
appropriate CT number threshold, the quality of the original source CT is also important in
order to produce acceptable coronary VIE images (41, 42).
Once the coronary VIE images are generated, interpretation of these data should be done
together with the multiplanar reformatted images of the original CT coronary scan. This is
useful in determining the exact anatomy of the coronary artery. Besides generating static VIE
images, endoscopic views can be reconstructed via the fly through technique in a dynamic
format. This technique is achieved by placing virtual cameras along the fly path of the
respective coronary artery and the computer will automatically generate an endoscopic view
at regular intervals. The dynamic fly through visualization is achieved when the data obtained
is viewed in cine imaging format. An average of less than 20 minutes is required by an
experienced operator with the aid of fast speed workstation to complete the VIE image post
processing. Therefore, it is a practical complementary visualization tool with a relatively short
post processing time (41, 42).
Coronary VIE provides important information regarding coronary plaques in relation to the
location, plaque morphology as well as coronary wall changes and stenosis due to the
presence of plaques within the coronary artery. The coronary wall changes and plaque
morphology on VIE are related to the amount and types of plaques. There are three types of
coronary plaques which can be classified into calcified, non-calcified and mixed plaques (41,
42).
In patients with high coronary artery calcium score, the intraluminal plaques were clearly
identified on VIE and is more accurate than the CCTA as it is not affected by the blooming
artefacts from the extensive coronary artery calcifications. These extensive calcifications
36
decrease luminal visualization causing overestimation of the coronary artery stenosis and
thereby reducing the diagnostic accuracy on CCTA. VIE concentrates on the intraluminal
appearance as compared to the extra luminal appearance on CCTA which makes it more
accurate in determining the degree of coronary artery stenosis (42).
3.3.5 Functional cardiac imaging
Cardiac stress imaging is used as a complementary imaging to demonstrate areas of the
myocardium that receives inadequate blood supply for the demands of the cardiac tissue.
There are many ways to induce stress to the heart which can be classified into non-
pharmacological method through physical activity and pharmacological methods.
Pharmacological agents are infused into the venous system which either increases the strength
of the heart contractions such as dobutamine or dilates the vessel and reduces the delivery of
blood to affected vessels such as adenosine and dipyridamole (18). Imaging of the heart is
commenced as soon as the heart is subjected to the stressor.
37
CHAPTER FOUR
4.0 METHODOLOGY
4.1 STUDY DESIGN
This study is based on a retrospective and prospective study on 103 patients whom had
proceeded with CCTA with an initial CAC score of > 400. The period of study was from
January 2011 to June 2014. Patients were referred by the Department of Cardiology,
University Malaya Medical Centre, Kuala Lumpur to the Department of Biomedical Imaging,
University Malaya Medical Centre, Kuala Lumpur for suspected CAD. All examinations
were done at the CT scan suite (C1), Department of Biomedical Imaging, University Malaya
Medical Centre, Kuala Lumpur.
4.2 PATIENT SELECTION AND FOLLOW UP
The inclusion criteria were patients with suspected CAD having calcified plaques detected on
CCTA with CAC score > 400. ICA was performed as the gold standard technique to confirm
the diagnosis. The exclusion criteria were calcified, non-calcified plaques or mixed plaques
on CCTA with calcium score <400, contraindications for iodinated contrast media with
history of allergy and not covered with prednisolone, renal dysfunction/renal insufficiency,
heart rate faster than 100 beats per minute, atrial fibrillation or arrhythmia and hemodynamic
instability.

38
A structured interview and clinical history were acquired via telephone interviews and the
following coronary artery disease risk factors were assessed via a questionnaire (Appendix
A): The CAD risk factors which were identified in this study were:
• prior or current history of smoking and its duration
• diabetes mellitus (defined as a fasting glucose level of ≥7 mmol/l or the need for
subcutaneous insulin or oral hypoglycemic agents) (43)
• dyslipidemia (defined as a total cholesterol level ≥5 mmol/l or treatment with lipid-
lowering drugs) (44, 45)
• hypertension (defined as blood pressure ≥140/90 mm Hg or the use of
antihypertensive medication) (46)
• stroke (defined as clinical symptoms/signs of focal and/or global loss of cerebral
function, with symptom persists more than 24 hours or leading to mortality) (47)
• positive family history of CAD (defined as the presence of CAD in first degree
relatives younger than 55 [male] or 65 [female] years of age) (48)
Follow-up information was obtained by either hospital chart review and/or telephone
interviews. These patients were followed up for at least 1 year and up to 4 years later for the
health status in relation to their cardiac complaints and are classified as:
• no cardiac event or asymptomatic
• unstable angina or NSTEMI
• STEMI
• revascularization (percutaneous coronary intervention or CABG)
• cardiac death (defined as death caused by acute myocardial infarction)

39
A total of 64 questionnaires were obtained from the patients. The questionnaire for the
remaining patients were unsuccessful due to various reasons i.e. wrong or no contact details,
patient whom are not free to undergo an interview and patient whom are not keen to divulge
personal information.
Laboratory tests for serum levels of total cholesterol, low-density lipoprotein (LDL), high-
density lipoprotein (HDL) and patient’s initial blood pressure prior to CCTA were obtained
from the hospital chart and via online laboratory investigations.
This study was approved by the local research ethics committee in University of Malaya
(ethics committee approval number: 989.35). Prior to the CCTA, information regarding the
study was explained to the patients as per the patient information sheet (Appendix B). An
informed written consent (Appendix C) was obtained from all patients or patient’s relative
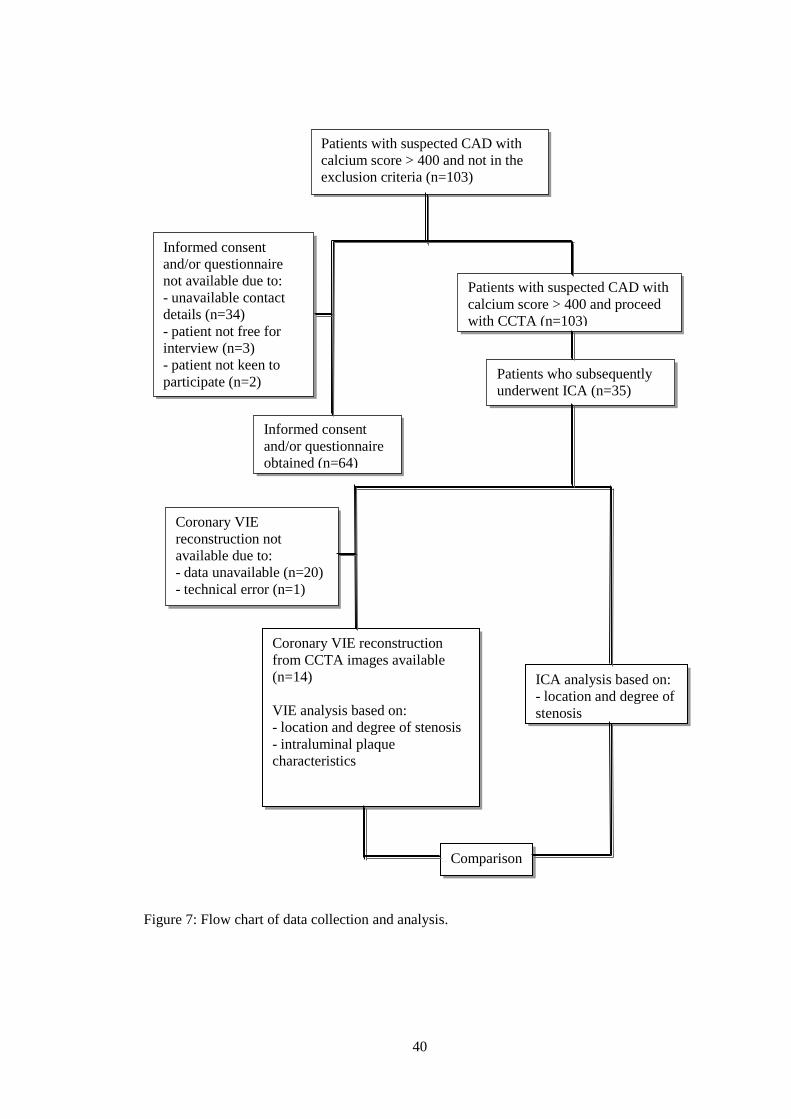
before proceeding with the CCTA. Figure 7 illustrates the process of sample collection.
40
Figure 7: Flow chart of data collection and analysis.
Informed consent
and/or questionnaire
obtained (n=64)
Coronary VIE reconstruction
from CCTA images available
(n=14)
VIE analysis based on:
- location and degree of stenosis
- intraluminal plaque
characteristics
ICA analysis based on:
- location and degree of
stenosis
Patients with suspected CAD with
calcium score > 400 and not in the
exclusion criteria (n=103)
Patients with suspected CAD with
calcium score > 400 and proceed
with CCTA (n=103)
Patients who subsequently
underwent ICA (n=35)
Informed consent
and/or questionnaire
not available due to:
- unavailable contact
details (n=34)
- patient not free for
interview (n=3)
- patient not keen to
participate (n=2)
Coronary VIE
reconstruction not
available due to:
- data unavailable (n=20)
- technical error (n=1)
Comparison
41
4.3 CCTA IMAGING TECHNIQUE
4.3.1 Patient preparation
All patients undergoing contrasted CCTA were required to fast for a minimum of 6 hours
prior to the imaging. Patient who had a history of allergy and/or asthma was prescribed with
oral prednisolone 50mg (to be taken 13 hours, 7 hours and 1 hour before imaging). Oral
Metoprolol 100mg -150mg and oral Lorazepam 1 mg were given to all patients with heart rate
> 60 beats/minute. Sublingual GTN 0.5 mg was given to all patients prior to commencement
of CCTA.
4.3.2 CCTA protocol
All patients were scanned using a dual source 64-slice CT scanner (Sensation 64 Cardiac,
Siemens Medical Systems, Forchheim, Germany). An initial non enhanced ECG-gated scan
was performed for calcium scoring. An initial bolus-timing single-slice scan using 10 mls of
contrast (intravenous Ultravist with iodine content 370 mg/ml) followed by a 50 mls saline
chaser was done. Subsequently, a contrast scan was performed using 50-60mls of contrast
injected through an 18G branula (minimum size requirement) preferably located antecubital
vein at 6 mls/s followed by 50 mls saline chaser.
The scan parameters were: 64 x 0.6 mm collimation with dual focal spots per detector row;
rotation time 330 ms; table feed 3.8 mm/ rotation; tube voltage 120 kV; effective mA 750 to
850; volumetric CT dose index 297 - 1171 mGy and; with tube current modulation. Temporal
resolution ranges between 83 – 156 milliseconds depending on each patient’s heart rate.

42
Electrocardiographically gated datasets were reconstructed automatically at 65% of the R-R
cycle length and 35% of the R-R cycle length to approximate end-systole and end-diastole
respectively. Additional reconstruction windows were constructed after examination of
datasets if any motion artifacts were present.
4.4 CCTA DATA EVALUATION
Data analysis was conducted in the CT scan suite (C1), Department of Biomedical Imaging,
University Malaya Medical Centre, Kuala Lumpur. Data sets were transferred to an image
processing workstation (Leonardo; Siemens Medical Solutions) prior to evaluation. All
images were analyzed and interpreted immediately after scanning by an experience
radiologist with more than 10 years of experience in cardiac imaging blinded to patient’s
identity. Images were initially displayed at the predefined image display setting (window 700
Hounsfield units, level 200 Hounsfield units) and adjustment of the window and level settings
were performed at the discretion of the observer if deemed necessary.
4.4.1 Coronary artery calcium score
The coronary artery calcium scores of all patients were calculated with a dedicated software
tool and quantified as Agatston score. The Agatston score is based on the extent of coronary
artery calcification detected by an unenhanced CT scan. It is a commonly used scoring
method that calculates the highest calcified speck density of a specific coronary artery that is
measured in Hounsfield unit which is subsequently converted to a density score. The density
score obtained is then multiplied by the area covered in square millimeters to give the scoring
for the particular calcified speck giving the weighted density score. The total coronary artery
calcium score is calculated by adding up the weighted density score obtained for every
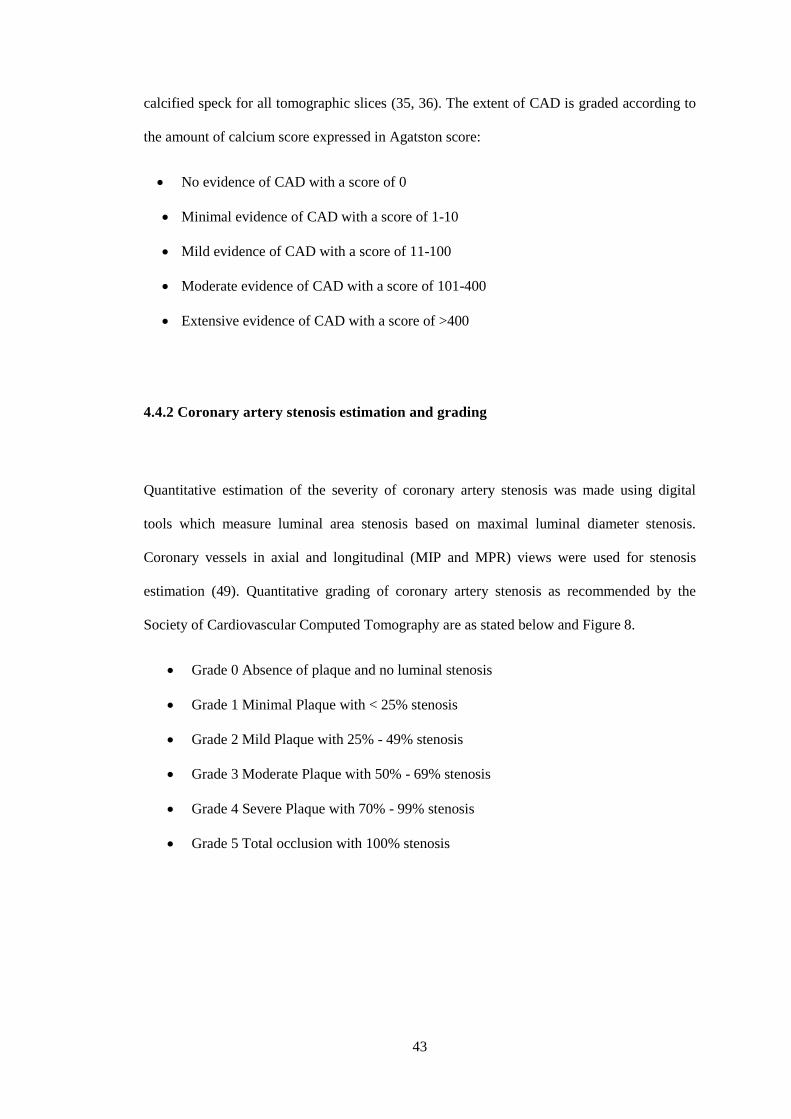
43
calcified speck for all tomographic slices (35, 36). The extent of CAD is graded according to
the amount of calcium score expressed in Agatston score:
• No evidence of CAD with a score of 0
• Minimal evidence of CAD with a score of 1-10
• Mild evidence of CAD with a score of 11-100
• Moderate evidence of CAD with a score of 101-400
• Extensive evidence of CAD with a score of >400
4.4.2 Coronary artery stenosis estimation and grading
Quantitative estimation of the severity of coronary artery stenosis was made using digital
tools which measure luminal area stenosis based on maximal luminal diameter stenosis.
Coronary vessels in axial and longitudinal (MIP and MPR) views were used for stenosis
estimation (49). Quantitative grading of coronary artery stenosis as recommended by the
Society of Cardiovascular Computed Tomography are as stated below and Figure 8.
• Grade 0 Absence of plaque and no luminal stenosis
• Grade 1 Minimal Plaque with < 25% stenosis
• Grade 2 Mild Plaque with 25% - 49% stenosis
• Grade 3 Moderate Plaque with 50% - 69% stenosis
• Grade 4 Severe Plaque with 70% - 99% stenosis
• Grade 5 Total occlusion with 100% stenosis
44
a b c d e
Figure 8: Recommended quantitative grading of coronary artery stenosis by CCTA. (a) No
luminal stenosis. (b) Mild luminal stenosis or less than 25% stenosis. (c) Minimal luminal
stenosis or 25% to 49% stenosis. (d) Moderate luminal stenosis or 50% to 69% stenosis. (3)
Severe luminal stenosis or 70%-99% stenosis. Arrows pointing to the area of coronary
stenosis (50).
4.5 VIRTUAL INRATVASCULAR ENDOSCOPY (VIE) DATA EVALUATION
CCTA data obtained from Department of Biomedical Imaging, University Malaya Medical
Centre, Kuala Lumpur were sent to Department of Medical Radiation Sciences, Curtin
University of Technology, Perth, Australia for interpretation. The data in the original DICOM
(digital imaging and communications in medicine) images were transferred to a another
workstation equipped with Analyze V 11.0 (AnalyzeDirect, Inc, Lexana, KS) for image post-
processing and generation of 3D VIE images. VIE images were generated by an observer with
>15 years of working experience in 3D VIE imaging of cardiovascular disease. VIE images of

45
the LAD artery, LCX artery and RCA are depicted in Figure 9 and 10. Non-significant
coronary artery disease was determined with <50% luminal narrowing while significant
coronary artery disease was determined with ≥ 50% lumen stenosis as assessed on CCTA/VIE
measurements (7).
Figure 9: Coronary VIE views of the left main stem, LAD and LCX arteries. (a) Coronary
VIE view of the left main stem ostium. (b) Coronary VIE view of left main stem bifurcation
showing the LAD and LCX ostia. (c) Coronary VIE view of the LAD ostium. (d) Coronary
VIE view of the LCX ostium (41).

46
Figure 10: Coronary VIE of right coronary artery ostium from the proximal, middle and distal
views with normal intraluminal appearance (41).
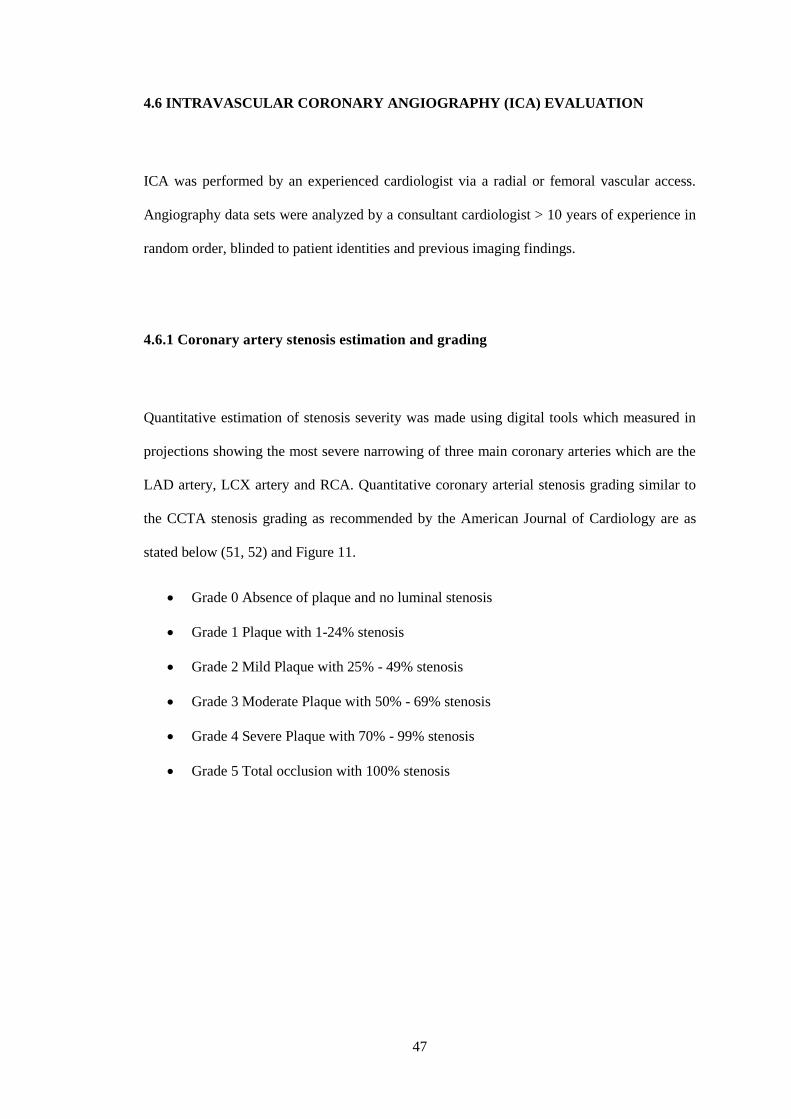
47
4.6 INTRAVASCULAR CORONARY ANGIOGRAPHY (ICA) EVALUATION
ICA was performed by an experienced cardiologist via a radial or femoral vascular access.
Angiography data sets were analyzed by a consultant cardiologist > 10 years of experience in
random order, blinded to patient identities and previous imaging findings.
4.6.1 Coronary artery stenosis estimation and grading
Quantitative estimation of stenosis severity was made using digital tools which measured in
projections showing the most severe narrowing of three main coronary arteries which are the
LAD artery, LCX artery and RCA. Quantitative coronary arterial stenosis grading similar to
the CCTA stenosis grading as recommended by the American Journal of Cardiology are as
stated below (51, 52) and Figure 11.
• Grade 0 Absence of plaque and no luminal stenosis
• Grade 1 Plaque with 1-24% stenosis
• Grade 2 Mild Plaque with 25% - 49% stenosis
• Grade 3 Moderate Plaque with 50% - 69% stenosis
• Grade 4 Severe Plaque with 70% - 99% stenosis
• Grade 5 Total occlusion with 100% stenosis

48
a b c
d e f
Figure 11: Recommended quantitative grading of coronary artery stenosis by ICA. (a) No
luminal stenosis. (b) Mild luminal stenosis or less than 25% stenosis. (c) Minimal luminal
stenosis or 25% to 49% stenosis. (d) Moderate luminal stenosis or 50% to 69% stenosis. (e)
Severe luminal stenosis or 70%-99% stenosis. (f) Complete total occlusion or 100% stenosis.
However for analysis purposes, comparison of the degree of coronary lumen stenosis between
CCTA and ICA is classified into:
• no stenosis
• mild stenosis (<50%)
• moderate stenosis (50%–69%)
• severe stenosis (≥70%)
Non-significant coronary artery disease was determined with <50% luminal narrowing (no to
mild stenosis) while significant coronary artery disease was determined with ≥ 50% lumen
narrowing (moderate to severe stenosis) as assessed on ICA measurements.

49
4.7 STATISTICAL ANALYSIS
All data were analyzed using SPSS 21.0 (SPSS Inc, Chicago, IL). Firstly, the normality of
data was tested using Shapiro Wilk test. Since most of the data were not normally distributed
and the sample sizes were small, non-parametric statistical tests were used in the subsequent
analysis. Mann Whitney U test was used to compare the calcium scores for different risk
factor groups which were history of smoking, diabetes mellitus, dyslipidemia, hypertension,
stroke and family history of CAD. Using ICA as the gold standard, sensitivity, specificity,
accuracy, positive predictive value (PPV) and negative predictive value (NPV) for the
detection of significant coronary artery stenosis (≥ 50%) on CCTA were calculated for each
individual segments (proximal, mid, distal) of each major coronary arteries (LAD, LCX,
RCA). The formula to calculate these values are presented in Table 2.
Table 2: Coronary artery stenosis detection of between CCTA/VIE and ICA.
CCTA/VIE
Coronary artery
ICA Coronary artery
Total
No stenosis Significant stenosis
No stenosis True negative (TN) False negative
(FN)
TN + FN
Significant stenosis False positive (FP) True positive (TP) FP + TP
Total TN + FP TP + FN TN + FN + FP + TP
CCTA: Coronary computed tomography angiography; VIE: Virtual intravascular endoscopy;
ICA: Invasive coronary angiography
𝑆𝑒𝑛𝑠𝑖𝑡𝑖𝑣𝑖𝑡𝑦 =𝑇𝑃
𝑇𝑃 + 𝐹𝑁𝑥 100%
𝑆𝑝𝑒𝑐𝑖𝑓𝑖𝑐𝑖𝑡𝑦 =𝑇𝑁
𝑇𝑁 + 𝐹𝑃𝑥 100%
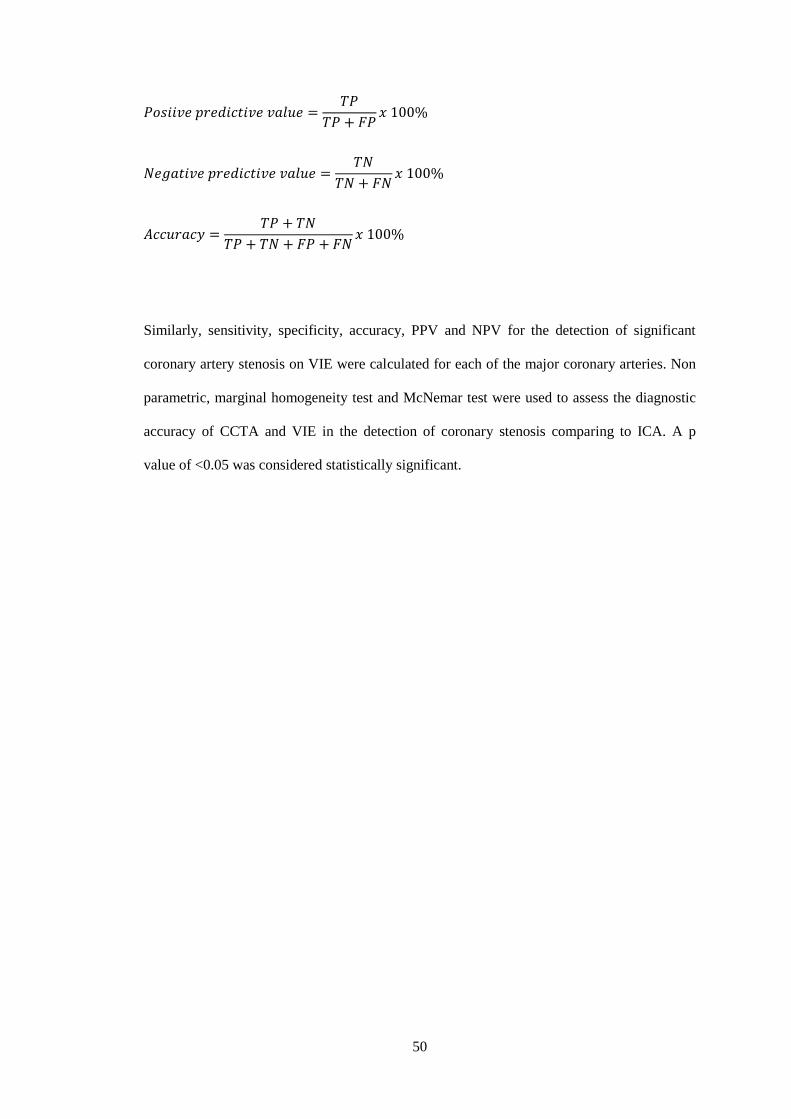
50
𝑃𝑜𝑠𝑖𝑖𝑣𝑒 𝑝𝑟𝑒𝑑𝑖𝑐𝑡𝑖𝑣𝑒 𝑣𝑎𝑙𝑢𝑒 =𝑇𝑃
𝑇𝑃 + 𝐹𝑃𝑥 100%
𝑁𝑒𝑔𝑎𝑡𝑖𝑣𝑒 𝑝𝑟𝑒𝑑𝑖𝑐𝑡𝑖𝑣𝑒 𝑣𝑎𝑙𝑢𝑒 =𝑇𝑁
𝑇𝑁 + 𝐹𝑁𝑥 100%
𝐴𝑐𝑐𝑢𝑟𝑎𝑐𝑦 =𝑇𝑃 + 𝑇𝑁
𝑇𝑃 + 𝑇𝑁 + 𝐹𝑃 + 𝐹𝑁𝑥 100%
Similarly, sensitivity, specificity, accuracy, PPV and NPV for the detection of significant
coronary artery stenosis on VIE were calculated for each of the major coronary arteries. Non
parametric, marginal homogeneity test and McNemar test were used to assess the diagnostic
accuracy of CCTA and VIE in the detection of coronary stenosis comparing to ICA. A p
value of <0.05 was considered statistically significant.

51
CHAPTER FIVE
5.0 RESULTS
5.1 PATIENT DEMOGRAPHICS
There were 131 patients with a high calcium score of > 400 identified for this study. Out of
this, 103 patients proceeded with CCTA and not in the exclusion criteria were recruited. The
age range of the 103 recruited patients was between 26 to 86 years old with mean age of 66.7
± 10.7 years. Figure 12 shows the age distribution of patients. Distribution of ethnicity
revealed 38 patients were Chinese (36.9%), 33 patients were Indian (32.0%), 22 patients were
Malay (21.4%) and 10 patients were from other races (9.7%) Figure 13 shows the ethnicity
distribution of patients. Number of male patients recruited for the study was 57 (55.3%) and
female patients were 46 (44.7%) Figure 14 shows the gender distribution of patients.

52
Figure 12: Age distribution of patients included in the study.
Figure 13: Ethnicity distribution of patients included in the study.
21.4%
36.9%
32%
9.7%
Ethnicity of study patients
Malay
Chinese
Indian
Others
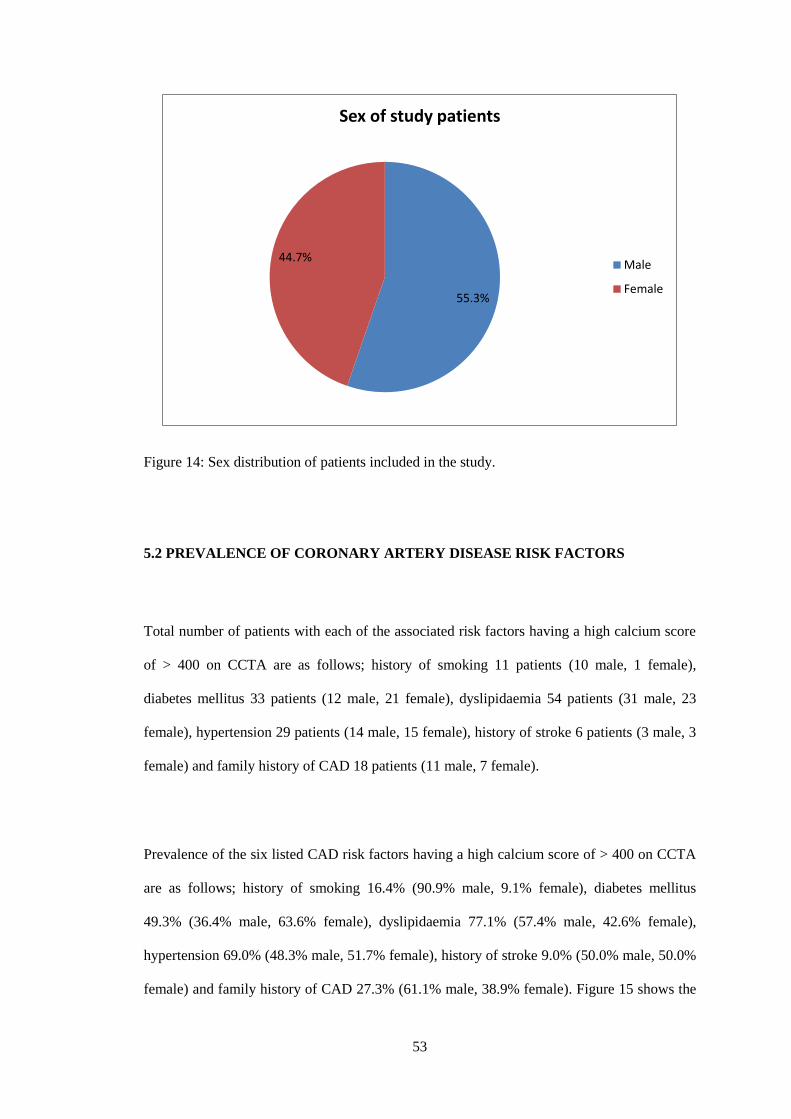
53
Figure 14: Sex distribution of patients included in the study.
5.2 PREVALENCE OF CORONARY ARTERY DISEASE RISK FACTORS
Total number of patients with each of the associated risk factors having a high calcium score
of > 400 on CCTA are as follows; history of smoking 11 patients (10 male, 1 female),
diabetes mellitus 33 patients (12 male, 21 female), dyslipidaemia 54 patients (31 male, 23
female), hypertension 29 patients (14 male, 15 female), history of stroke 6 patients (3 male, 3
female) and family history of CAD 18 patients (11 male, 7 female).
Prevalence of the six listed CAD risk factors having a high calcium score of > 400 on CCTA
are as follows; history of smoking 16.4% (90.9% male, 9.1% female), diabetes mellitus
49.3% (36.4% male, 63.6% female), dyslipidaemia 77.1% (57.4% male, 42.6% female),
hypertension 69.0% (48.3% male, 51.7% female), history of stroke 9.0% (50.0% male, 50.0%
female) and family history of CAD 27.3% (61.1% male, 38.9% female). Figure 15 shows the
55.3%
44.7%
Sex of study patients
Male
Female
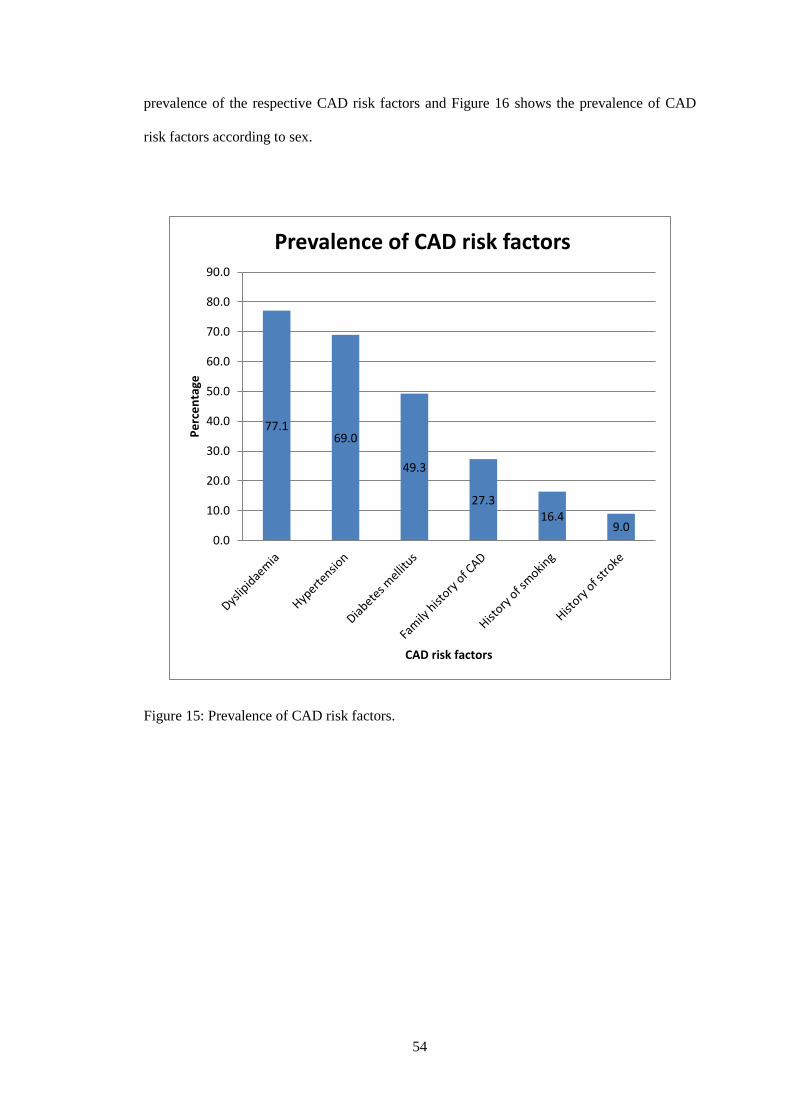
54
prevalence of the respective CAD risk factors and Figure 16 shows the prevalence of CAD
risk factors according to sex.
Figure 15: Prevalence of CAD risk factors.
77.169.0
49.3
27.316.4
9.00.0
10.0
20.0
30.0
40.0
50.0
60.0
70.0
80.0
90.0
Pe
rce
nta
ge
CAD risk factors
Prevalence of CAD risk factors

55
Figure 16: Prevalence of CAD risk factors according to sex.
90.9
36.4
57.448.3 50.0
61.1
9.1
63.6
42.651.7 50.0
38.9
0%
10%
20%
30%
40%
50%
60%
70%
80%
90%
100%
Per
cen
tage
CAD risk factors
Sex distribution of CAD risk factors
Female
Male

56
5.3 COMPARISON OF CALCIUM SCORES FOR DIFFERENT CAD RISK
FACTORS
Comparison of calcium score for different risk factors are shown in Figure 17 (history of
smoking), Figure 18 (diabetes mellitus), Figure 19 (dyslipidaemia), Figure 20 (hypertension),
Figure 21 (history of stroke) and Figure 22 (family history of CAD).
Figure 17: Box plot showing comparison of calcium score with history of smoking.
p = 0.746
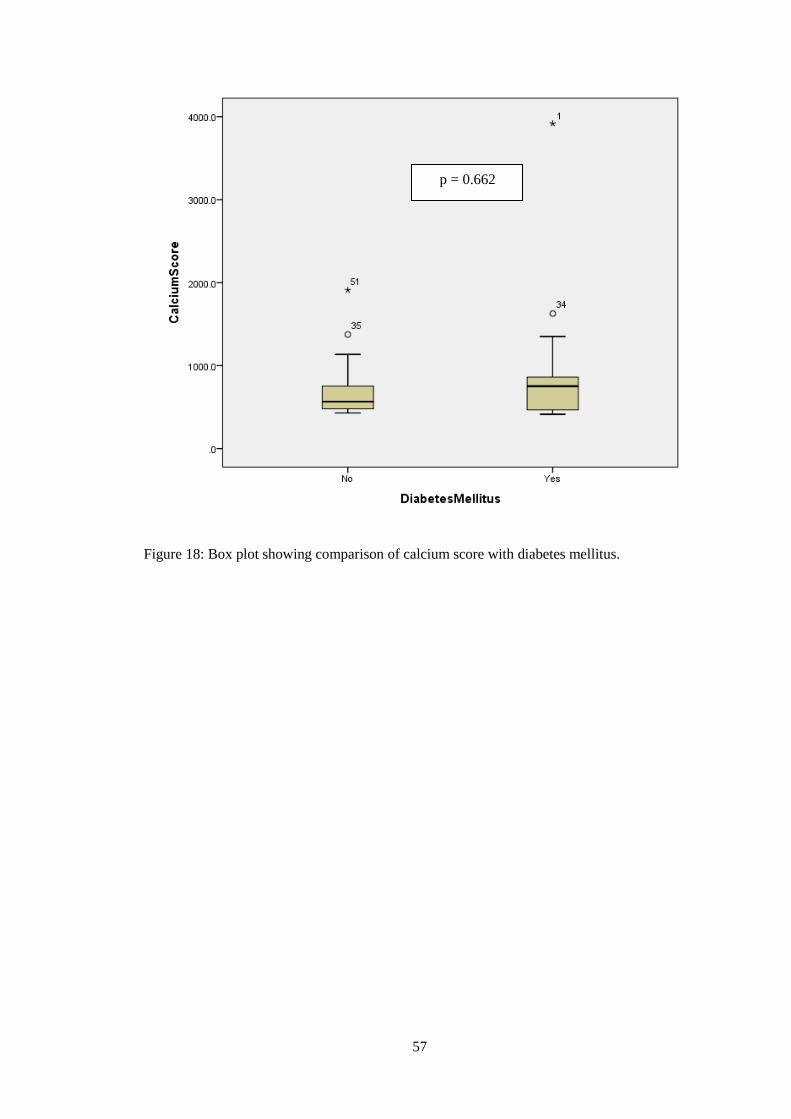
57
Figure 18: Box plot showing comparison of calcium score with diabetes mellitus.
p = 0.662
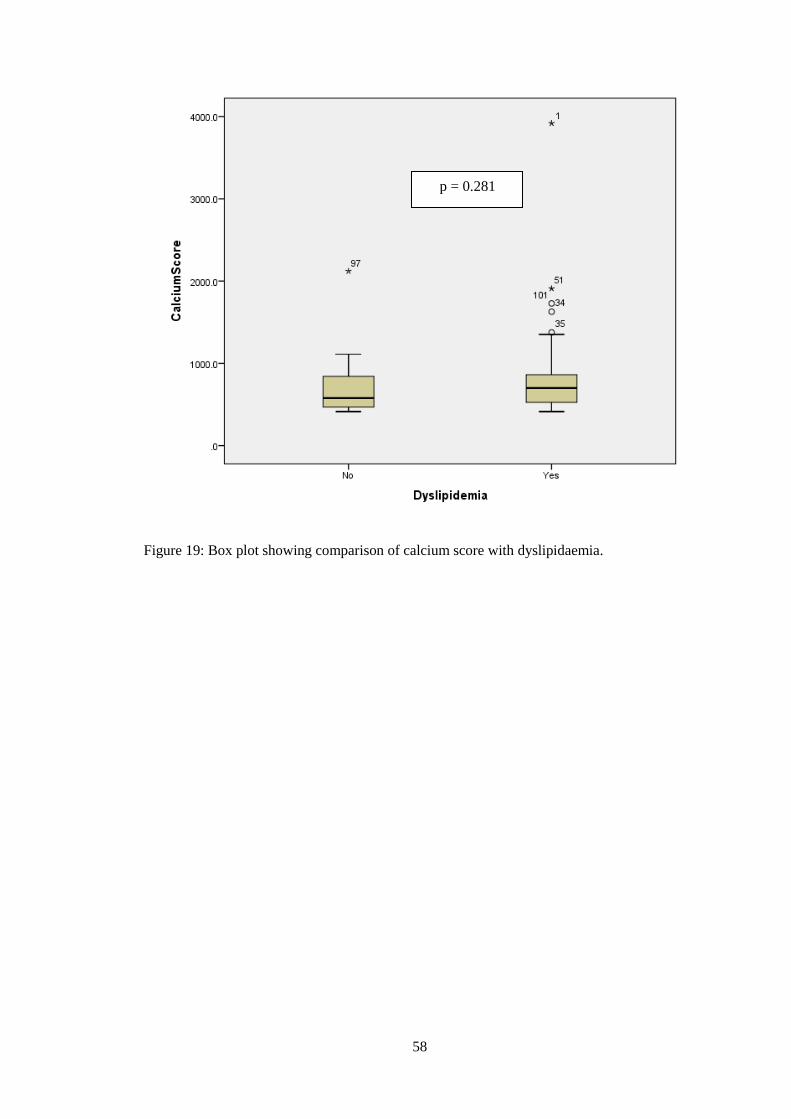
58
Figure 19: Box plot showing comparison of calcium score with dyslipidaemia.
p = 0.281
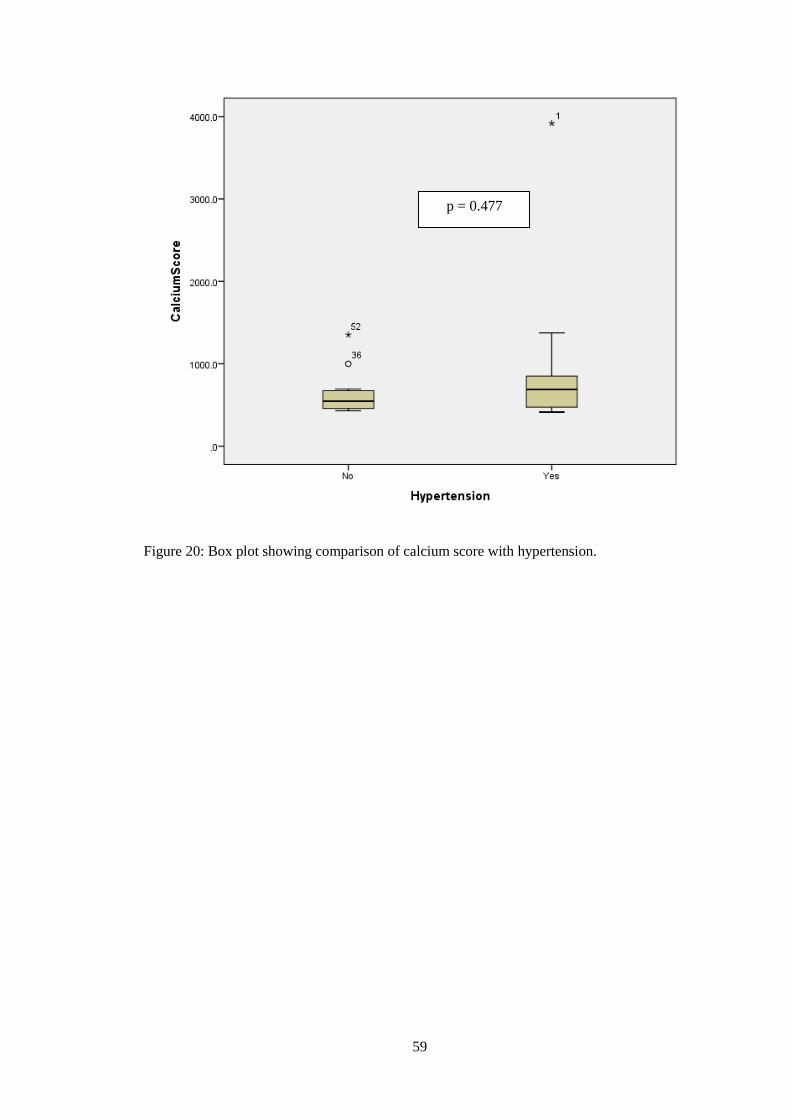
59
Figure 20: Box plot showing comparison of calcium score with hypertension.
p = 0.477
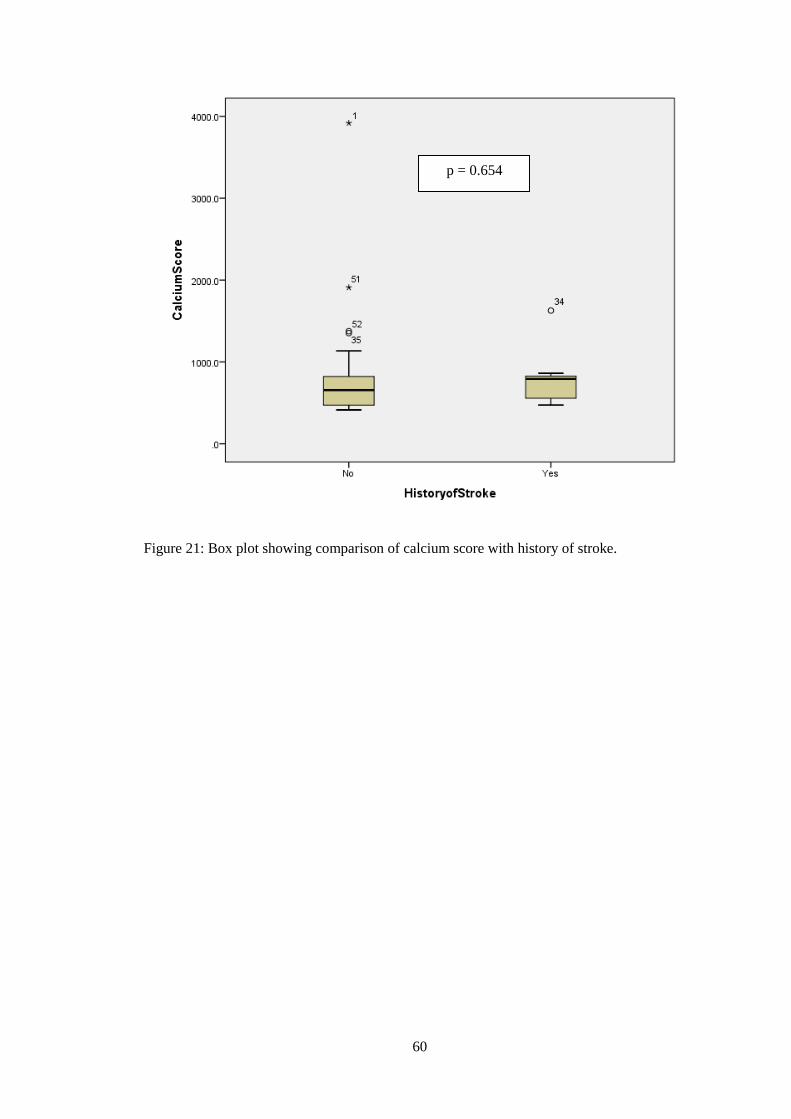
60
Figure 21: Box plot showing comparison of calcium score with history of stroke.
p = 0.654
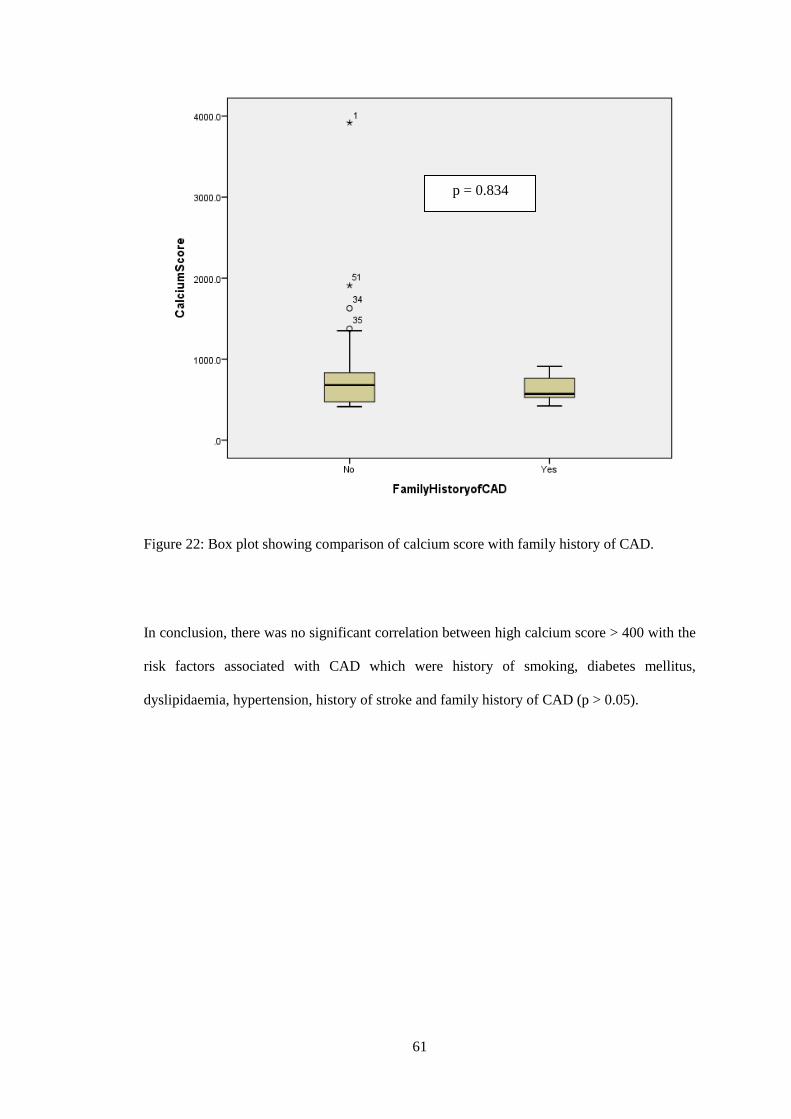
61
Figure 22: Box plot showing comparison of calcium score with family history of CAD.
In conclusion, there was no significant correlation between high calcium score > 400 with the
risk factors associated with CAD which were history of smoking, diabetes mellitus,
dyslipidaemia, hypertension, history of stroke and family history of CAD (p > 0.05).
p = 0.834

62
5.4 PREVALENCE OF CORONARY ARTERY STENOSIS ACCORDING TO
SEVERITY AND NUMBER OF VESSELS INVOLVED
The severity of the LAD artery, LCX artery and RCA are classified into no stenosis, mild
stenosis, moderate stenosis and severe stenosis. The prevalence of the LAD artery, LCX
artery and RCA in relation to the severity of arterial stenosis are summarized in Table 3 and
depicted in Figure 23. Significant coronary artery stenosis is taken as luminal stenosis of
≥50%. The three main coronary arteries were assessed for significant coronary artery stenosis
throughout its length and the prevalence are summarized in Table 4 and depicted in Figure 24.
Table 3: Prevalence of severity of coronary artery stenosis in CAD.
Number Percentage
LAD artery No 11 17.2%
Mild 10 15.6%
Moderate 12 18.8%
Severe 31 48.4%
Total 64 100.0%
LCX artery No 33 51.6%
Mild 11 17.2%
Moderate 11 17.2%
Severe 9 14.1%
Total 64 100.0%
RCA No 25 39.1%
Mild 9 14.1%
Moderate 16 25.0%
Severe 14 21.9%
Total 64 100.0%
LAD: Left anterior descending; LCX: Left circumflex; RCA: Right coronary artery

63
Figure 23: Prevalence of severity of coronary artery stenosis in CAD.
17.2
51.6
39.115.6
17.2
14.118.8
17.2
25.0
48.4
14.121.9
0%
10%
20%
30%
40%
50%
60%
70%
80%
90%
100%
Left anteriordescending artery
Left circumflexartery
Right coronaryartery
Per
cen
tage
Coronary arteries
Prevalence of degree of coronary artery stenosis
Severe
Moderate
Mild
No
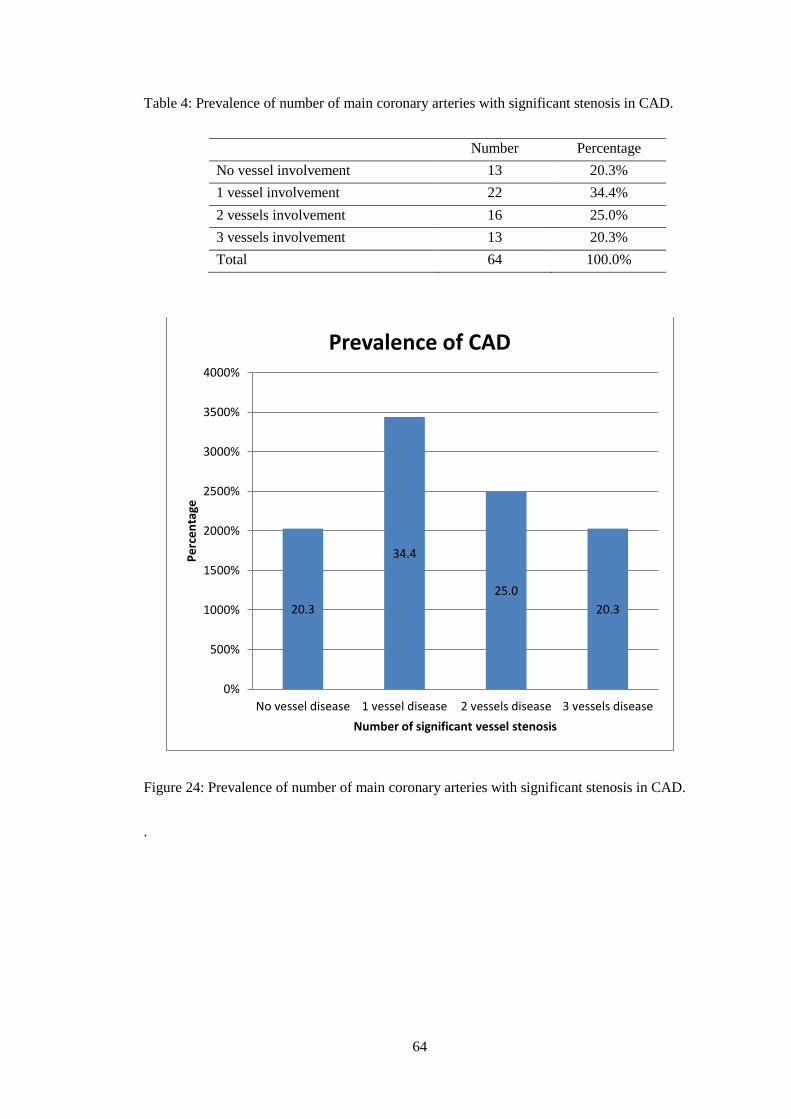
64
Table 4: Prevalence of number of main coronary arteries with significant stenosis in CAD.
Number Percentage
No vessel involvement 13 20.3%
1 vessel involvement 22 34.4%
2 vessels involvement 16 25.0%
3 vessels involvement 13 20.3%
Total 64 100.0%
Figure 24: Prevalence of number of main coronary arteries with significant stenosis in CAD.
.
20.3
34.4
25.0
20.3
0%
500%
1000%
1500%
2000%
2500%
3000%
3500%
4000%
No vessel disease 1 vessel disease 2 vessels disease 3 vessels disease
Pe
rce
nta
ge
Number of significant vessel stenosis
Prevalence of CAD
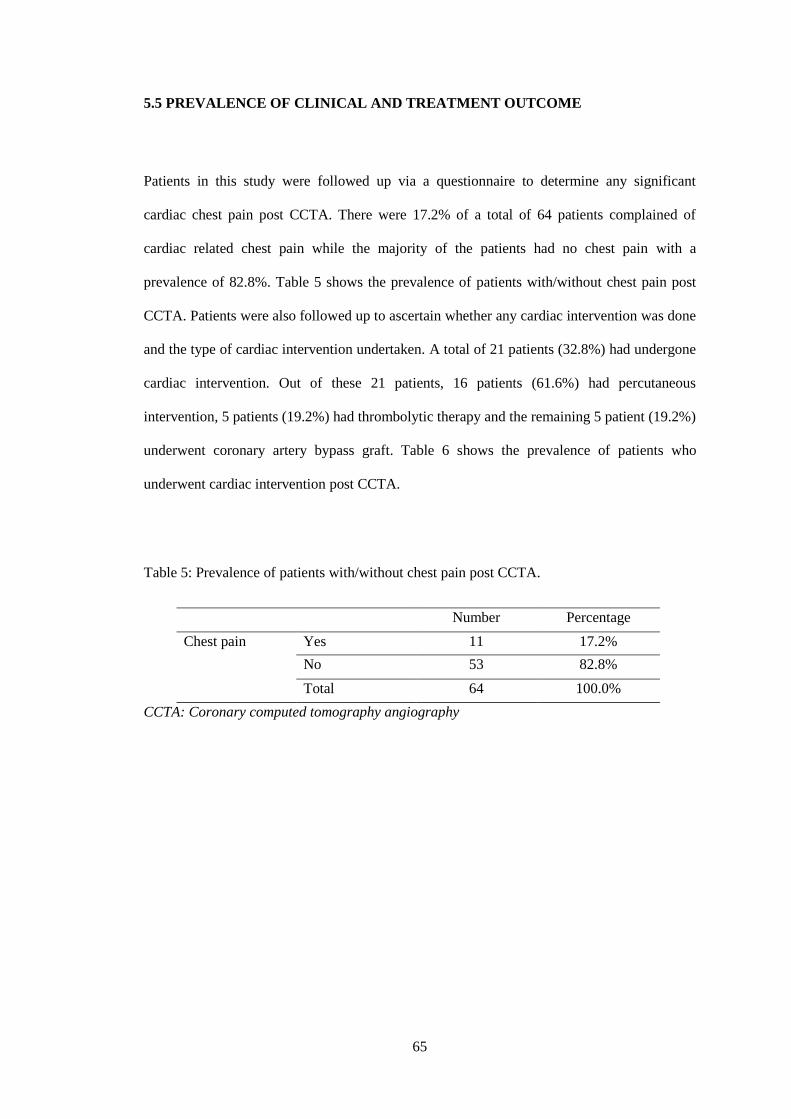
65
5.5 PREVALENCE OF CLINICAL AND TREATMENT OUTCOME
Patients in this study were followed up via a questionnaire to determine any significant
cardiac chest pain post CCTA. There were 17.2% of a total of 64 patients complained of
cardiac related chest pain while the majority of the patients had no chest pain with a
prevalence of 82.8%. Table 5 shows the prevalence of patients with/without chest pain post
CCTA. Patients were also followed up to ascertain whether any cardiac intervention was done
and the type of cardiac intervention undertaken. A total of 21 patients (32.8%) had undergone
cardiac intervention. Out of these 21 patients, 16 patients (61.6%) had percutaneous
intervention, 5 patients (19.2%) had thrombolytic therapy and the remaining 5 patient (19.2%)
underwent coronary artery bypass graft. Table 6 shows the prevalence of patients who
underwent cardiac intervention post CCTA.
Table 5: Prevalence of patients with/without chest pain post CCTA.
Number Percentage
Chest pain Yes 11 17.2%
No 53 82.8%
Total 64 100.0%
CCTA: Coronary computed tomography angiography
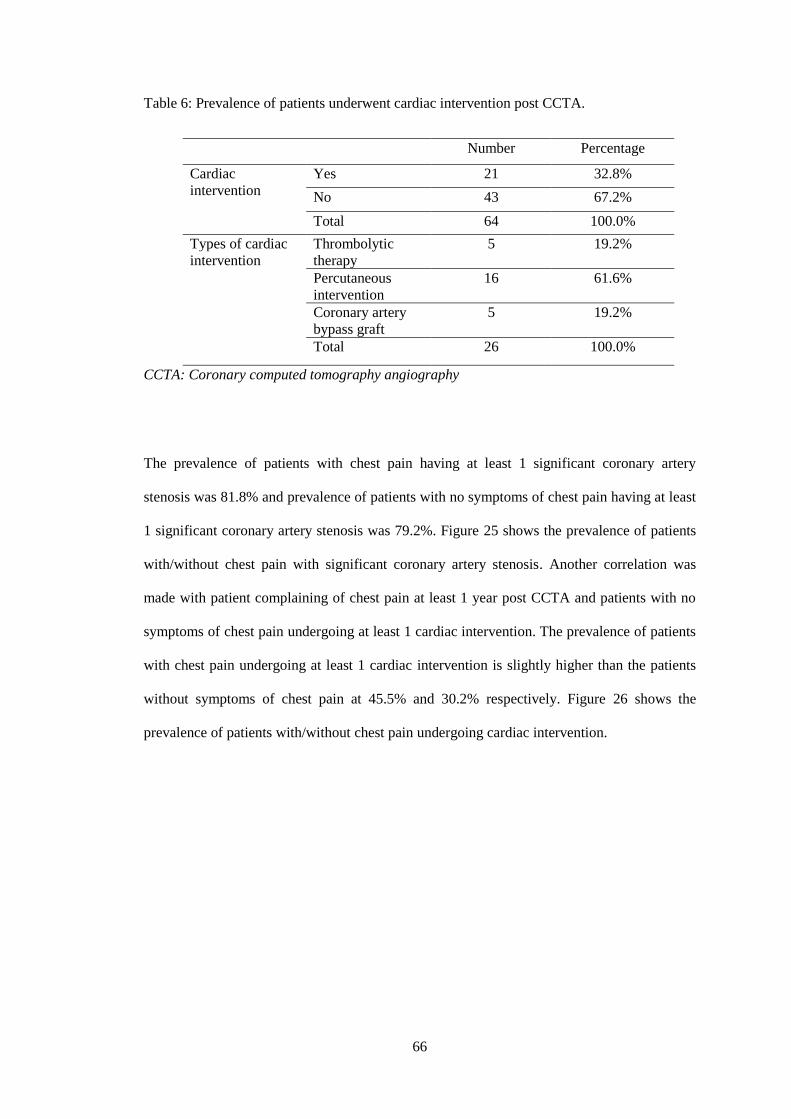
66
Table 6: Prevalence of patients underwent cardiac intervention post CCTA.
Number Percentage
Cardiac
intervention
Yes 21 32.8%
No 43 67.2%
Total 64 100.0%
Types of cardiac
intervention
Thrombolytic
therapy
5 19.2%
Percutaneous
intervention
16 61.6%
Coronary artery
bypass graft
5 19.2%
Total 26 100.0%
CCTA: Coronary computed tomography angiography
The prevalence of patients with chest pain having at least 1 significant coronary artery
stenosis was 81.8% and prevalence of patients with no symptoms of chest pain having at least
1 significant coronary artery stenosis was 79.2%. Figure 25 shows the prevalence of patients
with/without chest pain with significant coronary artery stenosis. Another correlation was
made with patient complaining of chest pain at least 1 year post CCTA and patients with no
symptoms of chest pain undergoing at least 1 cardiac intervention. The prevalence of patients
with chest pain undergoing at least 1 cardiac intervention is slightly higher than the patients
without symptoms of chest pain at 45.5% and 30.2% respectively. Figure 26 shows the
prevalence of patients with/without chest pain undergoing cardiac intervention.
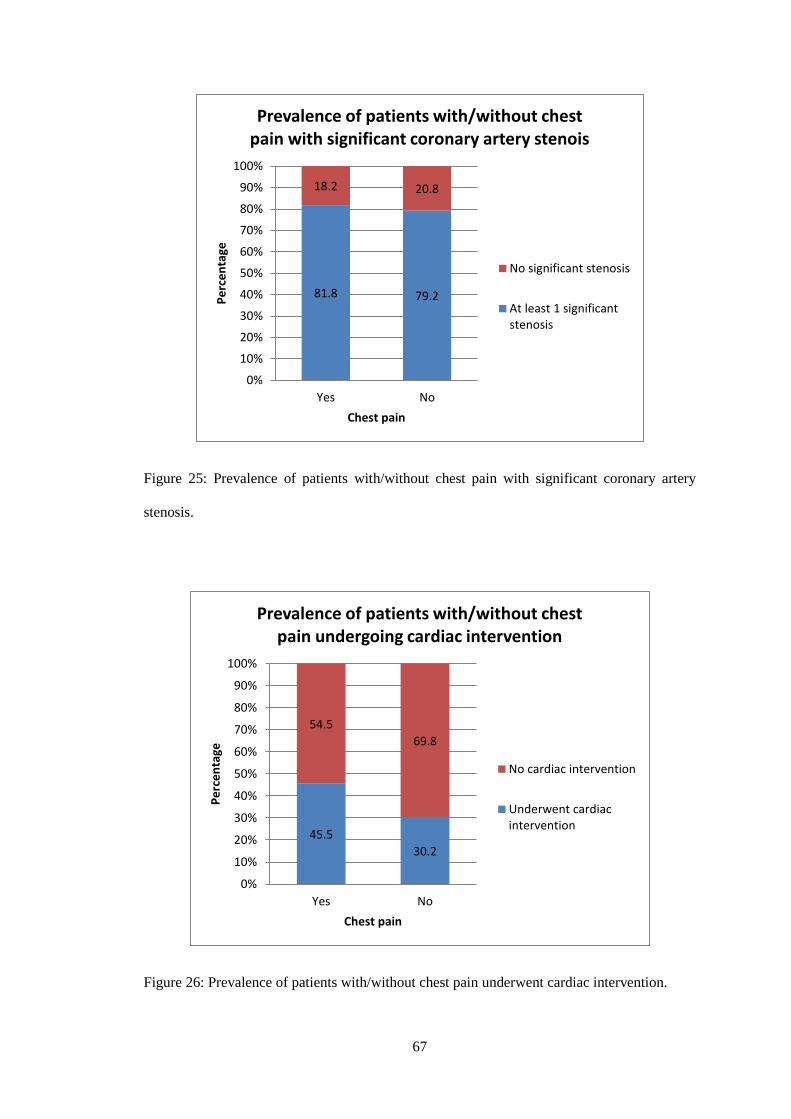
67
Figure 25: Prevalence of patients with/without chest pain with significant coronary artery
stenosis.
Figure 26: Prevalence of patients with/without chest pain underwent cardiac intervention.
81.8 79.2
18.2 20.8
0%
10%
20%
30%
40%
50%
60%
70%
80%
90%
100%
Yes No
Pe
rce
nta
ge
Chest pain
Prevalence of patients with/without chest pain with significant coronary artery stenois
No significant stenosis
At least 1 significantstenosis
45.5
30.2
54.5
69.8
0%
10%
20%
30%
40%
50%
60%
70%
80%
90%
100%
Yes No
Pe
rce
nta
ge
Chest pain
Prevalence of patients with/without chest pain undergoing cardiac intervention
No cardiac intervention
Underwent cardiacintervention

68
5.6 COMPARISON OF DEGREE OF STENOSIS BETWEEN CCTA AND ICA
A comparison was made between CCTA and ICA of the three major coronary arteries which
were the LAD artery, LCX artery and right coronary artery with regards to the severity of
stenosis. Each of these three vessels was further divided into proximal, mid and distal
segments with the degree of each coronary artery segment stenosis summarized in Table 7 to
Table 15.
Table 7: Degree of stenosis detection of proximal LAD artery between CCTA and ICA.
CCTA
Proximal LAD
artery
ICA Proximal LAD artery
p-
value No
stenosis
Mild
stenosis
Moderate
stenosis
Severe
stenosis
Total
No stenosis 8 2 0 2 12
0.028
*
Mild stenosis 4 0 0 0 4
Moderate
stenosis
2 2 0 2 6
Severe stenosis 5 2 2 4 13
Total 19 6 2 8 35
LAD: Left anterior descending; CCTA: Coronary computed tomography angiography; ICA:
Invasive coronary angiography
*p < 0.05 is considered statistically significant different.
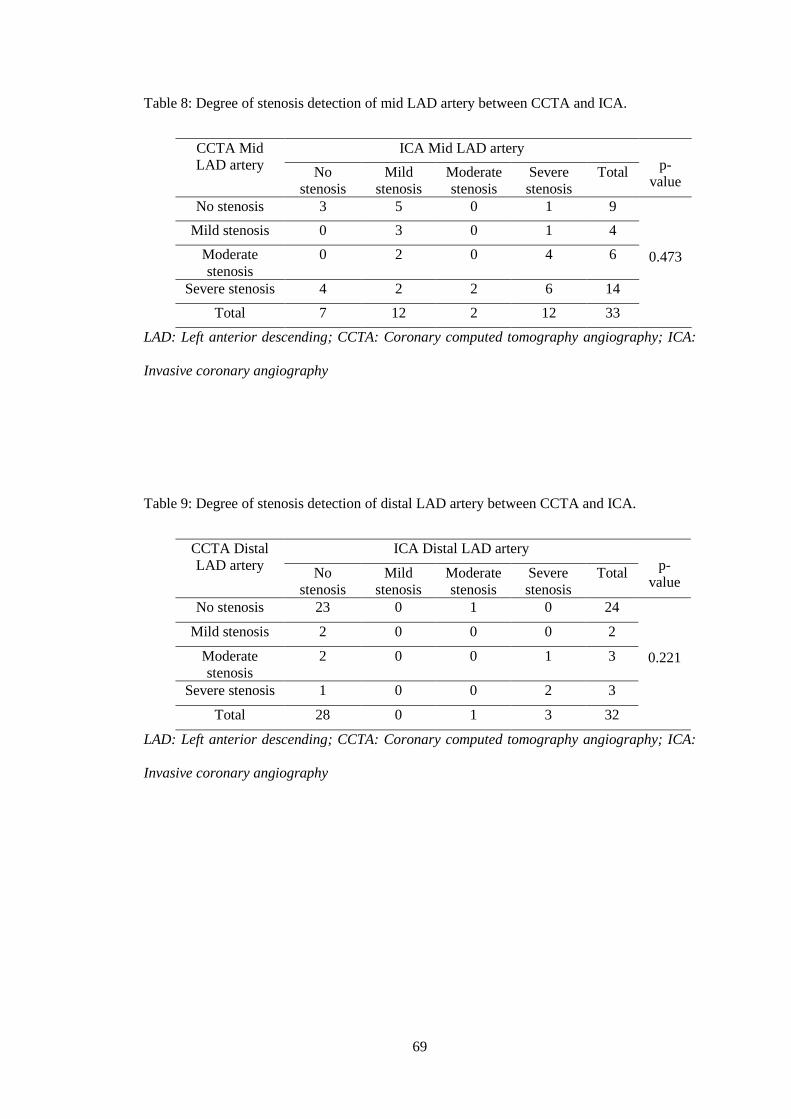
69
Table 8: Degree of stenosis detection of mid LAD artery between CCTA and ICA.
CCTA Mid
LAD artery
ICA Mid LAD artery
p-
value No
stenosis
Mild
stenosis
Moderate
stenosis
Severe
stenosis
Total
No stenosis 3 5 0 1 9
0.473
Mild stenosis 0 3 0 1 4
Moderate
stenosis
0 2 0 4 6
Severe stenosis 4 2 2 6 14
Total 7 12 2 12 33
LAD: Left anterior descending; CCTA: Coronary computed tomography angiography; ICA:
Invasive coronary angiography
Table 9: Degree of stenosis detection of distal LAD artery between CCTA and ICA.
CCTA Distal
LAD artery
ICA Distal LAD artery
p-
value No
stenosis
Mild
stenosis
Moderate
stenosis
Severe
stenosis
Total
No stenosis 23 0 1 0 24
0.221
Mild stenosis 2 0 0 0 2
Moderate
stenosis
2 0 0 1 3
Severe stenosis 1 0 0 2 3
Total 28 0 1 3 32
LAD: Left anterior descending; CCTA: Coronary computed tomography angiography; ICA:
Invasive coronary angiography
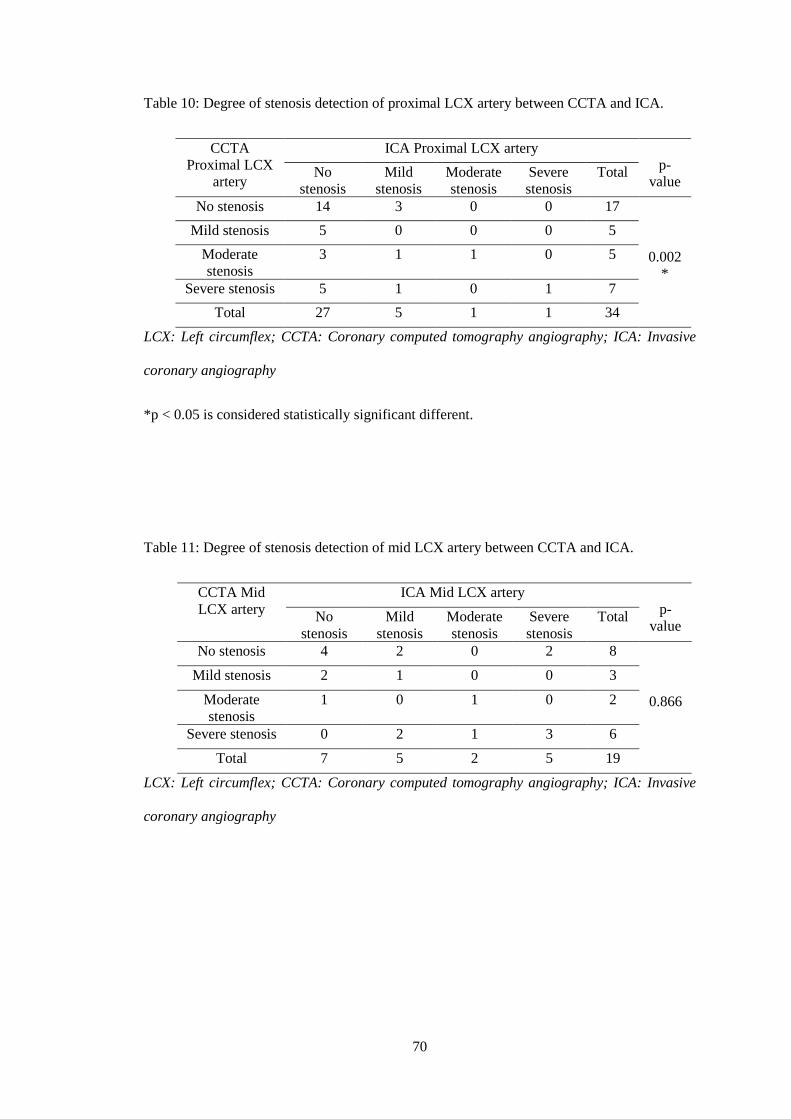
70
Table 10: Degree of stenosis detection of proximal LCX artery between CCTA and ICA.
CCTA
Proximal LCX
artery
ICA Proximal LCX artery
p-
value No
stenosis
Mild
stenosis
Moderate
stenosis
Severe
stenosis
Total
No stenosis 14 3 0 0 17
0.002
*
Mild stenosis 5 0 0 0 5
Moderate
stenosis
3 1 1 0 5
Severe stenosis 5 1 0 1 7
Total 27 5 1 1 34
LCX: Left circumflex; CCTA: Coronary computed tomography angiography; ICA: Invasive
coronary angiography
*p < 0.05 is considered statistically significant different.
Table 11: Degree of stenosis detection of mid LCX artery between CCTA and ICA.
CCTA Mid
LCX artery
ICA Mid LCX artery
p-
value No
stenosis
Mild
stenosis
Moderate
stenosis
Severe
stenosis
Total
No stenosis 4 2 0 2 8
0.866
Mild stenosis 2 1 0 0 3
Moderate
stenosis
1 0 1 0 2
Severe stenosis 0 2 1 3 6
Total 7 5 2 5 19
LCX: Left circumflex; CCTA: Coronary computed tomography angiography; ICA: Invasive
coronary angiography
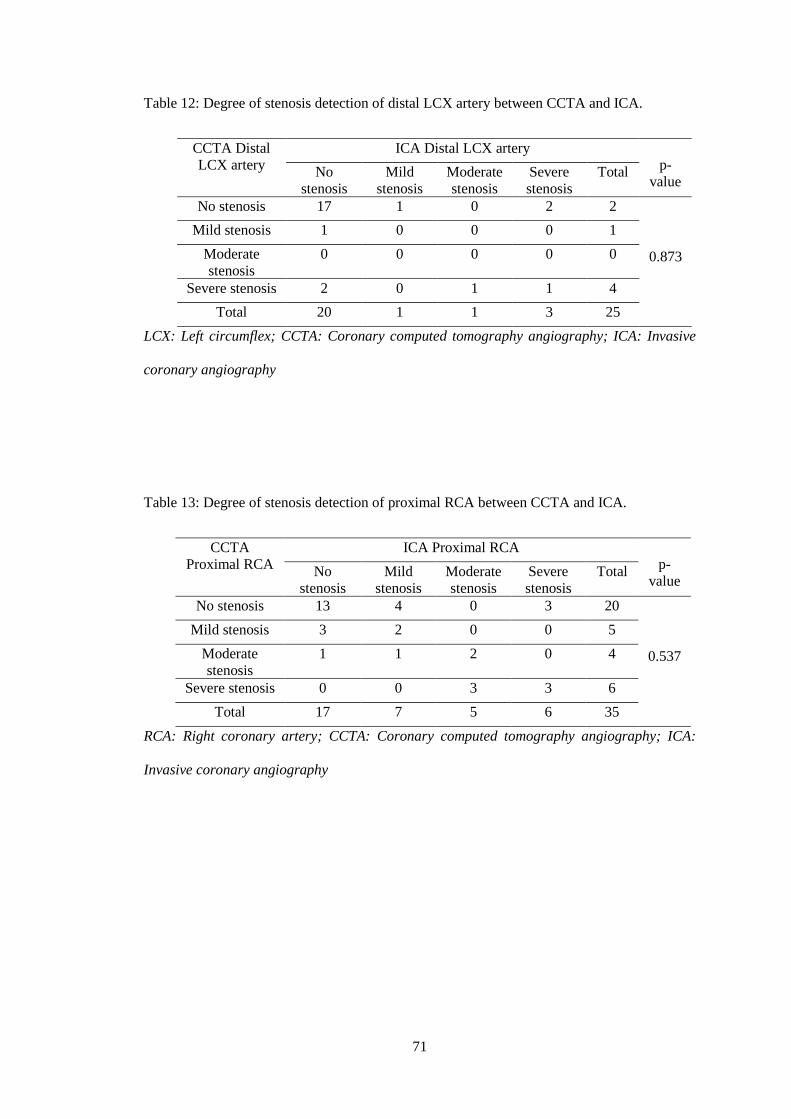
71
Table 12: Degree of stenosis detection of distal LCX artery between CCTA and ICA.
CCTA Distal
LCX artery
ICA Distal LCX artery
p-
value No
stenosis
Mild
stenosis
Moderate
stenosis
Severe
stenosis
Total
No stenosis 17 1 0 2 2
0.873
Mild stenosis 1 0 0 0 1
Moderate
stenosis
0 0 0 0 0
Severe stenosis 2 0 1 1 4
Total 20 1 1 3 25
LCX: Left circumflex; CCTA: Coronary computed tomography angiography; ICA: Invasive
coronary angiography
Table 13: Degree of stenosis detection of proximal RCA between CCTA and ICA.
CCTA
Proximal RCA
ICA Proximal RCA
p-
value No
stenosis
Mild
stenosis
Moderate
stenosis
Severe
stenosis
Total
No stenosis 13 4 0 3 20
0.537
Mild stenosis 3 2 0 0 5
Moderate
stenosis
1 1 2 0 4
Severe stenosis 0 0 3 3 6
Total 17 7 5 6 35
RCA: Right coronary artery; CCTA: Coronary computed tomography angiography; ICA:
Invasive coronary angiography
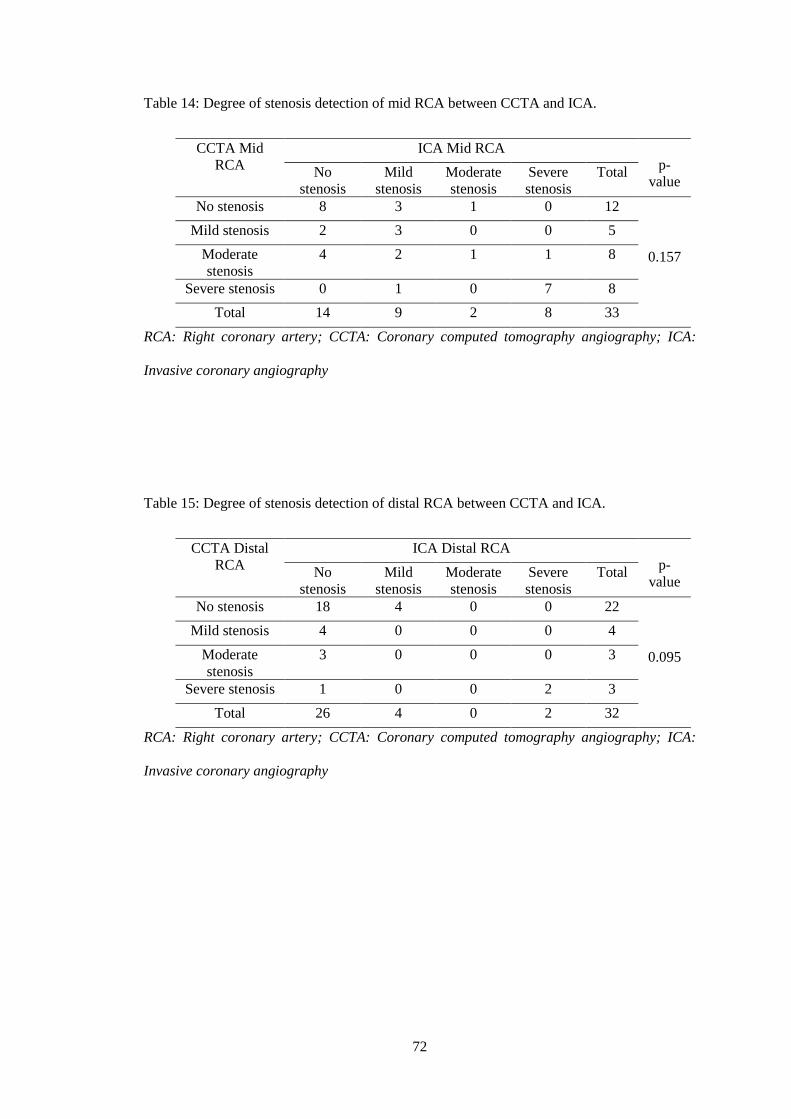
72
Table 14: Degree of stenosis detection of mid RCA between CCTA and ICA.
CCTA Mid
RCA
ICA Mid RCA
p-
value No
stenosis
Mild
stenosis
Moderate
stenosis
Severe
stenosis
Total
No stenosis 8 3 1 0 12
0.157
Mild stenosis 2 3 0 0 5
Moderate
stenosis
4 2 1 1 8
Severe stenosis 0 1 0 7 8
Total 14 9 2 8 33
RCA: Right coronary artery; CCTA: Coronary computed tomography angiography; ICA:
Invasive coronary angiography
Table 15: Degree of stenosis detection of distal RCA between CCTA and ICA.
CCTA Distal
RCA
ICA Distal RCA
p-
value No
stenosis
Mild
stenosis
Moderate
stenosis
Severe
stenosis
Total
No stenosis 18 4 0 0 22
0.095
Mild stenosis 4 0 0 0 4
Moderate
stenosis
3 0 0 0 3
Severe stenosis 1 0 0 2 3
Total 26 4 0 2 32
RCA: Right coronary artery; CCTA: Coronary computed tomography angiography; ICA:
Invasive coronary angiography

73
The sensitivity, specificity, PPV, NPV and accuracy were calculated for each of the proximal,
mid and distal segments of the left anterior descending artery, left circumflex artery and right
coronary artery. Table 16 shows the results of significant coronary artery stenosis detection
between CCTA and ICA.
Table 16: Receiver operating characteristic (ROC) results of the degree of stenosis by CCTA
in comparison to the gold standard, ICA.
LAD artery LCX artery RCA artery
Prox Mid Dist Prox Mid Dist Prox Mid Dist
Sensitivity
(%)
80.0 85.7 75.0 100 62.5 50.0 72.7 90.0 100
Specificity
(%)
54.2 57.9 89.3 68.8 72.7 90.5 91.7 69.6 86.2
PPV
(%)
42.1 60.0 50.0 9.1 62.5 50.0 80.0 56.3 33.3
NPV
(%)
86.7 84.6 96.1 100 72.7 90.5 88.0 94.1 100
Accuracy
(%)
61.8 69.7 87.5 69.7 68.4 84.0 85.7 78.8 87.1
LAD: Left anterior descending; LCX: Left circumflex; RCA: Right coronary artery; Prox:
proximal; Dist: distal; PPV: positive predictive value; NPV: negative predictive value.

74
Table 17 shows the summary of p-values obtained from the marginal homogeneity test for
significant arterial stenosis detection between CCTA and ICA for the respective coronary
arteries.
Table 17: p-value for significant arterial stenosis detection between CCTA and ICA.
Coronary artery Segments p-value
LAD artery Proximal 0.028*
Mid 0.473
Distal 0.221
LCX artery Proximal 0.002*
Mid 0.866
Distal 0.873
RCA Proximal 0.537
Mid 0.157
Distal 0.095
LAD: Left anterior descending; LCX: Left circumflex; RCA: Right coronary artery
*p < 0.05 is considered statistically significant different.
The results indicated that there was significant difference of the proximal left anterior
descending artery and proximal left circumflex artery stenosis between CCTA and ICA
modalities with p-value of 0.028 and 0.002 respectively. However, no significant difference is
noted in the rest of the coronary arteries (p > 0.05).

75
5.7 COMPARISON OF CORONARY STENOSIS BETWEEN VIE AND ICA
A comparison was made between 3D VIE reconstruction and ICA with three major coronary
arteries which were left anterior descending artery, left circumflex artery and right coronary
artery with regards to the significance of stenosis. The significant stenosis of each coronary
artery is summarized in Table 18 to Table 20.
Table 18: Degree of stenosis detection of LAD artery between 3D VIE and ICA.
3D-VIE LAD
artery
ICA LAD artery
p-value No stenosis Significant
stenosis
Total
No stenosis 1 0 1
0.125 Significant stenosis 4 8 12
Total 5 8 13
LAD: Left anterior descending; 3D-VIE: 3 dimensional virtual intravascular endoscopy;
ICA: Invasive coronary angiography
Table 19: Degree of stenosis detection of LCX artery between 3D VIE and ICA.
3D-VIE LCX
artery
ICA LCX artery
p-value No stenosis Significant
stenosis
Total
No stenosis 9 1 10
1.000 Significant stenosis 1 2 3
Total 10 3 13
LCX: Left circumflex; 3D-VIE: 3 dimensional virtual intravascular endoscopy; ICA: Invasive
coronary angiography
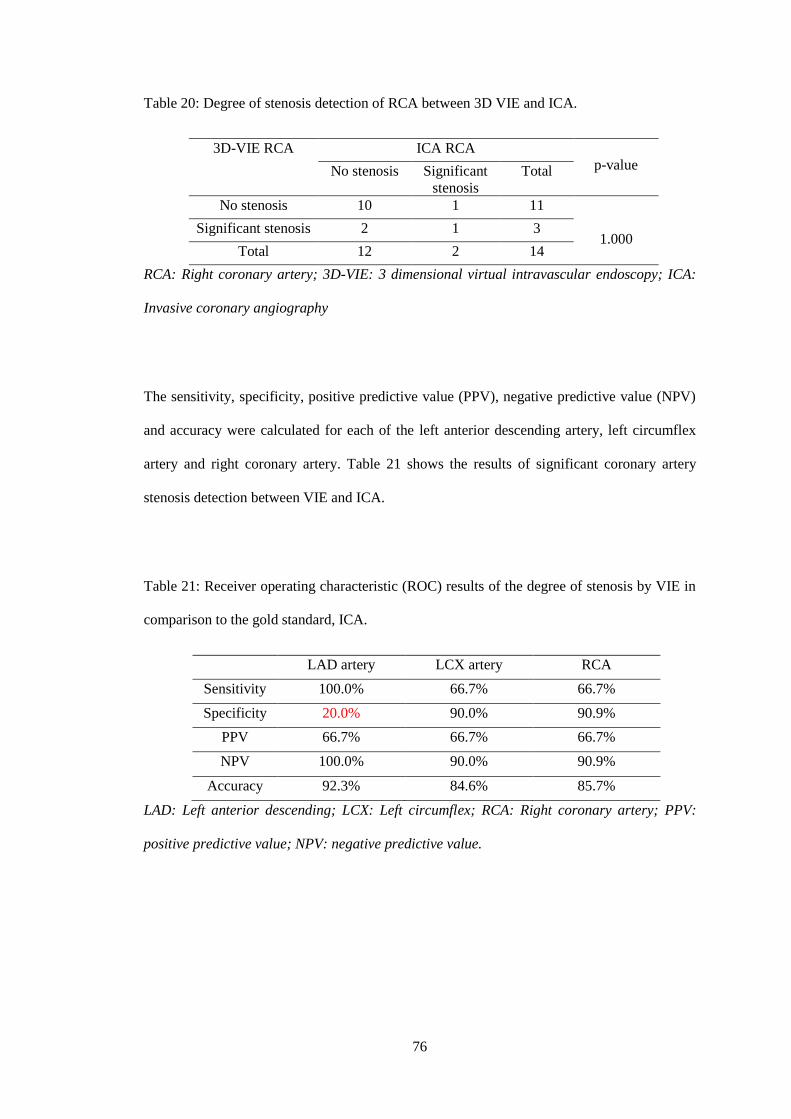
76
Table 20: Degree of stenosis detection of RCA between 3D VIE and ICA.
3D-VIE RCA ICA RCA
p-value No stenosis Significant
stenosis
Total
No stenosis 10 1 11
1.000 Significant stenosis 2 1 3
Total 12 2 14
RCA: Right coronary artery; 3D-VIE: 3 dimensional virtual intravascular endoscopy; ICA:
Invasive coronary angiography
The sensitivity, specificity, positive predictive value (PPV), negative predictive value (NPV)
and accuracy were calculated for each of the left anterior descending artery, left circumflex
artery and right coronary artery. Table 21 shows the results of significant coronary artery
stenosis detection between VIE and ICA.
Table 21: Receiver operating characteristic (ROC) results of the degree of stenosis by VIE in
comparison to the gold standard, ICA.
LAD artery LCX artery RCA
Sensitivity 100.0% 66.7% 66.7%
Specificity 20.0% 90.0% 90.9%
PPV 66.7% 66.7% 66.7%
NPV 100.0% 90.0% 90.9%
Accuracy 92.3% 84.6% 85.7%
LAD: Left anterior descending; LCX: Left circumflex; RCA: Right coronary artery; PPV:
positive predictive value; NPV: negative predictive value.
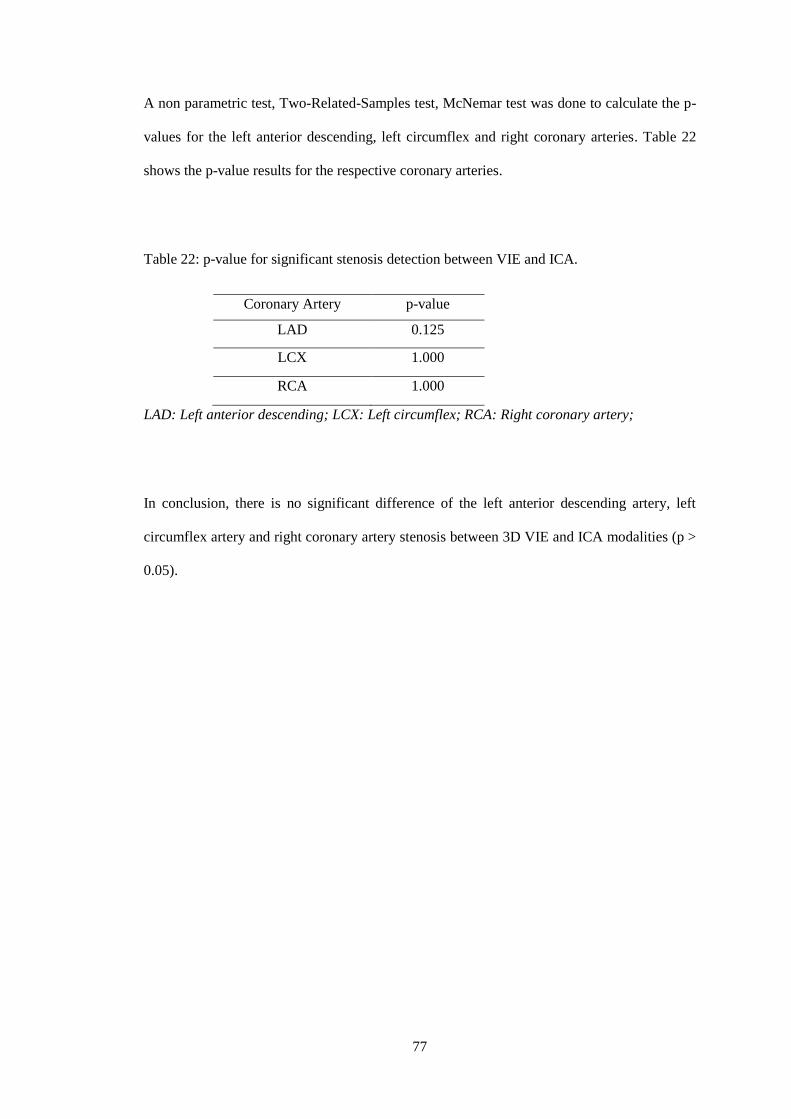
77
A non parametric test, Two-Related-Samples test, McNemar test was done to calculate the p-
values for the left anterior descending, left circumflex and right coronary arteries. Table 22
shows the p-value results for the respective coronary arteries.
Table 22: p-value for significant stenosis detection between VIE and ICA.
Coronary Artery p-value
LAD 0.125
LCX 1.000
RCA 1.000
LAD: Left anterior descending; LCX: Left circumflex; RCA: Right coronary artery;
In conclusion, there is no significant difference of the left anterior descending artery, left
circumflex artery and right coronary artery stenosis between 3D VIE and ICA modalities (p >
0.05).

78
5.8 RESULTS FROM GENERATION OF VIE IMAGES FROM CCTA
VIE images were generated from the CCTA data obtained from Department of Biomedical
Imaging, University Malaya Medical Centre, Kuala Lumpur. Images showing smooth
intraluminal plaque appearance of LAD artery, LCX artery and RCA are depicted in Figure
27, 28 and 29 respectively. Images showing irregular intraluminal plaque appearance of LAD
artery, LCX artery and RCA are depicted in Figure 30, 31 and 32 respectively.
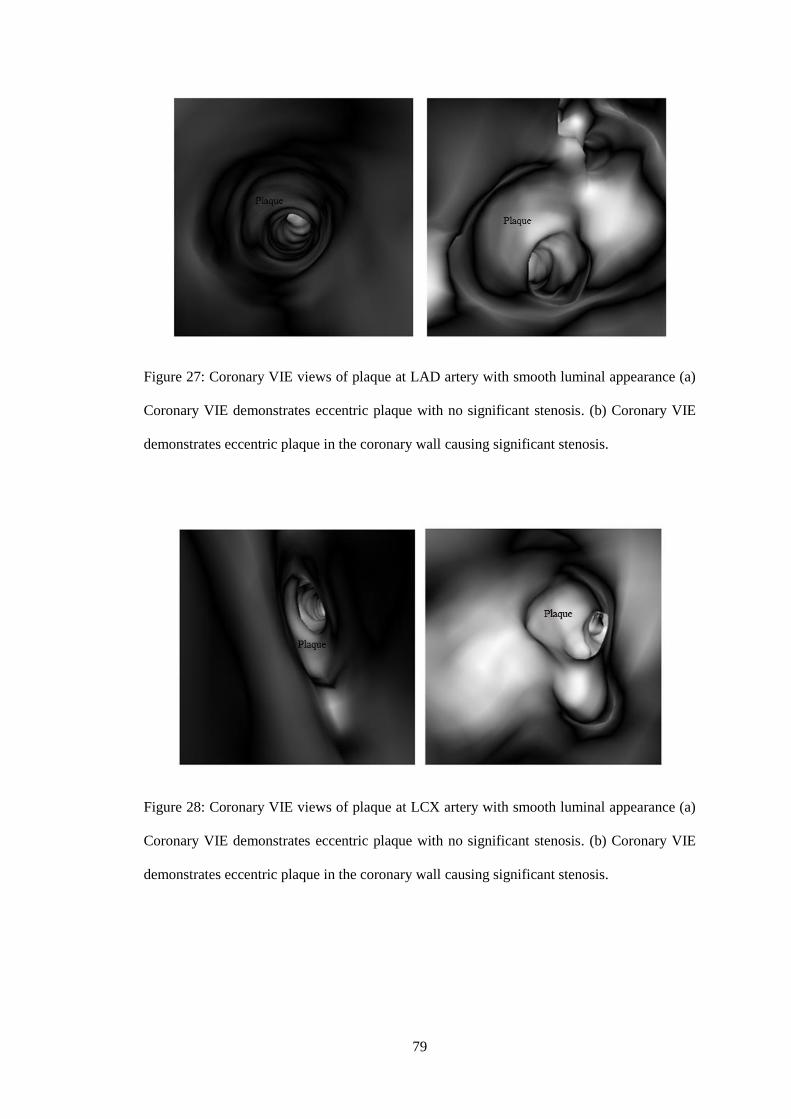
79
Figure 27: Coronary VIE views of plaque at LAD artery with smooth luminal appearance (a)
Coronary VIE demonstrates eccentric plaque with no significant stenosis. (b) Coronary VIE
demonstrates eccentric plaque in the coronary wall causing significant stenosis.
Figure 28: Coronary VIE views of plaque at LCX artery with smooth luminal appearance (a)
Coronary VIE demonstrates eccentric plaque with no significant stenosis. (b) Coronary VIE
demonstrates eccentric plaque in the coronary wall causing significant stenosis.

80
Figure 29: Coronary VIE views of plaque at RCA with smooth luminal appearance (a)
Coronary VIE demonstrates eccentric plaque with no significant stenosis. (b) Coronary VIE
demonstrates eccentric plaque in the coronary wall causing significant stenosis.
Figure 30: Coronary VIE views of plaques at LAD artery with irregular luminal appearance
(a) Coronary VIE demonstrates eccentric plaques (arrows) with no significant stenosis. (b)
Coronary VIE demonstrates eccentric plaques (arrows) in the coronary wall causing
significant stenosis.
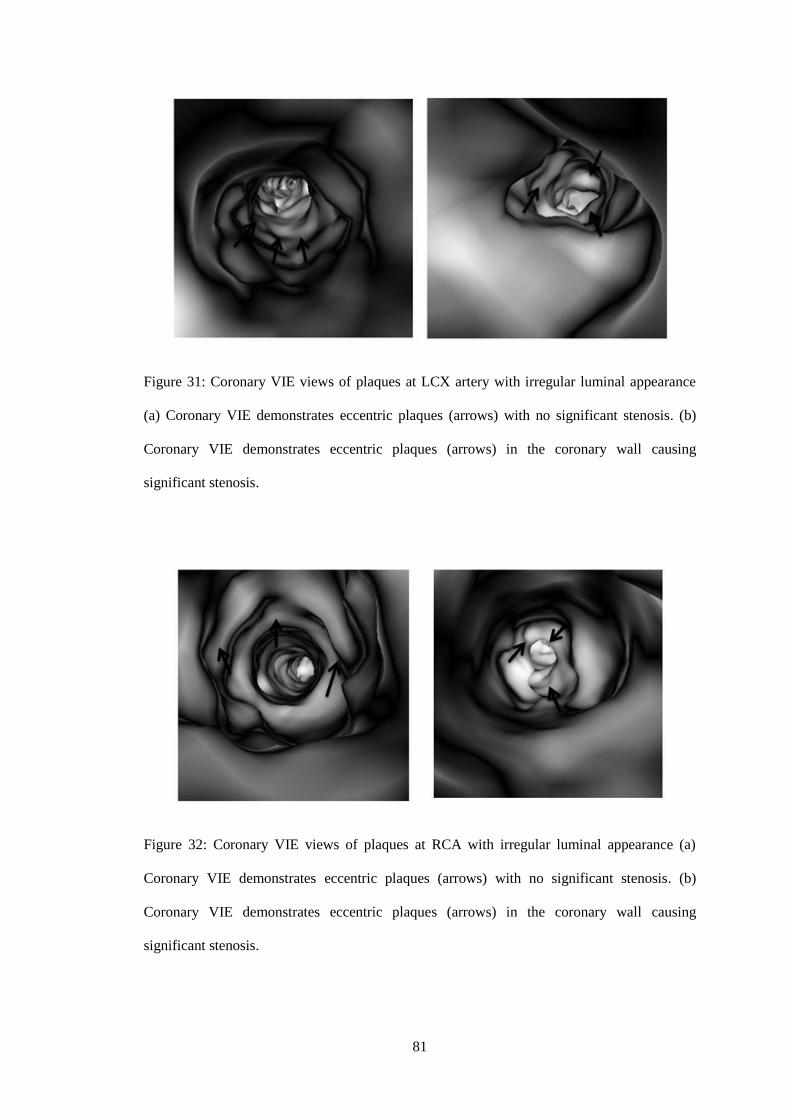
81
Figure 31: Coronary VIE views of plaques at LCX artery with irregular luminal appearance
(a) Coronary VIE demonstrates eccentric plaques (arrows) with no significant stenosis. (b)
Coronary VIE demonstrates eccentric plaques (arrows) in the coronary wall causing
significant stenosis.
Figure 32: Coronary VIE views of plaques at RCA with irregular luminal appearance (a)
Coronary VIE demonstrates eccentric plaques (arrows) with no significant stenosis. (b)
Coronary VIE demonstrates eccentric plaques (arrows) in the coronary wall causing
significant stenosis.
82
CHAPTER SIX
6.0 DISCUSSION
Calcium score is an important part of the CCTA examination prior to contrast injection to
determine the atherosclerotic calcified plaque burden of the coronary arteries. It has been used
as a screening tool for patients with risk factors of developing CAD to predict future cardiac
events (9). Performing a calcium score scan is an efficient and useful method as the scanning
time is short with a low radiation dose to patients (53). Coronary artery calcification have
been linked to the presence of atherosclerotic CAD and to an extent related to the severity of
the disease as a whole (8). However, there is no direct correlation between the presence of
coronary calcification with the degree and location of coronary artery stenosis (9). According
to the European Society of Cardiology, CCTA should be done in all patients with mild to
moderate risk of developing CAD and those patients with suspicious yet inconclusive stress
test (54).
A zero calcium score does not mean that the particular patient is safe from CAD as non-
calcified lipid rich plaque may result in coronary luminal stenosis (9). Therefore, a patient
presenting with typical chest symptoms and/or multiple risk factor for CAD with a low
calcium score should undergo ICA/CCTA to appropriately characterise the degree of stenosis
and plaque morphology. There are six risk factors of CAD identified in this study which were
history of smoking, diabetes mellitus, dyslipidaemia, hypertension, history of stroke and
family history of CAD. Significant number of patients in this study has dyslipidaemia,
hypertension and diabetes mellitus with a prevalence of 77.1%, 69.0% and 49.3%
respectively. The rest of the risk factors of CAD showed a prevalence of < 30.0%. Gender

83
distribution of male to female patients is almost similar for all CAD risk factors except history
of smoking with a male to female ratio of 10:1.
However, this study has demonstrated that there is also no direct correlation between high
calcium score of > 400 with the associated risk factors of developing CAD as the calculated p
value is more than 0.05. The findings conflicted with other study done by Pletcher et al. (55)
which shows these associated risk factors are independent predictors of coronary artery
calcification. This may be due to limitations encountered when conducting the study and will
be discussed in the next chapter. Therefore, the results of this particular investigation cannot
be taken into account and further studies needs to be conducted.
The left anterior descending artery is more commonly affected by atherosclerotic plaques
causing significant stenosis (taken as > 50% luminal narrowing) with a prevalence of 67.2%
compared to the left circumflex artery (prevalence of 31.2%) or the right coronary artery
(46.9%). Almost half of the arterial stenosis in the left anterior descending artery was severe
with > 70% luminal narrowing at 48.4%. Majority of the patients that had underwent CCTA
have either 1, 2 and/or 3 significant artery luminal narrowing with only 20.3% of patients
with no significant coronary artery stenosis.
Out of a total of 64 patients who underwent CCTA, 17.2% of these patients developed
significant cardiac related chest pain suggesting an underlying acute coronary syndrome.
About one third of the patients with a prevalence of 32.8% have undergone cardiac
intervention which includes at least one of the following, a thrombolytic therapy,
percutaneous intervention or CABG. Most of the patients had percutaneous intervention done
with either angioplasty or arterial stent inserted at 61.6% compared to thrombolytic therapy or
CABG at 19.2% each. The prevalence of patients with chest pain is slightly higher than the
84
patients without symptoms of chest pain undergoing at least 1 cardiac intervention at 45.5%
and 30.2% respectively. However, there was no significant difference in prevalence of
patients with chest pain compared to patients without symptoms of chest pain having at least
1 significant coronary artery stenosis at 81.8% and 79.2% respectively. We have only 1 case
of cardiovascular event related death which was obtained from the questionnaire.
It has remained controversial as to whether high calcium score of >400 affects the diagnostic
performance of CCTA. According to Diederichsen et al. (38), the diagnostic capability of
CCTA for patients with high calcium score of > 400 have significantly reduced and therefore
has been suggested that these patients should not proceed with CCTA. However, according to
Lau et al. (56), these particular patients with high calcium score have further increased the
sensitivity without significantly affecting the specificity of CCTA in detecting CAD. Chen et
al. (9) have concluded that a high calcium score did not reduced the accuracy and sensitivity
of CCTA, but significantly reduced the specificity of the left anterior descending and left
circumflex arteries.
Other studies have also demonstrated that CCTA has a high sensitivity and accuracy in
detecting significant CAD and even more so after the introduction of 64-slice CT scanner
(57). For this study, a total of 35 patients with high calcium score were recruited and
comparison was made between CCTA and ICA to determine the diagnostic accuracy of
significant coronary artery stenosis in CCTA. The coronary calcium score for this cohort of
patients were > 400 and ranges from 422.4 to 2767.4 with a mean score of 745.0. Specificity
is defined as the ability for the CCTA to correctly identify patients without the disease while
sensitivity is defined as the ability for the CCTA to identify patients with the disease.
85
According to this study, there was reduced sensitivity of CCTA in determining distal left
circumflex artery stenosis at 50.0%; however the accuracy is significantly high at 84.0%. The
overall sensitivity, specificity and accuracy in the rest of the coronary vessels were not
significantly reduced in this group of patients with high calcium score ranging from 62.5% -
100.0%, 54.2% - 91.7% and 61.8% - 87.5% respectively. There was also no significant
difference with the ability of CCTA to determine significant coronary artery stenosis when
compared to ICA apart from the proximal left anterior descending and left circumflex arteries
with p value of 0.028 and 0.002 respectively (p < 0.05). From this study, we can conclude that
the overall accuracy, sensitivity and specificity of CCTA in patients with high calcium score
were not significantly reduced to suggest delaying CCTA with the exception of the distal left
circumflex artery. The calculated NPV for all three major coronary arteries were high ranging
from 72.7% - 100.0%. However, PPV shows a wide range of value from 9.1% - 80.0% and
deemed not significant for this study.
Coronary 3D-VIE is a relatively new reconstruction method which provides useful
information regarding coronary plaques in relation to the location, plaque morphology as well
as coronary wall changes and narrowing due to the existence of plaques within the coronary
artery. The coronary wall changes and plaque appearance on VIE are related to the amount
and types of plaques. There are three types of coronary plaques which can be grouped into
calcified, non-calcified and mixed plaques (41).
Preliminary findings were that the intraluminal plaques were clearly visualized on VIE and is
thought to be more accurate than the conventional CCTA appearances as it is not affected by
the blooming artefacts from the extensive coronary artery calcifications. These extensive
calcifications decrease luminal visualization causing overestimation of the coronary artery
stenosis and thereby reducing the diagnostic accuracy on CCTA. VIE concentrates on the
86
intraluminal appearance as compared to the extra luminal appearance on CCTA which makes
it more accurate in determining the degree of coronary artery stenosis (42).
This study involves the coronary 3D VIE reconstruction for 14 patients and comparison with
ICA was made in determining significant coronary luminal stenosis. Specificity of LAD
artery was significantly low at 20%, however the sensitivity and accuracy were high at 100%
and 92.3% respectively. The sensitivity, specificity and accuracy for the left circumflex artery
and right coronary artery were not significantly reduced. There was also no significance
difference with the ability of VIE to determine significant coronary artery stenosis when
compared to ICA in all the three major coronary arteries which are the left anterior
descending artery (p = 0.125), left circumflex artery (p = 1.000) and right coronary artery (p =
1.000). Although the NPV values (90.0% - 100.0%) of all three coronary arteries are higher
than the PPV (66.7%), these results were significant and infers that the VIE is a useful tool in
assessing coronary artery stenosis.
Additional information can also be obtained when using VIE in determining the plaque
morphology as well as its associated coronary wall changes. Initial assessment showed that
the intraluminal plaques are clearly seen. However, the limitation of using VIE alone is the
inability to accurately differentiate between the calcified and non-calcified plaques as both of
these plaques have smooth protruding intraluminal appearance. This can be easily overcome
with the aid of conventional CCTA to confirm the different types of plaques based on the
measurable Hounsfield unit (42).
Almost all calcified plaques demonstrate a smooth intraluminal appearance with an associated
protruding sign on coronary 3D VIE. Figure 33 shows a calcified plaque with smooth
intraluminal appearance on VIE. However, if the coronary artery is filled with heavily

87
calcified plaques, the coronary VIE will display an irregular intraluminal coronary wall
changes. Figure 34 shows extensively calcified plaques with irregular intraluminal appearance
on VIE. Non-calcified plaques usually demonstrate a smooth intraluminal appearance, while
mixed calcified and non-calcified plaques commonly show an irregular intraluminal
appearance on coronary VIE. Figure 35 shows mixed calcified and non-calcified plaques with
irregular intraluminal appearance on VIE. The irregular intraluminal appearance in a mixed
plaque is thought to be due to the coronary wall undergoing different stages of remodelling
which are made up of the active inflammatory stage whereby lipid laden materials are being
formed within the vessel walls and the chronic stage which involves the development of
calcified plaques (41).
Figure 33: CCTA and coronary VIE views of a calcified plaque at the LAD artery. (a) Curved
planar reformatted CCTA image shows a calcified plaque (arrow) at the proximal LAD
artery. (b) Coronary VIE demonstrates eccentric plaque in the coronary wall with smooth
appearance. (41)

88
Figure 34: CCTA and coronary VIE views of extensively calcified plaques at the LAD artery.
(a) Extensively calcified plaques (arrows) are shown at the LAD artery on curved planar
reformatted CCTA. (b) Coronary VIE shows irregular wall changes (arrows) with significant
lumen stenosis. (41)
Figure 35: CCTA and coronary VIE views of mixed plaques at the LAD artery. (a) Mixed
calcified (arrows) and non-calcified plaques are seen at the proximal LAD artery on curved
planar reformatted CCTA. (b) Coronary VIE shows irregular wall changes with significant
coronary stenosis caused by plaques. (41)

89
Correlation with VIE findings of the plaque morphology and coronary wall changes can assist
in determining the extent of CAD, predicting the complications and prognosis as well as
monitoring the treatment results.
90
CHAPTER SEVEN
7.0 LIMITATIONS OF STUDY AND FUTURE DEVELOPMENTS
7.1 LIMITATIONS OF STUDY
We acknowledge that there were a few limitations with our study which needs to be addressed
in order to obtain a more accurate outcome for future studies. Firstly, this study was a single
centre, retrospective and prospective study, and the results obtained from this study may not
necessarily reflect the general patient population or physician practice at other centres.
Secondly, the study was conducted on a selected small number of patients (n=100) with high
calcium score. This provided limited results as a larger number of patients are required to
assess the correlation of CAD risk factors with high calcium score including determining the
accuracy, sensitivity and specificity of CCTA and VIE in relation to coronary artery stenosis.
Further study can also be done to verify the significance of calcium score in relation to the
CAD risk factors by comparing with different subgroups of calcium scores i.e. 0, 1-10, 11-
100, 101-400 and >400.
Another important limitation is the lack of clinical detail about the patients. While sufficient
data was collected regarding the risk factors of CAD, certain data (diabetes mellitus,
hypertension, dyslipidaemia, history of smoking) were only available from a questionnaire
and not confirmed via initial follow-up.
91
Although the CCTA images were obtained from our centre, the post-processing and
generation of 3D VIE images were done in Curtin University, Perth, Australia as we do not
own the license for the particular software. It would be ideal if we could post process and
interpret the data to obtain more information for the study and gather sufficient experience to
conduct this practice in the future.
7.2 FUTURE DEVELOPMENTS
In order to overcome the limitations of study listed above, collaboration with multiple
medical centers and hospitals in the country for future studies are recommended to increase
the sample size. This will provide more accurate results for the particular examination that
reflect almost the entire population in the country. A more extensive involvement of the
physician in future studies especially in providing an extensive clinical detail and the
appropriate investigations will be helpful in obtaining a clear clinical picture of the patients
involved thus improving the accuracy of the results. In the near future, we hope that our
country will be able to own the software license for image post-processing and generation of
3D VIE images of the coronary arteries as well as acquire sufficient experience in performing
this examination to improve the quality of the study.
92
CHAPTER EIGHT
8.0 CONCLUSION
This study shows that a high calcium score did not significantly reduce the overall diagnostic
accuracy of CCTA when compared to ICA. The sensitivity and specificity of CCTA was
generally high with a good negative predictive value. However, blooming artefacts due to
atherosclerotic calcifications predominantly at the proximal LAD artery and LCX artery may
explain the significance difference of CCTA findings when compared to the ICA. The
advantage of CCTA as a screening modality in low risk patients with chest pain for the
assessment of CAD shows great potential. The evidence of the significant difference of
CCTA findings has suggested that high risk patients with high calcium score > 400 should be
referred for ICA for further evaluation. These patients would also benefit from immediate
revascularization after a diagnostic ICA if required.
Comparison between coronary VIE and using ICA as the gold standard showed that the
overall sensitivity, specificity, PPV, NPV and accuracy was not significantly reduced.
Moreover, the images obtained from VIE reconstruction was able to clearly demonstrate the
intraluminal plaque appearance and associated coronary wall changes which is not possible
from the conventional 2D and 3D visualizations. Therefore, VIE should be used as a
complimentary approach in addition to CCTA to assist in clinical diagnosis, analysis of
plaques, determining the extent of the disease and risk stratification of CAD. Further studies
are needed in order to confirm the initial results. Other studies with correlation made between
the coronary risk factors with the coronary plaques morphology are also essential to establish
the prognostic value of CCTA using VIE as a complimentary tool in patients with suspected
CAD.

93
REFERENCES
1. Jeyamalar R. Coronary artery disease in Malaysia: a perspective. Med J Malaysia.
1991;46(1):1-6.
2. Guidelines CP. Management of acute ST segment elevation myocardial infarction
(STEMI) (3rd Edition) MOH/P/PAK/27614 (GU). 2014.
3. Mowatt G, Cook JA, Hillis GS, Walker S, Fraser C, Jia X, et al. 64-Slice computed
tomography angiography in the diagnosis and assessment of coronary artery disease:
systematic review and meta-analysis. Heart. 2008;94(11):1386-93.
4. Sun Z, Xu L. Coronary CT angiography in the quantitative assessment of coronary
plaques. BioMed research international. 2014;2014.
5. Qi L, Tang L-J, Xu Y, Zhu X-M, Zhang Y-D, Shi H-B, et al. The Diagnostic
Performance of Coronary CT Angiography for the Assessment of Coronary Stenosis
in Calcified Plaque. PloS one. 2016;11(5):e0154852.
6. Sun Z. Coronary CT angiography in coronary artery disease: correlation between
virtual intravascular endoscopic appearances and left bifurcation angulation and
coronary plaques. BioMed research international. 2013;2013.
7. Xu L, Sun Z. Virtual intravascular endoscopy visualization of calcified coronary
plaques: a novel approach of identifying plaque features for more accurate assessment
of coronary lumen stenosis. Medicine. 2015;94(17):e805.
8. Sun Z, Ng CK. High calcium scores in coronary CT angiography: effects of image
post-processing on visualization and measurement of coronary lumen diameter.
Journal of Medical Imaging and Health Informatics. 2015;5(1):110-6.
94
9. Chen C-C, Chen C-C, Hsieh I-C, Liu Y-C, Liu C-Y, Chan T, et al. The effect of
calcium score on the diagnostic accuracy of coronary computed tomography
angiography. The international journal of cardiovascular imaging. 2011;27(1):37-42.
10. College O. Anatomy and Physiology. OpenStax CNX.
11. StudyBlue. Biology Chapter 19 – lecture. Chemeketa Community College, Oregon.
12. Mozaffarian. Heart disease and stroke statistics-2015 update: a report from the
American Heart Association (vol 131, pg e29, 2015). Circulation.
2015;131(24):E535-E.
13. Malaysia MoH. Appropriate use criteria (AUC) for investigations and
revascularization in CAD. 1st edition. . 2015 July 27.
14. Fox K, Garcia MAA, Ardissino D, Buszman P, Camici PG, Crea F, et al. Guidelines
on the management of stable angina pectoris: executive summary. European heart
journal. 2006;27(11):1341-81.
15. Guidelines CP. Management of unstable angina/ non ST elevation myocardial
infarction (UA/NSTEMI). MOH/P/PAK/21911(GU). 2011 June.
16. French JK, White HD. Clinical implications of the new definition of myocardial
infarction. Heart. 2004;90(1):99-106.
17. Pakkal M, Raj V, McCann G. Non-invasive imaging in coronary artery disease
including anatomical and functional evaluation of ischaemia and viability assessment.
The British journal of radiology. 2014.
18. JD Pearlman BC, EC Lin. Imaging in Coronary Artery Disease.
http://emedicinemedscapecom/article/349040-overview. 2016 September 29.
19. Tavakol M, Ashraf S, Brener SJ. Risks and complications of coronary angiography: a
comprehensive review. Global journal of health science. 2012;4(1):65.

95
20. Saeed M, Van TA, Krug R, Hetts SW, Wilson MW. Cardiac MR imaging: current
status and future direction. Cardiovascular diagnosis and therapy. 2015;5(4):290-310.
21. Sun Z, Jiang W. Diagnostic value of multislice computed tomography angiography in
coronary artery disease: a meta-analysis. European journal of radiology.
2006;60(2):279-86.
22. Stein PD, Beemath A, Kayali F, Skaf E, Sanchez J, Olson RE. Multidetector
computed tomography for the diagnosis of coronary artery disease: a systematic
review. The American journal of medicine. 2006;119(3):203-16.
23. Mollet NR, Cademartiri F, van Mieghem CA, Runza G, McFadden EP, Baks T, et al.
High-resolution spiral computed tomography coronary angiography in patients
referred for diagnostic conventional coronary angiography. Circulation.
2005;112(15):2318-23.
24. Schuijf JD, Bax JJ, Shaw LJ, de Roos A, Lamb HJ, van der Wall EE, et al. Meta-
analysis of comparative diagnostic performance of magnetic resonance imaging and
multislice computed tomography for noninvasive coronary angiography. American
heart journal. 2006;151(2):404-11.
25. Mollet NR, Cademartiri F, de Feyter PJ. Non-invasive multislice CT coronary
imaging. Heart. 2005;91(3):401-7.
26. Kannel WB, Dawber TR, Kagan A, Revotskie N, Stokes J. Factors of Risk in the
Development of Coronary Heart Disease—Six-Year Follow-up ExperienceThe
Framingham Study. Annals of internal medicine. 1961;55(1):33-50.
27. Shah NR, Coulter SA. An evidence-based guide for coronary calcium scoring in
asymptomatic patients without coronary heart disease. Texas Heart Institute Journal.
2012;39(2):240.

96
28. Wilson PW, D’Agostino RB, Levy D, Belanger AM, Silbershatz H, Kannel WB.
Prediction of coronary heart disease using risk factor categories. Circulation.
1998;97(18):1837-47.
29. Budoff MJ, Achenbach S, Blumenthal RS, Carr JJ, Goldin JG, Greenland P, et al.
Assessment of coronary artery disease by cardiac computed tomography. Circulation.
2006;114(16):1761-91.
30. Sarwar A, Shaw LJ, Shapiro MD, Blankstein R, Hoffman U, Cury RC, et al.
Diagnostic and prognostic value of absence of coronary artery calcification. JACC:
Cardiovascular Imaging. 2009;2(6):675-88.
31. (MESA) RSCTM-ESoA.
32. Guideline for Assessment of Cardiovascular Risk in Asymptomatic Adults -
Executive Summary; American College of Cardiology Foundation/American Heart
Association (ACCF/AHA) Task Force on Practice Guidelines.
33. Kramer CK, Zinman B, Gross JL, Canani LH, Rodrigues TC, Azevedo MJ, et al.
Coronary artery calcium score prediction of all cause mortality and cardiovascular
events in people with type 2 diabetes: systematic review and meta-analysis. Bmj.
2013;346:f1654.
34. http://www.vrads.com/coronary-ct-angiography.asp VRaDS.
35. Shabestari AA. Coronary artery calcium score: a review. Iranian Red Crescent
Medical Journal. 2013;15(12).
36. Agatston AS, Janowitz WR, Hildner FJ, Zusmer NR, Viamonte M, Detrano R.
Quantification of coronary artery calcium using ultrafast computed tomography.
Journal of the American College of Cardiology. 1990;15(4):827-32.
97
37. Rumberger JA, Brundage BH, Rader DJ, Kondos G, editors. Electron beam computed
tomographic coronary calcium scanning: a review and guidelines for use in
asymptomatic persons. Mayo Clinic Proceedings; 1999: Elsevier.
38. Diederichsen AC, Petersen H, Jensen LO, Thayssen P, Gerke O, Sandgaard NC, et al.
Diagnostic value of cardiac 64-slice computed tomography: importance of coronary
calcium. Scandinavian Cardiovascular Journal. 2009;43(5):337-44.
39. Sun Z. Multislice CT angiography in coronary artery disease: Technical
developments, radiation dose and diagnostic value. World J Cardiol 2010;2(10): 333-
343.
40. Sun Z. Coronary CT angiography in coronary artery disease: Opportunities and
challenges. Australasian Medical Journal. 2016;9(5).
41. Sun Z. Coronary Virtual Intravascular Endoscopy. Coronary Graft Failure: Springer;
2016. p. 555-70.
42. Sun Z, Dimpudus FJ, Nugroho J, Adipranoto JD. CT virtual intravascular endoscopy
assessment of coronary artery plaques: a preliminary study. European Journal of
Radiology. 2010;75(1):e112-e9.
43. Kuzuya T, Nakagawa S, Satoh J, Kanazawa Y, Iwamoto Y, Kobayashi M, et al.
Report of the Committee on the classification and diagnostic criteria of diabetes
mellitus. Diabetes research and clinical practice. 2002;55(1):65-85.
44. Williams L. Third report of the National Cholesterol Education Program (NCEP)
expert panel on detection, evaluation, and treatment of high blood cholesterol in
adults (Adult Treatment Panel III) final report. Circulation. 2002;106(25):3143-.
45. Guidelines CP. Management of dyslipidaemia (4th Edition) MOH/P/PAK/21811
(GU). 2011 June
98
46. Committee G. 2003 European Society of Hypertension–European Society of
Cardiology guidelines for the management of arterial hypertension. Journal of
hypertension. 2003;21(6):1011-53.
47. Guidelines CP. Management of ischaemic stroke (2nd Edition). MH/P/PAK/23512
(GU). 2012.
48. Taylor AJ, Bindeman J, Feuerstein I, Cao F, Brazaitis M, O’Malley PG. Coronary
calcium independently predicts incident premature coronary heart disease over
measured cardiovascular risk factors: mean three-year outcomes in the Prospective
Army Coronary Calcium (PACC) project. Journal of the American College of
Cardiology. 2005;46(5):807-14.
49. Cury RC, Ferencik M, Achenbach S, Pomerantsev E, Nieman K, Moselewski F, et al.
Accuracy of 16-slice multi-detector CT to quantify the degree of coronary artery
stenosis: assessment of cross-sectional and longitudinal vessel reconstructions.
European journal of radiology. 2006;57(3):345-50.
50. Thomas DM, Divakaran S, Villines TC, Nasir K, Shah NR, Slim AM, et al.
Management of coronary artery calcium and coronary CTA findings. Current
cardiovascular imaging reports. 2015;8(6):1-14.
51. Gensini GG. A more meaningful scoring system for determining the severity of
coronary heart disease. The American journal of cardiology. 1983;51(3):606.
52. Halon DA, Azencot M, Rubinshtein R, Zafrir B, Flugelman MY, Lewis BS. Coronary
Computed Tomography (CT) Angiography as a Predictor of Cardiac and Noncardiac
Vascular Events in Asymptomatic Type 2 Diabetics: A 7‐Year Population‐Based
Cohort Study. Journal of the American Heart Association. 2016;5(6):e003226.
53. Gottlieb I, Miller JM, Arbab-Zadeh A, Dewey M, Clouse ME, Sara L, et al. The
absence of coronary calcification does not exclude obstructive coronary artery disease
99
or the need for revascularization in patients referred for conventional coronary
angiography. Journal of the American College of Cardiology. 2010;55(7):627-34.
54. Oudkerk M, Stillman AE, Halliburton SS, Kalender WA, Möhlenkamp S,
McCollough CH, et al. Coronary artery calcium screening: current status and
recommendations from the European Society of Cardiac Radiology and North
American Society for Cardiovascular Imaging. The international journal of
cardiovascular imaging. 2008;24(6):645-71.
55. Pletcher MJ, Tice JA, Pignone M, McCulloch C, Callister TQ, Browner WS. What
does my patient's coronary artery calcium score mean? Combining information from
the coronary artery calcium score with information from conventional risk factors to
estimate coronary heart disease risk. BMC medicine. 2004;2(1):31.
56. Lau GT, Ridley LJ, Schieb MC, Brieger DB, Freedman SB, Wong LA, et al.
Coronary artery stenoses: Detection with calcium scoring, CT angiography, and both
methods combined 1. Radiology. 2005;235(2):415-22.
57. Palumbo AA, Maffei E, Martini C, Tarantini G, Di Tanna GL, Berti E, et al.
Coronary calcium score as gatekeeper for 64-slice computed tomography coronary
angiography in patients with chest pain: per-segment and per-patient analysis.
European radiology. 2009;19(9):2127-35.
100
APPENDICES
APPENDIX A
QUESTIONNAIRES
AN INVESTIGATION OF THE EFFECT OF HIGH CORONARY CALCIUM SCORE
ON THE ASSESSMENT OF CORONARY ARTERY DISEASE USING CORONARY
COMPUTED TOMOGRAPHY ANGIOGRAPHY: AN INVESTIGATION OF
CLINICAL VALUE OF 3D VIRTUAL INTRAVSCULAR ENDOSCOPY.
Name: ___________________________ , DOB:________,RN:_______
Total cholesterol:______mmol/l , LDL level:______mmol/l, HDL level:____mmol/l
Blood pressure: _______mm/Hg.
Date of CTA coronary done:________Indication of CTA:_____________
Is there any family history for premature cardiovascular events (history of myocardial
infarction or stroke in first-degree relatives aged LESS THAN 65 years). YES____ NO:_____
Do you smoke? YES_____ NO:_____
• If yes, how long?: ___ <5 years, ___<10 years, ____<15 years,____> 20 years.
Do you have diabetes mellitus? YES_____ NO:_____
• If yes, how long?: ___ <5 years, ___<10 years, ____<15 years,____> 20 years.
Do you have history of stroke? YES_____ NO:____
• If yes, how long?: ___ <5 years, ___<10 years, ____<15 years,____> 20 years.

101
Do you have any symptom for heart attack after CTA cardiac?
No:________
Yes: _______, when is it occur? Duration from CTA cardiac and heart attack:____
If yes, what is/are the symptoms?
• Retrosternal pressure, squeezing: YES_____ NO:______
• Is it caused by exertion or emotional stress: YES_____ NO:______
• Relieved by sublingual GTN: YES_____ NO:______
• Relieved by rest: YES_____ NO:______
If you were admitted for heart attack, what were the procedure/ intervention/management
during admission?
• Medication (Thrombolytic therapy, i.e. streptokinase):YES__NO__
• Percutaneous coronary intervention: YES__NO__
• Coronary artery bypass surgery: YES__NO__
Clinical outcome/ Final diagnosis (please tick ✔ ):
Cardiac deaths _____ Myocardial infarction/STEMI ______
Unstable anginas/ NSTEMI ______ Revascularizations ______
Date of phone call interview:_________________
Name of interviewer:____________________

102
APPENDIX B
PATIENT INFORMATION SHEET
Please read the following information carefully, do not hesitate to discuss any questions
you may have with your Doctor.
Study Title
AN INVESTIGATION OF THE EFFECT OF HIGH CORONARY CALCIUM SCORE
ON THE ASSESSMENT OF CORONARY ARTERY DISEASE USING CORONARY
COMPUTED TOMOGRAPHY ANGIOGRAPHY: AN INVESTIGATION OF
CLINICAL VALUE OF 3D VIRTUAL INTRAVSCULAR ENDOSCOPY.
Introduction
Coronary artery disease (CAD) is a known cause of mortality and morbidity with the disease
reaching endemic proportions(1). It is the most important cause of death in Malaysia with the
mortality rate of 20-25% in public hospitals. Due to technological advances in computed
tomography (CT) scanner over the recent years, coronary computed tomographic angiography
(CCTA) has emerged as a less invasive imaging modality for coronary artery assessment with
high sensitivity and negative predictive value in determining the site and degree of coronary
artery luminal stenosis. Despite the very high negative predictive value of CCTA, the
diagnostic accuracy of CCTA is limited by the extensive coronary artery calcification (taken
as coronary calcium score >400), resulting in blooming artefacts. However, recent studies
have demonstrated the overall diagnostic accuracy for a coronary artery assessment in a
patient with a high calcium score was not drastically impaired with no significant difference
in sensitivity.

103
The CCTA offers extensive 2D axial and multiplanar reformatted images for the assessment
of the coronary plaques. However, it is still lacking the direct intraluminal visualization of the
coronary artery lumen as well as the assessment of the plaque if present. This limitation is can
be overcome by using a 3D reconstruction tool known as 3D virtual intravascular endoscopy
(3D VIE) which is able to provide a more extensive diagnostic evaluation of the coronary
tree. With this imaging tool, a more accurate assessment can be done with regards to the
plaque location in relation to the coronary ostium, plaque composition and coronary wall
stenosis due to the presence of plaque within the coronary artery. In this study, we are
exploring a new method of coronary artery assessment which was described above as 3D
VIE. This new method is potentially beneficial as a supplementary tool to CCTA in
improving diagnostic evaluation of patients with high CAC scores.
What is the purpose of this study?
The general objectives of this study are to evaluate the diagnostic values of CCTA for the
assessment of coronary artery disease in patients with high calcium score in comparison with
the conventional invasive coronary angiogram.
The specific objectives of this study are to:
a) To investigate the diagnostic value of 3D VIE in the visualisation of coronary wall
changes due to the effect of coronary plaques in high CAC scores
b) To correlate 3D VIE findings with conventional 2D and 3D visualisations in terms of
the degree of coronary lumen stenosis or occlusion caused by high CAC scores

104
c) To explore the potential role of 3D VIE as a supplementary tool to conventional
coronary CT angiography in improving diagnostic evaluation of patients with high
CAC scores
d) To investigate the relationship between the CCTA and the clinical outcome of these
patients with high calcium score
What are the procedures to be followed?
• During the CT examination day, you will be referred to the CT room (C1) at the
Department of Biomedical Imaging, 2nd Floor, Menara Utama, UMMC.
• The radiologist or radiographer will explain the procedure to you, including the risks
and benefits and answer any questions you may have. You will then be asked to sign
a form giving your informed consent for the examination.
• Prior to the CT scan, a medical officer or nurse will insert an intravenous (IV) line
into your vein. The IV tube is used for contrast injection during the CT scan.
• You will be placed on a CT scan table and positioned accordingly with the assistance
of the radiographer. You will be made as comfortable as possible.
• The CT scan will start immediately after you are comfortably positioned. For the
exam itself, which in most cases lasts just a few minutes, the radiographer will exit
the room into the monitor console room which is located next to the CT scanner. The
radiographer will inform you through a speaker when the exam is about to begin –
you may be asked to hold your breath briefly during a portion of the exam. At no time
will the scanner itself touch you during the exam.
• Once the exam is complete, the radiographer will assist you to leave the CT room and
you will be followed up / contacted by the researchers who take part in this study.
105
Who should not enter the study?
Patients with coronary artery calcium score <400 and those with calcium score ≥400 and did
not proceed with CCTA should be excluded from the study.
What will be benefits of the study:
(a) to you as the subject?
You will be diagnosed using the latest imaging technique, dual-energy CT imaging and CT
virtual endoscopy to assess the characteristics of your coronary artery as well as to estimate
the risk factors for you to develop coronary artery diseases.
(b) to the investigator?
The data collected from this study will enable a reliable statistical test to be carried out to
evaluate the diagnostic capability/value of CCTA and CT virtual intravascular endoscopy
compared to conventional coronary angiography as well as to investigate the clinical outcome
of patients with high calcium score.
What are the possible drawbacks?
There is no expected drawback from taking part in this study.
Can I refuse to take part in the study?
Sure, you can always withdraw yourself from the study at any time prior to the study.

106
Who should I contact if I have additional questions during the course of the study?
Dr Woo Sze Yang,
Final Year Masters of Radiology student,
Department of Biomedical Imaging,
Faculty of Medicine,
University of Malaya,
50603 Kuala Lumpur.
Telephone number: 603–7949 4422
Email address: [email protected].
Or
Professor Dr Yang Faridah Abdul Aziz,
Consultant Radiologist,
Department of Biomedical Imaging,
Faculty of Medicine,
University of Malaya,
50603 Kuala Lumpur.
Telephone number: 603–7950 2840
Email address: [email protected].

107
APPENDIX C
CONSENT BY PATIENT FOR CLINICAL RESEARCH
I, …………………………………………….. Identity Card No……….…………………
(Name of Patient)
of ……………………………………………………………………………………………
(Address)
hereby agree to take part in the clinical research (clinical study) specified below:
Title of Study: Effect of high coronary calcium score on the assessment of coronary
artery disease using coronary computed tomography angiography: An investigation of
the clinical value of 3D virtual intravascular endoscopy.
The nature and purpose of which has been explained to me by Dr..………….………………..
(Name & Designation of Doctor)
and interpreted by ………………………..……………………………….…..…………
(Name & Designation of Interpreter)
to the best of his/her ability in …………………….…………… language/dialect.
I have been told about the nature of the clinical research in terms of methodology, possible
adverse effects and complications (as per patient information sheet). After knowing and
understanding all the possible advantages and disadvantages of this clinical research, I
voluntarily consent of my own free will to participate in the clinical research specified above.
I understand that I can withdraw from this clinical research at any time without assigning any
reason whatsoever and in such a situation shall not be denied the benefits of usual treatment by
the attending doctors.
Date: …………….. Signature or Thumbprint …………….………………
(Patient)
IN THE PRESENCE OF
Name ……………………………………
Identity Card No. ………………………. Signature…………………………….
(Witness for Signature of Patient)
Designation ……………………………..
I confirm that I have explained to the patient the nature and purpose of the above-mentioned
clinical research.
Date ……………………………. Signature …………………………………
(Attending Doctor)
CONSENT BY PATIENT R.N.
FOR Name
CLINICAL RESEARCH Sex
Age
Unit

108
KEIZINAN OLEH PESAKIT UNTUK PENYELIDIKAN KLINIKAL
Saya,……………………………………….. No. Kad Pengenalan …………………..…….
(Nama Pesakit)
beralamat……………………………………………………………………………….………
(Alamat)
dengan ini bersetuju menyertai dalam penyelidikan klinikal (pengajian klinikal) disebut berikut:
Tajuk Penyelidikan Effect of high coronary calcium score on the assessment of coronary
artery disease using coronary computed tomography angiography: An investigation of
the clinical value of 3D virtual intravascular endoscopy.
yang mana sifat dan tujuannya telah diterangkan kepada saya oleh Dr.…………………………
(Nama & Jawatan Doktor)
mengikut terjemahan ………………….……………………………………………
(Nama & Jawatan Penterjemah)
yang telah menterjemahkan kepada saya dengan sepenuh kemampuan dan kebolehannya di
dalam Bahasa / loghat………………………………………………………
Saya telah diberitahu bahawa dasar penyelidikan klinikal dalam keadaan methodologi, risiko
dan komplikasi (mengikut kertas maklumat pesakit). Selepas mengetahui dan memahami
semua kemungkinan kebaikan dan keburukan penyelidikan klinikal ini, saya
merelakan/mengizinkan sendiri menyertai penyelidikan klinikal tersebut di atas.
Saya faham bahawa saya boleh menarik diri dari penyelidikan klinikal ini pada bila-bila masa
tanpa memberi sebarang alasan dalam situasi ini dan tidak akan dikecualikan dari kemudahan
rawatan dari doktor yang merawat.
Tarikh: …………………….. Tandatangan/Cap Jari …………………………
(Pesakit)
DI HADAPAN
Nama …………………………………
No. K/P………………………………… Tandatangan …………………………………
(Saksi untuk Tandatangan Pesakit)
Jawatan …………..…………………….
Saya sahkan bahawa saya telah menerangkan kepada pesakit sifat dan tujuan penyelidikan
klinikal tersebut di atas.
Tarikh: …….………………… Tandatangan ……………………………………………..
(Doktor yang merawat)
No. Pend.
KEIZINAN OLEH PESAKIT Nama
UNTUK Jantina
PENYELIDIKAN KLINIKAL Umur
Unit

109
CONSENT BY RESPONSIBLE RELATIVE FOR CLINICAL RESEARCH
I, ………………………………………….. Identity Card No…………...………………
(Name of responsible relative)
of …………………………………………………………………………………………..
(Address)
hereby agree that my relative …………………………… I.C. No………..……………
(Name)
participate in the clinical research (clinical study) specified below:-
Title of Study: Effect of high coronary calcium score on the assessment of coronary
artery disease using coronary computed tomography angiography: An investigation of
the clinical value of 3D virtual intravascular endoscopy.
The nature and purpose of which has been explained to me by Dr.……….…………………..
(Name & Designation of Doctor)
and interpreted by ………………………..……………………………….…..
(Name & Designation of Interpreter)
………………………………… to the best of his/her ability in …………………….……
language/dialect.
I have been informed of the nature of this clinical research in terms of procedure, possible
adverse effects and complications (as per patient information sheet). I understand the possible
advantages and disadvantages of participating in this research. I voluntarily give my consent
for my relative to participate in this research specified above.
I understand that I can withdraw my relative from this clinical research at any time without
assigning any reason whatsoever and in such situation, my relative shall not be denied the
benefits of usual treatment by the attending doctors. Should my relative regains his/her ability
to consent, he/she will have the right to remain in this research or may choose to withdraw.
Relationship Signature or
Date: ………………… to Patient …………………. Thumbprint ……………………
IN THE PRESENCE OF
Name ……………………………………..
Identity Card No. ………………………… Signature ………………………………
(Witness)
Designation ………………………………
I confirm that I have explained to the patient’s relative the nature and purpose of the above-
mentioned clinical research.
Date …………………… Signature……………………………………
(Attending Doctor)
R.N.
CONSENT BY Name
RESPONSIBLE RELATIVE FOR Sex
CLINICAL RESEARCH Age
Unit

110
KEIZINAN OLEH WARIS YANG BERTANGGUNGJAWAB UNTUK PENYELIDIKAN
KLINIKAL
Saya,…………………………………………….. Kad Pengenalan …………..….………
(Nama Waris yang bertanggungjawab)
beralamat…………………………………………………………………………………….
(Alamat)
dengan ini bersetuju supaya saudara saya………………………………………..…… menyertai
(Nama Pesakit)
dalam penyelidikan klinikal (pengajian klinikal) disebut berikut:
TajukPenyelidikan: Effect of high coronary calcium score on the assessment of coronary
artery disease using coronary computed tomography angiography: An investigation of the
clinical value of 3D virtual intravascular endoscopy.
yang mana sifat dan tujuannya telah diterangkan kepada saya oleh Dr.…………………………
(Nama & Jawatan Doktor)
mengikut terjemahan …………………………..……………………
(Nama & Jawatan Penterjemah)
…………………………………….... yang telah menterjemahkan kepada saya dengan sepenuh
kemampuan dan kebolehannya di dalam Bahasa / loghat……………………………………
Saya telah diberitahu bahawa dasar penyelidikan klinikal dalam keadaan metodologi, risiko dan
komplikasi (mengikut kertas maklumat pesakit). Saya mengetahui dan memahami semua
kemungkinan kebaikan dan keburukan penyelidikan klinikal ini. Saya merelakan/mengizinkan
saudara saya menyertai penyelidikan klinikal tersebut di atas.
Saya faham bahawa saya boleh menarik balik penyertaan saudara saya dalam penyelidikan
klinikal ini pada bila-bila masa tanpa memberi sebarang alasan dalam situasi ini dan tidak akan
dikecualikan dari kemudahan rawatan dari doktor yang merawat. Sekiranya saudara saya
kembali berupaya untuk memberi keizinan, beliau mempunyai hak untuk terus menyertai kajian
ini atau memilih untuk menarik diri.
Tarikh: …………… Pertalian Tandatangan/Cap Jari Waris
dengan Pesakit …..………… yang bertanggungjawab ………………
DI HADAPAN
Nama ………………………………….
No. K/P………………………………… Tandatangan …………………………………
(Saksi untuk Tandatangan
Jawatan………..………………………... Waris yang Bertanggungjawab)
Saya sahkan bahawa saya telah menerangkan kepada waris yang bertanggungjawab sifat dan
tujuan penyelidikan klinikal tersebut di atas.
Tarikh: …….……………… Tandatangan ……………………………………………
(Doktor yang merawat)
No. Pend.
KEIZINAN OLEH WARIS PESAKIT Nama
UNTUK Jantina
PENYELIDIKAN KLINIKAL Umur
Unit

111
APPENDIX D
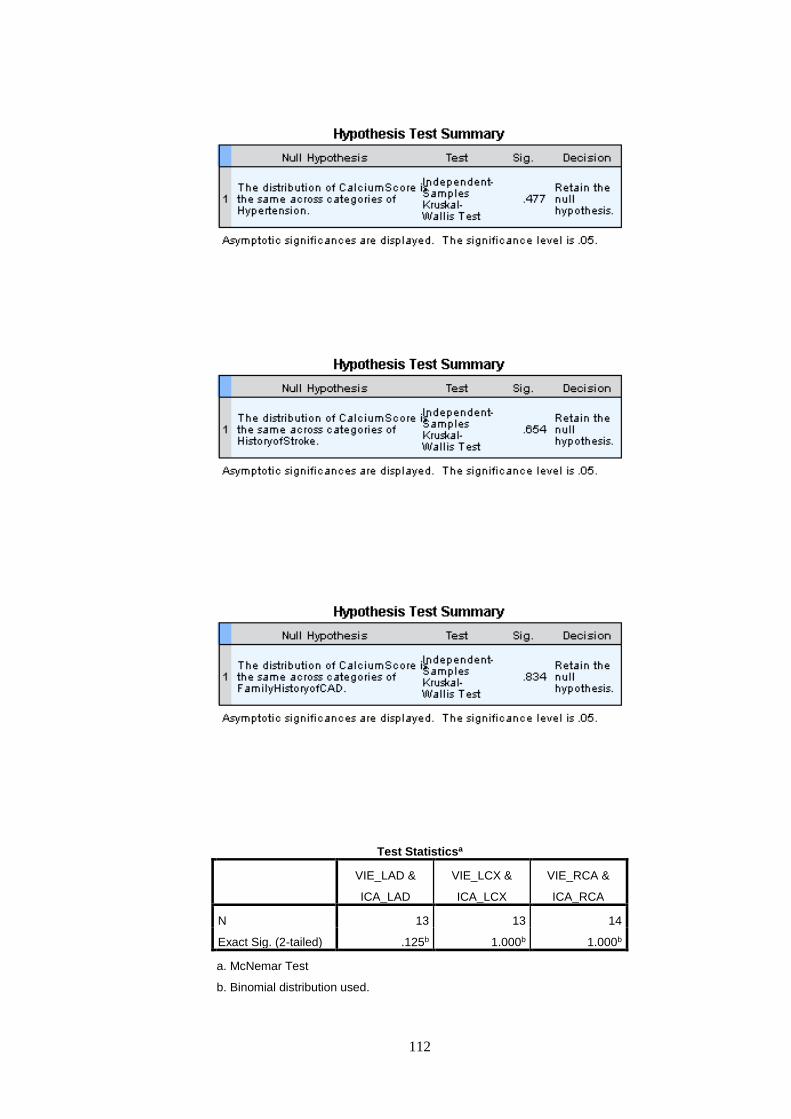
112
Test Statisticsa
VIE_LAD &
ICA_LAD
VIE_LCX &
ICA_LCX
VIE_RCA &
ICA_RCA
N 13 13 14
Exact Sig. (2-tailed) .125b 1.000b 1.000b
a. McNemar Test
b. Binomial distribution used.
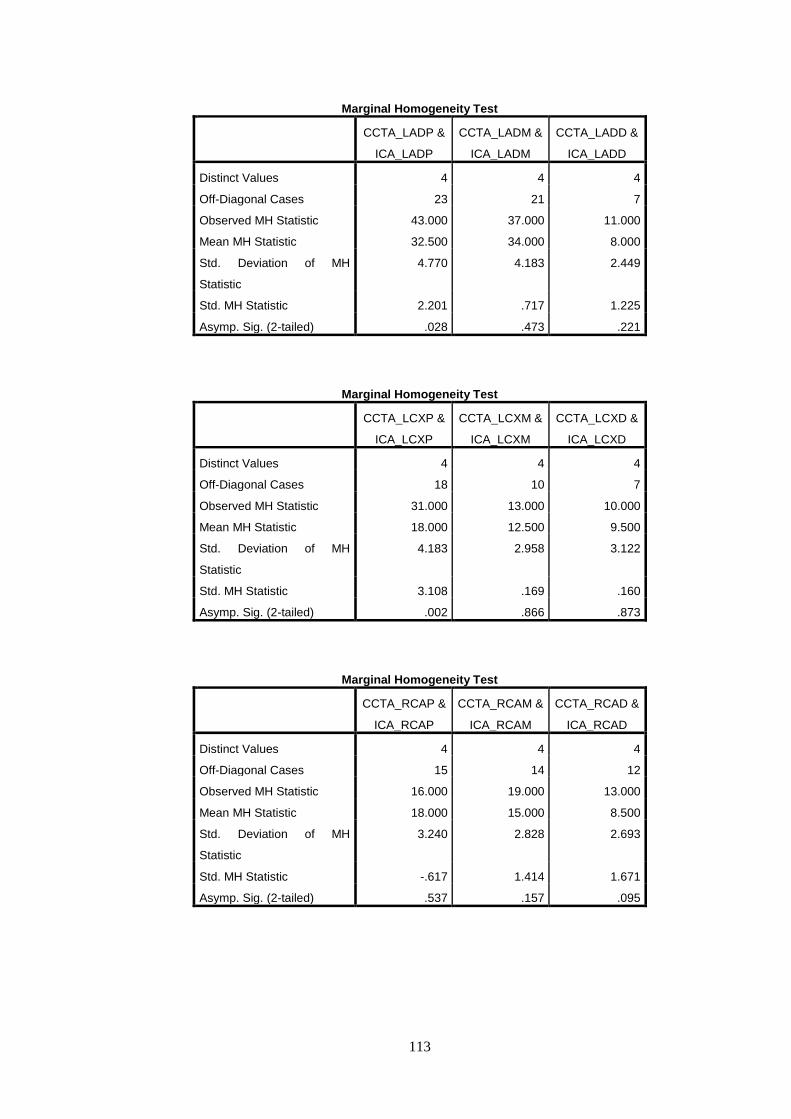
113
Marginal Homogeneity Test
CCTA_LADP &
ICA_LADP
CCTA_LADM &
ICA_LADM
CCTA_LADD &
ICA_LADD
Distinct Values 4 4 4
Off-Diagonal Cases 23 21 7
Observed MH Statistic 43.000 37.000 11.000
Mean MH Statistic 32.500 34.000 8.000
Std. Deviation of MH
Statistic
4.770 4.183 2.449
Std. MH Statistic 2.201 .717 1.225
Asymp. Sig. (2-tailed) .028 .473 .221
Marginal Homogeneity Test
CCTA_LCXP &
ICA_LCXP
CCTA_LCXM &
ICA_LCXM
CCTA_LCXD &
ICA_LCXD
Distinct Values 4 4 4
Off-Diagonal Cases 18 10 7
Observed MH Statistic 31.000 13.000 10.000
Mean MH Statistic 18.000 12.500 9.500
Std. Deviation of MH
Statistic
4.183 2.958 3.122
Std. MH Statistic 3.108 .169 .160
Asymp. Sig. (2-tailed) .002 .866 .873
Marginal Homogeneity Test
CCTA_RCAP &
ICA_RCAP
CCTA_RCAM &
ICA_RCAM
CCTA_RCAD &
ICA_RCAD
Distinct Values 4 4 4
Off-Diagonal Cases 15 14 12
Observed MH Statistic 16.000 19.000 13.000
Mean MH Statistic 18.000 15.000 8.500
Std. Deviation of MH
Statistic
3.240 2.828 2.693
Std. MH Statistic -.617 1.414 1.671
Asymp. Sig. (2-tailed) .537 .157 .095


![CORONARY BIFURCATION DISEASE - emj.emg-health.com · Citation: EMJ. 2016;1[5]:2-9. ABSTRACT Coronary bifurcation disease (CBD) is frequently found in patients undergoing coronary](https://static.fdocuments.us/doc/165x107/6035e1636ec554469178fc6e/coronary-bifurcation-disease-emjemg-citation-emj-2016152-9-abstract-coronary.jpg)


