Effect of Heat Treatment on the Surface Properties of...
9
ISSN: 0973-4945; CODEN ECJHAO E-Journal of Chemistry http://www.e-journals.net 2011, 8(3), 992-999 Effect of Heat Treatment on the Surface Properties of Activated Carbons MERIEM BELHACHEMI * and FATIMA ADDOUN * Faculté Des Sciences ET Technologie Université De BECHAR, B.P 417, 08000-Béchar, Algeria Laboratoire D’étude Physico Chimique Des Matériaux ET Application à L’environnement Faculté de Chimie, USTHB, B.P.32, El Alia 16111-Bab Ezzouar Alger, Algeria [email protected] Received 7 July 2010; Accepted 3 October 2010 Abstract: This work reports the effect of heat treatment on the porosity and surface chemistry of two series of activated carbons prepared from a local agricultural biomass material, date pits, by physical activation with carbon dioxide and steam. Both series samples were oxidized with nitric acid and subsequently heat treated under N 2 at 973 K in order to study the effect of these treatments in porosity and surface functional groups of activated carbons. When the activated carbons were heat treated after oxidation the surface area and the pore volume increase for both activated carbons prepared by CO 2 and steam activations. However the amount of surface oxygen complexes decreases, the samples keep the most stable oxygen surface groups evolved as CO by temperature-programmed desorption experiments at high temperature. The results show that date pits can be used as precursors to produce activated carbons with a well developed porosity and tailored oxygen surface groups. Keywords: Activated carbon, Heat treatment, Porosity, Surface oxygen complexes Introduction Carbon materials are finding an increasing number of applications in industrial wastewater, in gas treatment, in catalysis, either as supports for the active phases, or as catalysts on their own. Their performance is determined both by their texture and surface chemistry 1,2 . In the case of activated carbons, the texture may be adapted to suit the situation by adequate choice of the activation procedure. On the other hand, the nature and concentration of surface functional groups may be modified by suitable chemical or thermal post- treatments. Oxidation in the gas or liquid phase can be used to increase the concentration of surface oxygen groups, while heating under inert atmosphere may be used to selectively remove some of these functions. Carboxyl, carbonyl, phenol, quinone and lactone groups, have been identified on carbon surfaces 3,4 .
Transcript of Effect of Heat Treatment on the Surface Properties of...
ISSN: 0973-4945; CODEN ECJHAO
E-Journal of Chemistry
http://www.e-journals.net 2011, 8(3), 992-999
Effect of Heat Treatment on the Surface
Properties of Activated Carbons
MERIEM BELHACHEMI*and FATIMA ADDOUN
*Faculté Des Sciences ET Technologie
Université De BECHAR, B.P 417, 08000-Béchar, Algeria
Laboratoire D’étude Physico Chimique Des Matériaux ET Application à L’environnement
Faculté de Chimie, USTHB, B.P.32, El Alia 16111-Bab Ezzouar Alger, Algeria
Received 7 July 2010; Accepted 3 October 2010
Abstract: This work reports the effect of heat treatment on the porosity and
surface chemistry of two series of activated carbons prepared from a local
agricultural biomass material, date pits, by physical activation with carbon
dioxide and steam. Both series samples were oxidized with nitric acid and
subsequently heat treated under N2 at 973 K in order to study the effect of
these treatments in porosity and surface functional groups of activated carbons.
When the activated carbons were heat treated after oxidation the surface area
and the pore volume increase for both activated carbons prepared by CO2 and
steam activations. However the amount of surface oxygen complexes
decreases, the samples keep the most stable oxygen surface groups evolved as
CO by temperature-programmed desorption experiments at high temperature.
The results show that date pits can be used as precursors to produce activated
carbons with a well developed porosity and tailored oxygen surface groups.
Keywords: Activated carbon, Heat treatment, Porosity, Surface oxygen complexes
Introduction
Carbon materials are finding an increasing number of applications in industrial wastewater,
in gas treatment, in catalysis, either as supports for the active phases, or as catalysts on their
own. Their performance is determined both by their texture and surface chemistry1,2
.
In the case of activated carbons, the texture may be adapted to suit the situation by
adequate choice of the activation procedure. On the other hand, the nature and concentration
of surface functional groups may be modified by suitable chemical or thermal post-
treatments. Oxidation in the gas or liquid phase can be used to increase the concentration of
surface oxygen groups, while heating under inert atmosphere may be used to selectively
remove some of these functions. Carboxyl, carbonyl, phenol, quinone and lactone groups,
have been identified on carbon surfaces3,4
.
993 MERIEM BELHACHEMI et al.
Two series of activated carbons with high porosity were prepared from date pits using CO2 and
steam activations method. The oxidized-AC and heat treated-AC samples were prepared by acidic
oxidization and heat treatment at 700 °C, respectively. The objective of this work is to make analysis
of the effect caused by the oxidation and heat treatments in the development of porous structure and
surface chemistry of both series of activated carbons prepared with different degrees of activation.
Experimental The two series of activated carbons were prepared from a common char, prepared by the
carbonization of date pits (nitrogen flow of 150 mL/min; 1098 K; heating rate, 5 K/min;
residence time 2 hours). A common horizontal furnace was used for the different activation
processes, defined as follows:
- Series C: the char was activated with CO2 (150 mL/min) at 1073 K using different
periods of time, i.e. 120, 180, 270, 460 and 560 min, which correspond to burn-off
of 16, 28, 37, 50 and 64% respectively.
- Series S: the char was submitted to physical activation with steam (150 mL/min) at
1073 K using different periods of time, i.e. 45, 75 and 120 min, which correspond
to burn-off of 11, 34 and 49% respectively.
Further experimental details can be found in reference5. The nomenclature of all activated
carbons includes the letter for the series and the burn-off reached. In order to study the effect of
surface functional groups in the texture and the nature of activated carbons. The samples of series C
and series S were treated with concentrated HNO3 (14 M) at boiling temperature for 10 min. Then,
they were washed with distilled water and dried at 378 K. The prepared activated carbons are
respectively named as C(burn-off)N and S(burn-off)N. Subsequently the thermal treatment was
performed on a fraction of oxidized samples under a N2 flow with a heating rate of 10 K/min until
final temperature of 973 K and kept at this temperature for 1 h in order to selectively remove some of
the oxygen surface groups. The samples obtained was referred as C(burn-off)NT and S(burn-off)NT.
N2 and CO2 adsorption-desorption isotherms were obtained in a static manometric
apparatus at 77 K and 273 K, respectively. Before the experiment, the samples were outgassed
at 423 K for 4 h under vacuum (10-3
Pa). The ‘‘apparent” surface area was obtained using the
BET method. The micropore volume (V0(N2)) was deduced from the N2 adsorption data using
the Dubinin-Raduskevitch (DR) equation, while the mesopore volume (Vmeso) was obtained as
the difference between the total pore volume (VT(N2)) adsorbed at p/po≈ 0.95 and the micropore
volume (V0(N2)). The pore volume corresponding to the narrow microporosity (V0(CO2)) was
obtained after application of the DR equation to the CO2 adsorption data6 .
Temperature-programmed desorption experiments under helium were carried out to
evaluate the amount and nature of the oxygen surface groups present in each sample. Thus,
100 mg of sample were placed in a U-shaped quartz reactor on-line coupled to a quadrupole
mass spectrometer (Balzer MSC200). The experiments were performed up to 1273 K under
a he flow (50 mL/min) and a heating rate of 10 K /min. The amount of CO and CO2 evolved
were quantified after calibration with calcium oxalate (CaC2O4- H2O).
Results and Discussion
Textural change
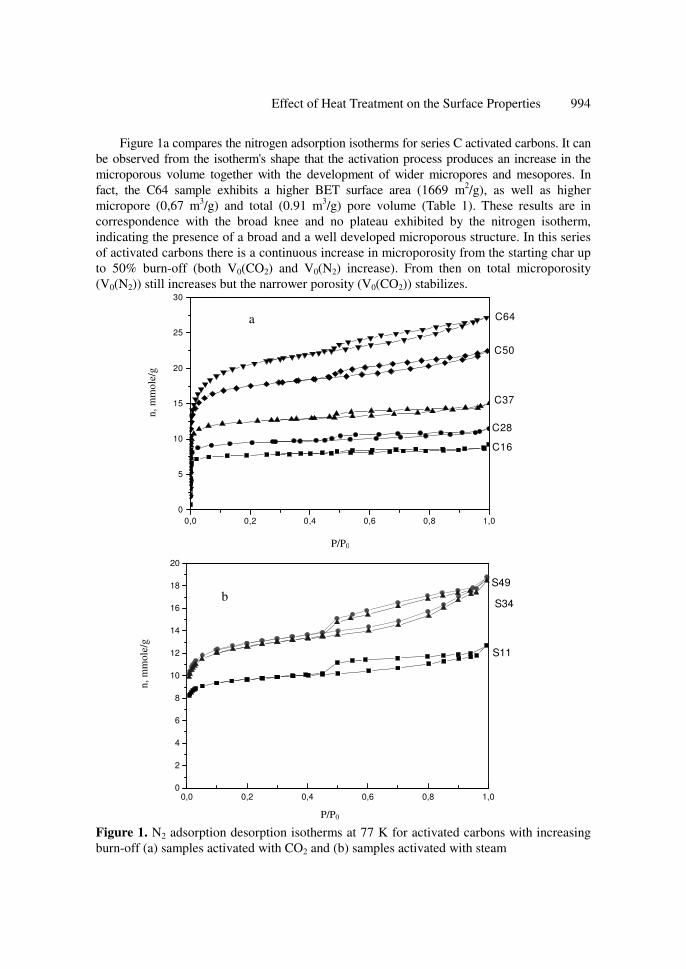
N2 adsorption desorption isotherms at 77 K for the different activated carbons are shown in
Figure 1. Additionally, Table 1 reports the textural characteristics obtained from the N2 and
CO2 adsorption isotherms at 77 K and 273 K, respectively. It can be observed that the increase
in the degree of activation brings about an increase in the porosity for both series C and S.
n,
mm
ole
/g
P/P0
a
P/P0
n,
mm
ole
/g
b
Effect of Heat Treatment on the Surface Properties 994
Figure 1a compares the nitrogen adsorption isotherms for series C activated carbons. It can
be observed from the isotherm's shape that the activation process produces an increase in the
microporous volume together with the development of wider micropores and mesopores. In
fact, the C64 sample exhibits a higher BET surface area (1669 m2/g), as well as higher
micropore (0,67 m3/g) and total (0.91 m
3/g) pore volume (Table 1). These results are in
correspondence with the broad knee and no plateau exhibited by the nitrogen isotherm,
indicating the presence of a broad and a well developed microporous structure. In this series
of activated carbons there is a continuous increase in microporosity from the starting char up
to 50% burn-off (both V0(CO2) and V0(N2) increase). From then on total microporosity
(V0(N2)) still increases but the narrower porosity (V0(CO2)) stabilizes.
0,0 0,2 0,4 0,6 0,8 1,0
0
5
10
15
20
25
30
C64
C50
C37
C28
C16
0,0 0,2 0,4 0,6 0,8 1,00
2
4
6
8
10
12
14
16
18
20
S49
S34
S11
Figure 1. N2 adsorption desorption isotherms at 77 K for activated carbons with increasing
burn-off (a) samples activated with CO2 and (b) samples activated with steam
n,
mm
ole
.g-1
P/P0
a
995 MERIEM BELHACHEMI et al.
All adsorption isotherms of series S (Figure 1b) present an hysteresis (the desorption is
not coexistent with the adsorption isotherm) from the first stage of activation, indicating the
presence of mesopores.then total microporosity (V0(N2)) strongly increases from the char up
to about 11% burn-off, the development being less accentuated for higher activation degrees.
Narrow microporosity (V0(CO2)) also increases in the initial stages (from 0.20 to 0.33 cm3 g
-1),
but then it remains constant as activation proceeds. This means that only widening of
existing narrow micropores occurs during the rest of activation.
From these results, it clear that activation with carbon dioxide uniformly develops all the
pore size ranges, as increasing activation produces a continuous increase in the volume of
both micropores and mesopores, however steam is more effective in micropore widening5.
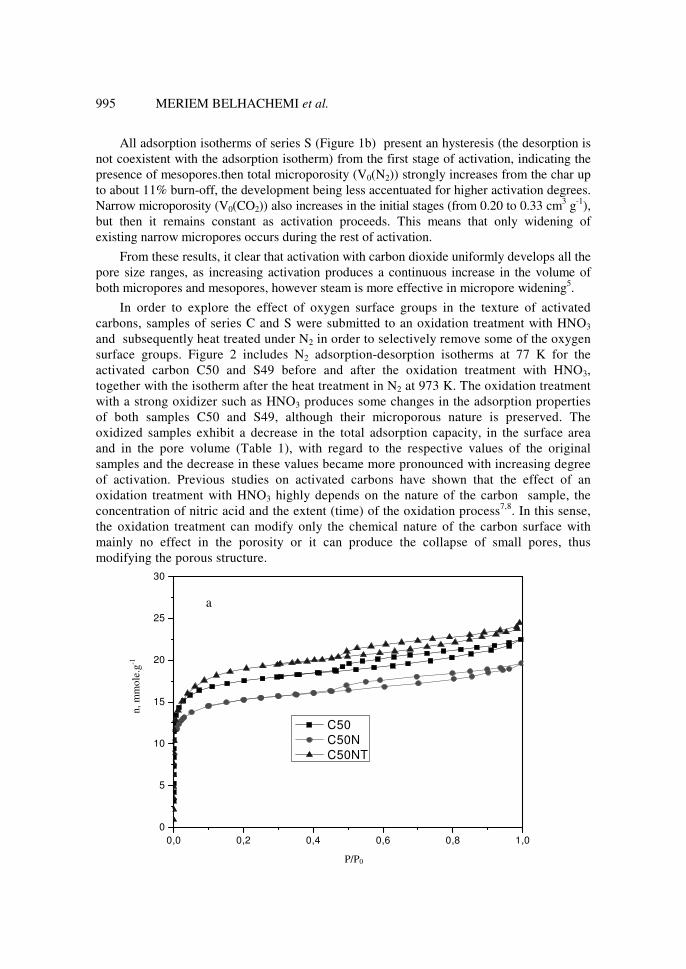
In order to explore the effect of oxygen surface groups in the texture of activated
carbons, samples of series C and S were submitted to an oxidation treatment with HNO3
and subsequently heat treated under N2 in order to selectively remove some of the oxygen
surface groups. Figure 2 includes N2 adsorption-desorption isotherms at 77 K for the
activated carbon C50 and S49 before and after the oxidation treatment with HNO3,
together with the isotherm after the heat treatment in N2 at 973 K. The oxidation treatment
with a strong oxidizer such as HNO3 produces some changes in the adsorption properties
of both samples C50 and S49, although their microporous nature is preserved. The
oxidized samples exhibit a decrease in the total adsorption capacity, in the surface area
and in the pore volume (Table 1), with regard to the respective values of the original
samples and the decrease in these values became more pronounced with increasing degree
of activation. Previous studies on activated carbons have shown that the effect of an
oxidation treatment with HNO3 highly depends on the nature of the carbon sample, the
concentration of nitric acid and the extent (time) of the oxidation process7,8
. In this sense,
the oxidation treatment can modify only the chemical nature of the carbon surface with
mainly no effect in the porosity or it can produce the collapse of small pores, thus
modifying the porous structure.
0,0 0,2 0,4 0,6 0,8 1,0
0
5
10
15
20
25
30
C50
C50N
C50NT
P/P0
n,
mm
ole
.g-1
b
Effect of Heat Treatment on the Surface Properties 996
0,0 0,2 0,4 0,6 0,8 1,0
0
2
4
6
8
10
12
14
16
18
20
22
S49
S49N
S49NT
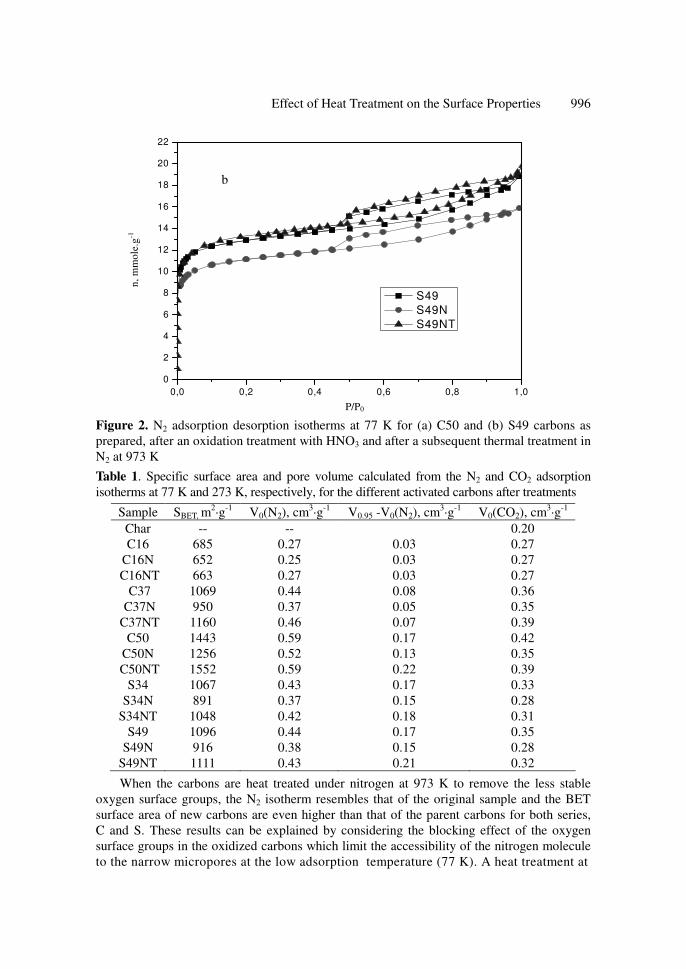
Figure 2. N2 adsorption desorption isotherms at 77 K for (a) C50 and (b) S49 carbons as
prepared, after an oxidation treatment with HNO3 and after a subsequent thermal treatment in
N2 at 973 K
Table 1. Specific surface area and pore volume calculated from the N2 and CO2 adsorption
isotherms at 77 K and 273 K, respectively, for the different activated carbons after treatments
Sample SBET, m2·g
-1 V0(N2), cm
3·g
-1 V0.95 -V0(N2), cm
3·g
-1 V0(CO2), cm
3·g
-1
Char -- -- 0.20
C16 685 0.27 0.03 0.27
C16N 652 0.25 0.03 0.27
C16NT 663 0.27 0.03 0.27
C37 1069 0.44 0.08 0.36
C37N 950 0.37 0.05 0.35
C37NT 1160 0.46 0.07 0.39
C50 1443 0.59 0.17 0.42
C50N 1256 0.52 0.13 0.35
C50NT 1552 0.59 0.22 0.39
S34 1067 0.43 0.17 0.33
S34N 891 0.37 0.15 0.28
S34NT 1048 0.42 0.18 0.31
S49 1096 0.44 0.17 0.35
S49N 916 0.38 0.15 0.28
S49NT 1111 0.43 0.21 0.32
When the carbons are heat treated under nitrogen at 973 K to remove the less stable
oxygen surface groups, the N2 isotherm resembles that of the original sample and the BET
surface area of new carbons are even higher than that of the parent carbons for both series,
C and S. These results can be explained by considering the blocking effect of the oxygen
surface groups in the oxidized carbons which limit the accessibility of the nitrogen molecule
to the narrow micropores at the low adsorption temperature (77 K). A heat treatment at
997 MERIEM BELHACHEMI et al.
temperature (973 K) under nitrogen causes the removal of an important part of the oxygen
surface groups (the less stable groups, evolved as CO2 in temperature-programmed
experiments, together with part of the more stable and less acidic oxygen groups, which
evolve as CO), together with carbon atoms what, in fact, is an activation process that
increases the surface area and the pore volume (mainly the mesoporosity) of carbons. The
results are more pronounced for carbons prepared with CO2 activation and with high burn off.
In summary, these results show that the oxidation treatment of samples with a strong
oxidizer (HNO3) modifies the surface chemistry with mainly no effect on the porosity. The
newly created oxygen surface groups located in the pore mouth of the micropores gives rise
to diffusional restrictions for the N2 molecule at 77 K. However, a subsequent heat treatment
at high temperature (973 K) with N2 is able to completely recover the adsorption properties
and surface area of the original activated carbon.
Change in surface chemistry
The amount and nature of the oxygen surface groups on the different activated carbons has been
analyzed by temperature-programmed desorption experiments. In this sense, Table 2 reports the
total amount of oxygen surface groups evolved both as CO2 and CO for all activated carbons
before and after treatments. According to Table 2, an increase in burn-off has mainly no effect
in the total amount of oxygen surface groups evolved as CO2 (carboxylic acid, lactone, etc.), i.e.
the least stable groups. However, the situation is different for the oxygen surface groups
evolved as CO, i.e. the most stable groups. The amount of CO increases with increasing degree
of activation for both series. As the burn-off is directly related to the severity of the activation
process, this could be due to the higher thermal stability of CO evolving groups and the lower
thermal stability of the CO2 evolving groups. The amount of CO evolved is higher and it
depends on the activating agent. This effect is clearly reflected in the CO/CO2 ratio, which
increases continuously with the degree of activation. However, this value is not meaningful for
activated carbons of series S (activated with steam). Thus, the activation treatment with CO2
slightly favors the development of oxygen surface groups, mainly those evolved as CO.
Table 2. Amount of CO2 and CO evolved during the TPD experiments on the as-synthesized,
oxidized and heat treated activated carbons
Sample CO, mmol.g-1
CO2, mmol.g-1
CO/CO2
C16 0.89 0.41 2.1
C16N 1.5 0.38 3.9
C16NT 0.82 0.27 3.0
C37 1.17 0.43 2.7
C37N 2.55 1.05 2.4
C37NT 0.92 0.14 6.5
C50 1.22 0.39 3.1
C50N 2.67 1.04 2.5
C50NT 0.74 0.06 12.3
S34 0.90 0.40 2.2
S34N 3.23 1.15 2.8
S34NT 0.59 0.10 5.9
S49 0.95 0.40 2.3
S49N 3.53 1.51 2.3
S49NT 0.49 0.09 5.4
T, K
CO
, m
mo
le/g
.s
a
Effect of Heat Treatment on the Surface Properties 998
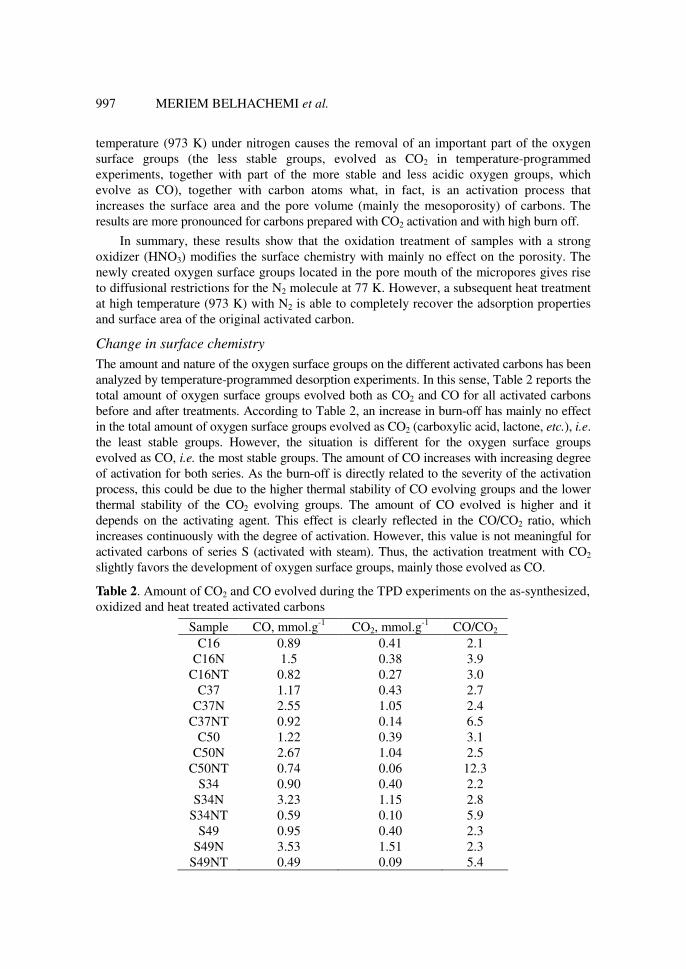
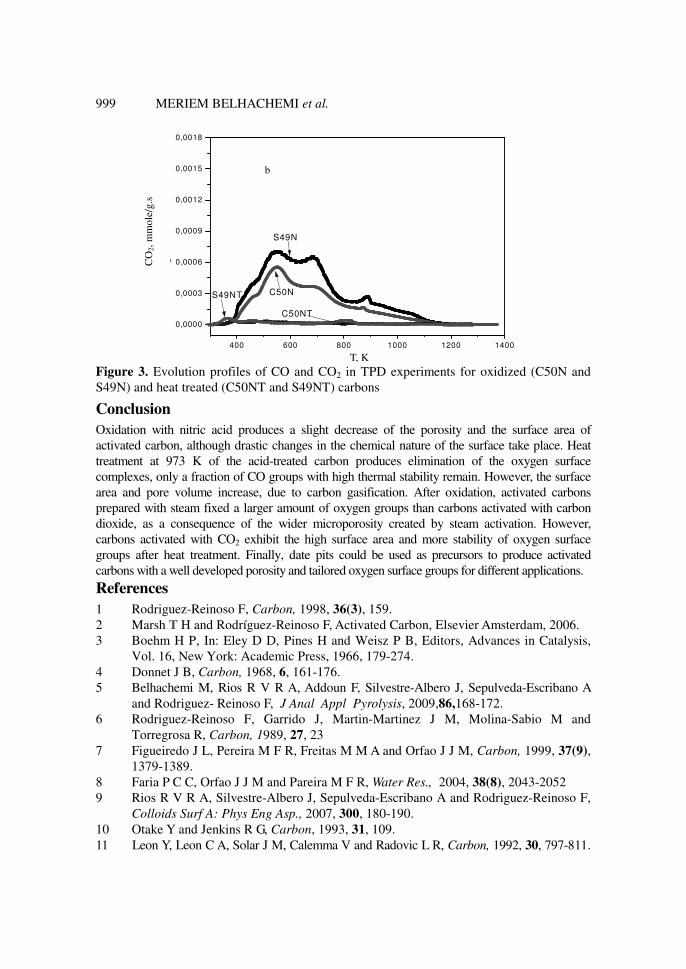
The oxidation and thermal treatment produce important changes in the surface
chemistry. Figure 3 shows the (a) CO2 and (b) CO desorption profiles for the different
activated carbons in the 298-1273 K temperature range. As it can be clearly observed
from this figure, carbon S49N exhibits the highest amount of oxygen surface groups,
these groups being mainly evolved as CO. The CO evolution profile presents a large
peak at high temperatures (973-1123 K), which results from the decomposition of
phenols, ethers and carbonyls7,9
. Additionally from Table 2, the oxidized samples
exhibit an important increase in the total amount of oxygen surface groups evolved both
as CO2 and CO, this enhancement being higher for the CO2 groups (lower CO/CO2
ratio). The oxygen surface groups increase with increasing burn-off, which is attributed
to the higher surface area and more developed porosity of the starting activated carbons
with the degree of activation. Samples of series S were able to fix a larger amount of
oxygen groups than series C, probably because of their wider microporosity and
subsequent better accessibility to the acid solution. However, the subsequent thermal
treatment in N2 up to 973K is more effective for the more acid groups as observed from
the increase in the CO/CO2 ratio in both series. On the other hand, C50NT exhibits a
CO peak at high temperature from 1073 K to 1273 K (see Figure 3a). These groups can
be assigned to carbonyl, quinone, pyrone and chromene type structures which have
basic properties. Thermally treated samples have a basic character which is due to this
kind of oxygen-containing groups and mainly to the electron rich oxygen-free sites
located on the carbon basal planes11
. However the amount of CO2 evolved is almost nil
for both samples (C50NT and S49NT); the sample C50NT presents the highest CO/CO2
ratio. As a result, the activated carbons prepared with carbon dioxide with high degree
of activation present the most stable groups, as it was already noted in the parent
activated carbons.
200 400 600 800 1000 1200 1400
0,0000
0,0002
0,0004
0,0006
0,0008
0,0010
0,0012
0,0014
0,0016
0,0018
CO
(m
mo
l/g
.s)
S49N
C50NT
S49NT
C50N
CO
2,
mm
ole
/g.s
T, K
b
999 MERIEM BELHACHEMI et al.
400 600 800 1000 1200 1400
0,0000
0,0003
0,0006
0,0009
0,0012
0,0015
0,0018
2
S49N
C50NS49NT
C50NT
Figure 3. Evolution profiles of CO and CO2 in TPD experiments for oxidized (C50N and
S49N) and heat treated (C50NT and S49NT) carbons
Conclusion
Oxidation with nitric acid produces a slight decrease of the porosity and the surface area of
activated carbon, although drastic changes in the chemical nature of the surface take place. Heat
treatment at 973 K of the acid-treated carbon produces elimination of the oxygen surface
complexes, only a fraction of CO groups with high thermal stability remain. However, the surface
area and pore volume increase, due to carbon gasification. After oxidation, activated carbons
prepared with steam fixed a larger amount of oxygen groups than carbons activated with carbon
dioxide, as a consequence of the wider microporosity created by steam activation. However,
carbons activated with CO2 exhibit the high surface area and more stability of oxygen surface
groups after heat treatment. Finally, date pits could be used as precursors to produce activated
carbons with a well developed porosity and tailored oxygen surface groups for different applications.
References
1 Rodriguez-Reinoso F, Carbon, 1998, 36(3), 159.
2 Marsh T H and Rodríguez-Reinoso F, Activated Carbon, Elsevier Amsterdam, 2006.
3 Boehm H P, In: Eley D D, Pines H and Weisz P B, Editors, Advances in Catalysis,
Vol. 16, New York: Academic Press, 1966, 179-274.
4 Donnet J B, Carbon, 1968, 6, 161-176.
5 Belhachemi M, Rios R V R A, Addoun F, Silvestre-Albero J, Sepulveda-Escribano A
and Rodriguez- Reinoso F, J Anal Appl Pyrolysis, 2009,86,168-172.
6 Rodriguez-Reinoso F, Garrido J, Martin-Martinez J M, Molina-Sabio M and
Torregrosa R, Carbon, 1989, 27, 23
7 Figueiredo J L, Pereira M F R, Freitas M M A and Orfao J J M, Carbon, 1999, 37(9),
1379-1389.
8 Faria P C C, Orfao J J M and Pareira M F R, Water Res., 2004, 38(8), 2043-2052
9 Rios R V R A, Silvestre-Albero J, Sepulveda-Escribano A and Rodriguez-Reinoso F,
Colloids Surf A: Phys Eng Asp., 2007, 300, 180-190.
10 Otake Y and Jenkins R G, Carbon, 1993, 31, 109.
11 Leon Y, Leon C A, Solar J M, Calemma V and Radovic L R, Carbon, 1992, 30, 797-811.

Submit your manuscripts athttp://www.hindawi.com
Hindawi Publishing Corporationhttp://www.hindawi.com Volume 2014
Inorganic ChemistryInternational Journal of
Hindawi Publishing Corporation http://www.hindawi.com Volume 2014
International Journal ofPhotoenergy
Hindawi Publishing Corporationhttp://www.hindawi.com Volume 2014
Carbohydrate Chemistry
International Journal of
Hindawi Publishing Corporationhttp://www.hindawi.com Volume 2014
Journal of
Chemistry
Hindawi Publishing Corporationhttp://www.hindawi.com Volume 2014
Advances in
Physical Chemistry
Hindawi Publishing Corporationhttp://www.hindawi.com
Analytical Methods in Chemistry
Journal of
Volume 2014
Bioinorganic Chemistry and ApplicationsHindawi Publishing Corporationhttp://www.hindawi.com Volume 2014
SpectroscopyInternational Journal of
Hindawi Publishing Corporationhttp://www.hindawi.com Volume 2014
The Scientific World JournalHindawi Publishing Corporation http://www.hindawi.com Volume 2014
Medicinal ChemistryInternational Journal of
Hindawi Publishing Corporationhttp://www.hindawi.com Volume 2014
Chromatography Research International
Hindawi Publishing Corporationhttp://www.hindawi.com Volume 2014
Applied ChemistryJournal of
Hindawi Publishing Corporationhttp://www.hindawi.com Volume 2014
Hindawi Publishing Corporationhttp://www.hindawi.com Volume 2014
Theoretical ChemistryJournal of
Hindawi Publishing Corporationhttp://www.hindawi.com Volume 2014
Journal of
Spectroscopy
Analytical ChemistryInternational Journal of
Hindawi Publishing Corporationhttp://www.hindawi.com Volume 2014
Journal of
Hindawi Publishing Corporationhttp://www.hindawi.com Volume 2014
Quantum Chemistry
Hindawi Publishing Corporationhttp://www.hindawi.com Volume 2014
Organic Chemistry International
Hindawi Publishing Corporationhttp://www.hindawi.com Volume 2014
CatalystsJournal of
ElectrochemistryInternational Journal of
Hindawi Publishing Corporation http://www.hindawi.com Volume 2014