Effect of Harvest Maturity on the Chemical Composition of ...
32
Effect of Harvest Maturity on the Chemical Composition of Cascade and Willamette Hops Sharp, D. C., Townsend, M. S., Qian, Y., & Shellhammer, T. H. (2014). Effect of Harvest Maturity on the Chemical Composition of Cascade and Willamette Hops. Journal of the American Society of Brewing Chemists, 72(4), 231-238. doi:10.1094/ASBCJ-2014-1002-01 10.1094/ASBCJ-2014-1002-01 American Society of Brewing Chemists Accepted Manuscript http://cdss.library.oregonstate.edu/sa-termsofuse
Transcript of Effect of Harvest Maturity on the Chemical Composition of ...
Effect of Harvest Maturity on the Chemical Composition of Cascade and Willamette Hops
Sharp, D. C., Townsend, M. S., Qian, Y., & Shellhammer, T. H. (2014). Effect of Harvest Maturity on the Chemical Composition of Cascade and Willamette Hops. Journal of the American Society of Brewing Chemists, 72(4), 231-238. doi:10.1094/ASBCJ-2014-1002-01
10.1094/ASBCJ-2014-1002-01
American Society of Brewing Chemists
Accepted Manuscript
http://cdss.library.oregonstate.edu/sa-termsofuse

Effect of Harvest Maturity on the Chemical Composition of Cascade and Willamette Hops
Daniel C. Sharp1, M. Shaun Townsend2, Yanping Qian2, Thomas H. Shellhammer1
1Departments of Food Science and Technology, 2Crop and Soil Sciences, Oregon State
University Corvallis, OR 97331
Corresponding author. Email: [email protected]
ABSTRACT
Considerable expertise is required to grow high-quality hops, and brewers and hop
growers alike have a common goal of obtaining the highest quality hops possible. Change in the
chemical composition of hops during plant maturation is a dynamic process requiring a
comprehensive chemical and sensory analysis in order to maximize the characteristics of interest
to brewers. The effect of harvest date, location, and cultivar on key chemical components of
Willamette and Cascade hops was investigated for the 2010 and 2011 growing seasons. Hops
were harvested at 3 time points (Early, Typical, and Late), within a 3-week interval from 2
different farms in the Willamette Valley, Oregon. A split-plot experimental design for each
cultivar was used; each farm represented a main plot and harvest years were designated as
subplots. American Society of Brewing Chemist standard methods of analysis were used to
measure moisture content, hop acids and their homologs, hop storage index, total essential oil
content and volatile profile by GC-FID. Additionally, difference testing, descriptive analysis, and
consumer acceptance testing was conducted using beers brewed with either Typical or Late
harvested Cascade hops from the 2010 harvest year. The response of analytes was dependent on
the cultivar being examined, its location within the Willamette Valley, as well as timing of
harvest. Hop acids did not change appreciably during plant maturation for the period examined,

while hop oil content increased. Increases in oil quantity were strongly correlated (r > 0.90) with
increases in α-pinene, β-pinene, myrcene, limonene, methyl heptanoate, and linalool
concentrations. Clear sensory differences were found between beers brewed with Typical and
Late harvested Cascade hops using triangle testing, consumer preference testing, and descriptive
analysis.
Keywords: Aroma, Essential Oil, GC-FID, Hop Acids, Terpenes
INTRODUCTION
Much of the characteristic aroma and flavor of beer can be attributed to the combination
of key chemical compounds extracted from either fresh or dried hop cones. Extraction and
dissolution of these compounds into beer can be achieved by sophisticated preliminary
processing steps, such as the addition of supercritical CO2 extracted hop material, or by simply
adding hops (pelletized or whole) during the brewing process. The nature and nuance of hop-
derived aromas and flavors is dictated in large part by the chemical compounds extracted, and in
turn, the chemical composition of the hops from which they were derived. As such, the
composition of hops has a direct impact on not only the flavor and aroma of finished beer, but
also the storage stability of finished beer. The soft resin, namely the α-acids, and the essential oil
fraction stored in the glandular trichomes (lupulin glands) of hops make the predominant
contributions to the aroma and flavor of beer. Much of the hoppy aroma in beer is attributed to
the essential oil fraction while α-acids are the precursors to the main source of hop-derived
bitterness in beer. Additionally, it has been shown that pre-harvest conditions (5), post-harvest
processing (9) and varietal factors influence the composition of the essential oil fraction as well

as α-acid content(6) . The composition of the essential oil of hops is an extremely complex
mixture with over 450 identified compounds and suggestions that over 1000 chemical
compounds may exist (9). Much work has been done in attempting to identify important odor
active hop compounds in both processed hops and beer to gain a better understanding of how the
aroma characteristics in hops as a raw ingredient influence the flavor of beer (7, 17, 20, 25).
Many of these compounds exist well below sensory detection threshold quantities and yet still
may significantly contribute to the aroma profile of hops either through synergistic effects with
other compounds (27)or biotransformation during fermentation (10, 11, 12, 15, 28) into more
odor active compounds. Although the list of compounds that are likely to contribute to hop
aroma is quite long when considering all cultivars, the list becomes somewhat smaller when each
cultivar is considered individually, as each cultivar has its own unique essential oil profile.
Additionally, a smaller set of compounds may serve as an indicator of change within a cultivar
due to environmental or management conditions during cultivation or storage (19).
In order to effectively control the hop aroma in beer, it is important to investigate both
extrinsic factors such as processing operations, handling and storage of hops as well as intrinsic
factors such hop maturation prior to harvest. It is well known that hops are influenced by factors
such as daylight, growing conditions, and post-harvest processing conditions, and that much of
the quality and character they can potentially lend to beer is determined before arriving at the
brewery (5,9). What is not well known is how the maturity stage or harvest timing influences the
aroma and flavor qualities of hops. The detailed account of hop terpene biosynthesis by Wang et
al. (29) provides helpful insight into the biosynthetic and enzymatic pathways of principle hop
terpenes associated with approximate developmental stages, but it does not address the changes
of other key aroma compounds and how they relate to harvest timing beyond 4 weeks after onset

of flowering. Therefore, investigation of cultivation, harvest and post-harvest handling of hops is
critical to understanding the agronomic factors that affect hop quality. The aim of this work was
to investigate the effect of hop harvest date on α- and β- acid content and profile, total essential
oil content, and essential oil profile of two important hop varieties, 'Cascade' and 'Willamette'.
Results are from samples obtained during the 2010 and 2011 harvests. A list of target compounds
of interest was generated based on examination of previous studies investigating the contribution
of hop aroma compounds in beer (18), hop aroma compound analysis (22), and preliminary
analysis using GC-MS capabilities within the Department of Food Science and Technology at
Oregon State University (data not shown). For practical reasons, the list of target analytes was
refined based on the concentration in the hops and the maximum concentrations likely to be
found in beer brewed with these hops. Bittering acid content was also monitored to examine
whether bittering acid concentrations were affected as a result of changes in harvest timing. For
the purpose of this study, traditional cohobative hydro-distillation was used for its simplicity and
practicality of relating results to standard methods used by most hop analysis labs.
EXPERIMENTAL
Hops and Cultivation
Willamette and Cascade hops from the 2010 and 2011 growing seasons were harvested
from two commercial farms located at approximately the same latitude (N 44.850° - 45.001°) on
the east and west sides of the Willamette Valley in Oregon, USA. Hops were sampled
approximately 10-14 days prior to the projected commercial harvest date, on the commercial
harvest date, 5-10 days after the commercial harvest and designated as either Early, Typical, or
Late harvest, respectively (Figure 1). Differences between dates and within-harvest time points

for each year and farm were due to the discrepancy between the predicted Typical harvest dates,
from which the Early time points were determined, and the actual Typical harvest dates.
On both farms, plants were managed during the growing season using typical hop
production practices for the Willamette Valley. Downy mildew (Pseudoperonospora humuli
Miyabe & Takah.) G.W. Wilson control measures included the use of a copper-based fungicide
on each farm with application dates ranging from mid-May to mid-June. Previously, Kishimoto
et al. (16) have suggested that copper-based fungicides might affect the accumulation of some
hop chemical compounds.
Three samples (~600-700g fresh, not dried) of each hop cultivar were randomly obtained
at each of the two farms for each of the three time-points in the 2010 and 2011 harvests for a
total of 72 samples. Samples of hops from the Early and Late time points were hand-picked from
sidearms located in the lower, middle and upper canopy of randomly selected plants growing in
well-established commercial hop yards at each farm. Samples from the Typical harvests were
collected directly from on-farm hop picking machinery just prior to commercial kilning. Late-
harvested samples, except for late-harvested Cascade from Farm I in 2011, were taken from a
group of plants hanging at the end of one row. Samples from the 2011 Late-harvested Cascade
from Farm I were harvested from the remnant, untrained ground shoots due to all of the bines
being mistakenly harvested during the Typical commercial harvest date. These samples may be
unrepresentative of commercially harvested hops for that time point.
Sample Preparation and Storage
Immediately after harvest, samples were dried at 49 °C in a forced air oven for 12 hours
to a moisture content of approximately 8% (w/w), packaged into “mini-bales” weighing
approximately 500 grams and stored in clear plastic bags at ~5° C for no more than 2 days prior
to analysis or packaging for long-term storage. Representative samples were obtained from each
mini bale prior to chemical analysis according to the American Society of Brewing Chemists
sampling protocol for hops (2). Unused hops were packaged in plastic dual layer foil pouches,
flushed with nitrogen, vacuum-sealed, and stored at -20° C.
Chemical Analysis
Each dried sample was analyzed for moisture, hop storage index, α-and β-acid content,
cohumulone and colupulone content, total essential oil volume, and essential oil profile
determination by gas chromatography using American Society of Brewing Chemists Standard
Methods of Analysis (2) and modified in some cases as described below. All results were
normalized to 8% (w/w) moisture content prior to statistical analysis. Dry matter content was
also measured (data not shown) for each sample but displayed such high variation and sensitivity
to uncontrollable factors that it was not a practical indicator of maturity and ultimately not used
in this study.
Hop acids measurements
Hop storage index was measured according to ASBC method Hops-12 (2).
Concentrations of α-acids and β-acids, as well as cohumulone and colupulone percentages, were
measured using HPLC. Extraction, dilution, identification and quantitation techniques of
bittering acids were performed according to ASBC Hops-14 (2). Chromatographic determination
was performed using an Agilent 1200 series HPLC system (Boblingen, Germany) equipped with
a 100 x 4.6mm Kinetex C18, 2.6 µm column (Phenomenex, Torrance, California, USA) held at a
constant temperature of 40ºC. The flow rate was 1.3 ml/min with a 7 µL injection volume. Three
mobile phases were used for separation. Mobile phase A was 100% water, mobile phase B was
75% methanol, 24% water, and 1 % phosphoric acid and mobile phase C was 100% methanol.
Initially, elution began with 10% of mobile phase A and 90% B for the first 8 min, followed by a
gradient of 100% mobile phase C for 5 minutes which was then followed by another gradient
back to 10% mobile phase A and 90% mobile phase B for an additional 5 minutes and then held
for 7 minutes (total run time = 25 minutes). The ASBC International Calibration Extract (ICE-3)
was used as a standard for peak identification and quantitation.
Essential oils
Total essential oil content of hop samples was determined by cohobative hydro-
distillation according to ASBC method Hops -13 (2) using a modified sample preparation
method. Instead of grinding the sample using a food chopper as recommended by the ASBC
standard method of analysis, 100-110 grams of whole dried hops were blended for 30 seconds
with 1.5 liters of cold deionized water using a 3.8 liter stainless steel blender (Waring CB15) and
transferred quantitatively using an additional 1.5 liters of deionized water to a 5000 ml round
bottom boiling flask. After 4 hours of distillation, oil samples were cooled to room temperature
in the receiver before the volume of the oil fraction was measured, which was then collected and
stored at 5ºC in 4 ml glass vials purged with nitrogen gas and capped with foil lined screw-top
caps until GC-FID analysis.
Hop oil composition
Chromatographic separation of hop oil components was performed according to the
standard method (2), but with a modified temperature program optimized for adequate separation
of target compound peaks. A Hewlett Packard 5890 GC-FID with a HP 7673A auto-sampler was
used for sample injection. Compounds were separated on a 30 m x 0.25 mm I.D. fused silica
capillary Supelcowax 10 column (Supelco) with a 0.5 µm film thickness. The modified
temperature program started at 60º C held for 1 minute, ramped at a rate of 3ºC/minute to 175ºC
and held for 10 min, then ramped at 3ºC to 230ºC and held for 10 min. A split ratio of 1:50 was
used with a carrier gas of pure nitrogen at a flow rate of 1 ml/min. The injector temperature and
FID temperature were 200ºC and 250º C respectively. Quantification of compounds was
determined by using an internal standard of 2-octanol as outlined in ASBC Hops-7 (2). Area
integration reject was set to 1 mV. The compounds of interest analyzed by GC-FID are
summarized in Table I. Analytical standards used for peak identification were obtained through
Sigma-Aldrich and were of >95% purity unless noted otherwise. Characteristic aroma
descriptions of each compound are shown for each standard (Table I).
Experimental Design and Statistical Analysis
A split-plot experimental design for each cultivar was used; each farm represented a main
plot and harvest years were designated as subplots. Statistical analysis was performed using a
general linear regression of the following mixed model: response = Farm + Harvest +
Farm*Harvest + Farm*Year*Time with Farm being assigned as a random factor. Mixed models
are used for the statistical analysis of experimental designs which include both a fixed (assigned)
variable and a categorical predictor variable that can be considered a random effect; a
classification that assumes the levels of the variable have been randomly selected from a
population of possible levels. In this study, the Farm variable was considered to be a random
variable assigned to each hop sample. The scope of inference was considered to be Cascade and
Willamette hops grown in the Oregon Willamette Valley.
All summary statistics, analysis of variance and post-hoc multiple comparisons tests for
instrumental data were generated using SAS/STAT software, Version 9.2 of the SAS system
software for Windows (Copyright 2002-2008 by SAS Institute Inc., Cary, NC, USA).
For sensory testing, data collection and analysis of variance was conducted on the sample
means for overall liking, aroma liking, and flavor liking using Compusense 5.0®, version 4.6,

Guelph, Canada. Statistically significant attributes were subjected to post-hoc analysis using
Tukey’s HSD test at the 95% confidence interval.
Sensory Analysis
By coincidence, 25 hL brewing trials were being conducted independently by a local
brewery investigating the effects of hop harvest timing on beers. Although not part of the initial
experimental design, the opportunity to perform sensory testing was not ignored. Difference
testing, consumer acceptance and descriptive analysis was carried out on beers made with
Cascade hops from the 2010 Typical and Late harvest periods from Farm I. Because the Early
harvested samples displayed brewing values that were quite low and not of practical commercial
interest, brewing trials were not conducted using Early harvested hops. It should be noted that
hops used for brewing trials were sampled separately from those used for chemical analysis but
in a manner consistent to that described in the methods section.
Brewing and Sample Preparation
Beers were brewed commercially by an Oregon brewery with every attempt to produce
identical beers, aside from the effects of each having been brewed with Cascade hops harvested
at different points. In order to highlight hop character, a pale ale style beer (5.25% ABV, 15
SRM) hopped to 32 IBU’s was brewed. Hop dosages consisted of a 75 minute kettle boil
addition and a 30 minute kettle boil addition each dosed at 1.45 grams hops/liter wort followed
by a whirlpool late hop addition of 5.50 g/L. Wort was fermented using a British ale type yeast at
18 C to ending apparent gravities of 2.70°P. Filtered and carbonated beer samples were received
from the brewery in 22 L stainless steel kegs and stored at 1° C until testing. Beer analyses such
as color, gravity, IBUs, and alcohol were conducted onsite by brewery staff. Due to limitations,
all sensory testing was performed on a single batch of each beer although a replicated study
design would have been ideal.

Difference testing
Difference testing of beer samples was performed using triangle tests to determine if a
noticeably significant difference existed. Panelists (n=18) consisted of untrained Oregon State
University Brewing Science students. Each panelist was assigned a random presentation order
and asked to identify the sample (Late harvest) that was different from the other two (Typical
harvest).
Consumer Acceptance
Consumer acceptance of beers hopped with either 2010 Typical or Late harvested
Cascade hops was carried out at the OSU Sensory Science Lab. Sixty-two consumers were
recruited from the local community (Corvallis, Oregon). Prospective consumers were screened
on the following criteria: 1) between the ages of 21 and 55; 2) consume beer at least once per
month; and 3) indicated that pale ale style beers were within their top 3 most preferred styles of
beer. Fifty five (89%) of the consumers were between 21 and 29 years old while 17 (11%) were
between 30 and 55 years old. Forty three (69%) were male and the remaining 19 (31%) were
female. Each consumer received a 75 ml sample of each beer for evaluation and asked to rate
acceptance for overall liking, aroma, and flavor using a 9-point hedonic scale; Rating Scale:
1=dislike extremely, 2=dislike very much, 3=dislike moderately, 4=dislike slightly, 5=neither
like or dislike, 6=like slightly, 7=like moderately, 8=like very much, and 9=like extremely.
Samples were served in clear 300 ml glasses covered with a clear plastic odorless lid to minimize
aroma loss. Each glass was identified by a three-digit random number. Samples were served to
each consumer in monadic order and the first sample served was removed before the consumer
received the second sample. Serving order was randomized so that approximately 50% of the
consumers evaluated the Typical sample first and 50% of the consumers evaluated the Late
sample first. Saltine crackers and water were provided to panelists for palette cleansing between
samples.
Descriptive analysis
Descriptive sensory analysis was performed using 12 trained panelists who had been
extensively involved with recent sensory work regarding beer evaluations. Samples were allowed
to equilibrate to room temperature (20° C) during evaluation to maximize aroma. The descriptive
ballot was based on 13 descriptive terms developed by the panel during preliminary consensus
based training sessions for beer aroma with a focus on hop derived aromas and contained the
following descriptive attributes; fruit cocktail, tropical fruit, melon, grapefruit, estery, green
apple, rose, floral, green hop, pine, apricot/peach, sweaty/onion/garlic, and orange. Panelists met
only once to assess the beers and examined each beer once. There were no repeated measures by
any panelist for descriptive analysis.
RESULTS
Hop Acids and HSI
Table II shows the summary of hop acid data for hops from the 2010 and 2011 crop years
harvested at different time points. Values were averaged across all reps from both years to
account for season to season variation. For reference, an H.S.I. greater than or equal to 0.30 is
generally considered to be an indication of aged hops and it should be noted that all values were
between 0.20 and 0.28. Alpha-acid and β-acid percentages are expressed as a per mass basis of
hops normalized to 8% moisture. Cohumulone percentages are expressed on a per mass basis of
α- acids and normalized to 8% moisture.
There were no significant main effects for H.S.I., α-acid content, β-acid content or
cohumulone content for Cascade or Willamette hops (Table III). However, a 3-way Farm by

Harvest by Year interaction (p-value<0.0001) was observed for both hops on all attributes except
H.S.I. values for Willamette hops (Table III). That is, significant differences were found for
H.S.I., α-acids, β-acids, and cohumulone contents depending on time of harvest, the originating
farm, and the harvest year. These results suggest that differences in year-to-year growing
conditions or practices may contribute significant variation to hop chemical content. Other
explanations for variation may be attributed to different and irregular sampling dates within a
given harvest window, the inherent variation among experimental units associated with random
sampling in a large hop yard and, to a lesser extent, inability to exactly reproduce treatment
conditions (harvest dates) from one experimental unit to another over seasons and years. For
future work it is recommended to sample on a regular and consistent schedule for all hop yards
and cultivars being examined.
Total Essential Oil and Composition
Averages and results from Tukey’s HSD (p < 0.05) for essential oil and volatile
components by harvest timing are shown in Table IV. A significant difference in total oil content
of Willamette and Cascade hops was found between harvest time points (p-value < 0.0001) with
a significant 3-way interaction of time, farm, and year (p-value <0.0003) and main effect of
harvest timing as shown in Table V and illustrated in figure 2. Early harvested Cascade and
Willamette hops had lower average oil content compared to Typical and Late harvested hops
(Table IV).
An increase in oil quantity was strongly correlated (r>0.90) with α-pinene, β-pinene,
myrcene, limonene, and linalool contents (data not shown). The percentage of farnesene of the
total oil and humulene/farnesene ratios (Table IV) are shown for comparison to the dichotomous
key proposed by Kenny (14). Farnesene content above 1% was considered characteristic of
Willamette and Cascade hops while a humulene/farnesene ratio below 3 distinguishes the latter
from the former (14) and agrees with the results found here. With the exception of the farnesene
percentage and humulene/caryophyllene ratio, concentrations of compounds are expressed as
milligrams of compound per gram of hops that have been normalized to 8% (w/w) moisture
(Table IV). A similar trend was observed for the montoerpenes that were correlated with oil
increase mentioned above. Significant main effects, 2-way and 3-way interactions were found for
most of the compounds for both Willamette and Cascade hops (Table V).
For Cascade, α-pinene, β-pinene, myrcene, limonene, ρ-cymene, caryophyllene, E, β-
farnesene, and humulene all increased from Early to Typical points but no increase was observed
between the Typical and Late time point. Linalool and methyl heptanoate increased between
each time point while citral and humulene epoxide differed between Early harvest and Late
harvest, but not between Early and Typical or Typical and Late harvests. For Willamette hops, α-
pinene, β-pinene, myrcene, limonene, ρ-cymene, and linalool all increased between each time
point. Caryophyllene, E, β-farnesene, humulene, farnesol and citral all increased from Early
harvest to Typical harvest but no difference was observed between Typical and Late. Geraniol
peaked at Typical harvest date.
Sensory Difference Testing
Fourteen out of eighteen panelists were able to correctly identify the different sample in a
triangle test indicating that a significant sensory difference was observed (p-value < 0.001)
between beers prepared with Typical and Late harvested Cascade hops. This result prompted a
consumer acceptance study and descriptive analysis.
Consumer Acceptance
Mean scores, standard deviations and results from post-hoc tests for overall liking, flavor,
and aroma plus significance values are provided in Table VI. Results indicate a significantly
higher overall liking (p=0.0002), aroma liking (p=0.0004), and flavor liking (p=0.0019) for the

beer hopped with Typical harvest Cascade hops compared to beer hopped with Late harvest hops
(Table VI).
Descriptive Analysis
The Typical harvest date for Cascade hops resulted in a beer with significantly higher
apple, apricot/peach, and sweaty/onion/garlic notes while the Late had higher melon and floral
notes (p<0.05) (Figure 3). Sweaty and onion/garlic notes found in the beers made with Typical
harvest hops may be attributed to trace sulfur containing compounds (24). Interestingly, the
panel found higher floral notes in beers brewed with Late harvested hops despite the lack of
instrumental data showing the increase of aroma compounds typically associated with floral
aroma. This could be due to lack of replication in descriptive testing or an increase in a
compound(s) not investigated here.
DISCUSSION
Although increased oil compound concentrations were observed at later harvest dates,
there is no clear evidence that one specific compound increased more than others, or that one
specific compound is a marker for increased observable differences for later harvest dates as
observed by Murphey and Probasco (21). In general, however, montoerpene hydrocarbons and
linalool did increase over time and may contribute to a different aroma profile. These results
partially corroborate findings by Howard and Slater (13) who observed an initial increase in the
oil content and hydrocarbon fraction (myrcene, humulene, caryophyllene) of Fuggles hops over a
6 week harvest period with an eventual decrease in oil at the latest harvest date, but no
significant increase in the oxygenated fraction. In the present study it was shown that alpha acids
don’t change significantly over the harvest dates investigated for Willamette and Cascade hops.
Similar results were observed in previous studies for Willamette hops but increases were
observed in other varieties (4, 21) suggesting that the optimal harvest timing for maximum alpha

contents is dependent on variety. Also, the cohumulone proportions did not increase for either
hop variety as observed in Fuggles hops by Howard and Slater (13). The 2010 hop growing
season was not considered a “normal” growing season; growers reported that harvest dates were
about 2 weeks later than usual and there was substantial rainfall during commercial harvest
times. Significant variation may have also been artificially included in the model due to sampling
technique and inconsistencies among the sampling intervals across farms, cultivars, and years
(Figure 1).
While increased oil volumes may be desirable for aroma type hops, other properties of
the hops should be considered at each harvest time point to determine the overall quality of the
hops. For example, HSI can be a useful measure of hop quality in terms of the bittering acids, but
provides little information regarding hop quality from an aromatic perspective, other than a non-
specific indication of possible age related aroma compounds. Refractive index and UV spectra
measurements of hop oil have not proved to be indicative of quality or composition, although
decreasing R.I. values have been correlated to later harvested hops (30). A similar measure for
overall hop aroma quality has yet to be determined and due to the complexity of hop aroma, a
single measure will not likely be a useful indicator of aroma properties. Furthermore, hop quality
is a complex term and uniformly negative quality indicators such as isovaleric acid (cheesy
aroma), cone discoloration, and hop cone shattering due to late picking or over-drying should
also be considered. Shattering is particularly important since it leads to a loss of lupulin glands
(i.e. reduced brewing quality) and decreased harvest yields.
Quality indices such as shatter and discoloration were not quantified in this study,
however, it was noted that later harvested hops had a higher tendency to shatter or break apart
during processing. Furthermore, variation in hop cone color was noticeable across the three

harvest dates. Cones harvested early were greener than hop cones harvested late. A yellowing
and eventual browning was observed at the later harvest dates. It should be noted that although
discolored hops are often used for extracted hop production and are not necessarily a definite
index of poor quality, these observations may have commercial significance since brewers often
use color as an indicator of healthy and/or high-quality hops at market.
Hop harvest timing is typically determined by cone dry matter content as an indicator of
overall plant maturity. While cone dry matter content is helpful in gauging hop harvest timing
and was used successfully by Murphey and Probasco (21), sampling technique, plant water
status, disease and pest pressure, and presence of seeds can lead to erroneous estimates of plant
growth stage and harvest readiness. In the present study, we noted inconsistencies in dry matter
determinations across samples, farms for both years of the study. Days in which hops were
harvested during or shortly after it had rained yield erroneous dry matter estimates using standard
drying techniques. Separately, it should be noted that samples were obtained throughout the plant
canopy, and is likely that some immature cones were inadvertently collected from bines that had
self-trained well after the normal spring training date. Collecting all of the samples from the
upper canopy would probably have made for more consistent dry matter determinations (Gene
Probasco, Personal Communication). Additionally, more homogenously equivalent samples
representative of the plot may have been obtained from quantitatively combined subsamples of
mechanically harvested hop cones.
It is clear that hop harvest date has a significant effect on beer flavor, and this
management factor may significantly impact beer flavor and aroma. Interestingly, the
consistently higher consumer acceptance ratings for beers brewed with Typical harvested hops
over Late harvested Cascade hops contradict sensory results from a previous study using

Hallertau Mittelfrueh hops harvested at different time points (4). However, differences from
these results are likely due to differences in hopping regimes (late kettle hopping vs. dry
hopping), hop variety, beer style, regional preferences and sensory testing methods. Results from
an earlier study examining the effects of aging hops prior to brewing(19) showed that both
Cascade and Hallertau Mittelfrueh hops benefited from moderate post-harvest aging to maximize
aromas. However, the same study showed that excessive aging led to a more dramatic aroma loss
in Cascade hops than in Hallertau Mittelfrueh hops (19). Perhaps similar “aging” phenomena
occur while hop cones are still on the bine and lead to beers with a lower consumer acceptance
when made with Cascade hops but not with Hallertau Mittelfrueh hops.
Brewers are intimately aware of the variable bittering acid content of their hops and are
able to adjust hop dosing based upon a chemistry analysis to obtain a consistent product.
However, few quality assurance measures are available for adjusting hopping rates due to
variations in hop aroma profiles. As illustrated here, a statistically significant difference in total
essential oil was observed in hops over a 2-3 week harvest period, and in some cases, significant
changes were observed in less than 1 week. Results from both instrumental and sensory analysis
indicate that more thorough and consistent monitoring of hop aroma chemical composition may
be needed to ensure consistency during brewing.
For this study, the selection of hop oil compounds of interest was based on previous
reports as well as preliminary examination of GC-MS data. However, because hop-derived
aroma is variety dependent, a variety-specific list of target analytes for a given harvest time
might be helpful for brewers. While the results presented here clearly point to compositional
changes in hop chemistry that ultimately affect beer character, the challenge of determining the
optimal harvest timing for certain hop varieties, after considering various management factors,

lies primarily with brewer preference, and ultimately, with consumers. Furthermore, despite
much advancement, a deeper understanding of the compositional variation between hop varieties
is needed such as investigations of sulfur containing compounds, polyphenols, and flavor/aroma
precursors in hops and their relation to hoppy aroma in beer. Therefore, data obtained through
sensory analysis techniques and correlated to instrumental results used to define quality
parameters would ultimately provide the most relevant measures of hop aroma.
ACKNOWLEDGEMENTS
The authors would like to thank Goschie Farms and Coleman Farms for their cooperation with
obtaining samples during hop harvest, Deschutes Brewing Company for brewing beers for
sensory trials, and Indie Hops, LLC for providing financial support.
LITERATURE CITED
1. Acree, T., and Arn, H. Flavornet. http://www.flavornet.org/flavornet.html. (accessed
December 5, 2012). 2004.
2. American Society of Brewing Chemists. Methods of Analysis, online. Hops -1 Sampling, -4C
Moisture, -6 α- and β- acids in hops and hop pellets, -12 Hop storage index, -13 Total
essential oil in hops and hop pellets by steam distillation, -14 α- and β- acids in hops and hop
extracts by HPLC, -17 Hop essential oils by capillary gas-chromatography-flame ionization
detection. The Society, St. Paul, MN, 2012.
3. American Society of Brewing Chemists. Methods of Analysis, online. – Beer Flavor
Database. http://www.asbcnet.org/MOA/Flavors_Database.aspx. (accessed February 15,
2013). The Society, St. Paul, MN, 2012.

4. Bailey, B., Schoenberger, C., Drexler, G., Gahr, A., and Newman, R. The Influence of Hop
Harvest Date on Hop Aroma in Dry-Hopped Beers. MBAA TQ (online). 10.1094/TQ-46-2-
0409-01, 2009.
5. Benitez, J. L., Forster, A., De Keukeleire, D., Moir, M., Sharpe, F. R., Verhagen, L. C., et al.
EBC-Manual of good practice: Hops and Hop Products. Hans Carl-Verlag, Nürnberg. 1997.
6. Briggs, D. E., Boulton, C. A., and Brookes, P. A. Brewing: science and practice. CRC Press.
2004.
7. Eri, S., Khoo, B. K., Lech, J., and Hartman, T. G. Direct Thermal Desorption−Gas
Chromatography and Gas Chromatography−Mass Spectrometry Profiling of Hop (Humulus
lupulus L.) Essential Oils in Support of Varietal Characterization. J. Agric. Food Chem.
(online). 10.1021/jf9911850, 2000.
8. Fenaroli, G., and Burdock, G. A. Fenaroli’s handbook of flavor ingredients. CRC Press,
Boca Raton. 2002.
9. Forster, A. The quality chain from hops to hop products. In: Proceeding from the 48th IHGC
Congress. Barth-Haas Research & Publications, Canterbury. 2001.
10. Gros, J., Nizet, S., and Collin, S. Occurrence of odorant polyfunctional thiols in the super
alpha Tomahawk hop cultivar. Comparison with the thiol-rich Nelson Sauvin bitter variety.
59 (16): 8853–8865, 2011.
11. Gros, J., Peeters, F., and Collin, S. Occurrence of odorant polyfunctional thiols in beers
hopped with different cultivars. First evidence of an S-cysteine conjugate in hop (Humulus
lupulus L.). J. Agric. Food Chem. 60 (32):7805–7816, 2012.
12. Gros, J., Tran, T. T. H., and Collin, S. Enzymatic release of odourant polyfunctional thiols
from cysteine conjugates in hop. J. Agric. Food Chem. 119 (4): 221–227, 2013.
13. Howard, G. A., and Slater, C. A. Effect of Ripeness and Drying of Hops on the Essential Oil.
J. Inst. Brew. 64:234–237, 1958.
14. Kenny, S. T. Identification of U.S.-Grown Hop Cultivars by Hop Acid and Essential Oil
Analyses. J. Am. Soc. Brew. Chem. 48(1):3–8, 1993.
15. King, A. J., and Dickinson, J. R. Biotransformation of hop aroma terpenoids by ale and lager
yeasts. FEMS Yeast Research. 3 (1):53–62 2003.
16. Kishimoto, T., Kobayashi, M., Yako, N., Iida, A., and Wanikawa, A. Comparison of 4-
Mercapto-4-methylpentan-2-one Contents in Hop Cultivars from Different Growing Regions.
J. Agric. Food Chem. 56:1051-1057, 2008.
17. Kishimoto, T., Wanikawa, A., Kagami, N., and Kawatsura, K. Analysis of hop-derived
terpenoids in beer and evaluation of their behavior using the stir bar-sorptive extraction
method with GC-MS. J. Agric. Food Chem. 53(12):4701–4707, 2005.
18. Kishimoto, T., Wanikawa, A., Kono, K., and Shibata, K. Comparison of the Odor-Active
Compounds in Unhopped Beer and Beers Hopped with Different Hop Varieties. J. Agric.
Food Chem. (online). 10.1021/jf061342c, 2006.
19. Lam, K. C., Foster, R. T., and Deinzer, M. L. Aging of hops and their contribution to beer
flavor. (online). 10.1021/jf00070a043, 1986.
20. Lermusieau, G., and Collin, S. The use of GC-olfactometry to assess hop aromatic quality.
In: Proceedings of 28th European Brewery Convention (Budapest), Fachverlag Hans Carl,
Nirnberg, Germany. 2001.
21. Murphey, J. M., and Probasco, G. The Development of Brewing Quality Characteristics in
Hops During Maturation. MBAA TQ 33(3):149–159, 1996.

22. Nickerson, G. B., and Van Engel, E. L. Hop Aroma Component Profile and the Aroma Unit.
50(3):77–81, 1992.
23. Nielsen, T. P. Character-impact hop aroma compounds in ale. In: Hop Flavor and Aroma-
Proceedings of the 1st International Brewers Symposium, Master Brewers Association of the
Americas, St. Paul, Minnesota, USA. pp.59–77. 2009.
24. Olsen, A., Christensen, B. W., and Madsen, J. Ø. Onion-like off-flavour in beer: Isolation
and identification of the culprits. Carlsberg Res. Commun. (online). 10.1007/BF02908410,
1988.
25. Roberts, M. T., Dufour, J.-P., and Lewis, A. C. application of comprehensive
multidimensional gas chromatography combined with time-of-flight mass spectrometry
(gc×gc-tofms) for high resolution analysis of hop essential oil. J. of Sep. Sci. 27(5-6):473–
478, 2004.
26. Steinhaus, M., and Schieberle, P. Comparison of the Most Odor-Active Compounds in Fresh
and Dried Hop Cones (Humulus lupulus L. Variety Spalter Select) Based on
GC−Olfactometry and Odor Dilution Techniques. J. Agric. Food Chem. (online).
10.1021/jf990514l, 2000.
27. Takoi, K., Itoga, Y., Koie, K., Kosugi, T., Shimase, M., Katayama, Y., et al. The
Contribution of Geraniol Metabolism to the Citrus Flavour of Beer: Synergy of Geraniol and
beta-Citronellol Under Coexistence with Excess Linalool. J. Inst. Brew. 116 (3): 251–260,
2010.
28. Takoi, K., Koie, K., Itoga, Y., Katayama, Y., Shimase, M., Nakayama, Y., et al.
Biotransformation of Hop-Derived Monoterpene Alcohols by Lager Yeast and Their
Contribution to the Flavor of Hopped Beer. J. Agric. Food Chem. 58 (8): 5050–5058, 2010.

29. Wang, G., Tian, L., Aziz, N., Broun, P., Dai, X., He, J., et al. Terpene biosynthesis in
glandular trichomes of hop. Plant Physiol. 148(3): 1254, 2008.
30. Wright, R. G., and Connery, F. E. Studies of Hop Quality. In: ASBC Annual Meeting
Proceedings. p.87. 1951.
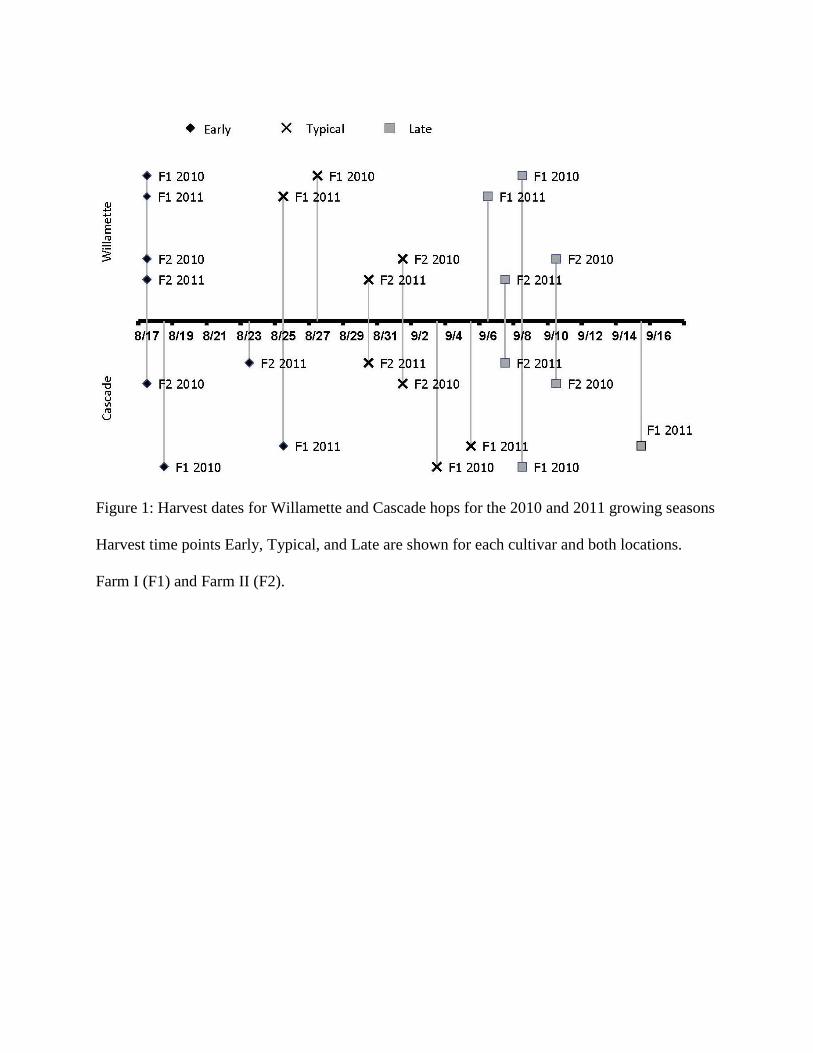
Figure 1: Harvest dates for Willamette and Cascade hops for the 2010 and 2011 growing seasons
Harvest time points Early, Typical, and Late are shown for each cultivar and both locations.
Farm I (F1) and Farm II (F2).

Table I: Target odor compounds in Cascade and Willamette hops
Compound Name Odor Description
ρ-cymene Solvent, gasoline, citrus(1)
α-pinene Pine(8)
Geraniol Floral, citrus, rose-like, flowery(3)
Humulene Epoxides* Hay, grassy(3)
Limonene Citrusy(8)
Citral Lemon, bitter(3)
Farnesol Flower Oil (1)
Geranyl Acetate Rose (1)
Linalool Flowery, fruity, floral, citrus, rose-like(3)
Methyl heptanoate Strong fruity, orris root-like(8)
Citronellol Floral, citrus, rose-like(3)
β-pinene Sharp terpene like pine, coniferous pine(8)
E, β –Farnesene Wood, citrus, sweet(1)
Caryophyllene Woody, spicy, flower, turpentine, clove(3)
Humulene Woody(26)
Myrcene Herbs, metallic, resinous, spicy(3)
* Purity < 80 %

Table II: Summary by harvest time point averages of hop samples from the 2010
and 2011 crops from Farm I and Farm II for hop acid characteristics
Cultivar Harvest H.S.I. α-Acids
(% w/w)
β-Acids
(% w/w)
Cohumulone
(%)
Cascade Early 0.202 8.3 6.4 35.9
(0.007) (0.9) (0.9) (2.6)
Typical 0.209 9.9 6.6 38.9
(0.030) (1.3) (0.7) (2.7)
Late 0.222 8.3 5.5 37.9
(0.009) (1.1) (0.7) (3.2)
Willamette Early 0.225 5.6 4.0 32.7
(0.042) (1.3) (0.8) (1.8)
Typical 0.226 6.3 3.9 34.7
(0.033) (0.7) (0.6) (2.8)
Late 0.245 6.4 4.0 33.1
(0.011) (1.0) (0.5) (2.9)
Standard deviations are shown in parenthesis.

Table III: F-values and significance from Mixed Model ANOVA
Cascade Willamette
Attribute Farm Harvest FarmxHarvest Farmx
Harvestx
Year Farm Harvest FarmxHarvest
Farmx
Harvestx
Year
H.S.I. 0.54 5.37 0.25 5.83*** 0.2 0.45 1.35 7.04
% α-Acids 0.01 5.69 0.47 6.08*** 0.91 0.32 0.87 6.53***
% β-Acids 0.059 3.682 1.826 2.296*** 0.317 0.084 1.261 2.732*
% Cohum 0.76 3.16 0.24 23.26*** 0.53 3.47 0.19 6.95***
Significance levels are indicated for F values at the 99.9% confidence level (***), 99.0% level (**), and the 95.0% level (*)

Table IV: Oil content and profile for Willamette and Cascade hops harvested at three time points
Cascade
Willamette
Attribute Early Typical Late
Early Typical Late
Oil (ml/100g) 1.21b 2.13a 1.98a
0.70c 1.65b 1.81a
α-Pinene1 0.01b 0.02a 0.02a
0.00c 0.01b 0.01a
β-Pinene 0.07b 0.18a 0.17a
0.02c 0.09b 0.11a
Myrcene 4.73b 11.46a 11.21a
1.18c 5.91b 7.73a
Limonene 0.02b 0.05a 0.05a
0.01c 0.02b 0.03a
ρ-cymene 0.01b 0.01a 0.01a
0.00c 0.01b 0.01a
Methyl Hep. 0.03c 0.08b 0.06a
0.03c 0.08b 0.06a
Linalool 0.03c 0.09b 0.07a
0.01c 0.08b 0.10a
Caryophyllene 0.40b 0.89a 0.67a
0.91b 1.45a 1.35a
E, β-farnesene 0.65b 1.06a 0.93a
0.54b 0.98a 1.04a
Humulene 1.42b 2.17a 1.68a
2.66b 4.22a 3.68a
Citral 0.03b 0.06a 0.05a,b
0.03b 0.04a 0.03a
Geranyl Acetate 0.09a 0.17a 0.14a
0.02a 0.03a 0.01a
Citronellol 0.02b 0.12b 0.07b
0.02 a 0.03 a 0.01a
Geraniol 0.01a 0.02 a 0.01 a
0.01b 0.03a 0.02b
Hum. Epox. 1 0.09a 0.05a,b 0.03b
0.07 a 0.11 a 0.06a
Farnesol 0.02a 0.02 a 0.02 a
0.01b 0.03a 0.04a
Farnesene % 8.6a 6.4b 6.1b 9.5a 7.3b 6.6b
H/F ratio 2.39a 2.06b 2.04b 4.98a 4.28b 3.91b a,b,cMeans within a row with different letters are significantly different from one another at p<0.05
by Tukey’s HSD. 1Volatile compounds are expressed as mg/g of hops adjusted to 8% moisture
content.

Figure 2: Essential oil
content of Willamette (left) and Cascade (right) hops at different harvest points by farm and year. Note, the more pronounced effect of year on Late harvested
Cascade hops. Error bars represent standard deviation.
0.00
0.50
1.00
1.50
2.00
2.50
3.00
Ess
enti
al
Oil
(m
l/1
00
g)
Cascade
2010 Farm I 2011 Farm I
2010 Farm II 2011 Farm II
Early Typical LateHarvest Point
0.00
0.50
1.00
1.50
2.00
2.50
Ess
enti
al
Oil
(m
l/100g)
Willamette
2010 Farm I 2011 Farm I
2010 Farm II 2011 Farm II
Early Typical LateHarvest Point

Table V: F-values and significance by treatments from Mixed Model ANOVA of Essential Oil Components
Cascade Willamette
Attribute Farm Harvest Farm x Harvest Farm x
Harvest x
Year Farm Harvest Farm x Harvest
Farm x
Harvest x
Year
Oil 2.07 150.67*** 3.33 32.02*** 6.55* 601.65*** 0.41 6.62***
α-Pinene 0.02 184.41*** 2.90 18.55*** 18.84*** 627.11*** 1.61 6.94***
β-Pinene 0.02 257.43*** 4.00* 30.42*** 7.71* 453.52*** 0.4 9.17***
Myrcene 0.63 136.86*** 3.96* 13.31*** 2.89 173.16*** 0.05 2.85*
Limonene 0.01 158.39*** 2.64 21.37*** 7.06* 380.51*** 0.06 6.02***
ρ-cymene 15.23*** 11.24*** 0.29 5.32** 2.74 206.97*** 2.04 5.16**
Methyl Hep. 1.23 664.14*** 10.54*** 914.50*** 68.33*** 985.69*** 16.66*** 627.83***
Linalool 24.02*** 232*** 10.02*** 32.72*** 10.01** 616.79*** 1.77 16.22***
Caryophyllene 1.95 28.8*** 4.84* 7.79*** 1.89 14*** 4.41* 5.3**
E, β-farnesene 5.22* 23.45*** 5.10* 5.81*** 0.00 25.69*** 2.58 1.68
Humulene 2.23 18.01*** 4.81* 7.08*** 0.01 18.19*** 3.6* 3.89**
Citral 0.46 7.35* 0.39 11.48*** 2.7 11.15** 4.37** 16***
Geranyl Acetate 12.55** 25.38*** 1.06 6.53*** 1.02 1.32 7.23** 85.87***
Citronellol 6.17* 141.89*** 0.15 184.80*** 0.18 0.79 0.34 9.34***
Geraniol 0.08 0.94 1.21 3.98** 0.79 18.94*** 1.63 18.53***
Hum Epox 9.90** 5.15* 3.79* 6.26*** 0.17 0.193 0.1981 0.0018
Farnesol 0.76 2.9 0.24 10.91*** 8.03** 20.28*** 4.44* 8.83***
E, β-farnesene % 33.10*** 11.47*** 16.64*** 3.96*** 1.25 9.51* 1.16 2.92*
H/C ratio 38.36*** 0.52 1.16 17.41*** 0.029 3.39 0.17 5.25**
Significance levels are indicated for F values at the 99.9% confidence level (***), 99.0% level (**), and the 95.0% level (*).

Figure 3: Sensory descriptive data based on one observation of two beers brewed with Cascade hops at Typical and
Late harvest dates.
0.0
1.0
2.0
3.0
4.0
5.0
6.0
7.0Fruit Cocktail
Tropical fruit
Melon
Grapefruit
Estery (tutti fruitti)
Green Apple
RoseFloral
Green Hop
Pine
Apricot/Peach
Sweaty/Onion/Garlic
Orange
Typical
Late

Table VI: Summary data of consumer acceptance scores for Typical and Late Harvest Beers
Attribute Typical Late
Overall Liking***
7.11 a 6.26 b
( 0.83) (1.61)
Aroma Liking***
6.92 a 5.82 b
(1.31) (1.96)
Flavor Liking**
6.98 a 6.23 b
(1.03) (1.68)
**, ***Attribute Significant at p<0.01, and 0.001, respectively. Means within a row with different letters are
significantly different from one another at p<0.05 by Tukey’s HSD. Standard deviations are shown in parentheses
below means. Scale: 1 = dislike extremely, 9 = like extremely. Standard deviations are shown within parenthesis.