Effect of Different Training Methods on Running Sprint ... · Pediatric Exercise Science, 2012, 24,...
17
170 Pediatric Exercise Science, 2012, 24, 170-186 © 2012 Human Kinetics, Inc. Rumpf and Cronin are with the Sport Performance Institute New Zealand, University of Technology, Auckland, New Zealand. Pinder is with the School of Engineering, AUT University, Auckland, New Zealand. Oliver and Hughes are with the Cardiff School of Sport, University of Wales Institute, Cardiff, Wales. Effect of Different Training Methods on Running Sprint Times in Male Youth Michael C. Rumpf and John B. Cronin University of Technology Shane D. Pinder AUT University Jon Oliver and Michael Hughes University of Wales Institute The primary purpose of this paper was to provide insight into the effect of differ- ent training methods on sprinting time in male youth aged 8–18 years. Specific and nonspecific training methods were identified, the participants of the fiveteen studies chategorized into pre, mid- and postpeak height velocity and effect sizes and percent changes calculated for each training method were appropriate. Plyo- metric training had the most effect on sprint times in pre- and midpeak height velocity participants, while combined training methods were the most efficient in postpeak height velocity participants. However, it is difficult to quantify the effects of different training methods due to the limited knowledge in this area e.g., resisted training on pre-PHV participants. Furthermore, it may be worthwhile to investigate additional variables (i.e., stride length, stride frequency, horizontal force), to better determine effect of training methods in different maturity statuses, the development of sprinting and possible stages where individual development can be optimized by training. Sprint running is an essential component to many sporting performances. Given this importance, the development of sprint ability is thought critical in athlete development. While Katch (22) claimed no possible training-induced changes in muscular and cardiovascular function after training in prepubertals, more recent literature stated so-called critical periods for training from age 5–9 (8) and 12–15 (7,46) for speed training. These periods have been termed “windows of accelerated adaptation to training” or “windows of trainability” (3). Even though the central nervous system undergoes rapid changes in terms of myelination in the first 2–5
Transcript of Effect of Different Training Methods on Running Sprint ... · Pediatric Exercise Science, 2012, 24,...

170
Pediatric Exercise Science, 2012, 24, 170-186 © 2012 Human Kinetics, Inc.
Rumpf and Cronin are with the Sport Performance Institute New Zealand, University of Technology, Auckland, New Zealand. Pinder is with the School of Engineering, AUT University, Auckland, New Zealand. Oliver and Hughes are with the Cardiff School of Sport, University of Wales Institute, Cardiff, Wales.
Effect of Different Training Methods on Running Sprint Times in Male Youth
Michael C. Rumpf and John B. CroninUniversity of Technology
Shane D. PinderAUT University
Jon Oliver and Michael HughesUniversity of Wales Institute
The primary purpose of this paper was to provide insight into the effect of differ-ent training methods on sprinting time in male youth aged 8–18 years. Specific and nonspecific training methods were identified, the participants of the fiveteen studies chategorized into pre, mid- and postpeak height velocity and effect sizes and percent changes calculated for each training method were appropriate. Plyo-metric training had the most effect on sprint times in pre- and midpeak height velocity participants, while combined training methods were the most efficient in postpeak height velocity participants. However, it is difficult to quantify the effects of different training methods due to the limited knowledge in this area e.g., resisted training on pre-PHV participants. Furthermore, it may be worthwhile to investigate additional variables (i.e., stride length, stride frequency, horizontal force), to better determine effect of training methods in different maturity statuses, the development of sprinting and possible stages where individual development can be optimized by training.
Sprint running is an essential component to many sporting performances. Given this importance, the development of sprint ability is thought critical in athlete development. While Katch (22) claimed no possible training-induced changes in muscular and cardiovascular function after training in prepubertals, more recent literature stated so-called critical periods for training from age 5–9 (8) and 12–15 (7,46) for speed training. These periods have been termed “windows of accelerated adaptation to training” or “windows of trainability” (3). Even though the central nervous system undergoes rapid changes in terms of myelination in the first 2–5

Training Methods Effect on Male Youth 171
years of life (17,27,43,47), it is thought this process is not complete until sexual maturation (21,48) or even adulthood (5,16). Given this information training to promote neural adaptation during this stage of maturation may be beneficial. Hence appropriate training that is supposed to stimulate intermuscular coordination and/or fast movements (e.g., stride frequency) would seem appropriate before complete myelination of the nervous system (6,32). Van Praagh (44) suggested training methods that target the neural/neuromuscular system of the athletes, to improve coordination, movement efficacy, speed of movement or stride frequency should be used to optimize effectiveness of training during this period (5–9 years of age).
The second phase of “accelerated adaptation to training” has been suggested to appear at the age of 12–15 (7,46), which is approximately around the onset of peak height velocity (PHV) and the onset of puberty. Improvements in strength and consequently in power output are attributed to the rise of hormone levels (testoster-one and growth hormones) associated with puberty (14,15,26,38,39) around PHV. Sprint training that focuses on the muscular system to improve strength, therefore power output and consequently sprint running speed, might be more appropriate at the age 12–17 for male youth, due to the reason that strength (33), power, measured in a Wingate (1,2), jump (33) and leg flexion/extension test (14,20), and speed was affected by maturation (31).
Accepting these assumptions, the first phase of accelerated window of adapta-tion to training is dependent on chronological age, while the second phase is related to maturation/PHV and therefore the timing would vary individually. However, cross sectional studies supporting this theory are scarce and results conflicting. The development of sprint performance with regard to chronological age was reported until the age of 15 in sedentary boys (36). Unfortunately, the participants’ maturation was not assessed and therefore only limited information about sprint development and with regard to maturation can be surmised. Two other studies (37,50) were able to provide sprint performance data with regard to maturation of the participants, but reported conflicting results. While Yagüe and de la Fuente (1998) stated the highest improvements in a 40 m dash occurred 16 months before and 12 months post-PHV (50), Philippaerts (2006; 37) reported no improvements 18 months before PHV, the most improvements in sprint performance from 12 to 6 months prior PHV (37) for eight participants.
Given the conjecture, this paper attempts to collate and synthesize the literature by reviewing popular sprint training methods and their effect on sprint kinetics and kinematics with participants of the included studies classified by chronological age and divided into likely maturity status (pre, mid, and post-PHV). The method of categorization (£12 years of age = pre-PHV; 13–15 years of age = mid-PHV; ³16 years of age = post-PHV) is based on the assumption that peak height velocity in European/North American population take place around the age of 14 (29) with the onset of PHV occurring approximately one year prior the point of PHV (40). Fifteen years of age as the conclusion for the “mid-PHV” category is due to the fact that participants have reached between 90–94% of their adult stature by the age of 14–15 (29,30). Though different, given that studies have quantified maturation in various manners (4), this approach may divide different maturity status more appropriately and provide valuable insight about different training methods and their effect on sprint variables with regard to chronological age and their likely associated maturity status’. For the purposes of this review, training studies have
172 Rumpf et al.
been categorized into nonspecific (strength, power and plyometric training methods) and specific sprint training forms (sprint, resisted and assisted training methods). All studies cited in the review involve male participants, and percent changes and effect sizes (ES) are calculated where possible and appropriate. Generally, the ES allows comparisons of the magnitudes of effectiveness of various methods on sprint kinetics and kinematics between studies. The negative ES based on Hopkins (2009) and presented in Table 1 as a description of training effects will be used in this article, due to improvements in sprint performance, a decrease in sprint time, resulted in a negative ES. The purpose of the review is to quantify the effects of different training methods on sprint times in male youth.
MethodTo obtain articles for the data analysis, a computer search of PubMed, Google Scholar, Sport Discus, and Medline was conducted. The search terms used as separate words or in combination with each other for the “title”, “keywords” and “in-text search” were: “sprint”, “sprinting”, “acceleration”, “velocity”, “run-ning”, “power”, “speed”, “agility”, “youth”, “maturation”, “peak height velocity”, “pubescent”, “effect of”, “resisted”, “assisted”, “downhill”, “uphill”, “treadmill”, “non-motorized”, “torque”, “plyometric”, “strength”, “coordination”, “training”, “children”, “performance”, “speed” and “skills”. The bibliographies of all reviewed articles were then searched and also reviewed. Studies were chosen if they fulfilled the following seven selection criteria: (a) the study used a training method described earlier as nonspecific or specific method; (b) the study detailed the duration of the training and the training frequency per week; (c) the study clearly detailed the outcome measures of interest (i.e., 10 m sprint time); (d) the study gave detailed information about male participants characteristics (i.e., age, height, mass, training status, including standard deviations); (e) the study presented group means and standard deviations for the dependant variable before and after training; (f) studies were published before January 2011; and (g) studies had to be written in the English language and must have been published as a full text article in a peer-review journal. The following characteristics were recorded for all articles: Author, year, sample size, age, training status, maturation, training methods, total amount of training sessions, number of weeks of training intervention, number of sessions per week, testing distance, training effect in percent change and effect size.
Table 1 Interpretation of Negative Effect Sizes According to Hopkins (18)
Magnitude ES
Trivial < -0.20
Small ≤ -0.20 > -0.60
Moderate ≤ -0.60 > -1.20
Large ≤ -1.20 > -2.00
Very Large ≤ -2.00 > -4.00
Nearly Perfect < -4.00

Training Methods Effect on Male Youth 173
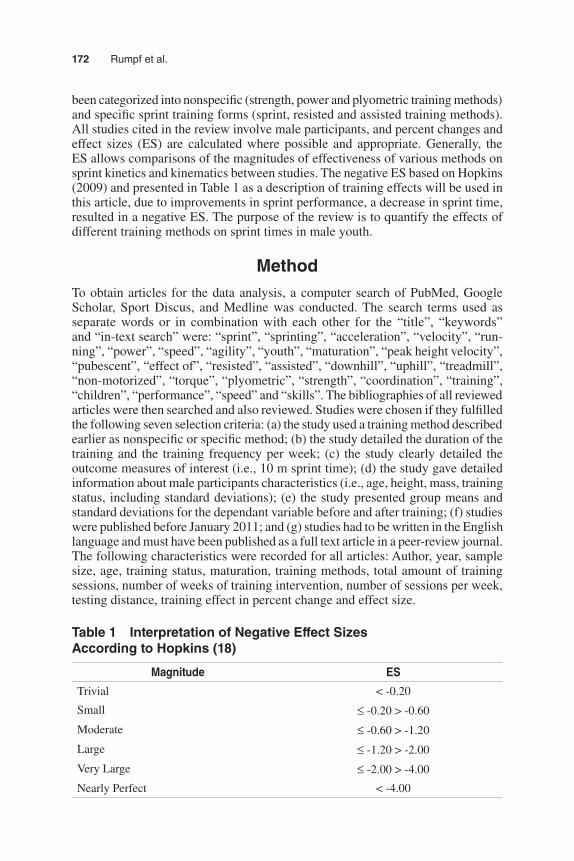
ResultsThe included studies (N = 17) represented 608 participants. Their age ranged from 11 to 17 with an average age of 12.51 (± 0.76 years), height of 1.56 (± 0.21 m), and mass of 52.28 (± 6.47 kg). The total effect sizes grouped for all maturity statuses were -0.57 (± 0.31), -0.56 (± 1.26), -0.41 (± 0.58) and -0.96 (±0.13) for sprint-ing-, plyometric-, strength- and combined-training method respectively. Percent changes were -3.47 (± 1.27), -1.07 (± 1.69), -1.95 (± 3.03) and -2.67 (± 0.67) for sprinting-, plyometric-, strength- and combined-training methods respectively. Therefore, qualitative inferences for the effect sizes for different training methods ranged from “small” to “nearly perfect”. The results from the included articles for specific, nonspecific and combined training methods, categorized into pre, mid, and post-PHV can be observed in Table 2.
Specific Sprint Training Forms
Sprint Training Sprint training in this section consisted of straight line sprinting with passive recovery after each all out effort. To our knowledge there are only two studies that fulfill our inclusion criteria, which have investigated the effect of sprint training on sprint performance in youth (23,45). The two studies included in this section involved 67 subjects, all in pre-PHV stage, with an average age of 11.1 years (±0.50), an average height of 1.56 m (±0.07) and an average mass of 48.65 kg (±7.06). Ten and 12 weeks of sprint training with a training frequency of twice per week for a total number of 20 (23) and 24 (45) training sessions, resulted in significantly (p < .05) improved sprint performance (10, 20 and 30 m sprint time). Small averaged ES (-0.57 ±0.31) and an average percent change of -3.47 (±1.27) were observed for the included studies. The studies included for sprint training can be observed in Table 5.
Resisted Sprint Training The term resisted sprint training is used to describe every form of sprint training in which any form of resistance is applied to an athlete while sprinting. Uphill sprinting is part of resisted sprint running, as well as nonmotorized treadmill sprinting, or sprinting utilizing weighted sleds, vests/belts, or limb weights. However, there was no literature found that satisfied the inclusion criteria of this paper on the effects of resisted sprint training on kinetic and kinematic sprint variables in youth population.
Assisted Sprint Training Supramaximal or overspeed running are different terms describing assisted running. The athletes are forced to run at a higher pace as they are able to reach and maintain unassisted. Different forms of assisted sprint training exist, i.e., downhill running, towing of athletes and high speed treadmill sprinting. Unfortunately, to our knowledge there is no study investigating the effect of assisted sprint training on sprint variables in youth.
Nonspecific Sprint Training Forms
Strength and Power Training Strength and power training in this section referred to resistance training using body weight or additional external weights. Six studies (9–11,13,25,49) were included for analysis in this section, which consisted of a total
174
Tab
le 2
E
ffec
t S
ize
for T
rain
ing
Met
ho
ds
Wit
h R
egar
d to
Mat
uri
ty S
tatu
s o
f th
e P
arti
cip
ants
Spe
cific
Non
spec
ific
Com
bine
d
Spr
intin
gP
lyom
etric
Str
engt
hag
e 8–
12pr
e-PH
V#s
tudi
es2
22
n67
7035
age
(yea
rs)
11.0
9 ±
0.5
011
.27
± 0
.49
11.8
2 ±
0.3
5
heig
ht (
m)
1.56
± 0
.07
1.56
± 0
.06
1.53
± 0
.07
mas
s (k
g)48
.65
± 7
.06
48.4
0 ±
6.9
446
.00
± 8
.86
ES
-0.5
7 ±
0.3
1-1
.46
± 1
.85
-0.5
2 ±
0.1
3
% Δ
-3.4
7 ±
1.2
7-2
.83
± 0
.50
-2.6
7 ±
0.6
7
age
13–1
5m
id-P
HV
#stu
dies
13
1
n14
106
13
age
(yea
rs)
13.3
0 ±
0.6
013
.62
± 0
.613
.4 ±
0.9
0
heig
ht (
m)
1.59
± 0
.09
1.64
± 0
.08
1.64
± 0
.10
mas
s (k
g)48
.60
± 9
.60
52.2
9 ±
7.6
761
.50
± 2
1.80
ES
-0.5
7 ±
-0.3
0 ±
0.6
30.
00 ±
% Δ
-2.0
4 ±
-1.4
6 ±
2.4
20.
00 ±
age
³16
post
-PH
V#s
tudi
es1
32
n56
201
46
age
(yea
rs)
17.3
± 0
.40
16.7
5 ±
1.0
117
.30
± 0
.73
heig
ht (
m)
1.78
± 0
.05
1.70
± 0
.07
1.76
± 0
.14
mas
s (k
g)68
.70
± 5
.60
74.2
0 ±
8.0
171
.13
± 6
.45
ES
0.01
± 0
.24
-0.4
8 ±
0.5
6-1
.33
± 0
.47
% Δ
0.15
± 1
.06
-2.2
6 ±
3.4
4-5
.79
± 2
.54
Training Methods Effect on Male Youth 175
of 307 male athletes with an average age of 15.67 years (± 0.87), height of 1.68 m (± 0.07), mass of 66.63 kg (± 7.89). Training programs consisted of durations between 6–13 weeks with a training frequency of 2–3 times/week and therefore a total of 12–39 training sessions. Averaged effect size for all studies was small (-0.41 ± 0.58) for the programs used in the studies. Combined %changes of -1.95% (± 3.03) were found for all the studies. With regard to the maturation of the participants it needs to be mentioned that only training studies using mid- and post-PHV participants fulfilled the inclusion criteria of the literature review. Therefore the effect of strength training on pre-PHV participants on sprint performance is not covered in the present review. However, it was possible to calculate effects sizes and percent changes from pre- to posttesting for mid- and post PHV participants. All values can be seen in Table 2. Generally, the effect of strength training in youth athletes was more consistent in post-PHV as two cases for mid-PHV populations failed to report significant improvements (N = 32, ES = 0.30 ± 0.28, %change = 0.90 ± 0.89) in sprint performance while two other studies reported improvements after strength training (N = 74, ES = -0.74 ± 0.35, %change = -3.24 ± 1.17). Interestingly the trivial ES were associated with training durations of 6–8 weeks, whereas the greater training effects were associated with training durations between 12–16 weeks. Coincidently, the ES increased with increasing training duration for the mid-PHV population while 12 weeks training seemed to be most efficient for the post-PHV participants. With regard to the effect of sprint training on different sprint distances it can be stated that 20 m and 30 m sprint distances were the most affected distances in post- and mid-PHV participants respectively. All the studies included in understanding the effects of strength and power training can be observed in Table 3.
Plyometric Training Plyometric training referred to jump type training and for the subjects involved in this review mostly included jumping, hurdling, skipping and bouncing. Plyometric training programs were used in 10–17 year olds (12,24,34,41) to investigate their effect on sprint performance. Data for pre, mid, and post-PHV populations were calculated from four studies (N = 140), with an average age of 13.89 years (± 0.46), an average height of 1.65 m (± 0.06) and an average mass of 56.54 kg (± 6.67). Training programs were between 6–10 weeks in duration and with a training frequency of 1–3 times/week and therefore a total of 10–30 training sessions. The averaged ES for the sample was -0.56 (± 1.26) with %changes of -1.07 (± 1.69). From the total pool of 140 participants, 70 (age = 11.27 ± 0.49 years, height = 1.56 ± 0.06 m, mass = 48.40 ± 6.94 kg) were categorized into pre-PHV stage, 14 (age = 13.30 ± 0.60 years, height = 1.59 ± 0.09 m, mass = 48.60 ± 9.60 kg) were classified as mid-PHV and the remaining 56 (age = 17.30 ± 0.40 years, height = 1.78 ± 0.05 m, mass = 68.70 ± 5.60 kg) as post-PHV.
An six to 10 week training program improved 10 (34), 20 (12,24,41) and 30 m (24) sprint performance significantly. With regard to training effect of plyometric training on different sprint distances, it can be surmised that ES nearly increased consistently with increasing distance. Values were 0.24, -0.18, -0.16, -0.61, -4.67 for 5, 10, 15, 20 and 30 m distance respectively. All studies included in this section on plyometric training are detailed in Table 4.
Combined Training Combined training methods referred to a training that united two training methods. Studies included in this section used a nonspecific method (i.e., strength training) in combination with either another nonspecific method (i.e.,

176
Tab
le 3
S
pri
nt T
rain
ing
Stu
die
s in
Mal
e Yo
uth
Aut
hors
Sub
ject
N
oPo
pula
tion
(a
ge, t
rain
ing
stat
us)
Trai
ning
: (#
ses
sion
s/w
eek)
, dur
atio
n (w
eeks
), to
t am
ount
(#)
Out
com
e m
easu
res
Trai
ning
ef
fect
(%
chan
ge)
Effe
ct
Siz
eQ
ualit
ativ
e In
fere
nce
Pre-
PHV
pop
ulat
ion
Kot
zam
anid
is (
23)
1511
.1 (
± 0
.5),
non
athl
etic
boy
s2,
10,
20
0–20
met
er-3
.66
-0.5
8Sm
all
Kot
zam
anid
is (
23)
1511
.1 (
± 0
.5),
non
athl
etic
boy
s2,
10,
20
0–30
met
er-3
.30
-0.4
1Sm
all
Kot
zam
anid
is (
23)
1511
.1 (
± 0
.5),
non
athl
etic
boy
s2,
10,
20
Flyi
ng 1
0–20
m
eter
-5.5
2-0
.82
Mod
erat
e
Kot
zam
anid
is (
23)
1511
.1 (
± 0
.5),
non
athl
etic
boy
s2,
10,
20
Flyi
ng 2
0–30
m
eter
-2.4
5-0
.12
Tri
vial
Ven
ture
lli (
45)
711
(±
0.5
), s
occe
r pl
ayer
s fr
om
prof
. clu
b2,
12,
24
0–20
met
er-2
.40
-0.9
0M
oder
ate

177
Tab
le 4
S
tren
gth
an
d P
ow
er T
rain
ing
Stu
die
s in
Mal
e Yo
uth
Aut
hors
Sub
ject
N
oPo
pula
tion
(age
, tra
inin
g st
atus
)
Trai
ning
: (#
ses
sion
s/w
eek)
, dur
atio
n (w
eeks
), to
t am
ount
(#)
Out
com
e m
easu
res
Trai
ning
effe
ct
(%ch
ange
)E
ffect
S
ize
Qua
litat
ive
Infe
renc
eM
id-P
HV
pop
ulat
ion
Chr
isto
u (1
0)9
13.8
(±
0.4
), s
occe
r pl
ayer
s2,
16,
32
0–30
met
er-2
.56
-0.8
1M
oder
ate
Chr
isto
u (1
0)9
13.8
(±
0.4
), s
occe
r pl
ayer
s2,
8, 1
60–
30 m
eter
1.78
0.56
Non
e
Faig
enba
um (
13)
1413
.6 (
± 0
.7),
hea
lthy
& a
ctiv
e bo
ys2,
6, 1
20–
9.1
met
er0.
000.
00T
rivi
al
Won
g (4
9)28
13.5
(±
0.7
), r
egio
nal r
epre
sent
ativ
e so
ccer
pla
yers
2, 1
2, 2
40–
30 m
eter
-2.2
7-0
.32
Smal
l
Post
-PH
V p
opul
atio
n
Che
lly e
t al.
(9)
1117
.0 (
± 0
.3),
pos
tpub
erta
l jun
ior
socc
er p
laye
rs2,
8, 1
60–
5 m
eter
-6.9
9-1
.43
Lar
ge
Che
lly e
t al.
(9)
1117
.0 (
± 0
.3),
pos
tpub
erta
l jun
ior
socc
er p
laye
rs2,
8, 1
635
–40
met
er-1
0.94
-1.7
5L
arge
Cou
tts (
11)
2116
.6 (
± 1
.2),
hea
lthy
& y
oung
rug
by p
laye
rs,
supe
rvis
ed3,
12,
36
0–10
met
er-0
.93
-0.2
5T
rivi
al
Cou
tts (
11)
2116
.6 (
± 1
.2),
hea
lthy
& y
oung
rug
by p
laye
rs,
unsu
perv
ised
3, 1
2, 3
60–
10 m
eter
-0.9
3-0
.22
Mod
erat
e
Cou
tts (
11)
2116
.6 (
± 1
.2),
hea
lthy
& y
oung
rug
by p
laye
rs
supe
rvis
ed3,
12,
36
0–20
met
er-0
.87
-0.3
7Sm
all
Cou
tts (
11)
2116
.6 (
± 1
.2),
hea
lthy
& y
oung
rug
by p
laye
rs,
unsu
perv
ised
3, 1
2, 3
60–
20 m
eter
-1.1
5-0
.36
Smal
l
Cou
tts (
11)
2116
.6 (
± 1
.2),
hea
lthy
& y
oung
rug
by p
laye
rs,
supe
rvis
ed3,
6, 1
80–
10 m
eter
-0.9
3-0
.25
Tri
vial
Cou
tts (
11)
2116
.6 (
± 1
.2),
hea
lthy
& y
oung
rug
by p
laye
rs,
unsu
perv
ised
3, 6
, 18
0–10
met
er-0
.47
-0.1
1T
rivi
al
Cou
tts (
11)
2116
.6 (
± 1
.2),
hea
lthy
& y
oung
rug
by p
laye
rs,
supe
rvis
ed3,
6, 1
80–
20 m
eter
-0.2
9-0
.12
Tri
vial
Cou
tts (
11)
2116
.6 (
± 1
.2),
hea
lthy
& y
oung
rug
by p
laye
rs,
unsu
perv
ised
3, 6
, 18
0–20
met
er-0
.86
-0.2
7Sm
all
Kot
zam
anid
is (
25)
1117
.1 (
± 1
.1),
soc
cer
play
ers
39, 1
3, 3
0–30
met
er-0
.46
-0.1
2T
rivi
al

178 Rumpf et al.
plyometric) or a specific sprint training form (i.e., sprinting). A total of 6 studies (13,19,25,28,42,45) used combined training of which five studies across different maturity status’ are included in this section. The five studies involved 94 subjects with an average age of 14.7 years (± 0.61), an average height of 1.66 m (± 0.11) and an average mass of 60.4 kg (± 9.47). Thirty five participants were categorized into pre-PHV status (age = 11.82 ± 0.35 years, height = 1.53 ± 0.07 m, mass = 46.00 ± 8.86 kg), 13 participants into mid-PHV status (age = 13.40 ± 0.90 years, height = 1.64 ± 0.10 m, mass = 61.50 ± 21.80 kg) and the remaining 46 into post-PHV status (age = 17.30 ±0.73 years, height = 1.76 ± 0.14 m, mass = 71.13 ± 6.45 kg). Average effect sizes and %change for the pre-PHV group was -0.52 (± 0.13) and -2.67% (± 0.67), 0.00 and 0.00$ for the mid-PHV group and -1.33 (± 0.47) and -5.79% (± 2.54) for the post-PHV group respectively. Duration of training ranged from 6 to 13 weeks, training frequencies of 1–3 sessions per week and a total of 6–39 sessions of strength training in combination with ballistic (28), power (35), sprint (9,25), plyometric (13,19) and high-speed coordination training (45) improved sprint distance of 0–5 (9,28), 0–9.1 (13), 0–15 (28,35), 0–20 (45), 0–30 (25), and 0–40 (19) meters significantly. Improvements were “moderate”, “trivial” and “moderate” to “large” for pre-PHV, mid-PHV and post-PHV participants respectively. With regard to training efficacy on different distances in different maturity categories, it can be stated that combined training methods had more effect on shorter distances in pre- and post-PHV participants. ES for 20 and 40 m were -0.62 and -0.43 for pre-PHV participants and -1.59, -1.30, and -0.88 for 5, 15, and 30 m in post-PHV participants respectively.
Unfortunately, only one study (19) reported the maturation of the participants, with all participants grouped into pubic hair stage 1 and 2 for genital development. According to Malina (2004; 29), stages 1 and 2 for pubic hair is an equivalent index of maturation compared with pre-PHV status, with most of the boys (87%) reaching PHV at pubic hair stage 3–5. Therefore participants in the study of Ingle et al. (2006) were grouped into pre-PHV status. A 12 week training period of combined strength and plyometric training improved 40 m sprint performance of pre-PHV male participants. Table 6 presents the included studies for this section on combined training methods.
Discussion and ConclusionsThis paper reviewed all nonspecific and specific sprint training methods and their training effects on overground sprinting in youth. Based on the averaged ES derived from all studies for each training method grouped by maturation status the follow-ing tentative conclusions are made:
Pre-PHV
Plyometric training (12,24) was the most effective training method for improving sprint times in pre-PHV participants (ES = -1.46 ± 1.85, %change = -2.83 ± 0.50), followed by sprint training (23, 45; ES = -0.57 ± 0.31, %change = -3.47 ± 1.27) and combined (19, 45; ES = -0.52 ± 0.13, %change = -2.67 ± 0.67) training methods. The effect of resisted, assisted and strength and power, training on sprint times in pre-PHV participants is unknown.

179
Tab
le 5
P
lyo
met
ric
Trai
nin
g S
tud
ies
in M
ale
You
th
Aut
hors
Sub
ject
N
oPo
pula
tion
(age
, tra
inin
g st
atus
)
Trai
ning
: (#
sess
ions
/wee
k),
dura
tion
(wee
ks),
tot a
mou
nt (#
)O
utco
me
mea
sure
sTr
aini
ng e
ffect
(%
chan
ge)
Effe
ct
Siz
eQ
ualit
ativ
e In
fere
nce
Pre-
PHV
pop
ulat
ion
Dia
llo e
t al.
(12)
1012
.3 (
± 0
.4),
soc
cer
play
ers
3, 1
0, 3
020
met
er-2
.78
-1.4
3L
arge
Kot
zam
anid
is
(24)
1511
.1 (
± 0
.5),
hea
lthy
untr
aine
d pr
epub
erta
l bo
ys1,
10,
10
10 m
eter
-2.2
3-0
.50
Smal
l
Kot
zam
anid
is
(24)
1511
.1 (
± 0
.5),
hea
lthy
untr
aine
d pr
epub
erta
l bo
ys1,
10,
10
10–2
0 m
eter
-3.5
1-0
.55
Smal
l
Kot
zam
anid
is
(24)
1511
.1 (
± 0
.5),
hea
lthy
untr
aine
d pr
epub
erta
l bo
ys1,
10,
10
20–3
0 m
eter
-3.1
1-0
.19
Tri
vial
Kot
zam
anid
is
(24)
1511
.1 (
± 0
.5),
hea
lthy
untr
aine
d pr
epub
erta
l bo
ys1,
10,
10
30 m
eter
-2.5
2-4
.67
Nea
rly
perf
ect
Mid
-PH
V p
opul
atio
n
Mey
lan
(34)
1413
.3 (
± 0
.6),
soc
cer
play
ers
2, 8
,16
10 m
eter
-2.0
4-0
.57
Smal
l
Post
-PH
V p
opul
atio
n
Tho
mas
et a
l. (4
1)56
17.3
(±
0.4
), s
occe
r pl
ayer
s fr
om a
pro
fes-
sion
al s
occe
r ac
adem
y, d
rop-
jum
p gr
oup
2, 6
,12
5 m
eter
0.33
1.94
Neg
ativ
e
Tho
mas
et a
l. (4
1)56
17.3
(±
0.4
), s
occe
r pl
ayer
s fr
om a
pro
fes-
sion
al s
occe
r ac
adem
y, c
ount
erm
ovem
ent-
jum
p gr
oup
2, 6
,12
5 m
eter
0.14
0.94
Neg
ativ
e
(con
tinu
ed)

180
Aut
hors
Sub
ject
N
oPo
pula
tion
(age
, tra
inin
g st
atus
)
Trai
ning
: (#
sess
ions
/wee
k),
dura
tion
(wee
ks),
tot a
mou
nt (#
)O
utco
me
mea
sure
sTr
aini
ng e
ffect
(%
chan
ge)
Effe
ct
Siz
eQ
ualit
ativ
e In
fere
nce
Tho
mas
et a
l. (4
1)56
17.3
(±
0.4
), s
occe
r pl
ayer
s fr
om a
pro
fes-
sion
al s
occe
r ac
adem
y, d
rop-
jum
p gr
oup
2, 6
,12
10 m
eter
0.33
1.14
Neg
ativ
e
Tho
mas
et a
l. (4
1)56
17.3
(±
0.4
), s
occe
r pl
ayer
s fr
om a
pro
fes-
sion
al s
occe
r ac
adem
y, c
ount
erm
ovem
ent-
jum
p gr
oup
2, 6
,12
10 m
eter
0.00
0.00
Neg
ativ
e
Tho
mas
et a
l. (4
1)56
17.3
(±
0.4
), s
occe
r pl
ayer
s fr
om a
pro
fes-
sion
al s
occe
r ac
adem
y, d
rop-
jum
p gr
oup
2, 6
,12
15 m
eter
-0.1
4-0
.41
Tri
vial
Tho
mas
et a
l. (4
1)56
17.3
(±
0.4
), s
occe
r pl
ayer
s fr
om a
pro
fes-
sion
al s
occe
r ac
adem
y, c
ount
erm
ovem
ent-
jum
p gr
oup
2, 6
,12
15 m
eter
-0.1
8-0
.79
Tri
vial
Tho
mas
et a
l. (4
1)56
17.3
(±
0.4
), s
occe
r pl
ayer
s fr
om a
pro
fes-
sion
al s
occe
r ac
adem
y, d
rop-
jum
p gr
oup
2, 6
,12
20 m
eter
-0.2
7-0
.97
Smal
l
Tho
mas
et a
l. (4
1)56
17.3
(±
0.4
), s
occe
r pl
ayer
s fr
om a
pro
fes-
sion
al s
occe
r ac
adem
y, c
ount
erm
ovem
ent-
jum
p gr
oup
2, 6
,12
20 m
etet
-0.1
4-0
.63
Tri
vial
Tab
le 5
(c
on
tin
ued
)

181
Tab
le 6
C
om
bin
ed M
eth
od
Tra
inin
g S
tud
ies
in M
ale
You
th
Aut
hors
Sub
ject
N
oPo
pula
tion
(age
, tr
aini
ng s
tatu
s)Tr
aini
ng: (
# se
ssio
ns/w
eek)
, du
ratio
n (w
eeks
), to
t am
ount
(#)
Out
com
e m
easu
res
Trai
ning
ef
fect
(%
chan
ge)
Effe
ct
Siz
eQ
ualit
ativ
e In
fere
nces
Pre-
PHV
pop
ulat
ion
Ingl
e et
al.
(19)
2611
.82
(± 0
.35)
, boy
s fr
om a
loca
l sch
ool
3, 1
2, 3
60–
40 m
eter
-3.1
5-0
.43
Smal
l
Ven
ture
lli (
45)
911
(±
0.5
), s
occe
r pl
ayer
s fr
om p
rof.
clu
b2,
12,
240–
20 m
eter
-2.2
0-0
.62
Mod
erat
e
Mid
-PH
V p
opul
atio
n
Faig
enba
um (
13)
1313
.4 (
± 0
.9),
hea
lthy
and
activ
e bo
ys2,
6, 1
20–
9.1
met
er0.
000.
00T
rivi
al
Post
-PH
V p
opul
atio
n
Kot
zam
anid
is
(25)
1217
.0 (
± 1
.1),
rec
reat
iona
l so
ccer
pla
yers
3, 1
3, 3
90–
30 m
eter
-3.4
6-0
.88
Mod
erat
e
Mai
o A
lves
(28
)8
17.4
(±
0.6
), e
lite
Port
u-gu
ese
socc
er p
laye
rs2,
6,1
20–
5 m
eter
-6.1
9-1
.75
Lar
ge
Mai
o A
lves
(28
)8
17.4
(±
0.6
), e
lite
Port
u-gu
ese
socc
er p
laye
rs2,
6,1
20–
15 m
eter
-3.1
1-0
.80
Mod
erat
e
Mai
o A
lves
(28
)9
17.4
(±
0.6
), e
lite
Port
u-gu
ese
socc
er p
laye
rs1,
6, 6
0–5
met
er-9
.17
-1.4
3L
arge
Mai
o A
lves
(28
)9
17.4
(±
0.6
), e
lite
Port
u-gu
ese
socc
er p
laye
rs1,
6, 6
0–15
met
er-7
.03
-1.8
0L
arge

182 Rumpf et al.
Mid-PHV
Plyometric training methods (34) were the most effective training in mid-PHV participants (ES = -0.57, %change = -2.04) followed by strength (10, 13, 49; ES = -0.30 ± 0.63, %change = -1.46 ± 2.42) and combined (13) training (ES = 0.00, %change = 0.00). Specific sprint training studies in mid-PHV participants were not found throughout the literature, which results in a lack of knowledge in this area.
Post-PHV
Post-PHV participants sprint times benefitted most from combined training methods (25, 28; ES = -1.33 ± 0.47, %change = -5.79 ± 2.54) followed by strength training (9, 11, 25; ES = -0.48 ± 0.58, %change = -2.26 ± 3.44). Figure 1 and 2 illustrates and summarizes the combined effect sizes and percent changes for all training methods and maturity statuses.
However, as can be observed from the tables, information about the magnitude of training volume that leads to changes in sprint time is sparse, therefore making definitive conclusions regarding minimal and optimal training loads for each matu-ration status for specific and nonspecific training forms is problematic. As a result from this treatise of the literature in this area, there is a great deal more research needed. Basing training theory (e.g., windows of trainability) on the number of papers and samples sizes reviewed in this paper is somewhat tenuous and more longitudinal studies are needed for all training methods in all PHV statuses. Fur-thermore it is difficult to quantify the effects of different training methods with regard to maturation on sprint times if certain training methods have not been used in that maturation group e.g., resisted training on pre-PHV participants.
Figure 1 — Combined effect sizes for all training methods with regards to maturation

Training Methods Effect on Male Youth 183
It may be that the development of sprint speed is based on so many factors that it will be extremely difficult to identify stages of development where improved per-formance will be optimized by training. It may be more worthwhile to concentrate research efforts on the effects of different training methods on additional variables (i.e., stride length, stride frequency, horizontal force, etc) to better determine the development of sprint speed. Accordingly, a more in-depth analysis of sprinting performance, i.e., step-by-step analysis of kinetics and kinematics in addition and relation to split-times, after nonspecific and specific training methods are needed to better define changes in sprint performance and allocate those changes to dif-ferent distances (first-step vs. acceleration vs. maximum velocity phase) in youth populations. Finally, dedicated measurements of maturation (i.e., age at peak height velocity) need to be included in future measurement of youth populations to better understand adaptation and train for speed throughout the athletes’ development.
References 1. Armstrong, N., J.R. Welsman, and M.Y. Chia. Short term power output in relation to
growth and maturation. Br. J. Sports Med. 35:118–124, 2001. 2. Armstrong, N., J.R. Welsman, C.A. Williams, et al. Longitudinal changes in young
people’s short-term power output. Med. Sci. Sports Exerc. 32:1140–1145, 2000. 3. Balyi, I., and R. Way. The role of monitoring growth in the long term athlete develop-
ment. Canadian Sport for Life, 2005. 4. Baquet, G., E. van Praagh, and S. Berthoin. Endurance training and aerobic fitness in
young people. Sports Med. 33:1127–1143, 2003.
Figure 2 — Combined percent changes for all training methods with regards to maturation

184 Rumpf et al.
5. Benes, F.M., M. Turtle, Y. Khan, et al. Myelination of a key relay zone in the hip-pocampal formation occurs in the human brain during childhood, adolescence, and adulthood. Arch. Gen. Psychiatry. 51:477–484, 1994.
6. Bengtsson, S.L., Z. Nagy, S. Skare, et al. Extensive piano practicing has regionally specific effects on white matter development. Nat. Neurosci. 8:1148–1150, 2005.
7. Borms, J. The child and exercise: An overview. J Sports Sci. 4:3–20, 1986. 8. Branta, C., J. Haubenstricker, and V. Seefeldt. Age changes in motor skills during
childhood and adolescence. Exerc. Sport Sci. Rev. 12:467–520, 1984. 9. Chelly, M.S., M. Fathloun, N. Cherif, et al. Effects of a back squat training program on
leg power, jump, and sprint performances in junior soccer players. J. Strength Cond. Res. 23:2241–2249, 2009.
10. Christou, M., I. Smilios, K. Sotiropoulos, et al. Effects of resistance training on the physical capacities of adolescent soccer players. J. Strength Cond. Res. 20:783–791, 2006.
11. Coutts, A.J., A.J. Murphy, and B.J. Dascombe. Effect of direct supervision of a strength coach on measures of muscular strength and power in young rugby league players. J. Strength Cond. Res. 18:316–323, 2004.
12. Diallo, O., E. Dore, P. Duche, et al. Effects of plyometric training followed by a reduced training programme on physical performance in prebubescent soccer players. J Sports Med Phys Fitness. 41:342–348, 2001.
13. Faigenbaum, A.D., J.E. McFarland, F.B. Keiper, et al. Effects of a short-term plyometric and resistance training program on fitness performance in boys age 12 to 15 years. J Sports Sci Med. 6:519–529, 2007.
14. Forbes, H., A. Bullers, A. Lovell, et al. Relative torque profiles of elite male youth footballers: effects of age and pubertal development. Int. J. Sports Med. 30:592–597, 2009.
15. Fraisier, S.D., F. Gafford, and R. Horton. Plasma androgens in childhood and adoles-cence. Clin. Endocrinol. (Oxf.). 29:1404–1408, 1969.
16. Friede, R.L., J. Brzoska, and U. Hartmann. Changes in myelin sheath thickness and internode geometry in the rabbit phrenic nerve during growth. J. Anat. 143:103–113, 1985.
17. Gutrecht, J.A., and P.J. Dyck. Quantitative teased-fiber and histolic studies of human sural nerve during postnatal development. J. Comp. Neurol. 138:117–130, 1970.
18. Hopkins, W.G. http://sportsci.org/will/. Accessed 17.3.2011/2011. 19. Ingle, L., M. Sleap, and K. Tolfrey. The effect of a complex training and detraining
programme on selected strength and power variables in early pubertal boys. J Sports Sci. 24:987–997, 2006.
20. Ioakimidis, P., V. Gerodimos, E. Kellis, et al. Combined effects of age and maturation on maximum isometric leg press strength in young basketball players. J Sports Med Phys Fitness. 44:389–397, 2004.
21. Jacobson, S. Sequence of myelinization in the brain of the albino rat. A. cerebral cortex, thalamus and related structures. J. Comp. Neurol. 121:5–29, 1963.
22. Katch, V.L. Physical Conditioning of Children. J. Adolesc. Health Care. 3:241–246, 1983. 23. Kotzamanidis, C. The effect of sprint training on running performance and vertical
jump in pre-adolescent boys. J. Human. Move. Stud. 44:225–240, 2003. 24. Kotzamanidis, C. Effect of plyometric training on running performance and vertical
jumping in prebubertal boys. J. Strength Cond. Res. 20:441–445, 2006. 25. Kotzamanidis, C., D. Chatzopoulos, C. Michailidis, et al. The effect of a combined
high-intensity strength and speed training program on the running and jumping ability of soccer players. J. Strength Cond. Res. 19:369–375, 2005.
26. Kraemer, W.J. Endocrine responses to resistance exercise. Med. Sci. Sports Exerc. 20:152–157, 1988.
Training Methods Effect on Male Youth 185
27. Lowrey, G.H. Growth and development of children. Chicago: Yearbook Medical Pub., 1973. 28. Maio Alves, J.M., A.N. Rebelo, C. Abrantes, et al. Short-term effects of complex and
contrast training in soccer players’ vertical jump, sprint, and agility abilities. J. Strength Cond. Res. 24:936–941, 2010.
29. Malina, R.M., C. Bouchard, and O. Bar-Or. Growth, maturation, and physical activity. Champaign, IL: Human Kinetics, 2004.
30. Malina, R.M., S.P. Cumming, P.J. Morano, et al. Maturity status of youth football players: A noninvasive estimate. Med. Sci. Sports Exerc. 37:1044–1052, 2005.
31. Malina, R.M., J.C. Eisenmann, S.P. Cumming, et al. Maturity-associated variation in the growth and functional capacities of youth football (soccer) players 13-15 years. Eur. J. Appl. Physiol. 91:555–562, 2004.
32. Mero, A. Power and speed training during childhood. In: Pediatric anaerobic perfor-mance, E. van Praagh (Ed.). Champaign: Human Kinetics, 1998, pp. 241–267.
33. Mero, A., H. Kauhanen, E. Peltola, et al. Physiological performance capacity in dif-ferent prepubescent athletic groups. J Sports Med Phys Fitness. 30:57–66, 1990.
34. Meylan, C., and D. Malatesta. Effects of in-season plyometric training within soccer practice on explosive actions of young players. J. Strength Cond. Res. 23:2605–2613, 2009.
35. Mujika, I., J. Santisteban, and C. Castagna. In-season effect of short-term sprint and power training programs on elite junior soccer players. J. Strength Cond. Res. 23:2581–2587, 2009.
36. Papaikovou, G., A. Giannakos, C. Michailidis, et al. The effect of chronological age and gender on the development of sprint performance during childhood and puberty. J. Strength Cond. Res. 23:2568–2573, 2009.
37. Philippaerts, R.M., T. Vaeyens, M. Janssens, et al. The relationship between peak height velocity and physical performance in youth soccer players. J Sports Sci. 24:221–230, 2006.
38. Ramos, E., W.R. Frontera, A. Llopart, et al. Muscle strength and hormonal levels in adolescents: Gender related differences. Int. J. Sports Med. 19:526–531, 1998.
39. Round, J.M., D.A. Jones, J.W. Honour, et al. Hormonal factors in the development of differences in strength between boys and girls during adolescence: a longitudinal study. Ann. Hum. Biol. 26:49–62, 1999.
40. Tanner, J.M., R.H. Whitehouse, and M. Takaishi. Standards from birth to maturity for height, weight, height velocity, and weight velocity: British children, 1965. Arch. Dis. Child. 41:454–471, 1966.
41. Thomas, K., D. French, and P.R. Hayes. The effect of two plyometric training tech-niques on muscular power and agility in youth soccer players. J. Strength Cond. Res. 23:332–335, 2009.
42. Tsimahidis, K., C. Galazoulas, D. Skoufas, et al. The effect of sprinting after each set of heavy resistance training on the running speed and jumping performance of young basketball players. J. Strength Cond. Res. 24:2102–2108, 2010.
43. Valladian, I., and D. Porter. Physical Growth and Development: From conception to maturity. Boston: Little, Brown & Co., 1977, pp. 134–135.
44. van Praagh, E. Pediatric Anaerobic Performance. Champaign, IL: Human Kinetics Publisher, Inc., 1998.
45. Venturelli, M., D. Bishop, and L. Pettene. Sprint training in preadolescent soccer play-ers. Int. J. Sport. Perf. 3:558–562, 2008.
46. Viru, A., J. Locko, M. Harro, et al. Critical periods in the development of performance capacity during childhood and adolescence. Eur. J. Phys. Educ. 4:75–119, 1999.
47. Webster, H.F., and J.T. Favilla. Development of peripheral nerve fibers. In: Peripheral neuropathy, P.J. Dyck, P.K. Thomas, E.H. Lambert, and R. Bunger (Eds.). Philadelphia: W. B. Saunders, 1984, pp. 329–359.

186 Rumpf et al.
48. Wilmore, J.H., and D.L. Costill. Physiology of sport and exercise. Illinois: Human Kinetic, 1994.
49. Wong, P.L., K. Chamari, and U. Wisloff. Effects of 12-week on-field combined strength and power training on physical performance among U-14 young soccer players. J. Strength Cond. Res. 24:644–652, 2010.
50. Yagüe, P.H., and J.M. De La Fuente. Changes in height and motor performance relative to peak height velocity: A mixed-longitudinal study of Spanish boys and girls. Am. J. Hum. Biol. 10:647–660, 1998.