Java/Scala Lab: Slava Schmidt - Introduction to Reactive Streams
Upload
kathryn-hendersonCategory
view
215download
1
Effect of Defects in the Mechanical Effect of Defects in the Mechanical Properties of Carbon NanotubesProperties of Carbon Nanotubes
PHY 472 / Lehigh University
Instructor: Prof. Slava V. Rotkin
By: Paul A. Belony, Jr.

Common Defects observed in CNT’sCommon Defects observed in CNT’s
Main types of defectsMain types of defects 3 main groups3 main groups
• Point defectsPoint defects• Topological defectsTopological defects• Hybridization defectsHybridization defects
SubgroupsSubgroups Vacancies (PD)Vacancies (PD) Metastable atomsMetastable atoms Pentagons (TD)Pentagons (TD) Heptagons (TD)Heptagons (TD) Stone–Wales (SW or 5–7–7–5) Stone–Wales (SW or 5–7–7–5)
(TD)(TD) Fictionalization (HD) (spFictionalization (HD) (sp33 bonds) bonds) Discontinuities of wallsDiscontinuities of walls Distortion in the packing Distortion in the packing
configuration of CNT bundlesconfiguration of CNT bundles Etc…Etc…

Stone-Wales (5-7-7-5) Defects
Stone-Wales defect is:
Composed of Two Pentagon-Heptagon pairs
Formed by rotating a sp2 bond by 900
In other words, formed when bond rotation in a graphitic network transforms four hexagons into two pentagons and two heptagons, which is accompanied by elongation of the tube structure along the axis connecting the pentagons, and shrinking along the perpendicular direction

Main Mechanical Properties Main Mechanical Properties affected by Defectsaffected by Defects
StiffnessStiffness Ultimate StrengthUltimate Strength Ultimate StrainUltimate Strain FlexibilityFlexibility Buckling and robustness under high pressureBuckling and robustness under high pressure
• CNT’s are among the most robust materialsCNT’s are among the most robust materials• High Elastic Modulus (order of 1 TPa)High Elastic Modulus (order of 1 TPa)• High Strength (range up to 100’s of GPa)High Strength (range up to 100’s of GPa)

Main effects on StiffnessMain effects on StiffnessChanges in stiffness observed.
Stiffness decrease with topological defects and increase with fictionalizationDefect generation and growth observed during plastic deformation and fracture of nanotubes
Qiang Lu and B
aidurya B
attacharya
Deepak Srivastava etal.

SWNTs with more defects are likely to break at smaller strains and have less strength as well.
Force–displacement curves of nanotubes with various average numbers of defects.
the Young modulus can be calculated as the initial slope of the force–displacement curve;
The ultimate strength is calculated at the maximum force point, σU = (Fmax)/A, where F is the maximum axial force, A is the cross section area
the ultimate strain, which corresponds to the ultimate strength, is calculated as εU = (ΔLU)/L, where L is the original tube length.
Force-Displacement curves are used in order to show the response of the SWNTs under loading
• Reduced units:
• 1 time ru = 0.03526 ps
• 1 force ru = 1.602 nN
• 1 displacement ru = 1 Ǻ

Types of stressesTypes of stresses
virial stressvirial stress atomic (BDT) stressatomic (BDT) stress Lutsko stressLutsko stress Yip stressYip stress
i, j indices in Cartesian coordinate system Α, β atomic indices
Ωtot total volume
Lα,β fraction of the length of αβ bond inside the averaging volume

Belytschko et al.
Force-Deflection curve for a model of zigzag NT
(Normalized to Stress vs. Strain)
۩ The applied force is computed by summing the interatomic forces for the atoms along the end of the nanotube where the displacement is prescribed.
۩ The stress is calculated from the cross-sectional area S = πdh (h is the chosen interlayer separation of graphite)
Evolution of cracks in the NT
Bond-breaking spreads sideways after the initially weakened bond failed
Crack formation in a [40, 40] armchair NT with SW defect (evolution from left to right 12.5 – 12.8 ps)
The crack grows in the direction of maximum shear

Elastic modulus before defectElastic modulus before defect
Strain
Stress
(GPa)
0 0.01 0.02 0.03 0.04 0.05 0.06 0.07
10
20
30
40
50
60
Bulk Stress (E=1.002 TPa)
Lutsko Stress (E= 0.997 TPa)
BDT Stress (E= 1.002 TPa)
-Defect free (9,0) nanotube with periodic boundary conditions
-Strains applied using conjugate gradients energy minimization
- All stress and strain measures yield a Young’s modulus value of 1.002TPa

5-7-7-5 Defect on CNTs5-7-7-5 Defect on CNTs
z - position
Str
ess
(Gp
a)
-20 -10 0 10 2010
20
30
40
50
60
3 % Applied Strain
0 % Applied Strain
1 % Applied Strain
5 % Applied Strain
7 % Applied Strain
8 % Applied Strain The graph shows the graph for Lutsko The graph shows the graph for Lutsko stress profile for (9,0) zigzag NT with stress profile for (9,0) zigzag NT with (5-7-7-5) defect(5-7-7-5) defect
The defected region facilitates Stress The defected region facilitates Stress amplification amplification
When applied strains increase, this When applied strains increase, this amplification reducesamplification reduces
A different situation is observed for A different situation is observed for (n,n) armchair NT; there is a decrease (n,n) armchair NT; there is a decrease in stress at the defect regionin stress at the defect region

Contour plots of the longitudinal strain ε33 strain and stress σ33 near the defected region drawn at different applied strain levels.
a) Strain contours at an applied strain of 1%. b) Stress contours at an applied strain of 1%.c) Strain contours at an applied strain of 3%. d) Stress contours at an applied strain of 3%.e) Strain contours at an applied strain of 5%. f) Stress contours at an applied strain of 5%.g) Strain contours at an applied strain of 8%. h) Stress contours at an applied strain of 8%.
N. C
handra, S. N
amilae and C
. Shet

Strain
Str
ess
(GP
a)
0 0.025 0.05 0.075 0.10
10
20
30
40
50
60
(9,0) CNT no defect
Type I defect
Type II defect
(a)
(b)
(c)
NT possess residual forces at zero strain (even when defect free)
At about 1 TPa there’s a reduction of stiffness away from the defect-free straight line

Measuring Mechanical PropertiesMeasuring Mechanical Properties
Use of Atomic Force Use of Atomic Force Microscopy (AFM)Microscopy (AFM)
• For individual CNTsFor individual CNTs
A) 3D representation of the adhesion of a SWNT to an alumina ultra-filtration (tube is clamped allowing mechanical testing)
B) How AFM works in schematic way (a load F is applied to the suspending portion of the NT with length L. So the max deflection d is topologically measured
L. Forro etal.

Fracture process of a (6, 6) SWNT with three SW defects:(a) crack initiation and propagation (A–I); (b) (b) corresponding force time history.

Diameter dependenceDiameter dependence
Strains
Str
ess
(GP
a)
0 0.01 0.02 0.03 0.04 0.05 0.060
10
20
30
40
50
(9,0) at defect
(10,0) at defect
(11,0) at defect
(13,0) at defect
(15,0) at defect
(9,0) no defect
(10,0) no defect
(11,0) no defect
(13,0) no defect
(15,0) no defect
The slope of the graphs seem to be very close to each other for different curvature of the NTs
So, stiffness values of various tubes of same SW defect but different diameters do not change significantly
Stiffness in the range of 0.61TPa to 0.63TPa for different (n,0) tubes
Curvature is not significantly affected by Mechanical properties of SW defect

Charality DependenceCharality Dependence
Strain
Str
ess
(GP
a)
0 0.01 0.02 0.03 0.04 0.05
0
5
10
15
20
25
30
35
40
45
(5,5) no defect
(5,5) at defect
(6,4) no defect
(6,4) at defect
(7,3) no defect
(7,3) at defect
(9,0) no defect
(9,0) at defect
There’s a significant change in the measured stiffness when the charality varies

Defects can occur in the form of atomic Defects can occur in the form of atomic vacancies. vacancies.
High levels of such defects can lower the tensile High levels of such defects can lower the tensile strength by up to 85%. strength by up to 85%.
Due to the almost one-dimensional structure of Due to the almost one-dimensional structure of CNTs, the tensile strength of the tube is CNTs, the tensile strength of the tube is dependent on the weakest segment of it in a dependent on the weakest segment of it in a similar manner to a chain, where a defect in a similar manner to a chain, where a defect in a single link will greatly diminish the strength of the single link will greatly diminish the strength of the entire chain. entire chain.

SummarySummary
Mechanical behavior of defects such as Mechanical behavior of defects such as 5-7-7-5 defect is examined 5-7-7-5 defect is examined
A considerable decrease in stiffness at A considerable decrease in stiffness at 5-7-7-5 defect location in different 5-7-7-5 defect location in different nanotubes is observednanotubes is observed
Changes in diameter don’t affect the Changes in diameter don’t affect the decrease in stiffness significantlydecrease in stiffness significantly
Changes in chirality have different Changes in chirality have different effect on stiffnesseffect on stiffness
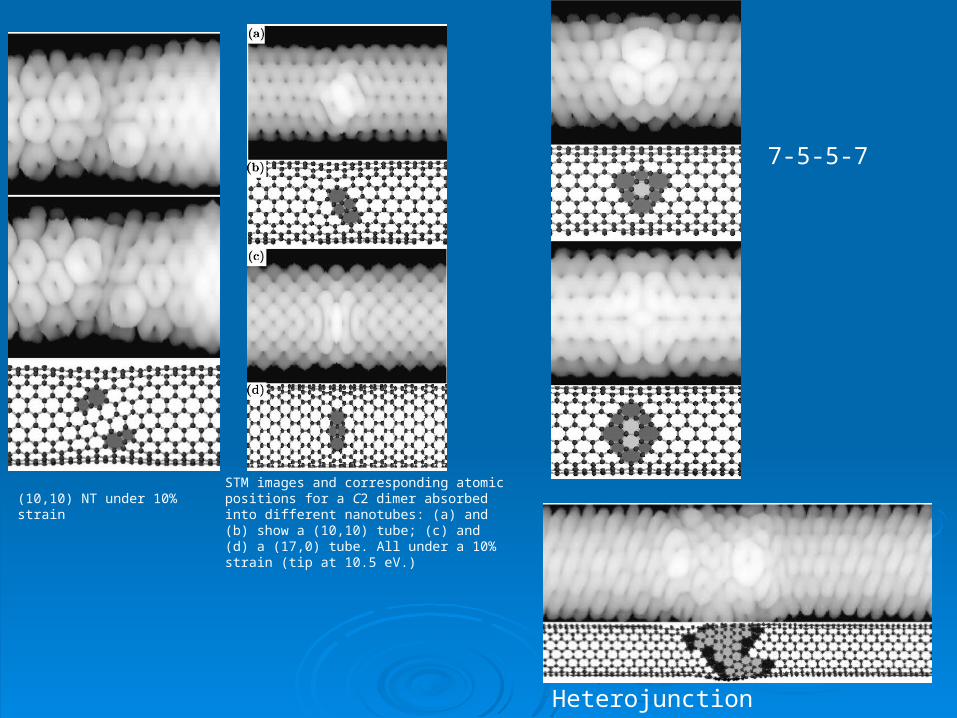
(10,10) NT under 10% strainSTM images and corresponding atomic positions for a C2 dimer absorbed into different nanotubes: (a) and (b) show a (10,10) tube; (c) and (d) a (17,0) tube. All under a 10% strain (tip at 10.5 eV.)
Heterojunction
7-5-5-7