Effect of daily versus weekly home fortification with multiple Micronutrient powder on haemoglobin...
13
Effect of daily versus weekly home fortification with multiple Micronutrient powder on haemoglobin concentration of young children in a rural area, Lao People’s Democratic Republic: a Randomized Trial Sengchanh Kounnavong a,b , Toshihiko Sunahara b , Masahiro Hashizume b , C.G. Nicholas Mascie- Taylor c , Junko Okumura b , Kazuhiko Moji d , Boungnong Boupha a , Taro Yamamoto b a National Institute of Public Health, MOH, Vientiane, Lao People’s Democratic Republic b Department of International Health, Institute of Tropical Medicine (NEKKEN) and the Global Centre of Excellence Program (GCOE), Nagasaki University, Japan c Department of Biological Anthropology, University of Cambridge, United Kingdom d Research Institute for Humanity and Nature, Kyoto, Japan
-
Upload
camilla-mason -
Category
Documents
-
view
215 -
download
0
Transcript of Effect of daily versus weekly home fortification with multiple Micronutrient powder on haemoglobin...

Effect of daily versus weekly home fortification with
multiple Micronutrient powder on haemoglobin concentration
of young children in a rural area, Lao People’s Democratic Republic: a Randomized Trial
Sengchanh Kounnavonga,b, Toshihiko Sunaharab, Masahiro Hashizumeb, C.G. Nicholas Mascie-Taylorc, Junko Okumurab, Kazuhiko Mojid, Boungnong Bouphaa, Taro Yamamotob
a National Institute of Public Health, MOH, Vientiane, Lao People’s Democratic Republicb Department of International Health, Institute of Tropical Medicine (NEKKEN) and the Global Centre of
Excellence Program (GCOE), Nagasaki University, Japanc Department of Biological Anthropology, University of Cambridge, United Kingdomd Research Institute for Humanity and Nature, Kyoto, Japan

Background & rationale As in many developing countries, micronutrient malnutrition,
namely iron deficiency which causes anemia and suppress motor and mental developments, is a severe public health problem among pre-school children in Lao PDR.
Previous intervention, iron tablet or iron drops were less acceptable to local people because of the bad taste, teeth stain and color.
Recently developed Multivitamins and Minerals Powder (MMP, Sprinkles®) resolved these problems by lipid coating of powder and so far trials in several countries showed encouraging results.
Effectiveness of micronutrient supplementation depends on local food culture and acceptance of people.
It is unknown how it works in Lao PDR.

To examine the efficacy of daily and of twice weekly supplementation using Multi-vitamins & micronutrients powder (MMP) in children 6 to 59 months of age on haemoglobin concentration and on growth
Objective

The product MMP- MixMe TM (DSM Nutritional
Products Europe Ltd. CH 4002 Basel) MMP - in single dose sachet (dose=1
sachet/day), Powder form Minimum changes to the taste, colour
or texture of the food No change in food habit One dose for one child for one day
contains one full recommended nutrient intake (RNI) of vitamins and minerals in one gram of powder
Food based not medical intervention
The nutrient contents per 1g contained of 15 micronutrients:
vitamin A (RE 400µg), • vitamin D3 (5µg, • vitamin E (TE 5mg), • vitamin B1, B2, B6 each (0.5
mg),• Folic acid (150µg), Niacin (6
mg), • vitamin B12 (0.9µg), vitamin
C (30mg),• iron (10 mg), zinc (4.1 mg), • Selenium (17µg), copper (0.56
mg), • Iodine (90 µg). • One pack content 1g X 30
sachets.

Excluded (n= 31)- Absent at the day of enrolment (n=17)- Having fever at the day of enrolment
Methodology
Randomly allocatedN= 336
Twice weekly group (n=115)
Daily group ( n=111)
Control group:( n=110)
Discontinued- Moved (n=3)
-Got diarrhoea (n=1)
Discontinued - Got diarrhoea (n=1)
Analyzed (n=110) Analyzed (n=111) Analyzed (n=110)
8 months Follow upfrom March to October 2009
age, sex, socio-economic background
Lahanam zone
64 sachets of MMP provided
24 0 sachets of MMP provided
Enrolment procedure

Outcome measurements
Anthropometric measurement (Height & weight)
Haemoglobin concentration
Morbidity status: Presence of ARI, Diarrhoea, and other illness conditions
Compliance (weekly counting sachets)
Acceptability based on questionnaire interview & FGD with mothers/care takers at the end of study

PASW statistical package, version 18.0 (SPSS Inc., Chicago, IL, USA).
Socio-demographic, health, and nutrition characteristics (mean and standard deviation (SD) for continuous variables and as frequency for categorical variables)
Differences in prevalence (the Pearson chi-squared test)
Differences in mean haemoglobin concentration and Z-scores between the groups at the beginning and at the end of the intervention were examined using Repeated Measures Analysis of Variance.
The McNemar test was used to assess within group differences at three time points in the study subjects with anaemia and one-way ANOVA was used to assess changes in mean haemoglobin concentration in the treatment groups.
All the analyses were carried out for all subjects and separately for the children who were anaemic at baseline.
Values of p <0.05 were considered to be significant for all tests.
Data analysis
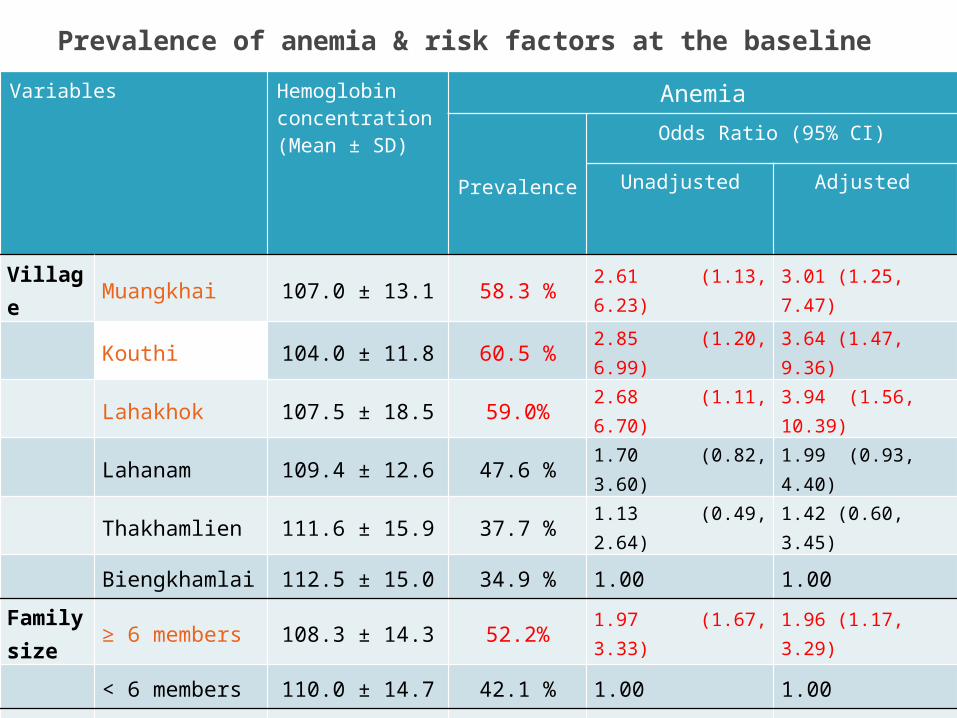
Variables Hemoglobin concentration(Mean ± SD)
Anemia
Prevalence
Odds Ratio (95% CI)
Unadjusted Adjusted
Village Muangkhai 107.0 ± 13.1 58.3 % 2.61 (1.13, 6.23) 3.01 (1.25, 7.47)
Kouthi 104.0 ± 11.8 60.5 % 2.85 (1.20, 6.99) 3.64 (1.47, 9.36)
Lahakhok 107.5 ± 18.5 59.0% 2.68 (1.11, 6.70) 3.94 (1.56, 10.39)
Lahanam 109.4 ± 12.6 47.6 % 1.70 (0.82, 3.60) 1.99 (0.93, 4.40)
Thakhamlien 111.6 ± 15.9 37.7 % 1.13 (0.49, 2.64) 1.42 (0.60, 3.45)
Biengkhamlai 112.5 ± 15.0 34.9 % 1.00 1.00
Family size
≥ 6 members 108.3 ± 14.3 52.2% 1.97 (1.67, 3.33) 1.96 (1.17, 3.29)
< 6 members 110.0 ± 14.7 42.1 % 1.00 1.00
Age < 24 months 105.2 ± 15.7 59.7 % 1.92 (1.22, 3.13) 1.90 (1.10, 3.30)
≥ 24 months 110.8 ± 13.2 43.3 % 1.00 1.00
Total 108.8 ± 14.3 48.9 %
Prevalence of anemia & risk factors at the baseline

Effect of MMP supplementation on Hb concentration and anemia
Improving in Hb concentration:
Daily: 120 (± 11.6) - 107.1 (± 12.9) = 12.9
Weekly: 118.0 (± 13.9) - 105.1 (± 13.2) = 12.9
Control: 117.4 (± 12.8) - 114.3 (± 15.2) = 3.1
Reduction in anemia
Daily (W24-W0) :53.6-20.0=33.6%Weekly (W24-W0) : 58.6-27.9=30.7%Control (W24-W0) : 34.5-29.1=5.4%
0 wk 12 wk 24 wk95
100
105
110
115
120
125
ControlDailyWeekly
0 wk 12 wk 24 wk0
10
20
30
40
50
60
70
ControlDailyWeekly

Chang
e in H
b
co
ncentr
atio
n (g
/L)
Chang
e in H
b
co
ncentr
atio
n (g
/L)
Chang
e in H
b
co
ncentr
atio
n (g
/L)
Control Twice weekly Daily
Non-anaemic
Mild anaemic
Moderate to severe anaemic
A B B
A B B
-30
0
10
30
50
70
20
40
60
-10
-20
-30
0
10
30
50
70
20
40
60
-10
-20
-30
0
10
30
50
70
20
40
60
-10
-20
Chang
e in
Hb
co
ncentr
atio
n (
g/L)
-40
-30
-20
-10
0
10
20
30
40
Chang
e in
Hb
co
ncentr
atio
n (
g/L)
Chang
e in
Hb
co
ncentr
atio
n (
g/L)
Control Twice weekly Daily
Non-anaemic
Mild anaemic
Moderate to severe anaemic
A A B
A B B
A B B
-40
-30
-20
-10
0
10
20
30
40
-40
-30
-20
-10
0
10
20
30
40
Change in Haemoglobin concentration from Week 0 to Week 12 in children who were non-anaemic (haemoglobin concentration ≥ 110 g/L), mild anaemic (100-109 g/L), and moderate to severe anaemic (< 100 g/L) at Week 0. The box indicates the range of the 1st to 3rd quartile with central line at median; Vertical bars indicate the 1.5 times inter-quartile range outside 1st and 3rd quartiles. Within each panel, groups with different letters have significant difference (Mann Whitney U test, P < 0.05).
Change in Haemoglobin concentration from Week 0 to Week 24 in children who were non-anaemic (haemoglobin concentration ≥ 110 g/L), mild anaemic (100-109 g/L), and moderate to severe anaemic (< 100 g/L) at Week 0. The box indicates the range of the 1st to 3rd quartile with central line at median; Vertical bars indicate the 1.5 times inter-quartile range outside 1st and 3rd quartiles. Within each panel, groups with different letters have significant difference (Mann Whitney U test, P < 0.05).

Overall, the Z-scores of height for age increased
The Z-scores of weight for age showed no major improvements
The weight for height Z-scores decreased in all groups.
The increase in height for age Z-scores and the decrease in weight for height Z-scores were significantly greater in the control and DS groups than in the TWS groups.
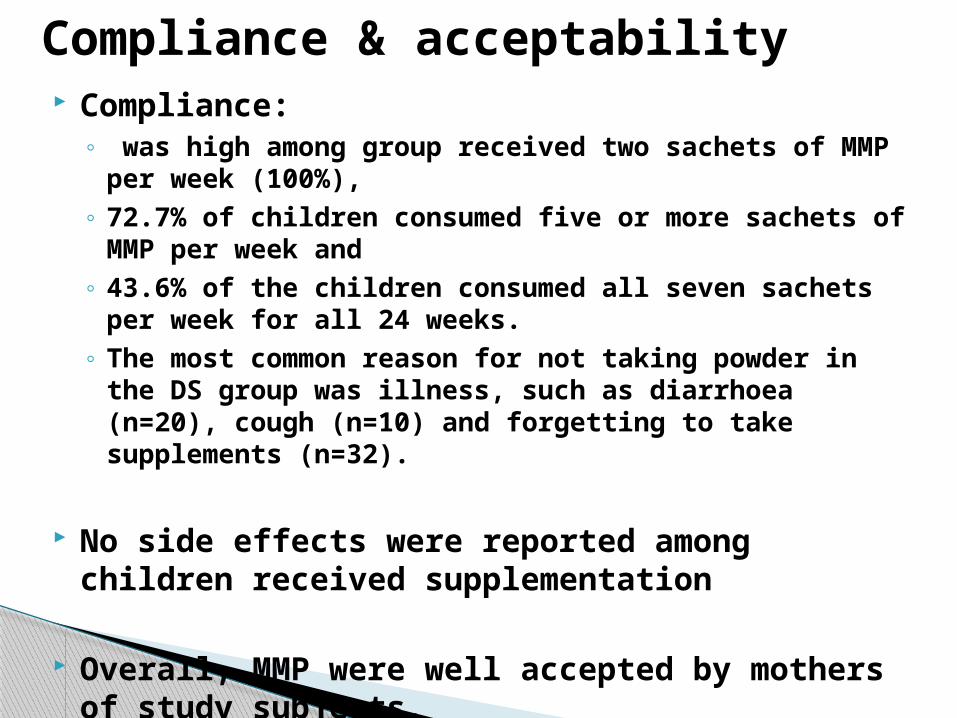
Compliance:◦ was high among group received two sachets of MMP
per week (100%), ◦ 72.7% of children consumed five or more sachets of
MMP per week and ◦ 43.6% of the children consumed all seven sachets
per week for all 24 weeks. ◦ The most common reason for not taking powder in
the DS group was illness, such as diarrhoea (n=20), cough (n=10) and forgetting to take supplements (n=32).
No side effects were reported among children received supplementation
Overall, MMP were well accepted by mothers of study subjects.
Compliance & acceptability

Anaemia prevalence was high especially among young children, children in big families, and those in remote villages
MMP was effective to improve hemoglobin concentration and to reduce anemia
The effects of MMP did not differ significantly between the daily and twice-weekly supplementation arms but compliance was higher in the latter
Implications:
◦ 2 sachets per week would be the recommended dose for the intervention program in this population
◦ For severe to moderate anaemic children daily MMP supplementation was more effective in improving haemoglobin concentration and in reduction in anaemia prevalence
◦ In a longer term, health education that aims to modify food habit would be necessary to improve child growth
Conclusions