Effect of Coconut Oil on Ulcerative Colitis in the Mouse Model
102
Western Kentucky University TopSCHOLAR® Masters eses & Specialist Projects Graduate School 5-2013 Effect of Coconut Oil on Ulcerative Colitis in the Mouse Model Pranav Chandra Alok Western Kentucky University, [email protected] Follow this and additional works at: hp://digitalcommons.wku.edu/theses Part of the Biology Commons , Digestive, Oral, and Skin Physiology Commons , Medical Immunology Commons , and the Natural Products Chemistry and Pharmacognosy Commons is esis is brought to you for free and open access by TopSCHOLAR®. It has been accepted for inclusion in Masters eses & Specialist Projects by an authorized administrator of TopSCHOLAR®. For more information, please contact [email protected]. Recommended Citation Alok, Pranav Chandra, "Effect of Coconut Oil on Ulcerative Colitis in the Mouse Model" (2013). Masters eses & Specialist Projects. Paper 1261. hp://digitalcommons.wku.edu/theses/1261
Transcript of Effect of Coconut Oil on Ulcerative Colitis in the Mouse Model

Western Kentucky UniversityTopSCHOLAR®
Masters Theses & Specialist Projects Graduate School
5-2013
Effect of Coconut Oil on Ulcerative Colitis in theMouse ModelPranav Chandra AlokWestern Kentucky University, [email protected]
Follow this and additional works at: http://digitalcommons.wku.edu/theses
Part of the Biology Commons, Digestive, Oral, and Skin Physiology Commons, MedicalImmunology Commons, and the Natural Products Chemistry and Pharmacognosy Commons
This Thesis is brought to you for free and open access by TopSCHOLAR®. It has been accepted for inclusion in Masters Theses & Specialist Projects byan authorized administrator of TopSCHOLAR®. For more information, please contact [email protected].
Recommended CitationAlok, Pranav Chandra, "Effect of Coconut Oil on Ulcerative Colitis in the Mouse Model" (2013). Masters Theses & Specialist Projects.Paper 1261.http://digitalcommons.wku.edu/theses/1261


EFFECT OF COCONUT OIL ON ULCERATIVE COLITIS IN THE MOUSE MODEL
A Thesis
Presented to
The Faculty of the Department of Biology
Western Kentucky University
Bowling Green, Kentucky
In Partial Fulfillment
Of the Requirements for the Degree
Master of Science
By
Pranav Chandra Alok
May 2013

For their love and support, I dedicate this thesis to my parents, Ishwar Chandra Mishra
and Kumari Asha Mishra, who are a great inspiration to me, and to my beloved wife Pang
Huicai (Priya).

iv
ACKNOWLEDGMENTS
I am extremely thankful to many people at Western Kentucky University. I would
like to thank the members of my graduate committee: Dr. Nilesh Sharma, Dr. Cheryl D.
Davis, Dr. Lawrence A. Alice, and Dr. Scott Grubbs. I am grateful to Dr. Sharma for
suggesting to me the research topic associated with a chronic human health problem that
interested me as a medical graduate and, hopefully, that would prove to be beneficial in
my future endeavors. I am thankful for his patience and understanding, and so
importantly, for teaching me how to communicate with others in an American and
scientific way. Dr. Davis, Dr. Grubbs and Dr. Alice have given me their valuable advice,
which has helped me to advance my project. It is always good to talk with them. I also
want to thank other people in the Biology Department and Biotech Center at Western
Kentucky University. I am grateful to Dr. Sharma and Dr. Davis for teaching me
experimental techniques and helping me with troubleshooting. Thanks are due to Justin
Pile, one of Dr. Sharma’s students, from whom I learned the basic lab practices. Thanks
are also due to Jessica Dunnegan, and Cassandra Cantrell from the Biology department
office for all of their help and support. Dr. Kelly Madole (Dean of Graduate Studies) and
the staff in the Graduate Studies office have been very helpful along the way. I also want
to thank my fellow graduate students and other colleagues for their friendship.
Furthermore, my grandparents, parents, brother, sister and brother-in-law have my
deepest gratitude for their support and love enabling me to complete my graduate studies
in the United States. Finally, I want to thank my wife, Pang Huicai (Priya), who
accompanied me during my study year in Bowling Green, Kentucky. In those stressful
times when experimental results were disappointing or the work needed repeating, she

v
always encouraged me to keep moving ahead, made me happy and cooked delicious
Chinese food that made me forget how tired I was.
I gratefully acknowledge the Office of Sponsored Program, WKU (RCAPII
award to my supervisor) and the Office of Graduate Studies for supporting this research.

vi
CONTENTS
LIST OF FIGURES……………………………..……………………………………...viii
LIST OF TABLES…………….……………………………………………….………...xi
ABSTRACT……………………………………………………………………………..xii
CHAPTER 1: INTRODUCTION ............................................................................................... 1
1.1 What is Ulcerative Colitis? ........................................................................................... 1
1.2 Etiology ......................................................................................................................... 2
1.3 Epidemiology ................................................................................................................ 6
1.4 Role of Coconut Oil ..................................................................................................... 6
CHAPTER 2: MATERIALS AND METHODS .................................................................... 11
2.1 Acute model ................................................................................................................ 11
2.2 Chronic Model ............................................................................................................ 12
2.3 Clinical Markers ......................................................................................................... 12
2.4 Enzyme-Linked Immunoasorbent Assay (ELISA) ..................................................... 15
2.5 Blood Flow Cytometry ............................................................................................... 15
CHAPTER 3: RESULTS .................................................................................................. 17
3.1 Clinical features .................................................................................................................... 17
3.1.1 Acute disease model ................................................................................................ 17
3.1.2 Chronic disease model ............................................................................................. 18
3.2 Inflammatory markers ................................................................................................. 20
3.2.1 Acute disease model ................................................................................................ 20
3.2.2 Chronic disease model……………………………………………………………..22
3.3 Histopathology ……………………………………………………………………....24
3.3.1 Acute model ……………………………………………………………………….24

vii
3.3.2 Chronic model……………………………………………………………………...25
CHAPTER 4: DISCUSSION............................................................................................ 26
4.1 Acute model ................................................................................................................ 26
4.2 Chronic model ............................................................................................................. 29
CHAPTER 5: CONCLUSION ......................................................................................... 33
APPENDIX……………………………………………………………………………....67
LITERATURE CITED ..................................................................................................... 76
CURRICULUM VITAE ...……………………………………………………………....84

viii
LIST OF FIGURES
Figure 1A. Fecal occult blood (acute model)……………………………………….... 34
Figure 1B. Liquid consumption (acute model)……………………………………..... 34
Figure 1C. Length of colon (acute model)………………………………………….... 35
Figure 2A. Percent change in body weight of mice (acute model)…………….…….. 35
Figure 2B. Disease activity index (acute model)…………………………………….. 36
Figure 3A. Percent change in body weight of mice (chronic model)……………….. 36
Figure 3B. Disease activity index (chronic model)………………………………….. 37
Figure 3C. Fecal occult blood (chronic model)……………………………………... 37
Figure 3D. Length of colon (chronic model)……………………………………….... 38
Figure 4A. Image of colon from healthy control group (chronic model)…………..…38
Figure 4B. Image of colon from disease control group (chronic model)……………..39
Figure 4C. Image of colon from preventive group (chronic model)………………… 39
Figure 4D. Image of colon from simultaneous treatment (chronic model)…………...40
Figure 4E. Image of colon from treatment group (chronic model)………………….. 40
Figure 5. Image of blood flow cytometry (chronic model)………………………….. 41
Figure 6A. TNF-α standard curve for experiment 3 (acute model)……..…………… 41
Figure 6B. Blood TNF-α concentration (acute model)...…………………………......42
Figure 6C. Tissue TNF-α concentrations (acute model)…………………………….. 42
Figure 7A. IFN-γ standard curve for experiment 3 (acute model)…………………... 43
Figure 7B. Blood IFN-γ concentrations (acute model)……………………………… 43
Figure 7C. Tissue IFN-γ concentrations (acute model)………………………………44
Figure 8A. IL-17 standard curve for experiment 3 (acute model)……………............44
Figure 8B. Blood IL-17 concentrations (acute model)……………………………….45

ix
Figure 8C. Tissue IL-17 concentrations (acute model)……………………………........45
Figure 9A IL-1β standard curve for experiment 3 (acute model). ……………..............46
Figure 9B. Blood IL-1β concentrations (acute model)……………………………........46
Figure 9C. Tissue IL-1β concentrations (acute model)…………………………………47
Figure 10A. IL-6 Standard curve for experiment 3 (acute model)………………...........47
Figure 10B. Blood IL-6 concentration (acute model)…………………………………..48
Figure 11A. TNF-α standard curve (chronic model)……………………………………48
Figure 11B. Blood TNF-α concentration (chronic model)……………………..............49
Figure 11C. Tissue TNF-α concentration (chronic model)…………………….............49
Figure 12A. IFN-γ standard curve (chronic model)……………………………............50
Figure 12B. Blood IFN-γ concentration (chronic model)……………………………...50
Figure 12C. Tissue IFN-γ concentration (chronic model)………………………...........51
Figure 13A. IL-17 standard curve (chronic model)…………………………….............51
Figure 13B. Blood IL-17 concentration (chronic model)………………………............52
Figure 13C. Tissue IL-17 concentration (chronic model)……………………………...52
Figure 14A. IL-1β standard curve (chronic model)…………………………………….53
Figure 14B. Blood IL-1β standard curve (chronic model)…………………………......53
Figure 14C. Tissue IL-1β standard curve (chronic model)…………………………......54
Figure 15A. IL-6 standard curve (chronic model)……………………………………...54
Figure 15B. Blood IL-6 concentration (chronic model)………………………………..55
Figure 15C. Tissue IL-6 concentration (chronic model)…………………………….....55
Figure 16A. Healthy control acute and chronic model (100x)…….…………………...56
Figure 16B. Healthy control acute and chronic model (400x)…………………….…...56

x
Figure 17A. Disease control acute model (100x)……………………………………..57
Figure 17B. Disease control acute model (400x)……………………………………..57
Figure 18A. Simultaneous group acute model (100x)………………………………..58
Figure 18B. Simultaneous group acute model (400x)………………………………..58
Figure 19A. Treatment group acute model (100x)…………………………………...59
Figure 19B. Treatment group acute model (400x)…………………………………...59
Figure 20. Disease control chronic model (400x)…………………………………....60
Figure 21A. Preventive group chronic model (100x)………………………………..60
Figure 21B. Preventive group chronic model (400x)………………………………..61
Figure 22A. Simultaneous group chronic model (100x)…………………………….61
Figure 22B. Simultaneous group chronic model (400x)…………………………….62

xi
LIST OF TABLES
Table 1. Experimental and Control Groups……………………………………...63
Table 2. Acute Model General Timetable………………………………………..63
Table 3. Chronic Model General Timetable……………………………………...63
Table 4. Dehydration Protocol for Isolated Colon Tissue ………………………64
Table 5. Hematoxylin and Eosin Staining Protocol for Microtome Sections……65
Table 6. Scale for Disease Activity Index ………………………………………66

xii
EFFECT OF COCONUT OIL ON ULCERATIVE COLITIS IN THE MOUSE MODEL
Pranav Chandra Alok May 2013 86 Pages
Directed by: Dr. Nilesh Sharma, Dr. Cheryl Davis, and Dr. Scott Grubbs
Department of Biology Western Kentucky University
Ulcerative colitis (UC) is a chronic disease of the colon or large intestine that
causes inflammation and ulceration of the inner lining of the colon and rectum. In
patients with ulcerative colitis, the body’s immune system overreacts and the body
mistakes food, bacteria or other internal materials in the colon for an invading substance.
The immune system attacks the material, thus irritating the colon. Limited knowledge of
inflammatory conditions coupled with a narrow range of therapeutic options necessitates
investigating the role of natural products. This study describes the effect of natural
coconut oil on chemically-induced acute and chronic disease in mice. Ulcerative colitis
was induced in four groups (5 mice per group) of 10-week-old female C57BL/6 mice by
exposing them to 2.5-3% dextran sulfate sodium (DSS) for 5 and 29 days in the acute and
chronic models, respectively. Coconut oil treatment was given via food containing 5%
coconut oil to three diseased groups in three different regimens: one, preventive group
receiving treatment prior to disease induction (14 d in acute; 28 d in chronic); two,
simultaneous group receiving treatment simultaneous to disease induction; and three,
regular treatment group receiving treatment after the disease induction –until termination
of the experiment (14 d in acute; 60 d in chronic). Coconut food was replaced by the
regular chow in the disease and water control groups. Clinical symptoms (diarrhea, occult
blood, anal bleeding and body weight change) and the size of the isolated colon were
recorded for comparison between experimental and control groups. Groups receiving

xiii
coconut food displayed remissions in clinical markers of the disease. Improvements in
clinical symptoms, histopathology, as well as cytokine activities were observed in both
models, but the effects were more significant on the basis of standard error in the chronic
model.
Keywords: ulcerative colitis, coconut, medium-chain fatty acids, gastrointestinal
ulcers, natural fatty acids, virgin coconut oil, coconut supplements.
1
Chapter 1: Introduction
1.1 What Is Ulcerative Colitis?
Ulcerative colitis (UC) is a chronic disease of the colon or large intestine that
causes inflammation and ulceration of the inner lining of the colon and rectum (Xavier
and Podolsky, 2007). It can occur in all areas of the colon, although in some people UC
affects only certain portions of the colon (Itzkowitz et al., 2004). In patients with UC, the
body’s immune system overreacts. The body mistakes food, bacteria or other internal
materials in the colon for an invading substance and it signals the immune system to
attack the material, thus irritating the colon. This irritation triggers a flare in symptoms of
ulcerative colitis. During a flare, people with ulcerative colitis may have bloody, pus- or
mucus-filled stools, diarrhea, cramping, abdominal pain and bloating. Polymorphonuclear
neutrophil infiltration is associated with the primary and central lesion of colitis and
followed by loss of the epithelium, goblet cells and crypt damage (Malago & Nondoli,
2008). Ulcerative colitis affects approximately 500,000 people annually in the United
States, with a peak incidence between the ages of 15 and 25. The disease affects females
more than males (Hanauer, 1996). The highest incidences of UC are seen in the United
States, Canada, the United Kingdom and Scandinavia. The northern parts of Europe and
the United States are much more affected than southern regions. The prevalence of UC is
higher in people of Ashkenazi Jewish descent, non-Jewish Caucasians, Africans,
Hispanics and Asians (Fauci, Kasper, Longo, Braunwald, Hauser, Jameson and Loscalzo,
2008).
Since the etiology of UC remains unclear, successful treatment strategies targeting large
sections of the affected population have not been found. In recent years, several clinical

2
trials have been performed to establish the efficacy of different therapies, but nothing
seemed effective in curing the disease. Patients with prolonged UC are at an increased
risk for developing colitis-associated cancer (CAC) (Ekbom, 1998; Greten et al., 2004).
The risk of colon cancer increases with the duration and severity of the disease.
Approximately 5% of all UC patients are diagnosed with colon cancer (Dey et al., 2010).
UC is currently treated with medications that include a combination of anti-
inflammatory, immunosuppressive and antibiotic drugs with limited remission and
significant episodes of side effects; often patients become refractory and seek an
alternative therapy (Hilsden, 2003). Side effects of the above drugs, such as kidney
damage or increased risk of infections from use of immunosuppressive agents are
common (Kwon and Farrell, 2005; Aharoni et al., 2006). One recent study has shown that
21% of patients with inflammatory bowel disease (IBD), of which UC and Crohn’s
disease are the predominant types, resort to the use of complementary and alternative
medicine, discontinuing their prescribed medicines (Head et al., 2004). Lack of
efficacious drugs to treat patients with different forms of IBD underscores the need for
the development of a new and effective alternative therapy.
1.2 Etiology
(http://www.ulcerativecolitis.us/app/images/causes.gif)

3
The pathogenesis of ulcerative colitis is not well known. However, several factors
contribute to the development of UC, such as environment, genetic tendency and
immunology. The major theories include infection, allergy to food component, genetics,
environmental factors, and immune response to bacteria or other antigens (Neuman &
Nanau, 2012). In addition, genetic studies and mouse models have emphasized the role of
genetic predispositions and how they affect interactions with microbial and
environmental factors, leading to pro-colitogenic perturbations of the host–commensal
relationship (Khor, Gardet and Xavier, 2011). It is believed that the body’s immune
system reacts abnormally to the natural gut flora, specifically the bacteria in proximity to
the mucosal cells of the colon, leading to an increased pro-inflammatory response such as
the activation of monocytes, macrophages and cytokines.
Histological evaluations show aggregation of monocytes and macrophages in the
mucosal lining of colon tissue derived from UC patients. Although the innate immune
response is primarily involved in initiating colonic inflammation, the role of adaptive
immunity (T-cell responses) in contributing to UC symptoms is significant (Sartor,
2006). Mucosal epithelial cells play an important role not only in the development of
innate immunity but also in the induction of memory pathways of adapted immunity. The
primary locations where the adapted immune response sets in are at crypts and lymphatic
follicles (Lukas et al., 2006). One widely held hypothesis on the pathogenesis of UC and
other IBD is that T-cell (adaptive) immune responses to a subset of commensal enteric
bacteria are over-expressed in genetically susceptible hosts, where environmental factors
lead the onset of disease (Sartor, 2006).
1.2.1 Inflammatory cytokine response.

4
Major inflammatory cytokines produced by activated macrophages include TNF-
α, IL-6 and IL-1β. These cytokines are generally elevated in the colonic mucosa of UC
patients, and implicated in mucosal damage that occurs in this disorder (Murata et al.,
1995). While the production of regulatory cytokines such as IFN-γ decreases, IL-10
increases in the case of inflammatory colitis. IFN-γ is a dimerized soluble cytokine that is
the only member of the type II class of interferons. This cytokine is essential for innate
and adaptive immunity against viral and intracellular bacterial infections and for tumor
control. The role of Th17 cells and IL-17 in gut inflammation has been recently examined
in excellent reviews (Monteleone et al., 2009; Strober and Fuss, 2011). Th17 cells are
constitutively present in human and mouse intestinal mucosa, and provide defense against
enteric bacteria. Th17-derived cytokines such as IL-17A, IL-21 and IL-22 promote the
recruitment of inflammatory cells in the intestinal lamina propria, owing to their ability to
enhance the synthesis of chemo-attractants and adhesion molecules (e.g., ICAM-1) by
epithelial and endothelial cells, respectively (Monteleone et al., 2009). In this study, five
important cytokines associated with inflammatory colitis (TNF-α, IFN-γ, IL-6, IL-1β and
IL-17) were studied. These cytokines were assayed by cytokine sandwich ELISA
(enzyme-linked immunoasorbent assay) model using sera and tissue samples (for the
quantification of site-specific cytokine level) collected from all the experimental and
control groups of mice.
1.2.2 Environmental factors.
Studies show that environmental agents (diet, stress, drugs) are important in the
initiation of initiate UC disease expression (Sartor, 2006). Recently, several disease-
modifying factors have been identified, such as diet, spices, antibiotics, modern infant

5
nutrition, stress, smoking, highly hygienic and sanitary conditions, use of other drugs, etc.
(Lukas et al., 2006). In developed countries, living under extremely hygienic conditions
in early childhood leads to dramatic commensal contact reduction between bacterial flora
and immuno-competent cells in the bowel. Consequently, the loss of tolerance to
bacterial (pathogenic) antigens may cause chronic intestinal inflammation later in life
(Lukas et al., 2006).
1.2.3 Genetics.
Both UC and Crohn’s disease have a complex genetic basis; however, the
genetic cause is better recognized currently in Crohn’s disease than in UC. Few genes
have been identified that are related to the etiology of IBD: four genes with Crohn’s
disease and one gene (PPARG) with ulcerative colitis. PPARG is a nuclear receptor that
inhibits NF-κB activity and is responsible for decreased expression in the patients with
active ulcerative colitis. The genes associated with the pathogenesis of IBD generally
regulate innate immune responses, mucosal barrier function and bacterial killing (Sartor,
2006). It is well documented that reactive oxygen species (ROS) activate NF-κB, which
leads to the generation of pro-inflammatory cytokines and other inducible enzymes, such
as cyclooxygenase -2 (COX-2) in leukocytes and macrophages (Chandel et al., 2000).
Chemopreventive and chemoprotective phytochemicals can correct undesired cellular
functions caused by abnormal pro-inflammatory signal transmissions mediated by NF-κB
(Surh, 2008). This inflammatory regulator as well as transcription factor exists mainly as
a heterodimer comprised of subunits of the Rel family p50 and p65; activation of NF-κB
involves the phosphorylation of I-κBs. The resulting free NF-κB is then translocated to
the nucleus, where it binds to κB binding sites in the promoter regions of target genes and

6
regulates the expression of pro-inflammatory cytokines, chemokines and (COX)-2. This
can lead to chronic inflammatory disease such as UC and ultimately to cancer (Chun et
al., 2004).
1.3 Epidemiology
Epidemiological studies show that the environment and genetics have a role in
the development of the disease. Ulcerative colitis may occur in people of any age, but
most often it starts between ages of 15 and 25 and less frequently in older age (Changtai
et al., 2009). American Jews of European descents are more prone to develop UC than
the general population. Moreover, females are more susceptible to this disease than
males, with higher incidence in North America, Scandinavia and the United Kingdom.
Studies have shown that 20% to 25% of patients may have a close relative with either
Crohn’s disease or ulcerative colitis (Crohn’s & Colitis Foundation of America, 2013).
Ulcerative colitis is predominantly found in developed countries and less often found in
Asia, Eastern Europe, South America and other parts of the developing world (Lee,
2013). There are significant differences between ethnic groups with some, such as
Ashkenazi Jews, having higher incidence. It is a worldwide disorder with high-incidence
areas that include Australia, northern Europe, the United States and United Kingdom.
Also, there is a higher incidence in northern versus southern regions. A low incidence of
UC is seen in Asia, Japan, and South America (Changtai et al., 2009).
1.4 Role of Coconut Oil
The role of saturated fatty acids on human health is currently being revisited, and
this issue is drawing significant attention specifically in inflammatory and metabolic
disorders (Head et al., 2004). Recently, anti-inflammatory role of coconut oil was

7
examined in some investigations. Zakaria et al (2011) demonstrated an anti-
inflammatory role of virgin coconut oil in an acute carrageenan-induced paw edema in
Sprague- Dawley rats but not in a chronic model of inflammation. Natural coconut
(Cocos nucifera) oil is a rich source of medium-chain saturated fatty acids (MCFAs), its
main constituent being lauric acid, a 12-carbon fatty acid. Effects of MCFAs such as
lauric and caprylic acid have been little studied until very recently (Head et al., 2004).
1.4.1 Physico-chemical properties.
Coconut oil is insoluble in water. Above its melting point, coconut oil is
completely soluble with non-hydroxylic solvents such as benzene. Also, it is more
soluble in alcohol than other common fats (oils). It has low iodine content, high medium
chain fatty acid content and at room temperature (27ºC) it stays in liquid form. Oils are
generally made up of triglyceride molecules containing tri-esters of glycerol and fatty
acids. Upon hydrolysis they yield fatty acids and glycerol. The fatty acids can be
classified on the basis of their molecular size or length of the carbon chain. The majority
of fats (oils), whether they are saturated or unsaturated or from an animal or a plant, are
composed of long-chain fatty acids (LCFAs). MCFAs are a type of fat in which three
saturated fats are attached to glycerol molecule are attached, with each chain comprising
six to twelve carbon atoms (Babayan, 1988). MCFAs can be found in many foods and
dietary supplements (Heydnger and Nakhasi., 1996). They have different patterns of
absorption and utilization than fats such as LCFAs.
In the process of LCFA absorption, fatty acid chains are cleaved from the glycerol
with the help of the lipase enzyme. These fatty acids then form micelles that are absorbed
and reattached to glycerol to travel through the lymph system to the bloodstream. About

8
30%of MCFAs are absorbed in the intestine to reach portal vein directly, which leads to
fast absorption and utilization of MCFAs than any other type of fat. MCFAs are
transported without the need for any kind of shuttle to the mitochondria and metabolized
rapidly in the liver. They do not participate in the biosynthesis and transport of
cholesterol (Hoahland and Snider, 1943; St-Onge, Ross, Parsons and Jones, 2009).
The presence of MCFAs in coconut oil makes it different from all other
commonly consumed fats (oils) and gives it its unique character and healing properties.
Nearly all of the medium-chain triglycerides used by scientists, researchers and
pharmaceutical companies come from coconut oil. MCFAs are easily digested and
absorbed, and thus are commonly used for cosmetic and nutrition purposes. They
provide a quick source of energy that is conducive to promote healing. MCFAs are
natural and vital components of human breast milk, which confers nutrition and
immunity to newborns. This is why MCFAs are also added to infant formulas. MCFAs
are considered essential nutrients for infants as well as for the people with cystic fibrosis
and IBD (Johnson and Cotter, 1986; Marie et al., 2003).
1.4.2 Therapeutic Applications and Healing Properties of Coconut Oil
MCFAs have been used in other malabsorption syndromes, including small-
bowel syndrome, celiac disease and hepatic disease (Johnson and Cotter, 1986). MCFAs
may help with weight maintenance in AIDS patients. An enteral formula containing
85%of fat calories from MCFA (35% of total calories from fat) led to decreases in stool
fat, number of bowel movements and abdominal symptoms, as well as increased fat
absorption compared with baseline; however, a LCFA-containing formula showed no
improvement (Robert, 1978; Nick, 2006). MCFA-containing caloric supplements do not

9
appear to cause weight gain in AIDS patients compared with a control diet. Studies
indicate that specific MCFAs, such as lauric and caprylic acid, have an adverse effect on
the pathogenic microorganisms, including bacteria, yeast and fungi. These fatty acids and
their derivatives actually disrupt the lipid membranes of the organisms and thus inactivate
them (Isaacs and Thomas, 1991).
Coconut oil is antiviral, anti-fungal and antibacterial. It attacks and inhibits viruses
that have a lipid coating, such as herpes simplex, HIV, hepatitis C, flu and
mononucleosis. It is able to kill the bacteria that cause some types of pneumonia, sore
throats, dental caries, meningitis, gonorrhea, food poisoning, urinary tract infections and
several other infections (Kabara, 2000). It also inhibits the fungi and yeast that cause the
various forms of tinea, as well as Candida. MCFAs can reduce mucosal irritation, the
classic characteristic of irritable bowel syndrome (IBS) and dysbacteriosis (Lim, 1987).
Approximately 50% of the fatty acids of coconut oil are in the form of lauric acid.
Lauric acid is known to inactivate viruses and bacteria that are enveloped in a
phospholipid membrane such as influenza viruses and HIV (Nick, 2006). Coconut
contains about 75% dietary fiber that is beneficial for colon flora. Reports indicate that
coconut oil is not accumulated in adipose tissues and thus not considered a contributing
factor to obesity. It tends to increase the HDL and decrease the LDL: HDL ratio
(Assuncao et al., 2009).
Research also shows that coconut oil lowers cholesterol by stimulating thyroid
function. In the presence of thyroid hormone, cholesterol is converted to pregnenolone,
progesterone and DHEA, reducing the risk of cardiovascular disease, dementia, cancer,
obesity, aging and chronic degenerative diseases (Cohen et al., 1986; Lim, 1987). This

10
shows the thyroid suppressive and immunosuppressive effect of coconut oil. Thus it can
be seen that MCFAs exhibit different metabolic activities than saturated or unsaturated
long- and short-chain fatty acids.
Limited knowledge of the physiopathology of ulcerative colitis, coupled with a
narrow range of therapeutic options, necessitates investigating the role of natural products
as alternative therapies. We hypothesized that coconut oil containing medium-chain fatty
acids will affect clinical symptoms and colon histopathology involved in ulcerative colitis
by modulating inflammatory responses in the diseased mice. This study includes the
effect of coconut oil in acute and chronic models of the disease, based on laboratory
mice. The objectives of this research were: I. to chemically induce ulcerative colitis in
experimental and control groups of age/gender-matched mice (C57-BL6/J), II. to monitor
clinical symptoms, III. to evaluate proinflammatory cytokines (TNF-α, IFN-γ, IL-6, IL-
1β and IL-17) in sera and colonic tissues and, IV. to assess colonic tissues for histological
changes in treatment and control groups.

11
Chapter 2: Materials and Methods
2.1 Acute Model
2.1.1 Induction of colitis by DSS administration.
Five groups of 10–12-week-old female mice (C57-BL6/J), 5 mice per group, were
housed in standard mouse cages with a normal supply of food (Lab Diet from PMI
Nutrition International, LLC, St. Louis, MO) and drinking (tap) water. These mice were
observed for 72 hours before starting the experiment. All mice groups were maintained in
the designated room at 25–28°C with 12-hour light/dark cycle.
Oral administration of DSS was given as follows: On day one, the mice were
weighed and numbered. Four groups of mice exposed to 3% (w/v) DSS were selected as
disease groups. The water bottle of each mouse cage was filled with 100 ml of 3% DSS
solution and was given to these mice ad libitum (consumption calculated at the rate of 5
mL DSS solution per mouse per day). Vehicle control mice received the same drinking
water without DSS, and this group was designated the healthy control group. A critical
step was to mount the bottle lids properly and ensure that the tips were not blocked. The
DSS solution remaining in the water bottles was emptied at days three and five, and the
bottles were refilled with fresh DSS solution of the same concentration. The remaining
DSS solution was replaced by tap water on day seven (Wirtz et al., 2007), and kept
available to the mice until the last day of the experiment.
2.1.2 Coconut food treatments.
Customized coconut food (Lab Diet containing 5% of virgin coconut oil) was
purchased from PMI Nutrition International, LLC. Coconut oil treatment was given to
three diseased groups of mice in three different regimens, one, preventive group receiving
treatment 14 d prior to disease induction; two, simultaneous group receiving treatment

12
simultaneous to disease induction; and three, regular treatment group receiving treatment
after the disease induction –until termination of the experiment, day 14. Coconut food
was replaced by the regular chow in the disease and healthy control groups. A general
timetable for the acute DSS and coco food administration model can be found in Table 2.
2.2 Chronic Model
2.2.1 Induction of colitis by DSS administration.
The chronic DSS colitis model started on day zero with numbering and weighing
of mice. The same day, the water bottle of each mouse cage was filled with 2.5% DSS
solution, with the exception of the healthy control group (vehicle control). On day three,
the water bottles were emptied of DSS and refilled with tap water until day 8. Four cycles
of DSS and water were repeated as above. (Wirtz et al., 2007).
2.2.2 Coconut food treatments.
Coconut oil treatment was given to the three diseased groups of mice in different
regimens, one, preventive group receiving treatment 28 days prior to disease induction;
two, simultaneous group receiving treatment simultaneous to disease induction; and
three, regular treatment group receiving treatment after the disease induction –until
termination of the experiment, day 60. Coconut food was replaced by the regular chow in
the disease and healthy control groups. A general timetable for the chronic disease
induction and coconut food intervention model can be found in Table 3.
2.3 Clinical Markers
2.3.1 Body weight measurement.
Body weight of mice in all experiments was measured in grams every other day
from day zero to the experiment termination day. The percent change in body weight was
calculated by the following formula:

13
100%
initial
initialfinalBodyWeight
2.3.2 Fecal occult blood test and stool consistency.
A product called ColoScreen ES Lab Pack (Helena Laboratories, Beaumont, TX)
was used to evaluate the presence of fecal occult blood on every other day at the time of
body weight measurements. Two random measurements per group of mice were taken to
check the clinical markers. A fresh stool sample was collected and placed in the test area
of the ColoScreen kit. Two drops of reagent from the ColoScreen kit was placed on the
area to be used as a reference and the stool sample test area, then the results were
observed for the color change according to the amount of blood present in the stool.
Results were recorded and the presence or absence of fecal blood was used in the
determination of the disease activity index. Values were averaged over the entire period
of the experiment.
In the process of making decisions for experiments, the stool of each group was
observed and scored on a scale ranging from 0 to 2 based on the degree of severity of
fecal blood and stool consistency: 0 = normal solid, no color change in samples; 1 = mild,
color change in samples with soft stool; 2 =severe, color change in samples with diarrhea,
loose stool sticking to the cage wall and mouse body, blood spots scattered around anus
and the presence of rectal prolapse.
2.3.3 Liquid consumption.
The measurement of the amount of liquid (tap water; DSS solution) consumed by
each group was recorded and analyzed. Each group received an initial amount of 100 mL
of liquid (DSS solution or water), and the amount of liquid consumed was recorded on
the day of replacement. Adult mice are known to consume generally 5 mL of drinking

14
water per day when given ad libitum. An average consumption per group was calculated
for the period of DSS exposure.
2.3.4 Euthanasia, isolation and storage of colon.
At the termination of the experiment, the mice from each group were euthanized
using an overdose of the inhalant anesthesia Isofluorane (Baxter Healthcare Corporation,
99.9% Isofluorane/mL) administered in a euthanasia chamber. After ensuring death, each
mouse was dissected for isolation of colon (distal portion of large intestine). Isolated
colon lengths were measured in centimeters. Isolated colons were stored in histology
tubes with 10% neutral formalin solution prior to histological analysis. Average colon
lengths with standard errors from each group were determined and plotted.
2.3.5 Histology.
Paraffin-embedded tissues were sectioned at a thickness of six to seven microns
using a rotary microtome. The sectioned ribbons containing colon sections were then
stained by hematoxylin and eosin (H&E) for histological evaluation of colonic damage
(100x and 400x magnification). In a typical tissue, nuclei are stained blue by the
hematoxylin while the cytoplasm and extracellular matrix show varying degrees of pink
staining from the eosin. Nucleoli stain with eosin (Fischer et al., 2008). The staining
protocol is shown in Table 5.
2.3.6 Drawing blood and tissue from euthanized mice.
After euthanasia, a 1-ml tuberculin syringe with 25 and ½ guage needle was used
to draw blood directly from the heart of each mouse by opening the thoracic cage. A new
sterile syringe and needle was used for each replicate. The blood from each replicate was
placed in a 1.5 mL autoclaved micro-centrifuge tube. The tubes were stored in a

15
refrigerator at 4°C overnight. Colons were collected terminally, measured for their gross
length and flushed with sterile Type I purified water. Tissue samples (each 3 mm) from
each replicate were collected and incubated with RPMI-1640 media in a sterile cell
culture plate for 72 hours at 37° C. Blood and tissue samples were then centrifuged twice
at the rate of 3,000 RPM for 10 minutes. Sera and tissue sample extracts were collected
and placed into new autoclaved micro-centrifuge tubes. The sera and tissue extract
samples were stored in the -20°C freezer until used in ELISA. Serum and tissue extract
samples were used for testing the concentrations of TNF-α, IFN-γ, IL-1β, IL-6 and IL-17
in experimental and control groups.
2.4 Enzyme-Linked Immunoasorbent Assay (ELISA)
Anti-mouse TNF-α, IFN-γ, IL-1β, IL-6 and IL-17 were procured from R&D
Systems, Inc. (Minneapolis, MN) For the TNF-α capture antibody, 144 μg/mL of goat
anti-mouse TNF-α was reconstituted with 1.0 mL of PBS. For the IFN-γ capture
antibody, 720 μg/mL of rat anti-mouse IFN-γ was reconstituted with 1.0 mL of PBS. For
the IL-17 capture antibody, 360 μg/mL of goat anti-mouse IL-17 was reconstituted with
1.0 mL of PBS. All capture antibodies, detection antibodies, and standards were allowed
to rest for a minimum of 15 minutes and were gently agitated prior to making dilutions.
Reagents and solutions were prepared in accordance with the instructions in the R&D
Systems kit. The procedure is outlined in appendix.
2.5 Blood Flow Cytometry
Monocyte phenotyping.
Monocytes were phenotyped as classic (CD14+/CD16-) or inflammatory
(CD14+/CD16+) according to a modified published protocol (Navalta et al., 2011). All

16
antibodies and buffers were obtained from eBioscience (San Diego, CA, USA). Briefly, a
20 µL sample of blood from each mouse was added to a 250 µL antibody panel
containing titered quantities of anti-mouse CD14-FITC and anti-mouse CD16-PE in Flow
Cytometry staining buffer. The sample was incubated for 30-min in the dark and then
centrifuged for 5-min. After decanting and vortexing thoroughly, 300 µL of RBC lysis
buffer was added and the sample was incubated for 15-min before 300 µL of PBS was
introduced. The sample was centrifuged for 10-min, decanted, and then vortexed
thoroughly prior to analysis by flow cytometry (BD Accuri, C6, San Jose, CA, USA). An
initial monocyte gate was established according to forward- and side-scatter properties,
and then populations of classic and inflammatory monocytes were identified. Each
replicate sample was processed in duplicate and values were averaged to obtain the final
result.

17
Chapter 3: Results
3.1Clinical Features
3.1.1 Acute Disease Model
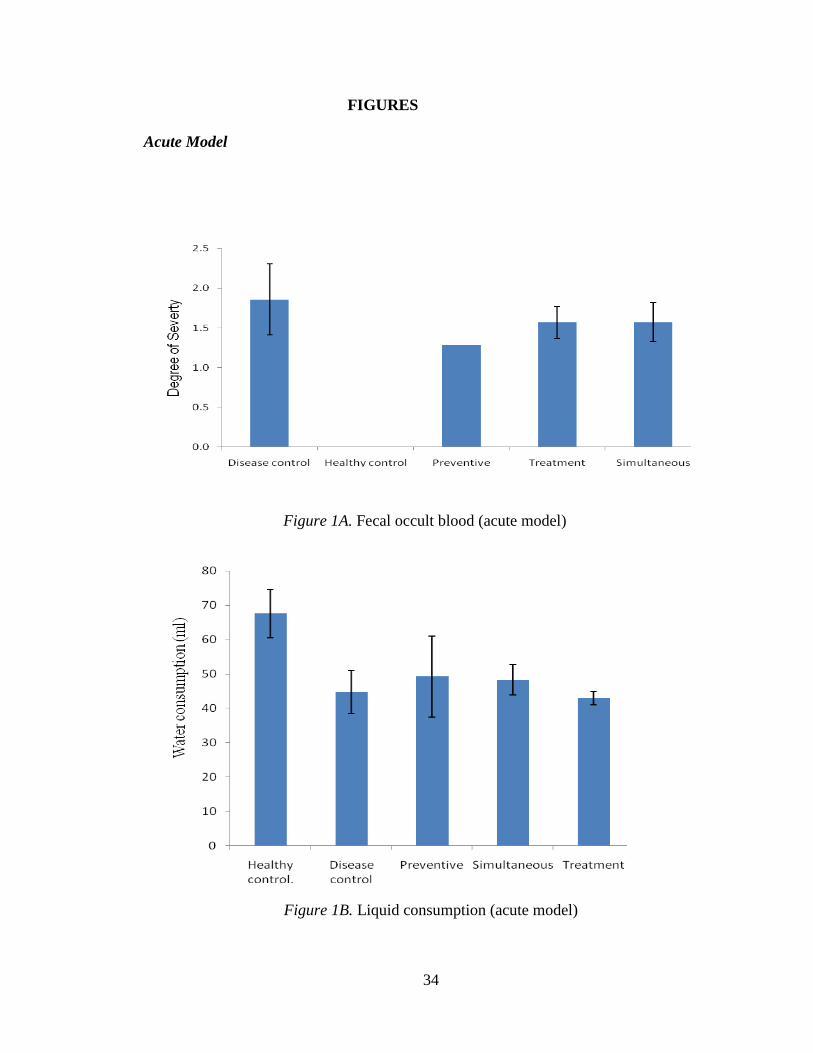
3.1.1.1 Liquid consumption
Liquid consumption by each group during the exposure to DSS was measured to
ensure that each diseased mouse was exposed to the equivalent quantity of the disease-
causing chemical, DSS. Figure 1B shows an average consumption of water or DSS
solution by a group of 5 mice, averaged over the period of DSS exposure. All DSS
groups consumed about the same quantity of solution (no significant difference as seen
by the standard error) varying from 38 to 60 mL. However, mice in the healthy control
group displayed a significantly higher consumption of water, up to 75 mL.
3.1.1.2 Body weight change
Figure 2A shows the percent change in mouse body weight over the course of the
experiment. Body weight started declining after three days of DSS exposure in all groups
except in healthy and preventive groups. The loss in body weight measured up to 35% in
the simultaneous group, followed by 25% in the treatment group. However, the
preventive group displayed a different pattern, the weight decline started late, after 6
days, following a significant gain at day three. The drop in weight in this group reached
13%, and returned to 5% at day 11. However, the weight gain in this group was not
significantly different from the disease control by the end of the experiment.
3.1.1.3 Diarrhea and fecal occult blood
Figure 1A displays the severity of diarrhea and fecal occult blood (averaged over the
entire period of the experiment) in different test and control groups (scale in Table 6). It

18
can be seen that the disease control had a severity value of >2, while treatment groups
had a severity index of < 2. Mice in the preventive group scored a significantly less value,
<1.5, than mice in the disease control and other test groups. Obviously, ice in the healthy
control group measured zero on this scale having no DSS exposure.
3.1.1.4 Colon size
Colons from all groups of mice were isolated and measured (size) after termination
of the experiment. Figure 1C shows that mice in the healthy control group had the largest
average colon size of 9 cm while mice in the disease control group had the smallest
average size of 5.6 cm. All treatment groups had a significantly larger average colon size
than disease control but significantly smaller than that of the healthy control.
3.1.1.5 Disease activity index
A disease activity index was prepared on the basis of a combined scale including
disease symptoms such as body weight loss, colon length, fecal occult blood and stool
consistency see (Table 6). Mice in the disease control group displayed a maximum value
of two on this index. This value dropped to a level of one at the end of the experiment.
The calculated disease index in disease control and treatment groups was not significantly
different. As expected mice in the healthy control group scored zero, having no
symptoms on this index (Figure 2B).
3.1.2 Chronic Disease Model
3.1.2.1 Body weight change
With the induction of chronic disease, the weight of mice in some test groups and in
the disease control group decreased significantly (Figure 3A). Around day 30, maximum
weight loss, approximately 28%, was observed in the simultaneous test group, followed
by approximately 15 % in treatment groups which was similar to mice in the disease

19
control group. However, mice in the preventive test group suffered no weight loss after
DSS exposure. After the end of the last cycle of DSS exposure, an increase in weight
toward weight restoration was significant in the test groups as well as in the disease
control group. However, the rate of weight gain in the preventive group was significantly
greater than in any other groups including the healthy control. The weight in the
preventive group gradually rose over the entire period of the experiment until day 60 with
a final gain of <20% over the initial weight. The preventive test groups had the most
pronounced improvement, with average body weight exceeding the initial average body
weight (the weight before any treatment). This group demonstrated the possible
preventive potential of the treatment.
3.1.2.2 Diarrhea & fecal occult blood.
Figure 3C indicates the severity of diarrhea and fecal occult blood in different
groups. Values for each group were averaged over the entire period of the experiment.
Disease control mice measured 2 to 2.5; mice in test groups scored 1 to 1.5 on this scale
of severity (Table 6). No significant differences were observed among the test groups.
3.1.2.3 Colon length.
Figure 3D indicates the average length of isolated colon from each group at the end
of the experiment. It can be seen from this figure that the colons of mice in the preventive
group were restored to the size observed for healthy control mice, while colon lengths in
simultaneous and treatment groups were not significantly different than in the disease
control group. Figures 4(A-E) show photographs of isolated colons of replicates from
each group.
20
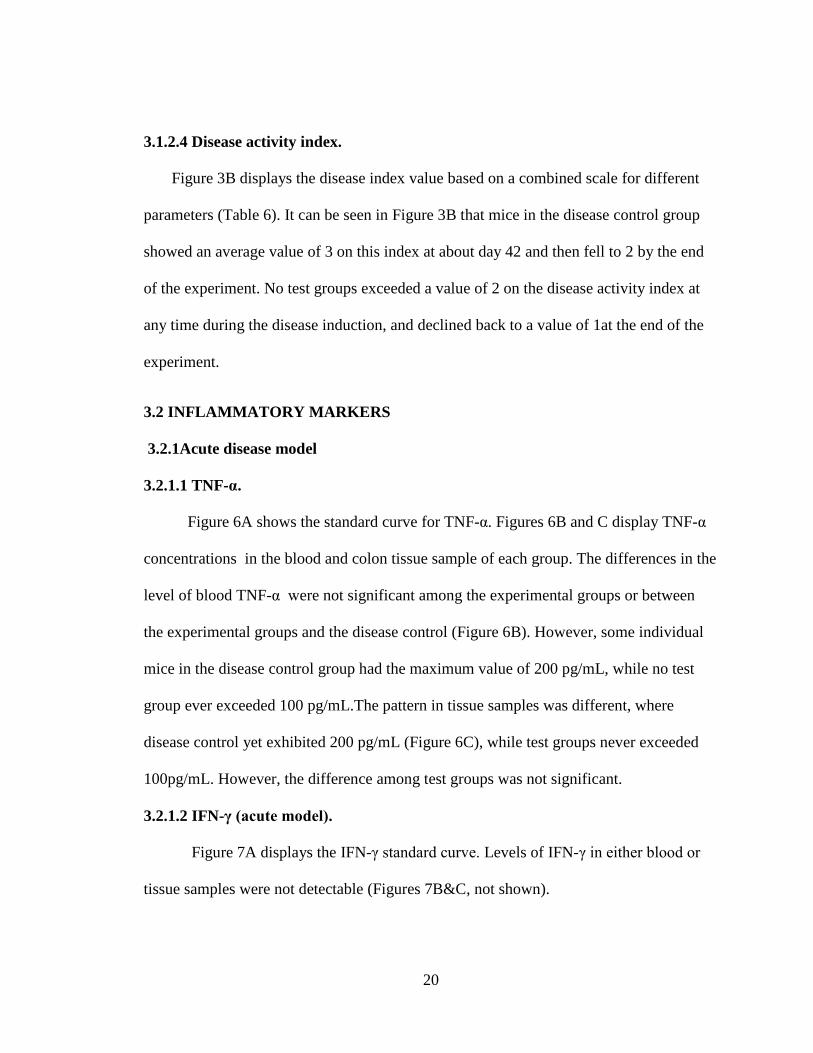
3.1.2.4 Disease activity index.
Figure 3B displays the disease index value based on a combined scale for different
parameters (Table 6). It can be seen in Figure 3B that mice in the disease control group
showed an average value of 3 on this index at about day 42 and then fell to 2 by the end
of the experiment. No test groups exceeded a value of 2 on the disease activity index at
any time during the disease induction, and declined back to a value of 1at the end of the
experiment.
3.2 INFLAMMATORY MARKERS
3.2.1Acute disease model
3.2.1.1 TNF-α.
Figure 6A shows the standard curve for TNF-α. Figures 6B and C display TNF-α
concentrations in the blood and colon tissue sample of each group. The differences in the
level of blood TNF-α were not significant among the experimental groups or between
the experimental groups and the disease control (Figure 6B). However, some individual
mice in the disease control group had the maximum value of 200 pg/mL, while no test
group ever exceeded 100 pg/mL.The pattern in tissue samples was different, where
disease control yet exhibited 200 pg/mL (Figure 6C), while test groups never exceeded
100pg/mL. However, the difference among test groups was not significant.
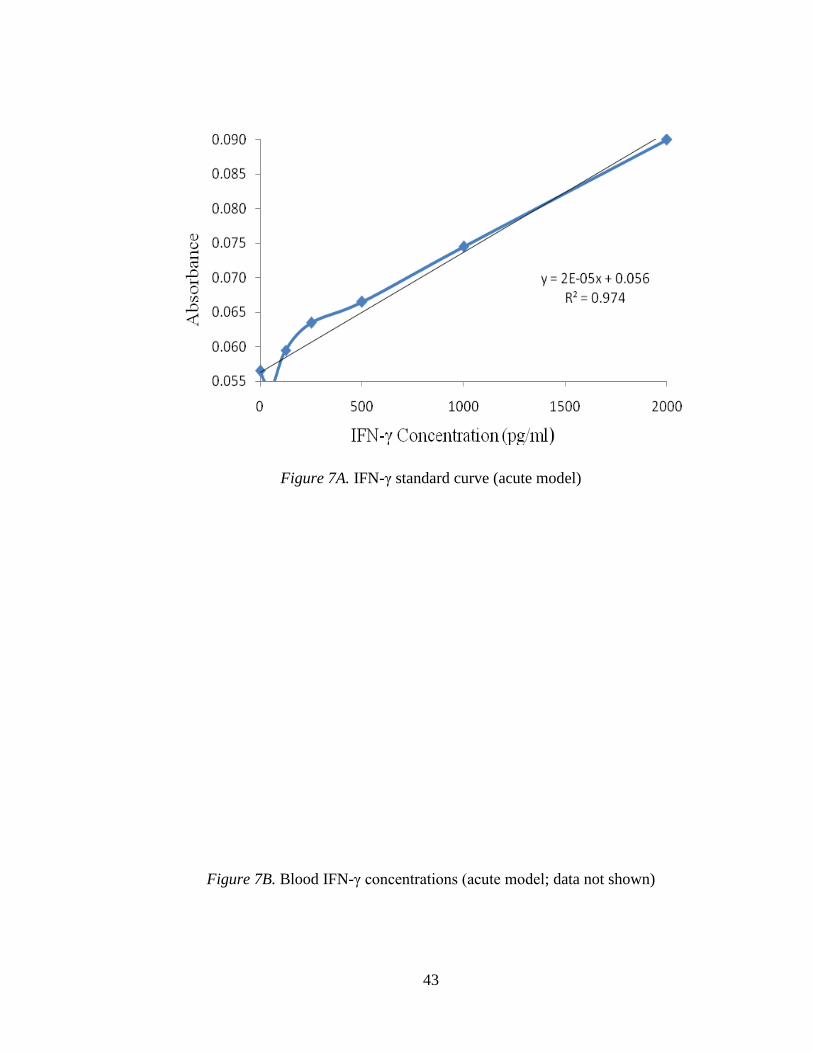
3.2.1.2 IFN-γ (acute model).
Figure 7A displays the IFN-γ standard curve. Levels of IFN-γ in either blood or
tissue samples were not detectable (Figures 7B&C, not shown).

21
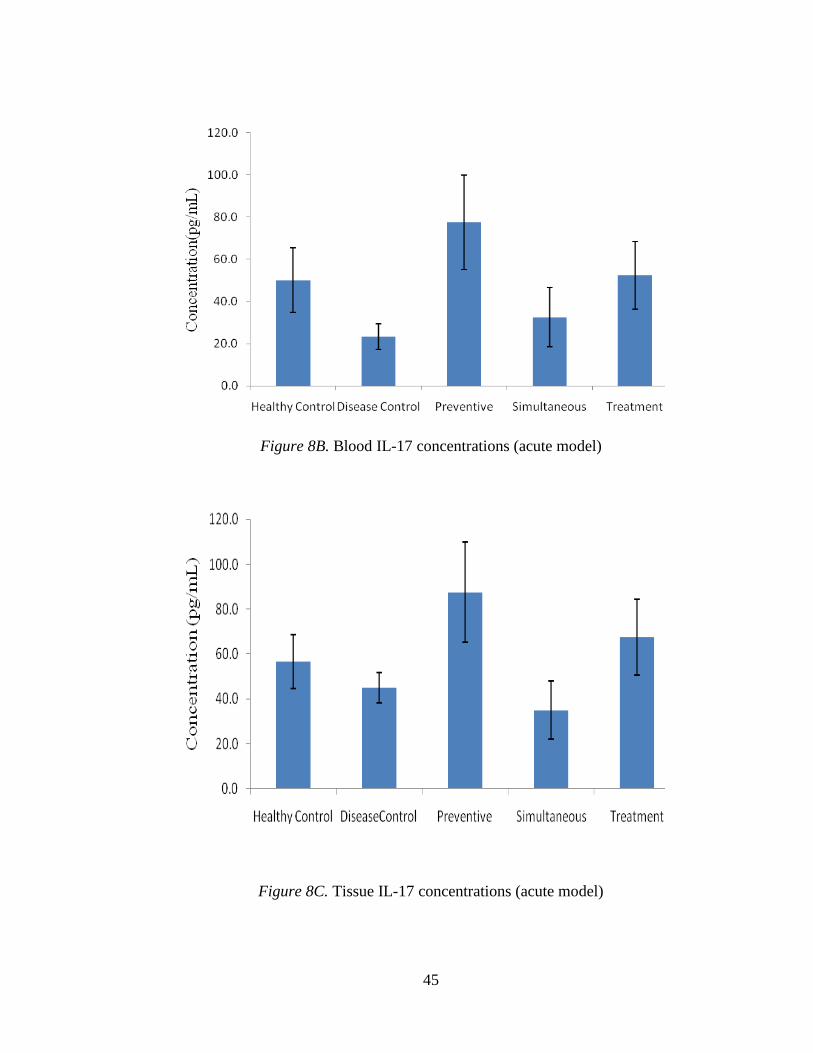
3.2.1.3 IL-17.
Figure 8A, shows the IL-17 standard curve. Figure 8B displays the mean blood
concentrations of IL-17 in different groups. The level of IL-17 was higher in preventive
and treatment groups, identical to healthy control, when compared to the disease control
group. However, no significant difference was found between the disease group and the
simultaneous test group (Figure 8B). Figure 8C shows the levels of IL-17 concentration
in tissue samples. A pattern similar to blood samples was observed in the tissue samples.
Mice in the preventive group showed the higher levels of IL-17, up to 115 pg/mL (see
Fig 8C). Mice in the preventive and test groups show significantly increased levels of IL-
17 compared with all other groups.
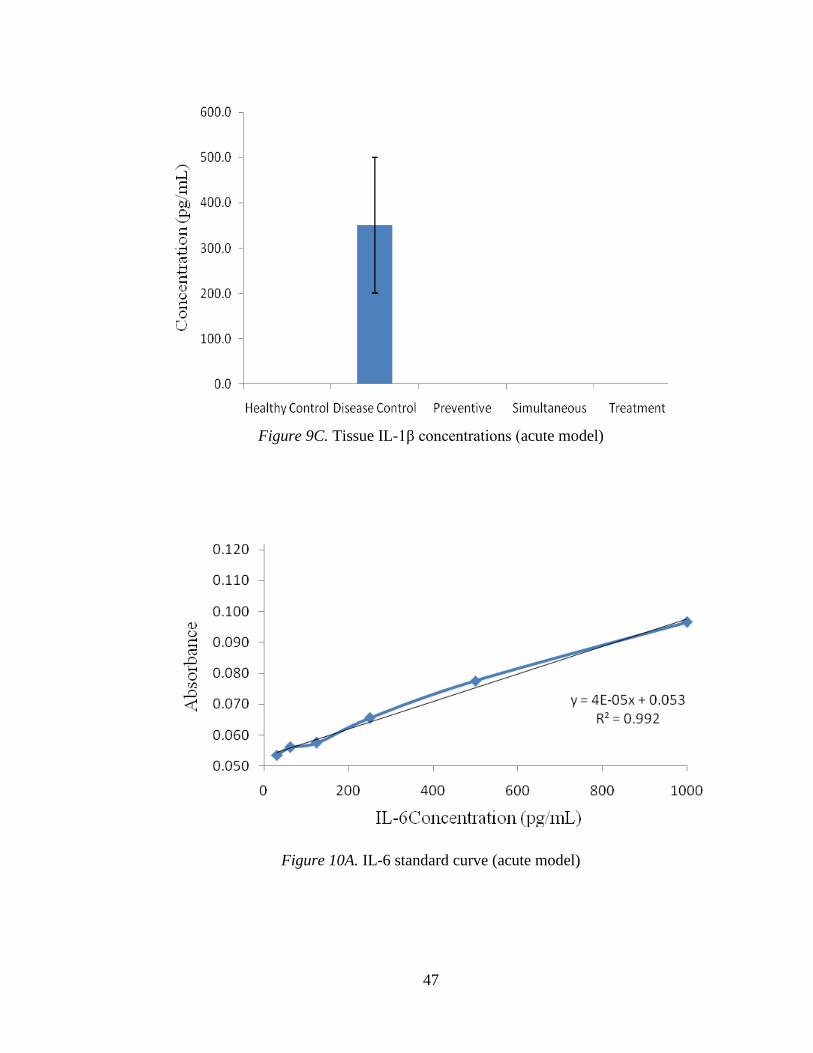
3.2.1.4 IL-1β.
The IL-1β standard curve is shown in Figure 9A. Figure 9B shows the mean
levels of IL-1β in blood samples from each group. No detectable IL-1β was observed in
any test groups or in the healthy control groups, but mice in the disease control shows
IL-1β activity, which varied greatly among the replicates. Figure 9C exhibits the quantity
of IL-1β in tissue samples where DSS control represented a higher activity of 300 pg/mL.
No test group or the healthy control group had any detectable level of this cytokine
(Figure 9C).
3.2.1.5 IL-6.
Figure 10A shows the IL-6 standard curve. Figure 10B indicates the mean levels
of IL- 6 in blood in different groups. It can be seen in this figure that mice in the disease
group had significantly elevated levels of IL-6 compared to mice in water control,

22
preventive, and simultaneous test groups. However, mean levels of IL-6 were not
significantly different between the disease control and the treatment test group. The IL-6
concentration level in colon tissue was not tested due to insufficient tissue samples.
3.2.2 Chronic Model
3.2.2.1 Activated monocytes in circulating blood.
Figure 5 shows the percentages of activated monocytes percentage in different groups. A
maximum percentage (approx. 15%) of activated monocytes was observed in the disease
control, while significantly lower levels (<2 %) were detected in all other groups. All
groups of treated mice (preventive, simultaneous, treatment) had levels of activated
monocytes similar to healthy control mice. Mice in the preventive group, showed the
lowest overall percentage of activated monocytes.
3.2.2.2 TNF-α.
Figure 11A shows the standard curve trend for TNF-α concentration. Figure 11B
indicates the mean blood levels of TNF-α. This cytokine was undetectable in test groups,
preventive and simultaneous, as well as healthy control group. However, the level of
TNF-α was high in the disease control (approximately 50pg/mL) and not significantly
different than in treatment test group. Figure 11C indicates the tissue level of TNF-α in
different mouse groups. Similar to blood levels, the tissue levels of this cytokine were
undetectable in preventive and simultaneous test groups as well as the healthy control.
Mice in the disease control group showed a high level (about 55 pg/mL) of TNF-α.
3.2.2.3 IFN-γ.
Figure 12A shows the IFN-γ standard curve. Figures 12B and C indicate the blood
and tissue levels of IFN-γ, respectively, in different groups. Figure 12B shows

23
significantly lower blood levels of IFN-γ in the preventive test group compared to the
disease control group, levels in the simultaneous and treatment groups being
undetectable. A similar pattern was observed in the tissue level of IFN-γ in different test
groups and control groups (Figure 12C).
3.2.2.4 IL-17.
Figure 13A shows the IL-17 standard curve. Figure 13B indicates the
concentration of IL-17 in blood sample from each group of mice. The level of IL-17 was
higher in test groups and in the healthy control group than in the DSS group. The
preventive group had a maximum level of 140 pg/mL, a level which was significantly
different than that of disease control mice. However, there was no significant difference
in IL-17 levels between other test groups and both controls (Figure 13B). Figure 13C
shows the level of IL-17 concentration in tissue samples. In figure 13C, it can be seen
that preventive and simultaneous test groups had significantly higher levels of IL-17
relative to disease and healthy controls. However, the treatment group was not
significantly different than the control groups.
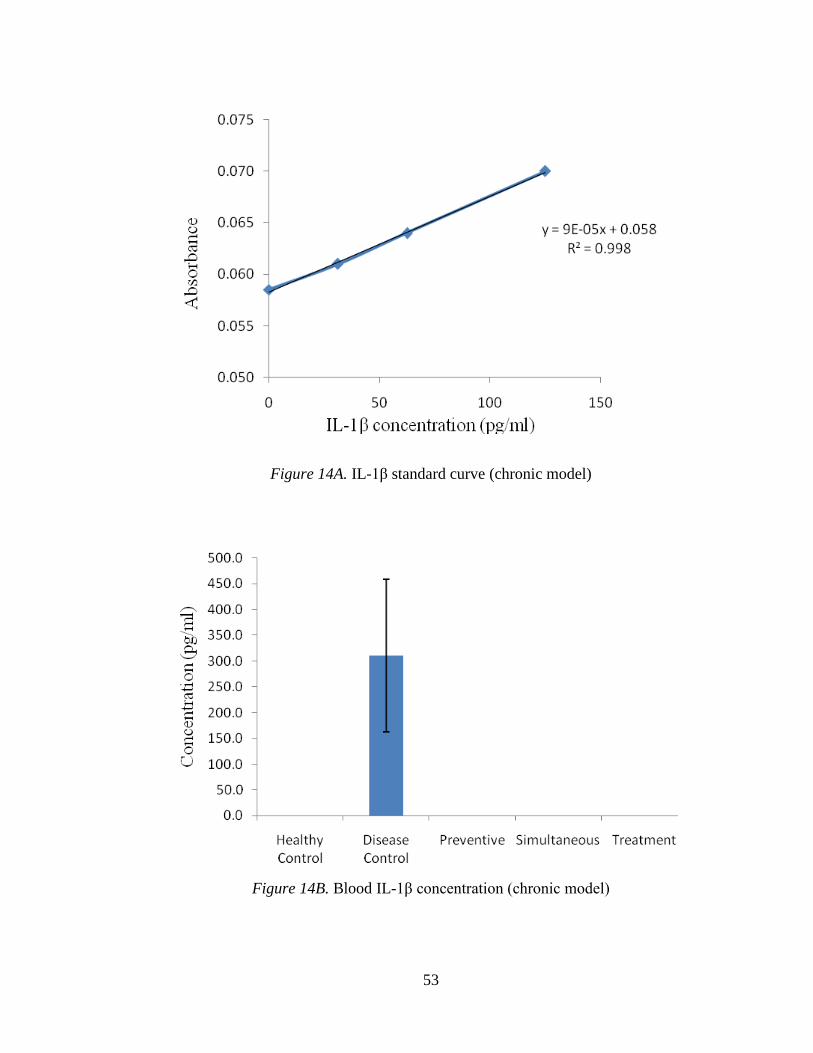
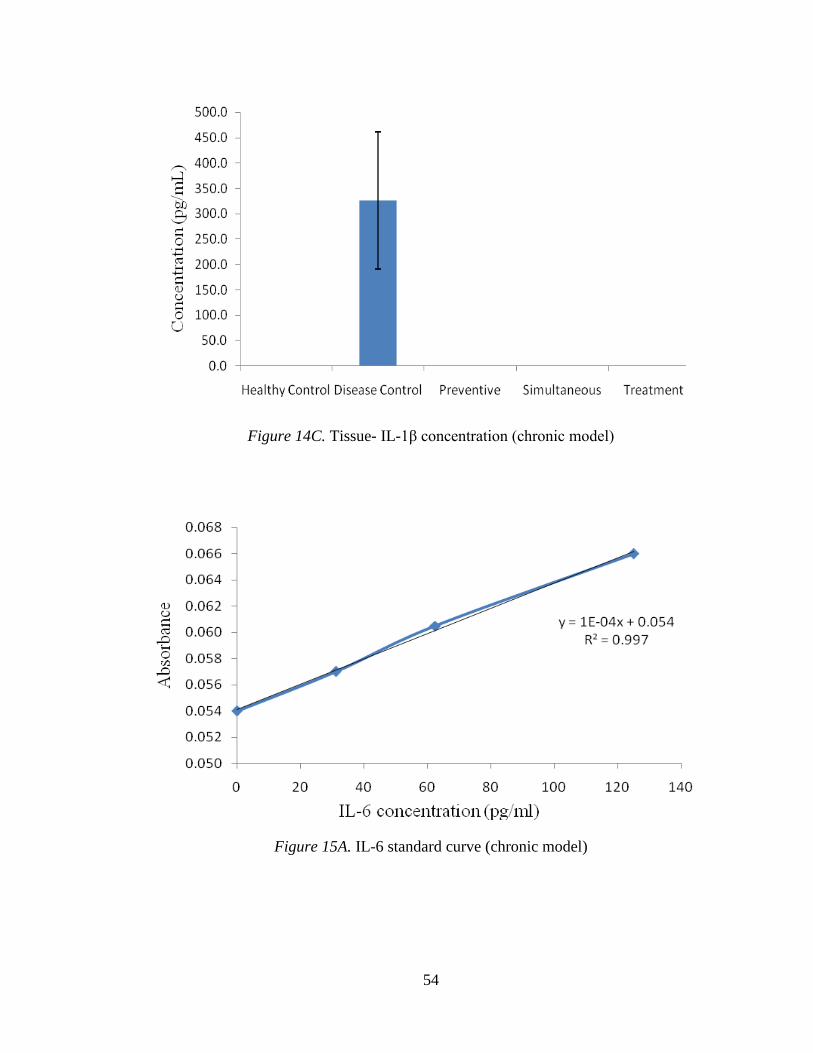
3.2.2.5 IL-1β.
Figure 14A shows the IL-1β standard curve. Figure 14B indicates the levels of IL-
1β in blood samples of different groups, where the levels were not detectable in any
group. A similar pattern can be seen in tissue samples of different groups (Figure 14C).
3.2.2.6 IL-6.
Figure 15A displays the IL-6 standard curve. Figure 15B shows the mean levels
of IL- 6 in blood samples from different groups of mice. Figure 15B indicates that the
disease group had a significantly higher concentration of IL-6 than the healthy control

24
group, preventive and treatment test groups. However, this level was not significantly
different from the simultaneous test group. Figure 15C indicates that the levels of IL-6
(tissue) in the healthy control and test groups were significantly lower than the disease
control group.
3.3 HISTOPATHOLOGY
3.3.1 Acute model.
Figures 16A and B show the colonic H-E sections of healthy control mice at
magnifications of 100x and 400x, respectively. The cellular structures appear intact and
distinct, more conspicuous at a higher magnification. The mucosa, delineated from the
submucosa, appears intact with crypts and goblet cells. Aggregates of darkly stained
monocytes were not present. These sections exhibit some thin cracks due to drying and
sectioning defects.
Figures 17A and B show the colonic H-E sections of mice in the disease control
group at magnifications of 100x and 400x, respectively. These sections exhibit fissures
and destruction of colonic mucosa and intense monocyte aggregation (stained in blue) in
different parts of the tissue. At a higher magnification, the loss of crypts and goblet cells
in the mucosa can be seen (Figure 17B). Figures 18A (100x) and B (400x) show a
simultaneous test group colonic section structure. Both images show intact crypts, less
mucosal damage, some goblet cell formation (the white round structures between the
cells), but dense monocytic aggregation.
Figures 19A (100x) and B (400x) display a treatment test group colonic tissue
structure. Both images indicate less mucosal damage and clear goblet cell formation, with
less monocytic aggregation.

25
3.3.2 Chronic model.
Figures 20 (400x) displays a DSS control group tissue structure for the chronic
model. This image indicates substantial mucosal damage followed by the loss of crypts
and goblet cells, irregular cellular structure and dense aggregation of monocytes.
Figures 21A and B show the preventive test group tissue structure for the chronic
model at magnifications of 100x and 400x, respectively. In both images, the cellular
appearance is distinct and intact, there is some goblet cell formation andonly low levels
of monocyte aggregation are present.
Figures 22A and B show the simultaneous test group tissue structure for the
chronic model at magnifications of 100x and 400x, respectively. In this section, the
histological pattern is similar to that observed in the preventive group of the chronic
disease model. Formation of distinct and intact cellular structures and goblet cells, with
less evidence of monocyte aggregation is visible.

26
Chapter 4: Discussion
In this investigation, DSS-induced disease models (acute and chronic) of ulcerative
colitis were used to examine a putative role for natural coconut oil in disease
amelioration. DSS-induced colitis is one of the most commonly used models that mimic
aspects of human inflammatory bowel diseases (Qualls et al., 2009). The literature
indicates the use of DSS in a range of 1.5- 4% by various researchers (Dey et al., 2010).
Kotakadi et al, (2008) used 1% DSS to induce acute and chronic colitis while Singh et al
(2010) used 3% to induce colitis in mice. In the present investigation, 3% DSS was used
to cause acute colitis, while 2.5% DSS was used to cause chronic colitis. Symptoms of
ulcerative colitis manifested in the onset of diarrhea, fecal occult blood and body weight
loss rapidly in both acute and chronic disease model.
4.1 Acute model
The effect of coconut oil treatment on symptoms such as diarrhea and fecal occult
blood was not pronounced between disease control and test groups. However, mice in the
preventive group displayed significant improvement in these clinical symptoms. The
restoration of colon size, however, was significant in all treatment groups as compare to
disease control group. The loss in body weight could not be regained in any of the test
groups as a result of coconut treatment. DSS-induced colitis has been shown to result in
loss of body weight (Dey et al., 2010; Singh et al., 2010). Therefore, treatment aims at
controlling weight loss in addition to improving other clinical symptoms, but coconut
treatments were not observed to reverse the weight loss. The administration of American
Ginseng and Ginkgo biloba extract resulted in a significant restoration of body weight
(Kotakadi et al., 2008a; b). The disease activity index representing effects of coconut oil

27
in different groups can be seen in (Figure 2B). This figure shows no significant difference
between disease control and test groups. The disease index reflects an average score
based on a combination of disease parameters including body weight change. As there
was no change in the body weight loss between groups, there was a negligible effect of
coconut oil on disease index. Zakaria et al (2011), however, demonstrated an anti-
inflammatory role of virgin coconut oil in an acute carrageenan-induced paw edema in
Sprague-Dawley rats but not in a chronic model of inflammation. The use of dietary
phenethylisothiocyanate was, however, observed to impact the disease index positively in
UC (Dey et al., 2010). Ginkgo biloba was also shown to affect inflammation and
ulceration scores in colitis (Kotakadi et al., 2008). The negligible effect of coconut oil in
the acute colitis in present study may have occurred due to the severe damage caused by
3% DSS and the suboptimal dose (60mg/kg) of coconut oil. It is likely that the lower
dose of DSS used in the cited studies resulted in less severe damage to the colonic
epithelium as compared to the 3% of DSS used in this study. Further, a recent
investigation indicated that the severity of colitis can differ between similar DSS
preparations of the same molecular weight range (Sigeki et al., 2012). This difference in
colitogenic properties may be affected by the total sulfur content of each DSS
preparation. The DSS (MP Biomedicals), used in the present investigation, was reported
to cause the most severe disease and weight loss (Sigeki et al., 2012).
Several mechanisms for DSS-induced colitis have been proposed in the literature.
The rapidity of the acute model suggests that adaptive immunity is not pivotal to the
development of lesions or crypt erosion in the colonic mucosa (Sigeki et al., 2012).
Furthermore, no precise inflammatory mechanisms have been identified which contribute

28
to the genesis of acute lesions. Similar DSS-induced lesions were also observed in the
case of severe combined immuno-deficient mice, thus ruling out any involvement of B or
T cells in the pathology (Sigeki et al., 2012). The resultant colonic inflammation is
predominantly driven by innate cell types.
The cytokine responses characterizing inflammatory colitis are the key physiologic
aliments that govern the initiation, evolution, and ultimately, the resolution of such
inflammatory conditions (Strober and Fuss, 2011). Therefore, this study also included
measurements of pro-inflammatory cytokines (TNF-α, IFN-γ, IL-17, IL-1β, and IL-6) in
blood and colon tissue samples. Various studies have demonstrated the increased
activities of TNF-α, IFN-γ, IL-17, IL-1β, and IL-6 in blood and colon tissue samples
(Dey et al., 2010; Singh et al., 2010) of mice suffering from an inflammatory colitis. In
the present study the level of TNF-α in test groups was not different than that of the
disease control group when measured in blood samples. The pattern in tissue samples did
differ in that, test groups had significantly lower concentrations of TNF-α relative to the
disease control group. While IL-1β was not detectable in any blood samples, its level was
high in the tissue samples of mice in disease control group. Test groups, however, had
undetectable tissue levels of this cytokine. Dey et al. (2010) reported the attenuation of
IL-1β production in the colons of PEO- treated animals. Blood and tissue levels of IL-17
was higher in some test groups–preventive and treatment–identical to healthy control and
when compared to disease control. When IL-6 was measured in blood samples, the levels
were different in disease control and some test groups, preventive and simultaneous
groups with a significantly lower level. Singh et al (2010) demonstrated the role of
resveratrol in the amelioration of inflammation in diseased mice by the reduced activities

29
of pro-inflammatory cytokines. A partial histological restoration of damaged colonic
tissues was observed in some groups of mice treated with coconut oil. Colon mucosa of
treated mice had lower disruptions than in disease control group; however, not
comparable to healthy control group. The differential activities of pro- inflammatory
cytokines may have caused a partial attenuation of clinical symptoms as well as colon
histology in coconut treated mice in this study. However, preventive role of dietary
medium chain triglycerides was recently demonstrated in an acute model of TNBS-
induced colitis in rats (Kono et al, 2003 and 2010).
4.2 Chronic model
In the current study coconut oil treatment resulted in a significant suppression of
clinical symptoms of ulcerative colitis in this disease model. In addition to improvements
in diarrhea and fecal occult blood, body weight was also significantly improved in the
preventive test group. In this group of coconut oil treated mice weight loss was not only
regained but weight increased gradually over the entire period of the experiment with a
final gain of >20% (over the initial weight) at the end of the experiment. Weight gain in
this group even surpasses the weight gain in the vehicle control group (Figure 3A).
However, body weight change was not significantly different in other groups of treated
mice relative to the disease control group. The effect on the isolated colon size in test
groups was also pronounced under the coconut oil treatment. The overall effect of
coconut oil treatment on the above clinical symptoms was reflected in disease activity
index (Figure 3B). From the disease activity index it can be seen that the value always
remained significantly lower in treatment groups than in disease control group. The
coconut oil treatment effects observed in this study compare well with the amelioration
30
caused by resveratrol and phenethylisothiocyanate in previous studies (Singh et al 2010
& Dey et al, 2010). The activity of proinflammatory cytokines in the mice in chronic
model exhibited a different pattern (Figures 11A-15C) than in the acute model. Levels of
TNF-α and IFN-γ were significantly decreased in mice in treatment groups compared to
mice in the disease control group. Treated mice and healthy control mice had
undetectable levels of TNF-α. The dramatic decrease in TNF-α concentration in treatment
groups suggests a positive effect of coconut oil intervention in this model. A significant
reduction in the activity of TNF-α was demonstrated in TNBS- induced colitis in rats
following a diet enriched with medium chain triglycerides (Kono et al, 2010). TNF-α
plays a key role in colitis (Luo et al 2010 & Dey et al, 2010). Coconut oil treatment
caused a similar reduction in the blood and tissue levels of IL-6 in treated mice.
Proinflammatory cytokines such as TNF-α, IFN-γ, IL-6, IL-1β are generally over
produced during inflammatory bowel disease. Blocking IL-1 and TNF-α has been highly
successful in patients with rheumatoid arthritis, inflammatory bowel disease, graft-vs.-
host disease (Strober & Fuss, 2011). The activity of IL-17 exhibited an interesting pattern
where mice receiving treatment, particularly preventive group, had an elevated level
relative to disease control, comparable to healthy control. Particularly tissue levels of IL-
17 were significantly greater in preventive and simultaneous groups as compared to the
levels in healthy control. The role of IL-17 in colitis is yet unclear and conflicting results
have been reported (Monteleon et al, 2009; Strober & Fuss, 2011). It has been shown that
IL-17F deficiency results in reduced colitis, indicating that IL-17F has a pathogenic role
in colitis. IL-17A null- mice develop more severe disease, suggesting a protective role. It

31
appears that TH-17 lymphocytes secret IL-17 F or IL-17 A/ IL-17 based on the mucosal
internal milieu (Monteleone et al, 2009).
It was recently shown that the genotoxic damage in colitis extends beyond the site
of inflammation to circulating leukocytes and erythroblasts in the bone marrow,
manifesting a systemic effect (Westbrook et al, 2009). Therefore, circulating monocytes
were phenotyped as classic (CD14+/CD16-) or inflammatory (CD14+/CD16+)
monocytes using flow cytometry in this study (Figure 5). The percentage of circulating
inflammatory monocytes in DSS-disease control mice was significantly different from
the levels of inflammatory monocytes in the treatment groups and in the vehicle control
group (Figure 5). The percentage of inflammatory monocytes was significantly less (7-
fold) in treatment groups, as compared to the disease control group. Activated monocyte
percentage in treated mice was not significantly different than healthy controls. In the
preventive group, the percentage of activated monocytes was even lower than in healthy
controls (Figure 5). Inflammatory monocytes are rapidly recruited to sites of
inflammation, but their excessive and/or prolonged recruitment hinders the resolution of
inflammation and is a hallmark of numerous diseases including ulcerative colitis (Shi and
Pamer, 2011). It is possible that coconut oil interferes with monocyte recruitment
reducing total counts during the treatment period, resulting in a significant reduction in
the disease index in this model. Monocytes play a pivotal role in the inflammatory
cascade and are a major source of both pro- and anti-inflammatory cytokines. They are
intimately involved in tissue damage and repair and an imbalance of these processes may
have detrimental consequences, as in ulcerative colitis (Shi & Pamer, 2011).

32
Random histological samples of the colorectal region were compared between
disease control and treatment groups. Coconut oil treatment resulted in restoration of
crypts, goblet cells and sub-mucosa. Colon samples from treated mice also exhibited less
monocyte aggregation. These effects correlate with an improvement in the size of the
colon in treated mice. The changes in colitis histopathology under the influence of
coconut oil are consistent with the results of resveratrol and phenethylisothiocyanate
treatments. Similar improvements were reported in rats suffering from TNBS- induced
colitis on supplementation of dietary medium chain triglycerides (Kono et al, 2010).

33
Chapter 5: Conclusion
Results of the present study clearly indicate the positive impact of coconut oil in
the physiology and pathogenesis of ulcerative colitis. The suppression of clinical
symptoms, inflammation, and colon histology restoration under the effect of coconut oil
treatments was more pronounced in mice suffering from chronic ulcerative colitis. This
study strongly suggests that coconut oil has a disease preventive role in the chronic
disease model. Body weight gain and the observed attenuation in pro- inflammatory
cytokine levels reinforce the preventive role of the coconut oil. However, an elaborate
study involving a large number of animal replicates is required for the confirmation of
these effects.
34
FIGURES
Acute Model
Figure 1A. Fecal occult blood (acute model)
Figure 1B. Liquid consumption (acute model)

35
Figure 1C. Length of isolated colon (acute model)
Figure 2A. Percent change in body weight of mice (acute model)

36
Figure 2B. Disease activity index (acute model)
Figure 3A. Percent change in body weight of mice (chronic model)

37
Figure 3B. Disease activity index (chronic model)
Figure 3C. Fecal occult blood (chronic model)

38
Figure 3D. Length of isolated colon (chronic model)
Figure 4A. Colon isolated from healthy control group (chronic model)

39
Figure 4B. Colon isolated from Disease control group (chronic model)
Figure 4C. Colon isolated from preventive group (chronic model)

40
Figure 4D. Colon isolated from simultaneous group (chronic model)
Figure 4E. Colon isolated from treatment group (chronic model)

41
Figure 5. Blood flow cytometry (chronic model)
Figure 6A. TNF-α standard curve (acute model)

42
Figure 6B. Blood TNF-α concentrations (acute model)
Figure 6C. Tissue TNF-α concentrations (acute model)
43
Figure 7A. IFN-γ standard curve (acute model)
Figure 7B. Blood IFN-γ concentrations (acute model; data not shown)

44
Figure 7C. Tissue IFN-γ concentrations (acute model; data not shown)
Figure 8A. IL-17 standard curve (acute model)
45
Figure 8B. Blood IL-17 concentrations (acute model)
Figure 8C. Tissue IL-17 concentrations (acute model)

46
Figure 9A. IL-1β standard curve (acute model)
Figure 9B. Blood IL-1β concentrations (acute model)
47
Figure 9C. Tissue IL-1β concentrations (acute model)
Figure 10A. IL-6 standard curve (acute model)

48
Figure 10B. Blood- IL6 concentrations (acute model)
Figure 11A. TNF-α standard curve (chronic model)

49
Figure 11B. Blood TNF-α concentration (chronic model)
Figure 11C. Tissue TNF-α concentration (chronic model)

50
Figure 12A. IFN-γ standard curve (chronic model)
Figure 12B. Blood IFN-γ concentration (chronic model)

51
Figure 12C. Tissue IFN-γ concentration (chronic model)
Figure 13A. IL-17 standard curve (chronic model)

52
Figure 13B. Blood IL-17 concentration (chronic model)
Figure 13C. Tissue IL-17 concentration (chronic model)
53
Figure 14A. IL-1β standard curve (chronic model)
Figure 14B. Blood IL-1β concentration (chronic model)
54
Figure 14C. Tissue- IL-1β concentration (chronic model)
Figure 15A. IL-6 standard curve (chronic model)

55
Figure 15B. Blood IL-6 concentration (chronic model)
Figure 15C. Tissue IL-6 concentration (chronic model)

56
Figure 16A. Healthy control, acute and chronic model (100x)
Figure 16B. Healthy control, acute and chronic model (400x)

57
Figure 17A. Disease control, acute model (100x)
Figure 17B. Disease control, acute model (400x)

58
Figure 18A. Simultaneous group, acute model (100x)
Figure 18B. Simultaneous group, acute model (400x)

59
Figure 19A. Treatment group, acute model (100x)
Figure 19B. Treatment group, acute model (400x)

60
Figure 20. Disease control, chronic model (400x)
Figure 21A. Preventive group, chronic model (100x)

61
Figure 21B. Preventive group, chronic model (400x)
Figure 22A. Simultaneous group, chronic model (100x)

62
Figure 22B. Simultaneous group, chronic model (400x)

63
Tables
Table 1.
Experimental and Control Groups
Experimental group Abbreviated notation
Vehicle control Healthy control
Disease control DSS control
Coco food at 60 mg/kg body weight Test group (preventive)
Coco food at 60 mg/kg body weight Test group (simultaneous)
Coco food at 60 mg/kg body weight Test group (treatment)
Table 2.
Acute Model General Timetable
Days DSS and Coco Administration
0 1st dose of DSS
2 2nd
dose of DSS
4 3rd
dose of DSS
6 (DSS remove) Coco treatment
14 Termination day
Table 3.
Chronic Model General Timetable
Days DSS and Coco Administration
0–2 DSS (given to all groups)

64
3–8 Water (given to all groups)
9–11 DSS (given to all groups)
12–17 Water (given to all groups)
18–20 DSS (given to all groups)
21–26 Water (given to all groups)
27–29 DSS (given to all groups)
30–35 Water (given to all groups)
36–60
Coco food given to test groups/normal chow given to DSS and water
control group
Day 60 Termination day
Table 4.
Dehydration Protocol for Isolated Colon Tissue
1 Fix in 10 volumes of fixative: 18–24 hours
2 Rinse 3 times in 50% ethanol
3 Transfer to 50% ethanol for 1 hour
4 Transfer to 70% ethanol for 1 hour
5 Transfer to 95% ethanol for 1 hour
6 Transfer to 100% ethanol for 1 hour
7 Transfer to xylene for 45 minutes
8 Transfer to xylene plus dissolved paraffinwax for 45
minutes

65
9 Transfer to melted paraffin plus ethanol
for 45 minutes
10 Transfer to melted paraffin for 45 minutes
11 Embed in wax block (allow to cool)
Table 5.
Hematoxylin and Eosin Staining Protocol for Microtome Sections
Station Solution Time
1 Xylene 3 minutes
2 Xylene 3 minutes
3 Xylene 3 minutes
4 100% ethanol 1 minute
5 100% ethanol 1 minute
6 100% ethanol 1 minute
7 95% ethanol 1 minute
8 Running tap water rinse Briefly
9 Deionized water Rinse
10 Hematoxylin 2.5 minutes
11 Running tap water rinse Rinse off excess stain
12 Acid alcohol 20 seconds to 1 minute
13 Running tap water rinse Agitate 30 seconds
14 Bluing reagent 1 minute

66
15 Running tap water rinse 1 minute
16 95% ethanol Rinse
17 Eosin-Y 1.5 minutes
18 100% ethanol 1 minute
19 100% ethanol 1 minute
20 100% ethanol 1 minute
21 Xylene 1 minute
22 Xylene 1 minute
23 Xylene 1 minute
Table 6.
Scale for Disease Activity Index
% Change in
Body Weight
Colorectal
Length
Fecal Occult
Blood
Stool
Consistency
Disease
Activity
Index (DAI)
≥0-5% gain ≥10cm Negative Normal; 0 0
≥ 0-5% loss ≥9.3cm Mild; +ve 1 1
≥5-10% loss
≥9.1cm
Moderate;
++ve 2 2
≥10-15% loss
≥9cm
Prolapse;
+++ve 3 3

67
Appendix
Enzyme-linked immuno sorbent assay (ELISA) Protocol.
TNF-α.
1) PBS (Phosphate Buffer Saline): 137 mM NaCl, 2.7 mM KCl, 8.1 mM Na2HPO4,
1.5 mM KH2PO4, pH 7.2-7.4, 0.2 μm filtered. Add 9.6 g of PBS in 1 L of Type I
purified water.
2) Wash Buffer: 0.05% Tween 20 in PBS, pH 7.2-7.4. Add 0.5 mL Tween 20 in 1 L
of PBS.
3) Reagent Diluent: 1% BSA (bovine serum albumin) in PBS, pH 7.2-7.4, 0.2 μm
filtered. Add 10 g BSA in 1 L of PBS.
4) Substrate Solution: 1:1 mixture of Color Reagent A (H2O2) and Color Reagent B
(Tetramethylbenzidine).
5) Stop Solution: 2 N H2SO4
6) Capture Antibody: 144 μg/mL of goat anti-mouse TNF-α was reconstituted with
1.0 mL of PBS.
7) Detection Antibody: 36 μg/mL of biotinylated goat anti-mouse TNF-α was
reconstituted with 1.0 mL of reagent diluent.
8) Standard: 280 ng/mL of recombinant mouse TNF-α was reconstituted with 0.5
mL of reagent diluent. A seven-point standard curve using two-fold serial
dilutions in reagent diluent and a high standard of 2,000 pg/mL was used.
9) Streptavidin-HRP: 1.0 mL of streptavidin conjugated to horseradish-peroxidase.
Diluted to the working concentration specified on the vial label using reagent
diluent (1:1 mixture).

68
Plate preparation protocol:
1) The capture antibody was diluted to the working concentration in PBS without
carrier protein. A 96-well microplate was immediately coated with 100 μL per
well of the diluted capture antibody. The plate was sealed with paraffin film and
incubated overnight at room temperature.
a. Calculations for diluting the capture antibody to a working concentration
of 0.8 μg/mL in PBS, without carrier protein:
LV
mLmL
gV
mL
g
11.11
0.28.0144
1
1
11.11 μL of TNF-α capture antibody were diluted in 2.0
mL of PBS.
2) Each well was aspirated and washed with wash buffer, repeating the process two
times for a total of three washes. Each well was washed by filling each well with
wash buffer (400 μL) using a squirt bottle. Complete removal of liquid at each
step was essential for good performance. After the last wash, any remaining wash
buffer was removed by aspirating or by inverting the plate and blotting it against
clean paper towels.
3) Plates were blocked by adding 300 μL of reagent diluent to each well. Plates were
incubated at room temperature for a minimum of 1 hour.
4) The aspiration/wash was repeated as in step 2. The plates were then ready for
sample addition.
Assay Procedure:

69
1) 100 μL of sample or standard was added in reagent diluent, or another appropriate
diluents, to each well. The microplate was covered with an adhesive strip and
incubated for two hours at room temperature.
a. 1.429 μL of standard TNF-α was diluted in 200 μL reagent diluent.
b. The serial dilution was performed for the construction of the seven-point
standard curve.
c. Serum samples were diluted in a 1:1 ratio with reagent diluent. For
example, 100 μL of a serum sample was diluted in 100 μL of reagent
diluent for a total volume of 200 μL to be divided into two wells with 100
μL of diluted sample per well.
2) The aspiration/wash was repeated as in step 2 of plate preparation.
3) 100 μL of the detection antibody, diluted in reagent diluent, was added to each
well. The microplate was covered with a new adhesive strip and incubated for two
hours at room temperature.
a. 11.11 μL of detection antibody were diluted in 2.0 mL reagent diluent.
4) The aspiration/wash was repeated as in step 2 of plate preparation.
5) 100 μL of the working dilution of Streptavidin-HRP was added to each well. The
microplate was covered and incubated for 20 minutes at room temperature. The
microplate was kept out of direct light.
a. The Streptavidin-HRP was diluted in a 1:1 ratio.
6) The aspiration/wash was repeated as in step 2.

70
7) 100 μL of substrate solution was added to each well. The microplate was
incubated for 20 minutes at room temperature. The microplate was kept out of
direct light.
8) 50 μL of stop solution was added to each well. The plate was gently tapped to
ensure thorough mixing.
9) The optical density of each well was determined immediately, using a microplate
reader (Synergy H1 Hybrid Multi-Mode Microplate Reader from BioTek U.S.,
Winooski, VT) set to 540 nm.
IL-17.
1) Reagent diluent: 1% BSA in PBS, pH 7.2-7.4, 0.2 μm filtered. Added 10 g BSA
in 1 L PBS.
2) Capture antibody: 360 μg/mL of rat anti-mouse IL-17 was reconstituted with 1.0
mL of PBS.
3) Detection antibody: 144 μg/mL of biotinylated goat anti-mouse IL-17 was
reconstituted with 1.0 mL of reagent diluent.
4) Standard: 160 ng/mL of recombinant mouse IL-17 when reconstituted with 0.5
mL of reagent diluent. The standard was allowed to sit for a minimum of 15
minutes with gentle agitation prior to making dilutions. A seven-point standard
curve using two-fold serial dilutions in reagent diluent, with a high standard of the
recommended 1,000 pg/mL.
5) Streptavidin-HRP: 1.0 mL of streptavidin conjugated to horseradish-peroxidase.
6) Plate preparation methods were followed as outlined above.
Assay Procedure:

71
1) 2.5 μL of standard IL-17 were diluted in 400 μL reagent diluent. The serial
dilution was performed for the construction of the seven-point standard curve.
2) Assay procedure was conducted as outlined above.
IL-6.
1) Reagent diluent: 1% BSA in PBS, pH 7.2-7.4, 0.2 μm filtered. Added 10 g BSA
in 1 L PBS.
2) Capture antibody: 360 μg/mL of rat anti-mouse IL-6 was reconstituted with 1.0
mL of PBS.
3) Detection antibody: 144 μg/mL of biotinylated goat anti-mouse IL-6 was
reconstituted with 1.0 mL of reagent diluent.
4) Standard: 160 ng/mL of recombinant mouse IL-6 when reconstituted with 0.5 mL
of reagent diluent. The standard was allowed to rest for a minimum of 15 minutes
and gently agitated prior to making dilutions. A seven-point standard curve using
two-fold serial dilutions in reagent diluent, with the recommended high standard
of 1,000 pg/mL.
5) Streptavidin-HRP: 1.0 mL of streptavidin conjugated to horseradish-peroxidase.
6) Plate preparation methods were followed as outlined above.
Assay Procedure:
1) 1) 2.5 μL of standard IL-6 were diluted in 400 μL reagent diluent. The serial
dilution was performed for the construction of the seven-point standard curve.
2) 2) The assay procedure was followed as outlined above.

72
IFN-γ.
The PBS and wash buffer were prepared as outlined above, using the
TNF-α kit.
1) Block Buffer: 1% BSA in PBS with 0.05% NaN3.
a. 1% BSA: 5 grams of BSA were added in 500 mL PBS
b. 0.05% NaN3: 0.25 grams of NaN3 were added in 500 mL PBS
c. 1% BSA solution was mixed with the 0.05% NaN3 solution.
2) Reagent diluent: 0.1% BSA in PBS, 0.05% Tween 20 in Tris-buffered Saline (20
mM Trizma Base, 150 mM NaCl), pH 7.2-7.4, 0.2 μm filtered.
a. Made Tris-buffered saline:
i. 1.2114 grams Tris Buffer was added in 500 mL Type I purified
water
ii. 4.383225 grams NaCl was added in 500 mL Type I purified water
iii. The Tris Buffer solution was mixed with the NaCl solution
b. Made reagent diluent:
i. 0.5 grams of BSA and 0.25 mL of 0.05% Tween 20 were added
into the Tris-buffered saline solution.
3) Substrate solution and stop solution were added as outlined above.
4) Capture Antibody: 720 μg/mL of rat anti-mouse IFN-γ was reconstituted with 1.0
mL of PBS.
5) Detection Antibody: 18 μg/mL of biotinylated goat anti-mouse IFN-γ when
reconstituted with 1.0 mL of reagent diluent.

73
6) Standard: 205 ng/mL of recombinant mouse IFN-γ when reconstituted with 0.5
mL of reagent diluent. The standard was allowed to rest for a minimum of 15
minutes and gently agitated prior to making dilutions. A seven-point standard
curve using two-fold serial dilutions in reagent diluent and a high standard of
2,000 pg/mL was plotted.
7) Streptavidin-HRP: 1.0 mL of streptavidin conjugated to horseradish-peroxidase.
8) Plate preparation : Capture antibody was prepared as outlined above. 11.11 μL of
IFN-γ capture antibody was diluted in 2.0 mL of PBS and plate preparation
methods were followed as outlined above.
Assay Procedure:
1) 100 μL of sample or standards in reagent diluent, or other appropriate diluent,
were added to each well. Each microplate was covered with an adhesive strip and
incubated two hours at room temperature. 1.95 μL of standard IFN-γ was diluted
in 200 μL reagent diluent. 11.11 μL of detection antibody was diluted in 2.0 mL
reagent diluent.
2) The assay procedure was followed as outlined above
IL-1β.
The PBS and wash buffer were prepared as outlined above, using the
TNF-α kit.
1) Block Buffer: 1% BSA in PBS with 0.05% NaN3.
a. 1% BSA: 5 grams of BSA were added in 500 mL PBS
b. 0.05% NaN3: 0.25 grams of NaN3 were added in 500 mL PBS
c. 1% BSA solution was mixed with the 0.05% NaN3 solution.

74
2) Reagent diluent: 0.1% BSA in PBS, 0.05% Tween 20 in Tris-buffered Saline (20
mM Trizma Base, 150 mM NaCl), pH 7.2-7.4, 0.2 μm filtered.
a. Made Tris-buffered saline:
i. 1.2114 grams Tris Buffer was added in 500 mL Type I purified
H20
ii. 4.383225 grams NaCl was added in 500 mL Type I purified H2O
iii. The Tris Buffer solution was mixed with the NaCl solution
b. Made reagent diluent:
i. 0.5 grams of BSA and 0.25 mL of 0.05% Tween 20 were added
into the Tris-buffered saline solution.
3) Substrate solution and stop solution were added as outlined above.
4) Capture Antibody: 720 μg/mL of rat anti-mouse IL-1β was reconstituted with 1.0
mL of PBS.
5) Detection Antibody: 18 μg/mL of biotinylated goat anti-mouse IL-1β when
reconstituted with 1.0 mL of reagent diluent.
6) Standard: 205 ng/mL of recombinant mouse IL-1β when reconstituted with 0.5
mL of reagent diluent. The standard was allowed to rest for a minimum of 15
minutes and gently agitated prior to making dilutions. A seven-point standard
curve using two-fold serial dilutions in reagent diluent and a high standard of
2,000 pg/mL was plotted.
7) Streptavidin-HRP: 1.0 mL of streptavidin conjugated to horseradish-peroxidase.

75
8) Plate preparation: Capture antibody was prepared as outlined above. 11.11 μL of
IL-1β capture antibody was diluted in 2.0 mL of PBS and plate preparation
methods were followed as outlined above.
Assay Procedure:
1) 100 μL of sample or standards in reagent diluent, or an appropriate diluents, were
added to each well. Each microplate was covered with an adhesive strip and
incubated two hours at room temperature. 1.95 μL of standard IL-1β was diluted
in 200 μL reagent diluent. 11.11 μL of detection antibody was diluted in 2.0 mL
reagent diluent.
2) The assay procedure was followed as outlined above.

76
LITERATURE CITED
Aharoni R., Kayhan B., Brenner O., Domev H., Labunskay G., Arnon R. (2006).
Immunomodulatory therapeutic effect of glatiramer acetate on several murine
models of inflammatory bowel disease. J Pharmacol Exp Ther, 318, 68–78.
Assuncao, M.L., Ferreira, H.S., Santos A.F., Cabral C.R., Florencio T.T. (2009). Effect
of dietary coconut oil on the biochemical and anthropometric profiles of women
presenting abdominal obesity. Lipids. 44(7), 593-601.
Babayan V.K. (1988). Medium chain triglycerides in dietary fat requirements in health
and development. (CJ Beare-Rogers, ed. Pp. 73-86), Champaign, IL: AOCS press,
73–86.
Beagley K.W., Eldridge J.H., Lee F. et al. (1989). Interleukins and IgA synthesis:
Human and murine interleukin 6 induce high rate IgA secretion in IgA-commited
B cells. J Exp Med, 169, 2133–48.
Banks C., Bateman A., Payne R., Johnson P., Sheron N. (2003). Chemokine expression
in IBD. Mucosal chemokine expression is unselectively increased in both
ulcerative colitis and Crohn’s disease. The Journal of Pathology, 199, 28–35.
Cohen L. A., Thompson D. O., Maeura Choi K., Blank M. E., Rose D. P. (1986). Dietary
fat and mammary cancer. 1. Promoting effects of different dietary fats on N-
nitrosomethylurea-induced rat mammary tumorigenesis. Natl. Cancer Inst., 77
(1), 33–42.
Chandel N.S., Trzyna W.C., McClintock D.S., Schumacker P.T. (2000). Role of oxidants
in NF-κB activation and TNF-α gene transcription induced by hypoxia and
endotoxin. J Immunol, 165, 1013–1021.
Chun K.S., Cha H.H., Shin J.W., Na H.K., Park K.K., Chung W.Y. et al. (2004). Nitric

77
oxide induces expression of cyclooxygenase-2 in mouse skin through activation
of NF-κB. Carcinogenesis, 25, 445–454.
Changtai X., Shanqu L., Borong P. (2009). Current drug therapy in ulcerative colitis.
Journal of Chinese Clinical Medicine,, 4, 410–411.
Crohn's & Colitis Foundation of America: About Crohn's Disease. (2013). Retrieved
January 4, 2013 from http://www.ccfa.org/info/about/crohns
Dionne S., Ruemmele F.M., Laberge S., and Seidman E.G. (2000). The effect of
inflammation severity and of treatment on the production and release of TNFα by
colonic explants in inflammatory bowel disease. Aliment Pharmacol Ther, 14,
1435–1442.
Dey M., Kuhn P., Ribnicky D., Premkumar V., Reuhl K., Raskin I.( 2010). Dietary
phenethylisothiocyanate attenuates bowel inflammation in mice. BMC Chemical
Biology, 10, 4.
Ekbom A. (1998). Risk of cancer in ulcerative colitis. J Gastrointest Surg, 2,312-313.
Fiocchi C. (1998). Inflammatory bowel disease: etiology and pathogenesis.
Gastroenterology, 115.182–205.
Fife, Bruce. (2000). The Healing Miracles of Coconut Oil, CO., (pp. 1–46) Colorado
Springs: Piccadilly Books Ltd.
Fauci A. S., Kasper D. L., Longo D. L., Braunwald E., Hauser S. L., Jameson J. L. and J.
Loscalzo (2008). Harrison’s Internal Medicine (17th
ed.). New York: McGraw-
Hill Medical.
Fisher AH., Jacobson KA., Rose J., Zeller R. (2008). Hematoxylin and eosin staining of
tissue and cell sections. CSH Protoc., doi: 10.1101/pdb.prot4986
78
Greten F.R., Eckmann G.L., Greten T.F., Park J.M., Li Z.W., Egan L.J., Kagnoff M.F.,
Karin M. (2004). IKKbeta links inflammation and tumorigenesis in a mouse
model of colitis associated cancer. Cell, 18, 285–296.
Hoahland Ralph, Snider George G. (1943).Digestibility of certain higher saturated fatty
acids and triglycerides. J. Nutri., 26(3): 219–225.
Hanauer S.B. (1996). Inflammatory bowel disease. N Engl J Med., 334,841–848.
Heydnger J.A., Nakhasi D.K. (1996) Medium chain Triacylglycerols. J. of Food Lipids,,
3, 251–257.
Hilsden RJ. (2003) Complementary and alternative medicine use by Canadian patients
with inflammatory bowel disease: results from a national survey. Am J
Gastroenterol, 98, 1563–8.
Head K. et al. (2004). Inflammatory bowel disease. Part II: Crohn’s disease—
pathophysiology and conventional and alternative treatment options. Alter Med
Rev, 9,360–401.
Isaacs C.E., Thomas H.( 1991). The role of milk-derived antimicrobial lipids as
antiviral and antibacterial agents. Adv. Exp. Med. Bio, 310, 159–165.
Itzkowitz S.H., Yio X. (2004) Inflammation and cancer IV. Colorectal cancer in
inflammatory bowel disease: the role of inflammation. Am J Physiol Gastrointest
Liver Physiol, 287, G7–17.
Johnson R.C., Cotter R. ( 1986). Metabolism of medium chain triglyceride lipid
emulsions. Nutr. Int., 2, 150–158.
Khan I., Blennerhassett M.G., Kataeva G.V., and Collins S.M. (1995). Interleukin 1β
induces the expression of interleukin 6 in rat intestinal smooth muscle cells.
79
Gastroenterology, 108, 1720–1728.
Khan I., al-Awadi F.M. (1997). Colonic muscle enhances the production of interleukin-
1β messenger RNA in experimental colitis. Gut, 40, 307–312.
Kabara, J.J. (2000). Health oils from the tree of life (nutritional and health aspects of
coconut oil). Coconut J., 31(8), 2–8.
Kono H., Fujii H., Asakawa M., Yamamoto M., Matsuda M., Maki A., Matsumoto Y.,
(2003). Protective role of medium chain triglycerides on the liver and the gut in
rat administered endotoxin. Ann Surg, 237 (2), 246–55.
Kwon J.H. and Farrell R.J. (2005). The risk of lymphoma in the treatment of
inflammatory bowel disease with immunosuppressive agents. Crit Rev Oncol
Hematol, 56,169–178.
Kotakadi V.S., Jin Y., Hofseth A.B., Ying L., Cui X., Volate S., Chumanevich A., Wood
P.A., Price R.L., McNeal A., Singh U.P., Singh N.P., Nagarkatti M., Nagarkatti
P.S., Matesic L.E., Auclair K., Wargovich M.J., Hofseth L.J. (2008). Ginkgo
biloba extract EGb 761 has anti-inflammatory properties and ameliorates colitis in
mice by driving effector T cell apoptosis. Carcinogenesis, 29, 1799–1806.
Kono H., Fujii H., Ogiku M., Tsuchiya M., Hara M. (2010). Enteral diets enriched with
medium –chain triglycerides and N-3 fatty acids prevent chemically induced
experimental colitis in rats. Trans. Res., 156(5), 282–91.
Koch S., Kucharzik T., Heidemann J., Nusrat A., and Luegering A. (2010). Investigating
the role of proinflammatory CD16⁺ monocytes in the pathogenesis of
inflammatory bowel disease. Clin Exp Immunol., 161(2), 332–341.
Khor, B. Gardet, A. Xavier, RJ. (2011). Genetics and pathogenesis of inflammatory

80
bowel disease. Nature. 474(7351), 307-17.
Lim Sylianco C.Y. (1987). Anti-carcinogenic effects of coconut oil. Phillip. J. Coconut
Studies, , 12(2), 89–102.
Lukas M., Bortlik M., Maratka Z. (2006). What is the origin of ulcerative colitis? Still
more questions than answers. Postgraduate Medical Journal, 82, 620–625.
Luo Pei, Wong Yuan Fan, Ge Lin, Zhang Zhi Feng, Liu Yuan, Liu Linag, Zhou Hua.
(2010). Anti- inflammatory and analgesic effect of plumbagin through inhibition
of nuclear factor-kB activation. JPET, 335, 735-742.
Lee D.: Ulcerative Colitis. (2013). Retrieved January 4, 2013 from
http://www.medicinenet.com/ulcerative_colitis/article.htm
Murata Y., Ishiguro Y., Itoh J., Munakata A., Yoshida Y. (1995).The role of
proinflammatory and immunoregulatory cytokines in the pathogenesis of
ulcerative colitis. The Journal of Gastroenterology, 8, 56–60.
Maria et al. (2005) Assessment of interleukin-12, gamma interferon, and tumor necrosis
factor alpha secretion in sera from mice fed with dietary lipids during different
stages of Listeria monocytogenes infection. Clin Diagn Lab Immunol, 12(9),
1098–1103.
Malago J.J., Nondoli H. (2008). Sodium arsenite reduces severity of dextran sulfate
sodium-induced ulcerative colitis in rats. Journal of Zhejiang University Science,
4,341350.
Marina A.M., Che Man Y.B., Nasimah S.A.H., Amin I. (2009). Chemical properties of
virgin coconut oil. J. Amer. Oil Chem. Soc., 86, 301–307.

81
Monteleone I., Pallone F., Monteleone G. (2009). Interleukin-23 and Th17 Cells in the
Control of Gut Inflammation. Mediators Inflamm, .2009, 297645.
Nick, Gina L. (2006). Coconuts as a functional food in the prevention and treatment of
AIDS. Townsend Letter: The Examiner of Alternative Medicine, June 2006.
Neuman MG., Nanau RM., (2012). Inflammatory bowel disease: role of diet, microbiota,
life style.Transl Res, 106 (1), 29-44.
Pritts T., Hungness E. Wang Q. Robb B., Hershko D., Hasselgren PO. (2002)
Mucosal and enterocyte IL-6 production during sepsis and endotoxemia: role of
transcription factors and regulation by the stress response. Am J Surg, 183,372–
83.
Qualls JE., Tuna H., Alan M., Kaplan AM., Cohen DA. (2009). Suppression of
experimental colitis in mice by CD11c+ dendritic cells. Inflamm Bowel Dis.,
15(2), 236-47.
Robert J.J. (1978). Pharmacological effects of lipids. AOCS Press, Crazy for coconut oil
, 1–14. Champaign, IL.
St-Onge MP., Ross R., Parsons WD., Jones PJ. (2003) Medium chain triglycerides
increase energy expenditure and decrease adiposity in overweight men. Obesity
Res, 11(3), 395-402.
Sartor R.B. (2006) Mechanisms of disease; pathogenesis of Crohn's disease and
ulcerative colitis. Nature Clinical Practice Gastroenterology & Hepatology, 3,
390–407.

82
Surh Y.J. (2008). NF-κB and Nrf2 as potential chemopreventive targets of some anti-
inflammatory and antioxidative phytonutrients with anti-inflammatory and
antioxidative activities. Asia Pac J Clin Nutr., 17 (1),269–272.
Singh UP, Singh NP, Singh B., Hofseth L.J., Price R.L. Nagarkatti M, Nagarkatti PS.
(2010). Resveratrol (Trans-3,5,4-trihydroxystilbene) Induces Silent Mating Type
Information Regulation-1 and Down-Regulates Nuclear Transcription Factor-κB
Activation to Abrogate Dextran Sulfate Sodium-Induced Colitis. The Journal of
Pharmacology and Experimental Therapeutics, 332, 829–839.
Strober, W., Fuss, I.J. (2011). Proinflammatory cytokines in the pathogenesis of
inflammatory bowel disease. 140, 1756-1767.
Shi, C., Pamer EG., (2011). Monocyte recruitment during infection and inflammation. 11,
762-764.
Shigeki Bamba, Akira Andoh, Hiromitsu Ban, Hirotsugu Imaeda et al. (2012). The
severity of dextran sodium sulfate-induced colitis can differ between dextran
sodium sulfate preparations of the same molecular weight range. Dig Dis Sci,
57,327-334.
Tripp, C. S., Wolf S. F., Unanue E. R. (1993). Interleukin 12 and tumor necrosis factor α
are co-stimulators of interferon γ production by natural killer cells in severe
combined immunodeficiency mice with listeriosis, and interleukin 10 is a
physiologic antagonist. Proc. Natl. Acad. Sci. USA, 90, 3725–3729.
Territo M. (2008). Monocyte Disorders. Retrieved November 7, 2010 from
http://www.merckmanuals.com/home/sec14/ch174/ch174f.html

83
Wirtz S., Neufert C., Weigmann B., Neurath MF. (2007). Chemically induced mouse
models of intestinal inflammation. Nat Protoc., 2(3), 541-6.
Westbrook AM., Wei Bo, Braun Jonathan, et al. (2009). Intestinal mucosal inflammation
leads to systemic genotoxicity in mice. Cancer Res, 69, 4827-2834.
Xavier R.J. and Podolsky D.K. (2007). Unraveling the pathogenesis of inflammatory
bowel disease. Nature, 448, 427–434.
Ziegler Heitbrock L. ( 2007). The CD14⁺ CD16⁺ blood monocytes: their role in infection
and inflammation. J. Leukoc Biol., 81(3), 584–92.
Zakaria Z.A., Somchit M.N., Mat Jias A.M., Teh L.K., Salleh M.Z., Long K. (2011). In
vivo antinociceptive and anti- inflammatory activities of dried and fermented
processed virgin coconut oil. Med. Princ Pract., 20, 231-236.

84
CURRICULUM VITAE
Education
May 2013 MS Biology (immunology concentration) Western Kentucky
University
Jul. 2009 Bachelor of Surgery and Bachelor of Medicine (MBBS)
Zhengzhou University, China
Courses Taken
Advanced Immunology, Advanced Neurobiology, Plant Therapeutics, Electron
Microscope, Biochemistry II, Molecular Genetics, Advanced Molecular Genetics,
Graduate Seminar, Introduction to Graduate studies and Research, Internship/ College
instr., Thesis research/Writing.
Professional Experience
Jan. 2013–May 2013 Graduate Teaching Associate in Kelly Autism Program,
Western Kentucky University
Aug. 2011–Dec. 2012 Graduate Teaching Associate, Dept. of Biology, Western
Kentucky University
Aug. 2012 Instructor of record (Biol.121), Dept. of Biology, Western
Kentucky University
Publications
Pranav Chandra and Nilesh Sharma. (2011). Effect of natural plant (Cocos nucifera)
derived oil on ulcerative colitis in a murine model. J. Ky. Acad. Sci. 72 (2): 120–21
Awards and Presentations
Oct. 2012 1st place in Health Science, 98th Annual Meeting of Kentucky
Academy of Science
Oct. 2012 Graduate studies and research award ($750), Western Kentucky
University
Sep. 2012 Certificate of Recognition, 5th Annual Nanotechnology and
Nano-medicine Symposium, Sullivan University College of
Pharmacy
Mar. 2012 Best Graduate Paper in Natural Science, 42nd Annual Student
Research Conference, Western Kentucky University

85
Nov. 2011 1st place in Botany, 97
th Annual Meeting of Kentucky Academy
of Science
Aug. 2011 Graduate studies and research award ($750), Western Kentucky
University
2009–2010 Most Talented Student of the Year, ESLI, Western Kentucky
University
Jul. 2009 Distinguished Graduate Award, Zhengzhou University, China
1996-1997 Merit Scholarship, Education Ministry of Bihar, India
Training and Certifications
- Certificate of BSCT (FACET, Western Kentucky University, USA)
- Certificate of Hospital Emergency Management. (West Virginia University, USA).
- Certificate of Forensic Epidemiology: Joint Training for Law Enforcement and
Public Health Officials. (West Virginia University, USA).
- Certificate of Completion for Preventing Sexual Harassment. (Western Kentucky
University, USA)
- CITI Curriculum Completion Report for Working with Mice in Research settings.
• Human Subjects Research Curriculum (Social/Behavioral Research)
• Social and Behavioral Responsible Conduct of Research Curriculum
• Working with Mice in Research Settings Curriculum.
• Reducing Pain and Distress in Laboratory Mice and Rats Curriculum
• Aseptic Surgery Curriculum
• The IACUC Curriculum
- Certificate of Chinese language proficiency (State Commission of the Chinese
Proficiency Test, Beijing, China).
Volunteer Experience:
- An earthquake emergency relief team from Zhengzhou. In Sichuan earthquake,
China, May 2008.

86
- A blood sample collecting camp for D.M. patient in Zhengzhou, China –July
2008. (Henan first People’s Republic hospital, Zhengzhou, China).
- “Pulse polio eradication” program conducted twice a year by Government in
Bihar, India.
- “Blindness control Program” for cataract and glaucoma in the village once a year
by state health society, Bihar, India.
- Health sub centers camps in the villages as Regular Vaccination Program in
Bihar, India.
- “Vitamin A supplementation program” in Village, Bihar, India. Conducted under
joint program of state health society, Bihar and UNICEF.
Miscellaneous
Aug.2011- Aug.2012 BioGrads Club Vice President, Department of Biology,
Western Kentucky University, U.S.A.
Apr. 2005 –May 2009 Export manager and translator (Mandarin to English)
Qatar All Nada General Trading (L.L.C), U.A.E.