Effect of Co and Mo Metal Addition in Co-Mo / Zeolite Y ... · PDF fileThis study began with...
6
CHEMICAL ENGINEERINGTRANSACTIONS VOL. 56, 2017 A publication of The Italian Association of Chemical Engineering Online at www.aidic.it/cet Guest Editors: Jiří Jaromír Klemeš, Peng Yen Liew, Wai Shin Ho, Jeng Shiun Lim Copyright © 2017, AIDIC Servizi S.r.l., ISBN978-88-95608-47-1; ISSN 2283-9216 Effect of Co and Mo Metal Addition in Co-Mo / Zeolite Y Catalyst for Coal Tar Conversion to Liquid Fuel Didi Dwi Anggoro*, Luqman Buchori, Tria Friandani, Zeno R. Ramadhan Department of Chemical Engineering, Faculty of Engineering, University of Diponegoro, Semarang 50239, Indonesia [email protected] Coal tar can be used as an alternative source for the production of conventional liquid fuels such as gasoline and diesel, through the process of hydrogenation/ hydrocracking. This research is aimed to investigate the effect of Co and Mo in Co-Mo / zeolite Y catalyst in liquid fuel production from coal tar. The catalyst was prepared via wet impregnation. The objectives of this research are to determine the effect of the addition Co and Mo metals on liquid fuel production process from coal tar, and to know the characteristics of the catalysts by impregnation method. This study began with the preparation of Co-Mo / zeolite Y catalyst, followed by the hydrocracking / hydrotreating reaction between coal tar with hydrogen gases. The independent variables (weight cobalt metals and molybdenum metals) were optimised to obtain the optimum liquid fuels yield. The characterisation results indicated that the increasing concentration of Co and Mo caused the decreasing in the surface area of the catalyst. The acidity of catalysts changed with loaded Co and Mo to zeolite Y. Results of SEM and XRD analysis showed that the morphology and crystal form of Co-Mo / zeolite Y unchanged with zeolite Y before impregnated with Co and Mo. Optimum liquid fuel yield (1.80 %) was obtained on a composition weight with Co metal of 0.59 g and Mo metal of 0.5 g. 1. Introduction Energy use in Indonesia is generally increasing rapidly with the increase in population, economic growth and technological developments, which have an impact on the energy consumption. In the Government Regulation (PP) No. 5 year 2006 on National Energy Policy, in order to cope with the surge in energy requirements, energy derived from oil (less than 20 %), natural gas (more than 30 %), coal (more than 33 %), biofuel (more than 5 %), geothermal (more than 5 %), and renewable energy, especially for biomass, nuclear, small hydropower and solar power, and wind power (more than 5 %), other fuels derived from coal liquefaction (more than 2 %) are targeted for the national energy consumption by 2025 (PP Number 5, 2006). Coal tar is a product of coal liquefaction. Unlike other good quality fuel oil, coal tar quality is considered as low fuel quality due to the high value of its molecular weight, viscosity, and heteroatom compound (S and N) (Krichko et al, 1996). Coal tar contains a mixture of aliphatic, aromatic, alicyclic, and heterocyclic components (Kan et al, 2011). Coal tar is obtained from several processes, namely carbonisation and gasification. Coal tar can be converted into a liquid fuel such as gasoline and diesel oil through the process of hydrogenation / hydrocracking. However, refining process is required to produce vehicle fuel standard. Zeolite is a good catalyst, because it has large pores or channels, a large surface area and high enough acidity (Amin and Anggoro, 2003). In the petroleum processing industry, zeolite is used as an acid catalyst in cracking process. Zeolite is abundant, cheap and commonly used as a catalyst. Hydrocracking catalyst like zeolite has an ability to hold the sulphur and nitrogen contained in coal tar, so that the catalyst can be in good condition. The mixture between the zeolite Y catalyst and cobalt metal, election transition metal (Co) due to they have high selectivity and also the ability to withstand impurities such as sulphur and nitrogen components which is contained in coal tar. The mixture of cobalt metal with zeolite Y and Co-Mo with the zeolite Y can be done via impregnation. The main objective of this paper is to study the production of liquid fuels from coal tar by using Co-Mo / zeolite Y catalyst, characteristics of the Co / zeolite Y and Co-Mo / zeolite Y catalysts with X-Ray Diffraction (XRD), DOI: 10.3303/CET1756287 Please cite this article as: Anggoro D.D., Buchori L., Friandani T., Ramadhan Z.R., 2017, Effect of co and mo metal addition in co-mo / zeolite y catalyst for coal tar conversion to liquid fuel, Chemical Engineering Transactions, 56, 1717-1722 DOI:10.3303/CET1756287 1717
Transcript of Effect of Co and Mo Metal Addition in Co-Mo / Zeolite Y ... · PDF fileThis study began with...

CHEMICAL ENGINEERINGTRANSACTIONS
VOL. 56, 2017
A publication of
The Italian Association of Chemical Engineering Online at www.aidic.it/cet
Guest Editors: Jiří Jaromír Klemeš, Peng Yen Liew, Wai Shin Ho, Jeng Shiun Lim Copyright © 2017, AIDIC Servizi S.r.l.,
ISBN978-88-95608-47-1; ISSN 2283-9216
Effect of Co and Mo Metal Addition in Co-Mo / Zeolite Y Catalyst for Coal Tar Conversion to Liquid Fuel
Didi Dwi Anggoro*, Luqman Buchori, Tria Friandani, Zeno R. Ramadhan Department of Chemical Engineering, Faculty of Engineering, University of Diponegoro, Semarang 50239, Indonesia [email protected]
Coal tar can be used as an alternative source for the production of conventional liquid fuels such as gasoline and diesel, through the process of hydrogenation/ hydrocracking. This research is aimed to investigate the effect of Co and Mo in Co-Mo / zeolite Y catalyst in liquid fuel production from coal tar. The catalyst was prepared via wet impregnation. The objectives of this research are to determine the effect of the addition Co and Mo metals on liquid fuel production process from coal tar, and to know the characteristics of the catalysts by impregnation method. This study began with the preparation of Co-Mo / zeolite Y catalyst, followed by the hydrocracking / hydrotreating reaction between coal tar with hydrogen gases. The independent variables (weight cobalt metals and molybdenum metals) were optimised to obtain the optimum liquid fuels yield. The characterisation results indicated that the increasing concentration of Co and Mo caused the decreasing in the surface area of the catalyst. The acidity of catalysts changed with loaded Co and Mo to zeolite Y. Results of SEM and XRD analysis showed that the morphology and crystal form of Co-Mo / zeolite Y unchanged with zeolite Y before impregnated with Co and Mo. Optimum liquid fuel yield (1.80 %) was obtained on a composition weight with Co metal of 0.59 g and Mo metal of 0.5 g.
1. Introduction
Energy use in Indonesia is generally increasing rapidly with the increase in population, economic growth and technological developments, which have an impact on the energy consumption. In the Government Regulation (PP) No. 5 year 2006 on National Energy Policy, in order to cope with the surge in energy requirements, energy derived from oil (less than 20 %), natural gas (more than 30 %), coal (more than 33 %), biofuel (more than 5 %), geothermal (more than 5 %), and renewable energy, especially for biomass, nuclear, small hydropower and solar power, and wind power (more than 5 %), other fuels derived from coal liquefaction (more than 2 %) are targeted for the national energy consumption by 2025 (PP Number 5, 2006). Coal tar is a product of coal liquefaction. Unlike other good quality fuel oil, coal tar quality is considered as low fuel quality due to the high value of its molecular weight, viscosity, and heteroatom compound (S and N) (Krichko et al, 1996). Coal tar contains a mixture of aliphatic, aromatic, alicyclic, and heterocyclic components (Kan et al, 2011). Coal tar is obtained from several processes, namely carbonisation and gasification. Coal tar can be converted into a liquid fuel such as gasoline and diesel oil through the process of hydrogenation / hydrocracking. However, refining process is required to produce vehicle fuel standard. Zeolite is a good catalyst, because it has large pores or channels, a large surface area and high enough acidity (Amin and Anggoro, 2003). In the petroleum processing industry, zeolite is used as an acid catalyst in cracking process. Zeolite is abundant, cheap and commonly used as a catalyst. Hydrocracking catalyst like zeolite has an ability to hold the sulphur and nitrogen contained in coal tar, so that the catalyst can be in good condition. The mixture between the zeolite Y catalyst and cobalt metal, election transition metal (Co) due to they have high selectivity and also the ability to withstand impurities such as sulphur and nitrogen components which is contained in coal tar. The mixture of cobalt metal with zeolite Y and Co-Mo with the zeolite Y can be done via impregnation. The main objective of this paper is to study the production of liquid fuels from coal tar by using Co-Mo / zeolite Y catalyst, characteristics of the Co / zeolite Y and Co-Mo / zeolite Y catalysts with X-Ray Diffraction (XRD),
DOI: 10.3303/CET1756287
Please cite this article as: Anggoro D.D., Buchori L., Friandani T., Ramadhan Z.R., 2017, Effect of co and mo metal addition in co-mo / zeolite y catalyst for coal tar conversion to liquid fuel, Chemical Engineering Transactions, 56, 1717-1722 DOI:10.3303/CET1756287
1717
surface area, Scanning Electro Magnetics (SEM) and total acid amount, and to investigate the effect of cobalt and molydenum weight on production of liquid fuel. A light carbon fraction like gasoline or diesel is expected to be obtained.
2. Materials and methods
2.1 Materials
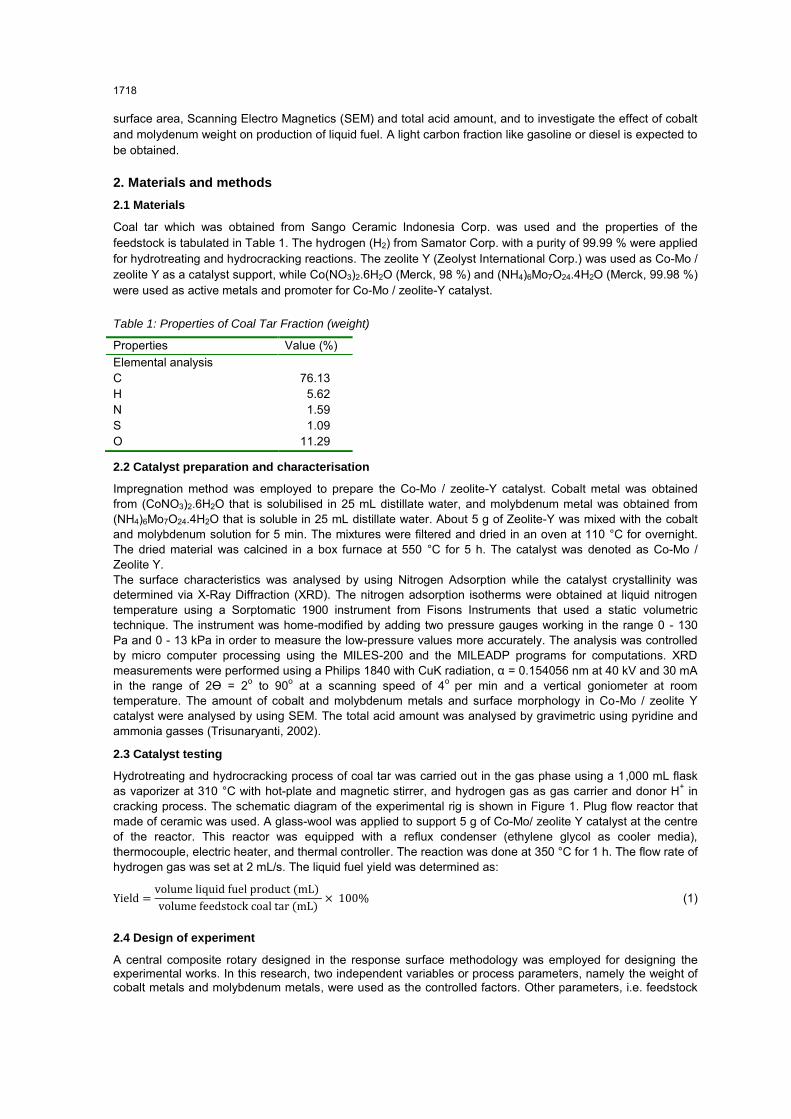
Coal tar which was obtained from Sango Ceramic Indonesia Corp. was used and the properties of the feedstock is tabulated in Table 1. The hydrogen (H2) from Samator Corp. with a purity of 99.99 % were applied for hydrotreating and hydrocracking reactions. The zeolite Y (Zeolyst International Corp.) was used as Co-Mo / zeolite Y as a catalyst support, while Co(NO3)2.6H2O (Merck, 98 %) and (NH4)6Mo7O24.4H2O (Merck, 99.98 %) were used as active metals and promoter for Co-Mo / zeolite-Y catalyst.
Table 1: Properties of Coal Tar Fraction (weight)
Properties Value (%) Elemental analysis
C 76.13 H 5.62 N 1.59 S 1.09 O 11.29
2.2 Catalyst preparation and characterisation
Impregnation method was employed to prepare the Co-Mo / zeolite-Y catalyst. Cobalt metal was obtained from (CoNO3)2.6H2O that is solubilised in 25 mL distillate water, and molybdenum metal was obtained from (NH4)6Mo7O24.4H2O that is soluble in 25 mL distillate water. About 5 g of Zeolite-Y was mixed with the cobalt and molybdenum solution for 5 min. The mixtures were filtered and dried in an oven at 110 °C for overnight. The dried material was calcined in a box furnace at 550 °C for 5 h. The catalyst was denoted as Co-Mo / Zeolite Y. The surface characteristics was analysed by using Nitrogen Adsorption while the catalyst crystallinity was determined via X-Ray Diffraction (XRD). The nitrogen adsorption isotherms were obtained at liquid nitrogen temperature using a Sorptomatic 1900 instrument from Fisons Instruments that used a static volumetric technique. The instrument was home-modified by adding two pressure gauges working in the range 0 - 130 Pa and 0 - 13 kPa in order to measure the low-pressure values more accurately. The analysis was controlled by micro computer processing using the MILES-200 and the MILEADP programs for computations. XRD measurements were performed using a Philips 1840 with CuK radiation, α = 0.154056 nm at 40 kV and 30 mA in the range of 2Ө = 2
o to 90o at a scanning speed of 4o per min and a vertical goniometer at room temperature. The amount of cobalt and molybdenum metals and surface morphology in Co-Mo / zeolite Y catalyst were analysed by using SEM. The total acid amount was analysed by gravimetric using pyridine and ammonia gasses (Trisunaryanti, 2002).
2.3 Catalyst testing
Hydrotreating and hydrocracking process of coal tar was carried out in the gas phase using a 1,000 mL flask as vaporizer at 310 °C with hot-plate and magnetic stirrer, and hydrogen gas as gas carrier and donor H+ in cracking process. The schematic diagram of the experimental rig is shown in Figure 1. Plug flow reactor that made of ceramic was used. A glass-wool was applied to support 5 g of Co-Mo/ zeolite Y catalyst at the centre of the reactor. This reactor was equipped with a reflux condenser (ethylene glycol as cooler media), thermocouple, electric heater, and thermal controller. The reaction was done at 350 °C for 1 h. The flow rate of hydrogen gas was set at 2 mL/s. The liquid fuel yield was determined as:
Yield =volume liquid fuel product (mL)
volume feedstock coal tar (mL)× 100% (1)
2.4 Design of experiment
A central composite rotary designed in the response surface methodology was employed for designing the experimental works. In this research, two independent variables or process parameters, namely the weight of cobalt metals and molybdenum metals, were used as the controlled factors. Other parameters, i.e. feedstock
1718

of coal tar (100 mL), reaction temperature (350 °C), and time reaction (1 h), were fixed and set from literature (Anggoro et al., 2016). Ranges of dependent variables (Table 2) were chosen based on the conditions that were obtained from the screening tests prior to this optimisation. Allowances for extreme measures are designated in central composite design and presented by –α and +α, as shown in Table 2 (Anggoro and Istadi, 2008). The actual design of the experiment is shown in Table 3.
Figure 1: Prototype of hydro-treating and hydrocracking experiment
Table 2: Range and level of dependent variable
Independent Variable Range and Levels -α Low Level (-1) Center Level (0) High Level (+1) +α
Cobalt metal (g) 0.58 1 2 3 3.41 Molybdenum metal (g) 0.15 0.25 0.5 0.75 0.85
3. Results and Discussions
3.1 Stability of Crystallinity and Metal Composition
XRD analysis was done qualitatively and quantitatively (the percentage of crystallinity). This analysis is to ensure the zeolite structure can be maintained and its contents do not undergo many changes during the process of the catalyst preparation. The stability of the zeolite crystallinity can be determined by comparing of theta (2Ө) of before and after adhere process. Figure 2 shows that the stability of the zeolite did not change. This is because there is no difference in the theta between 2Ө early and 2Ө after adhering. Diffractogram data
for each variation of the metal composition in the catalyst of Co-Mo / zeolite Y is shown in Figure 2. As it can be seen in Figure 2, diffractogram pattern results for all kinds of samples is relatively the same as the initial zeolite Y. This indicates that the catalyst preparation step of Co-Mo / zeolite Y does not influence the zeolite Y structure. However, the intensity for the peak of Co and Mo varies due the existence of Co and Mo which entered into HY pores (Morávek et al 1990). The cobalt peak was observed at 2Ө of 5.9
o, 6.5o, and 15.7o. The molybdenum peak was not shown at diffractogram. This is because the amount of molybdenum loaded zeolite is small. The appeared theta (2Ө) of 35
o peak indicates the presence of Mo metal in the surface of the catalyst (Li et al 2014).
3.2 Influence of Metal Content on Acidity
The results of investigation are tabulated in Table 3. The catalyst acidity analysis showed that the increase in concentration of Co and Mo causes increasing of acidity value higher than initial HY. Co-Mo / HY run 10, it provides the greatest acidity. Table 3 shows that 2Co-0.85Mo / zeolite Y catalyst (Run 10) has the biggest acid value (18.4924 mmol NH3/g). This happens because the Mo contained in the zeolite pores has 6 unpaired electrons in orbitals d and s. The metal of Co which is contained in the zeolite pores also has three unpaired electrons in d orbitals. Unpaired electrons act as electron-pair acceptors for absorbing base. The unpaired electron donates Lewis acid sites thereby contributing to the increases of the acidity of the catalyst.
1719
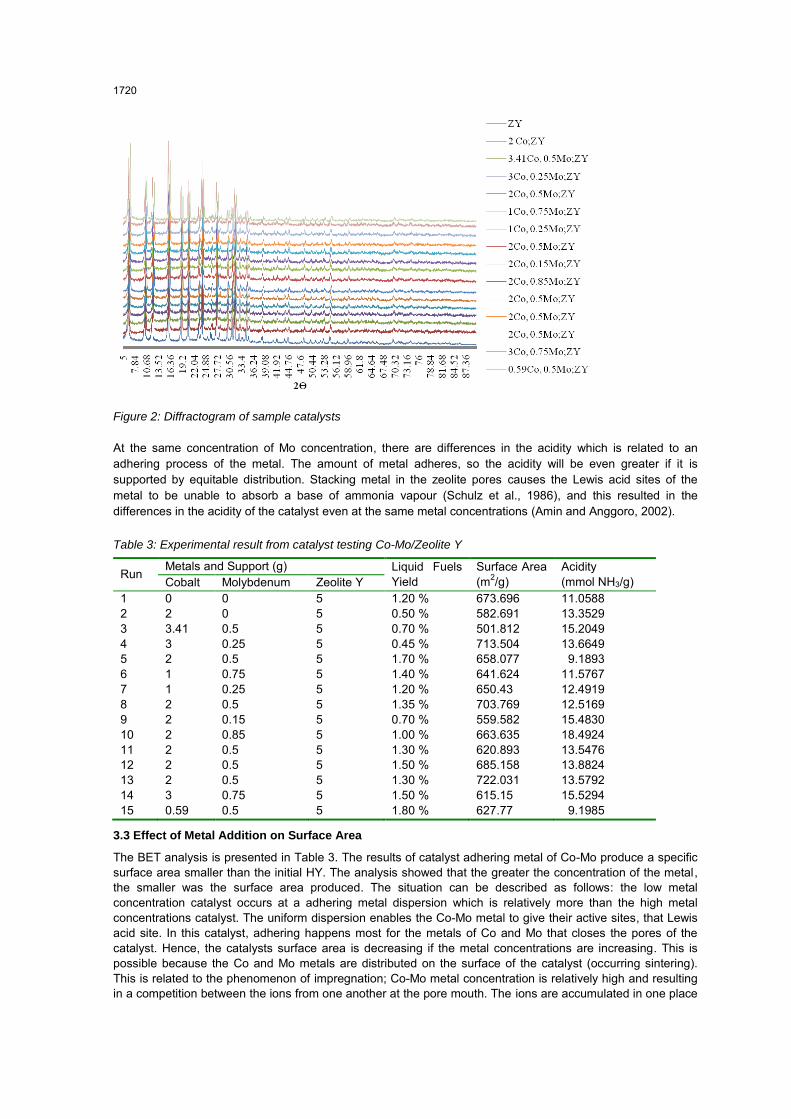
Figure 2: Diffractogram of sample catalysts
At the same concentration of Mo concentration, there are differences in the acidity which is related to an adhering process of the metal. The amount of metal adheres, so the acidity will be even greater if it is supported by equitable distribution. Stacking metal in the zeolite pores causes the Lewis acid sites of the metal to be unable to absorb a base of ammonia vapour (Schulz et al., 1986), and this resulted in the differences in the acidity of the catalyst even at the same metal concentrations (Amin and Anggoro, 2002).
Table 3: Experimental result from catalyst testing Co-Mo/Zeolite Y
Run Metals and Support (g) Liquid Fuels
Yield Surface Area (m2/g)
Acidity (mmol NH3/g) Cobalt Molybdenum Zeolite Y
1 0 0 5 1.20 % 673.696 11.0588 2 2 0 5 0.50 % 582.691 13.3529 3 3.41 0.5 5 0.70 % 501.812 15.2049 4 3 0.25 5 0.45 % 713.504 13.6649 5 2 0.5 5 1.70 % 658.077 9.1893 6 1 0.75 5 1.40 % 641.624 11.5767 7 1 0.25 5 1.20 % 650.43 12.4919 8 2 0.5 5 1.35 % 703.769 12.5169 9 2 0.15 5 0.70 % 559.582 15.4830 10 2 0.85 5 1.00 % 663.635 18.4924 11 2 0.5 5 1.30 % 620.893 13.5476 12 2 0.5 5 1.50 % 685.158 13.8824 13 2 0.5 5 1.30 % 722.031 13.5792 14 3 0.75 5 1.50 % 615.15 15.5294 15 0.59 0.5 5 1.80 % 627.77 9.1985
3.3 Effect of Metal Addition on Surface Area
The BET analysis is presented in Table 3. The results of catalyst adhering metal of Co-Mo produce a specific surface area smaller than the initial HY. The analysis showed that the greater the concentration of the metal, the smaller was the surface area produced. The situation can be described as follows: the low metal concentration catalyst occurs at a adhering metal dispersion which is relatively more than the high metal concentrations catalyst. The uniform dispersion enables the Co-Mo metal to give their active sites, that Lewis acid site. In this catalyst, adhering happens most for the metals of Co and Mo that closes the pores of the catalyst. Hence, the catalysts surface area is decreasing if the metal concentrations are increasing. This is possible because the Co and Mo metals are distributed on the surface of the catalyst (occurring sintering). This is related to the phenomenon of impregnation; Co-Mo metal concentration is relatively high and resulting in a competition between the ions from one another at the pore mouth. The ions are accumulated in one place
1720

and close the pore mouth and pore channels, so relatively high number of Co-Mo do not increase the specific surface area of the sample. Pore channel which is closed with metals becomes shallow (Schulz et al., 1986). Hence, the total volume pore decreases (Amin and Anggoro, 2003).
3.4 Effect of addition metal on SEM Analysis
Results of SEM analysis were showed in Figure 3. Effect of Co and Mo impregnation with zeolite Y was indicated by SEM analysis. SEM analysis showed the morphology and crystal form of Co-Mo/ zeolite Y remained unchanged with zeolite Y before impregnated with Co and Mo. Metals Co and Mo was adhered in zeolite Y as can be seen from the SEM-EDX analyses, as shown in Figure 3. Figure 3 shows that, after the metal impregnation of cobalt and molybdenum, diminution of pore diameter occurred , because cobalt and molybdenum metal are adhering on the pore of catalyst. This is evident in Table 3, the presence of cobalt and molybdenum metals rise on Co-Mo / Zeolite Y. Zeolite Y catalyst already contains Mo (0.18 %), however Mo metal on zeolite Y was not affected to liquid fuel yields. This is because the position of Mo metal is on zeolite Y framework.
Figure 3: SEM-EDX Analysis of catalyst: a) Zeolite Y; b) Co-Mo / zeolite Y
Table 4: Composition Cobalt and Molybdenum Metal Adhere
Catalyst Metals and Support (g) SEM-EDX (Mass %) Co Mo Al Si Na O Co Mo
Zeolite Y 0 0 2.41 14.16 0.02 18.6 0 0.18 Co-Mo/ zeolite Y 1 0.75 3.28 21.78 0 28.3 0.7 0.48
3.5 Effect of Metal Addition on Liquid Fuel Yield
The analysis result of XRD, SEM, surface area, and acidity indicated that the liquid fuel yield was dependent on the catalyst acidity. The XRD, SEM and surface area analysis concluded that the metal addition gave effect on the size of particle because more metal was loaded on the surface catalyst. Hence more catalyst surface area had decreased. The acidity of a catalyst affected on the decrease in activation energy. High acidity can be predicted during the cracking of raw material (coal tar) into lighter hydrocarbons. In the process of cracking, every reaction has different activation energy, so the acidity is very influential in the products of cracking (Morávek et al., 1990). Lin and Qiu (2014) mentions that the activation energy of hydrocracking reaction (Figure 4) will decrease drastically with the increasing of the acid strength of catalyst, especially in the processes that have a lot of reactions (Morávek et al., 1990). The organic components in the liquid fuel products were determine by verification between GC-MS gasoline and GC liquid fuel analysis. The most abundant component in the liquid fuel product included C6-C8 hydrocarbons, such as benzene-propil, benzene, 1-ethyl 3 methyl, benzene, 1,2,3 trimethyl, benzene, 1 methyl 3 propil, benzene, 1,2,4,5 tetramethyl. Benzene-propil appeared as the most outstanding component with a molar content of 14.1 %.
a) b)
1721

Figure 4: Hydrocracking and hydrotreating pathway reaction (Morávek et al., 1990)
4. Conclusion
The characterisation results indicated that the increasing concentration of Co and Mo caused the decrease in the catalyst’s surface area. The acidity of the catalysts changed when Co and Mo were loaded into zeolite Y. The morphology and crystal form of Co-Mo / zeolite Y are unchanged even after the zeolite Y was impregnated with Co and Mo. The optimum liquid fuel yield at 1.80 % was achieved when the Co weight was at 0.59 g and the Mo metal weight at 0.5 g. As the Co metal and Mb metal increased, low liquid fuel yield was obtained. It is due to the influence of the hydrogenation of coal tar cracking towards the catalyst acidity.
Reference
Amin N.A.S., Anggoro D.D., 2002, Dealuminated ZSM-5 zeolite catalyst for ethylene oligomerization to liquid fuel, Journal of Natural Gas Chemistry 11, 79-86.
Amin N.A.S., Anggoro D.D., 2003, Characterization and activity of Cr, Cu and Ga modified ZSM-5 for direct conversion of methane to liquid hydrocarbons, Journal of Natural Gas Chemistry 12, 123-134.
Anggoro D.D., Istadi, 2008, Optimization of methane conversion to liquid fules over W-Cu/ZSM-5 catalysts by response surface methodology, Journal of Natural Gas Chemistry 17, 39-44.
Anggoro D.D., Hidayati N., Buchori L., Mundriyastutik Y., 2016, Effect of Co and Mo Loading by Impregnation and Ion Exchange Methods on Morphological Properties of Zeolite Y Catalyst, Buletin of Chemical Reaction Engineering & Catalysis 11, 75-83.
Government Regulation (PP) Republic of Indonesian, 2006, Number 5 year 2006, Jakarta, Indonesia. Kan T., Wang H., He H., Li C., Zhang S., 2011, Experimental study on two-stage catalytic hydroprocessing of
middle-temperature coal tar to clean liquid fuels, Fuel 90, 3404-3409. Krichko A.A., Maloletnev, A. S., Mazneva, O. a., and Gagarin, S. G. 1996, Catalytic properties of high-silica
zeolite in hydrotreatment of coal liquefaction product, Fuel 76, 683-685. Li L., Quan K., Xu J., Liu F., Yu S., Xie C., Zhang B., Ge X., 2014, Liquid hydrocarbon fuels from catalytic
cracking of rubber seed oil using USY as catalyst, Fuel 123, 189-193. Lin T., Qiu C., 2014, Acid strength controlled reaction pathways for the catalytic cracking of 1-butene to
propene over ZSM-5, Journal of Catalyst 309, 136-145. Morávek V., Duchet J.C., Cornet D., 1990, Kinetic study of pyrrole and pyridine HDN on Ni-W and Ni-Mo
catalysts, Applied Catalysis 66, 257-266. Schulz H., Schon M., Rahman N.M., 1986, Hydrogenative denitrogenation of model compounds as related to
the refining of liquid fuels, Studies in Surface Science and Catalysis 27, 201-255. Trisunaryanti W., 2002, Optimisation of time and catalyst/feed ratio in catalytic cracking of waste plastics
fraction to gasoline fraction using Cr/natural zeolite catalyst, Indonesian Journal of Chemistry 2, 30-40.
1722