EFFECT OF CASMO-5 CROSS-SECTION DATA AND DOPPLER ...
13
PHYSOR 2010 – Advances in Reactor Physics to Power the Nuclear Renaissance Pittsburgh, Pennsylvania, USA, May 9-14, 2010, on CD-ROM, American Nuclear Society, LaGrange Park, IL (2010) EFFECT OF CASMO-5 CROSS-SECTION DATA AND DOPPLER TEMPERATURE DEFINITIONS ON LWR REACTIVITY INITIATED ACCIDENTS Gerardo Grandi, Kord Smith, Zhiwen Xu and Joel Rhodes Studsvik Scandpower, Inc. 504 Shoup Ave, Suite # 201, Idaho Falls, ID, 83402 USA [email protected]; [email protected]; [email protected]; [email protected] ABSTRACT During LWR Reactivity Initiated Accidents (RIA), the accurate evaluation of the Doppler reactivity feedback depends on the Doppler coefficient computed by the lattice physics code (e.g. CASMO-5), and on the effective Doppler temperature computed by the transient code (e.g. SIMULATE-3K) using the non-uniform intra-pellet temperature profile. CASMO-5 has many new features compared with its predecessor. Among them, the replacement of the L-library (based primarily on ENDF/B IV data) by the latest available nuclear data (ENDF/B VII.0), and the Monte Carlo based resonance elastic scattering model to overcome deficiencies in NJOY modeling have a significant impact on the fuel temperature coefficient, and hence on LWR RIA. The Doppler temperature effect in thermal reactors is driven by the 238 U absorption. The different effective Doppler temperature definitions, available in the literature, try to capture the considerable self- shielding of the 238 U absorption that occurs in the pellet surface by defining an appropriate fuel temperature to compute cross-sections. In this work, we investigate the effect of the nuclear data generated by CASMO-5 on RIA, as well as the impact of different effective Doppler temperature definitions, including one proposed by the authors. It is concluded: 1) LWR RIA evaluated using CASMO-5 cross section data will be milder because the energy released is ~10% smaller; 2) the prompt enthalpy rise is barely affected by the choice of the Doppler temperature definition; and 3) the peak fuel enthalpy is affected by the choice of the Doppler temperature definition, the under- prediction of the Doppler reactivity by the ‘NEA’ Doppler temperature results in a conservative estimate of the peak fuel enthalpy. Key Words: LWR RIA, Doppler Coefficient, Doppler temperature, CASMO-5, SIMULATE-3K 1. INTRODUCTION LWR Reactivity initiated accidents (RIA) are characterized by a very fast positive reactivity insertion that is reversed by Doppler feedback due to the rapid fuel temperature increase during the (almost) adiabatic phase of the transient. An accurate evaluation of the Doppler reactivity feedback depends on: the Doppler temperature coefficient computed by the lattice physics code, and the “effective Doppler temperature” that the transient code uses to calculate cross-sections. SIMULATE-3K (S3K) was designed to be a best estimate tool employing a full two-group advanced nodal method. It is well suited, for the analysis of RIA in LWR [1, 2]. In fact, it is used by utilities [3] and research institutes [4] in the United States and Europe, for performing the analysis of PWR Rod Ejection Accidents (REA) and BWR Rod Drop Accidents (RDA) for realistic UO 2 and MOX core designs. So far, all these analyses have been performed using CASMO-4 [5] data.
Transcript of EFFECT OF CASMO-5 CROSS-SECTION DATA AND DOPPLER ...

PHYSOR 2010 – Advances in Reactor Physics to Power the Nuclear Renaissance Pittsburgh, Pennsylvania, USA, May 9-14, 2010, on CD-ROM, American Nuclear Society, LaGrange Park, IL (2010)
EFFECT OF CASMO-5 CROSS-SECTION DATA AND DOPPLER TEMPERATURE DEFINITIONS ON LWR REACTIVITY INITIATED
ACCIDENTS
Gerardo Grandi, Kord Smith, Zhiwen Xu and Joel Rhodes Studsvik Scandpower, Inc.
504 Shoup Ave, Suite # 201, Idaho Falls, ID, 83402 USA [email protected]; [email protected]; [email protected];
ABSTRACT
During LWR Reactivity Initiated Accidents (RIA), the accurate evaluation of the Doppler reactivity feedback depends on the Doppler coefficient computed by the lattice physics code (e.g. CASMO-5), and on the effective Doppler temperature computed by the transient code (e.g. SIMULATE-3K) using the non-uniform intra-pellet temperature profile. CASMO-5 has many new features compared with its predecessor. Among them, the replacement of the L-library (based primarily on ENDF/B IV data) by the latest available nuclear data (ENDF/B VII.0), and the Monte Carlo based resonance elastic scattering model to overcome deficiencies in NJOY modeling have a significant impact on the fuel temperature coefficient, and hence on LWR RIA. The Doppler temperature effect in thermal reactors is driven by the 238U absorption. The different effective Doppler temperature definitions, available in the literature, try to capture the considerable self-shielding of the 238U absorption that occurs in the pellet surface by defining an appropriate fuel temperature to compute cross-sections. In this work, we investigate the effect of the nuclear data generated by CASMO-5 on RIA, as well as the impact of different effective Doppler temperature definitions, including one proposed by the authors. It is concluded: 1) LWR RIA evaluated using CASMO-5 cross section data will be milder because the energy released is ~10% smaller; 2) the prompt enthalpy rise is barely affected by the choice of the Doppler temperature definition; and 3) the peak fuel enthalpy is affected by the choice of the Doppler temperature definition, the under-prediction of the Doppler reactivity by the ‘NEA’ Doppler temperature results in a conservative estimate of the peak fuel enthalpy. Key Words: LWR RIA, Doppler Coefficient, Doppler temperature, CASMO-5, SIMULATE-3K
1. INTRODUCTION LWR Reactivity initiated accidents (RIA) are characterized by a very fast positive reactivity insertion that is reversed by Doppler feedback due to the rapid fuel temperature increase during the (almost) adiabatic phase of the transient. An accurate evaluation of the Doppler reactivity feedback depends on: the Doppler temperature coefficient computed by the lattice physics code, and the “effective Doppler temperature” that the transient code uses to calculate cross-sections. SIMULATE-3K (S3K) was designed to be a best estimate tool employing a full two-group advanced nodal method. It is well suited, for the analysis of RIA in LWR [1, 2]. In fact, it is used by utilities [3] and research institutes [4] in the United States and Europe, for performing the analysis of PWR Rod Ejection Accidents (REA) and BWR Rod Drop Accidents (RDA) for realistic UO2 and MOX core designs. So far, all these analyses have been performed using CASMO-4 [5] data.

Gerardo Grandi et.al.
PHYSOR 2010 – Advances in Reactor Physics to Power the Nuclear Renaissance Pittsburgh, Pennsylvania, USA, May 9-14, 2010
2/13
CASMO-5 [6], Studsvik’s next generation LWR lattice physics code, has many new features compared with its predecessor CASMO-4. As will be discussed in section 2, the replacement of the L-library (based primarily on ENDF/B IV data) by ENDF/B VII.0 data and the correct treatment of the 238U resonance elastic scattering, have a significant impact on the fuel temperature coefficient, and hence on RIA. Different models are available in the literature to compute the effective Doppler temperature. The accuracy of these models will be assessed in section 3. The Doppler feedback of non-uniform fuel temperature distributions within the fuel pin will be studied by performing Monte Carlo calculations using non-uniform and flat intra-pellet temperature distributions. Moreover, an empirical model that approximates the Doppler reactivity is proposed. The effect of the CASMO-5 fuel temperature coefficient and different effective Doppler temperature definitions on reactivity initiated accidents is investigated for one PWR MOX/UO2 full core model to be described in section 4. The impact on reactivity initiated accidents key parameters (e.g. energy release, peak fuel enthalpy, prompt fuel enthalpy) will be discussed in section 5. Finally, some conclusions are drawn in section 6.
2. FUEL TEMPERATURE COEFFICIENT EVALUATION Many advanced models distinguish CASMO-5 from its predecessor CASMO-4. Among them it is worth mentioning:
ENDF/B VII.0 586 group library replaces the 70 group library primarily based on ENDF/B IV. Monte Carlo based resonance elastic scattering model to overcome deficiencies in NJOY
modeling [7]. Quadratic Gd-depletion model [8]. Optimum 3 polar angle numerical quadrature [9]. Extended depletion chains. Characteristic based Dancoff factor calculations.
The ENDF/B VII.0 data and the correct treatment of the 238U resonance elastic scattering model have a great impact on the fuel temperature coefficient calculation. Many researchers [10, 7], showed that the asymptotic elastic scattering models used in the epithermal range in the NJOY code lead to ~10% under prediction of Doppler coefficients in LWR lattices. Lattice physics codes employing NJOY generated cross-sections introduce a systematic error in thermal reactor eigenvalues and Doppler coefficients. CASMO-5 has implemented a model to overcome the deficiency inherent in NJOY generated cross sections [7]. Fig. 1 illustrates the Doppler coefficient for MOX and UO2 lattices used in the present work. Becker, Dagan and Lohnert [10], developed the Doppler Broadened Rejection Correction (DBRC), and demonstrated that DBRC approach produces the same results as Lee et al approach. Even more important, the RPI LINAC experiment [11], experimentally confirmed the underlying resonant dependent scattering model of both approaches.

Effect of CASMO-5 Cross-Section Data and Doppler Temperature Definitions on LWR Reactivity Initiated Accidents
PHYSOR 2010 – Advances in Reactor Physics to Power the Nuclear Renaissance Pittsburgh, Pennsylvania, USA, May 9-14, 2010
3/13
Figure 1. Comparison of fuel temperature coefficients (FTC) for MOX and UO2 lattices.
3. EFFECTIVE DOPPLER TEMPERATURE EVALUATION In steady-state LWR operating conditions, the fuel temperature profile is known to be nearly a quadratic function of spatial position within a fuel pin. In the early phase of a rod ejection accident, the temperature rise may resemble the intra-pellet power profile within the fuel pin until the heat conduction shifts the temperature distribution towards the center of the pin. The intra-pellet power profile peaks at the outer edge of the fuel with burnup peaking factors as illustrated in Fig.2. The temperature profile that resembles the intra-pellet power distribution will be called ‘inverted’ temperature profile in what follows.
Figure 2. Intra-pellet power profiles as a function of radius and burnup for MOX and UO2 lattices. However, normal CASMO-5 calculations assume that the temperature profile across a fuel pin is spatially flat. Therefore, the steady-state or transient nodal code must calculate an “effective Doppler temperature,” from the fuel temperature spatial distribution within the pin, such that the Doppler feedback is properly accounted for. The volume-averaged temperature, (TBE1), defined by Eq. (1) is probably the most common one.
MOX 4.3 %
-3.50
-3.00
-2.50
-2.00
-1.50
-1.00
-0.50
0.00
0 10 20 30 40
Exposure (GWd/T)
FTC
(pcm
/K)
CASMO-4CASMO-5
UO2 4.2%
-3.00
-2.50
-2.00
-1.50
-1.00
-0.50
0.00
0 10 20 30 40
Exposure (GWd/T)
FTC
(pcm
/K)
CASMO-4CASMO-5
MOX fuel
0.8
0.9
1
1.1
1.2
1.3
1.4
0 0.2 0.4 0.6 0.8 1
Relative radius (-)
Rel
ativ
e in
tra-p
in p
ower
(-)
0 GWd/T20 GWd/T40 GWd/T
UO2 fuel
0.8
0.9
1
1.1
1.2
1.3
1.4
0 0.2 0.4 0.6 0.8 1
Relative radius (-)
Rel
ativ
e in
tra-p
in p
ower
(-)
0 GWd/T20 GWd/T40 GWd/T

Gerardo Grandi et.al.
PHYSOR 2010 – Advances in Reactor Physics to Power the Nuclear Renaissance Pittsburgh, Pennsylvania, USA, May 9-14, 2010
4/13
drrdrrrTTBE )(1 (1)
The Doppler temperature effect in a thermal reactor is driven by 238U absorption. There is considerable spatial self-shielding of the 238U absorption and much of the absorption occurs near the surface of the fuel pin, where the temperatures are lowest in steady state. The ‘NEA’ effective fuel temperature [12], (TNEA), defined by Eq. (2), tries to capture the fact that most of the 238U absorption self shielding occurs at a temperature closer to the pellet surface, (TS), than to the pin centerline temperature, (TC),
csNEA TTT 3.07.0 (2) Goltsev et al [13], proposed as an effective Doppler temperature (TGDTL) based on the expression,
drrdrrrTTGDTL )()()( (3)
where )(1)( rTr . To help achieve some detailed understanding of the physics of temperature distribution effects on Doppler feedback, a single pin cell problem, including quadratic, inverted, and flat temperature distributions is studied. By comparing the Doppler reactivity differences between non-uniform and the flat profiles, one can determine the impact of correctly modeling the temperature distribution. Appendix A defines the problem in detail. The problem was solved with the continuous-energy Monte Carlo code, MCNP-5, using ENDF/B-VII data. It is important to mention that the Doppler Broadened Rejection Correction (DBRC) developed by Becker et al [10], was implemented in the Monte Carlo code. All cases were converged very tightly, so that the standard deviation in any case was less than 10 pcm, and the Doppler reactivity could be determined with little statistical uncertainty. Table I summarizes the results for all cases in terms of K-effective.
Table I: Monte Carlo K-effective values for different temperature profiles.
Case Temperature Profile
Average Fuel Temperature (K) K-effective
1 Flat 450 1.390342 Flat 900 1.370233 Flat 1350 1.353924 Quadratic 900 1.371645 Quadratic 1350 1.355886 Inverted 1350 1.35293

Effect of CASMO-5 Cross-Section Data and Doppler Temperature Definitions on LWR Reactivity Initiated Accidents
PHYSOR 2010 – Advances in Reactor Physics to Power the Nuclear Renaissance Pittsburgh, Pennsylvania, USA, May 9-14, 2010
5/13
The Doppler reactivity effects are linear with the perturbation in the square root of the fuel temperature. Therefore, k-effective values for any fuel temperature can be well approximated using the Table I flat temperature data. Performing this procedure, the Doppler reactivity worth can be evaluated for the different effective Doppler temperature definitions mentioned above, i.e. ‘BE1’, ‘NEA’ and ‘GDTL’. Another effective Doppler temperature, namely ‘BE2’, will be defined by Eq. (4) below. Results for all four effective Doppler temperatures are compared in Table II against the exact reactivity computed using the non-uniform temperature profiles.
Table II: Doppler reactivity for different definitions of effective Doppler temperature.
Note that, the use of the ‘BE1’ effective temperature over-estimates the Doppler reactivity for quadratic profiles, and under-estimates the Doppler reactivity for the inverted temperature profile. The ‘NEA’ temperature under-estimates the Doppler reactivity for quadratic temperature profiles. The opposite is true for inverted temperature profiles. The ‘GDTL’ always underestimates the Doppler reactivity, thus rendering conservative results for LWR reactivity initiated accidents. ‘GDTL’ performs very well for a typical HFP quadratic temperature profile; the improvement with respect to ‘BE1’ is noticeable. For higher quadratic temperature profiles, the Doppler feedback is under-estimated by ~5%; and for the inverted temperature profile ~4%. Using the k-effective values of Table II, one can define another effective Doppler temperature, namely ‘BE2’. The ‘BE2’ effective Doppler temperature is defined such that its Doppler reactivity matches the exact reactivity for the non-uniform cases. The ‘BE2’ Doppler temperature (TBE2) is written as a weighted average of the volume-averaged temperature (TBE1), and the fuel surface temperature (TS),
SBEBE TTT )1(12 (4) where the value of is empirically adjusted to match the reactivity between the case 1 (representative of HZP) and case 4 (representative of HFP). Effective Doppler temperatures computed using Eq. (4) with
0.92, for the pin cell problem are presented in Table VI on Appendix A. Last column in Table II compares the ‘BE2’ Doppler reactivity worth. Note that error introduced by the ‘BE2’ approximation, for all cases presented here, is lower than 1.5%.
From Case
To Case Exact BE1 NEA GDTL BE2 BE1 NEA GDTL BE2
1 4 -981 -1056 -675 -975 -981 7.7 -31.2 -0.6 0.0
1 5 -1828 -1935 -1247 -1732 -1802 5.8 -31.8 -5.3 -1.4
1 6 -1989 -1935 -2392 -1915 -2000 -2.7 20.3 -3.7 0.6
Error (%)Doppler Reactivity (Delta-K/K)Description

Gerardo Grandi et.al.
PHYSOR 2010 – Advances in Reactor Physics to Power the Nuclear Renaissance Pittsburgh, Pennsylvania, USA, May 9-14, 2010
6/13
4. DESCRIPTION OF THE ROD EJECTION ACCIDENT SCENARIO The problem consists in analyzing a rod ejection in a PWR MOX/UO2 core at Hot Zero Power conditions: 10-4 rated power, core inlet temperature 560 K, core pressure 15.5 MPa. The model was constructed based on the OECD “PWR MOX/UO2 Core Transient Benchmark [12].” It is important to remark that:
Cross sections were generated using CASMO-4 / ENDF/B IV and CASMO-5 / ENDF/B VII.0. The known state of the core (history data) was assumed to be the same regardless of the cross-
section set used in the transient calculations. The 3D fuel temperature distribution is evaluated by solving the one-dimensional, radial heat
conduction equation for the average pin of each node. For safety evaluations, all the pins for each node may be modeled [2]. The closed channel thermal hydraulics module provides the temperature of the coolant surrounding the pin which serves as the boundary condition for the fuel temperature calculation.
Fuel thermal conductivity for UO2 and MOX are computed using the Nuclear Fuel Industries correlations as reported in reference [14].
The gap conductance model is taken from the INTERPIN-4 code [15] and it is functionalized versus exposure and temperature.
The intra-pellet power profiles are a function of the fuel type (MOX/UO2) and burnup. Values were taken from INTERPIN-4. Fig. 2 illustrates those profiles for 0.0 GWd/T, 20 GWd/T and 40 GWd/T.
All the control rod banks are fully inserted and all the shutdown banks are fully withdrawn. The initial boron concentration is determined to make the reactor critical in steady state. Note that in the OECD benchmark; only one of the four rods in position E5 is ejected. However, in the present work all four rods are ejected. The rod ejection starts at time 0 seconds and the rods are ejected in 0.1 s. The transient is followed for 5 s. The chosen spatial discretization is: radial mesh of 2x2 nodes per assembly ( x=10.7 cm) and 24 axial nodes ( z=15.24 cm). The fuel pellet is divided in nine equal volume rings, and the cladding in two rings. Following the recommendation from Grandi [16], solutions were obtained with a small time step (0.1 ms) to avoid any spurious effect from the numerical integration.
5. RESULTS Results for two different exercises will be discussed in what follows. The objective of the first exercise is to assess the effect of the CASMO-5 nuclear data on the rod ejection accident key parameters, namely: peak power, time of peak power, peak power width, and peak fuel enthalpy. The objective of the second exercise is to assess the influence of the Doppler temperature definition on the previously mentioned parameters.
5.1. Effect of the CASMO-5 Cross-Section Data In this subsection, all the calculations are performed using the ‘BE1’ effective Doppler temperature defined by Eq. (1). For simplicity, the S3K results obtained using CASMO-4 nuclear data will be referred as ‘CASMO-4’ case or solution; the results computed using CASMO-5 data will be labeled ‘CASMO-5’; and finally, the results computed using CASMO-5 data with the asymptotic scattering kernel (i.e. without the CASMO-5 resonance elastic scattering model active) will be labeled ‘CASMO-5 Asymptotic’. Table III presents relevant static -fraction, the static rod worth

Effect of CASMO-5 Cross-Section Data and Doppler Temperature Definitions on LWR Reactivity Initiated Accidents
PHYSOR 2010 – Advances in Reactor Physics to Power the Nuclear Renaissance Pittsburgh, Pennsylvania, USA, May 9-14, 2010
7/13
(SRW) - re average Doppler . The main observations derived from Table III are:
Relative differences in rod worth between ‘CASMO-5’ and ‘CASMO-4’ are less than 1%. No significant differences are observed in the core- *
A difference of ~10% is observed in the Doppler coefficient. This result is consistent with the lattice results presented in Fig. 1.
.
Differences in Doppler coefficient between ‘CASMO-5’ and ‘CASMO-4’ due to differences in the nuclear data (i.e., ENDF/B VII.0 vs. ENDF/B IV) are less than 1.5%. The difference in Doppler coefficient is mainly due to the 238U resonance elastic scattering treatment.
It is expected, that the rod ejection accident computed with CASMO-5 cross-sections will be milder. The total energy released during the power burst is proportional to the ratio of the prompt reactivity and the Doppler coefficient. This ratio is ~11% smaller if CASMO-5 data is used instead of CASMO-4 data.
Table III: Steady state REA parameters. Effect of CASMO-5 cross-section data.
Fig. 3 compares the power evolution for the ‘CASMO-4’ and ‘CASMO-5’ cases. Note that the ‘CASMO-5’ solution has a lower power peak, and a smaller peak width, and the energy release during the power excursion is smaller.
(a) Period 0.0 s to 2.0 s. Logarithmic scale. (b) Period 0.1 s to 0.2 seconds. Linear scale
Figure 3. Power evolution. Effect of CASMO-5 cross-section data.
* CASMO-5 delayed neutron fractions are not based on ENDF/B VII.0 data, but on the ENDF/B IV data used by CASMO-4.
Value Diff (%) Value Diff (%)Critical Boron (ppm) 1737 1738 0.1 1740 0.2SRW (pcm) 870 863 -0.8 864 -0.7
(pcm) 544 544 0.0 545 0.2(1.E-05 s) 1.46 1.48 1.4 1.48 1.4
($) 1.60 1.59 -0.8 1.59 -0.9(pcm) 326 319 -2.1 319 -2.1
(pcm/K) -2.93 -3.24 10.6 -2.97 1.4
CASMO-5Asymptotic kernelParameter CASMO-4
CASMO-5Exact kernel
1.E-04
1.E-03
1.E-02
1.E-01
1.E+00
1.E+01
1.E+02
1.E+03
1.E+04
0.00 0.50 1.00 1.50 2.00
Time (s)
Rel
ativ
e Po
wer
(% R
ated
Pow
er)
CASMO-4CASMO-5
0
1000
2000
3000
4000
5000
6000
0.10 0.12 0.14 0.16 0.18 0.20
Time (s)
Rel
ativ
e Po
wer
(% R
ated
Pow
er)
CASMO-4CASMO-5

Gerardo Grandi et.al.
PHYSOR 2010 – Advances in Reactor Physics to Power the Nuclear Renaissance Pittsburgh, Pennsylvania, USA, May 9-14, 2010
8/13
Fig. 4 compares the Doppler reactivity feedback and the (core average) Doppler temperature evolution during the rod ejection accident.
Figure 4. Doppler reactivity and Doppler temperature. Effect of CASMO-5 cross-section data. Note that the Doppler reactivity is the same in the ‘CASMO-4’ and ‘CASMO-5’ cases. This result is counter intuitive due the more negative fuel temperature coefficient reported in Table III. However, since the external positive reactivity inserted in both cases differ only ~7 pcm; the Doppler reactivity to compensate the inserted reactivity must be approximately the same. Due to the ~10% difference in the Doppler coefficient (see Table III), the Doppler temperature increase in the ‘CASMO-5’ case is ~10% smaller. Table IV summarizes the rod ejection accident results, in terms of power and fuel enthalpy, for ‘CASMO-4’, ‘CASMO-5’, and ‘CASMO-5 Asymptotic’ cases. The main observations derived from Table IV are:
The energy release in the ‘CASMO-5’ case is 88 % of the energy release in the ‘CASMO-4’ case. Since the energy release is smaller in ‘CASMO-5’ and the peaking factors during the transient are
almost identical (not shown), the enthalpy rise in the ‘CASMO-5’ case is approximately ~88% of the enthalpy rise in the ‘CASMO-4’ case.
The resonance treatment implemented in ‘CASMO-5’ is the key element for the fuel enthalpy reduction during this transient.
-1.00
-0.80
-0.60
-0.40
-0.20
0.00
0.20
0.0 0.5 1.0 1.5 2.0 2.5 3.0
Time (s)
Dop
pler
Rea
ctiv
ity ($
)
CASMO-4CASMO-5
-1.00
-0.95
-0.90
-0.85
-0.80
0.0 1.0 2.0 3.0 4.0 5.0Time (s)
Dop
pler
Rea
ctiv
ity ($
)
500
550
600
650
700
750
0.0 0.5 1.0 1.5 2.0 2.5 3.0
Time (s)
Dop
pler
Tem
pera
ture
(K)
CASMO-4CASMO-5

Effect of CASMO-5 Cross-Section Data and Doppler Temperature Definitions on LWR Reactivity Initiated Accidents
PHYSOR 2010 – Advances in Reactor Physics to Power the Nuclear Renaissance Pittsburgh, Pennsylvania, USA, May 9-14, 2010
9/13
Table IV: REA transient parameters. Effect of CASMO-5 cross-section data.
5.2. Effect of the Doppler Temperature Definition In this subsection, all the results are obtained using CASMO-5 cross-section data. All four different effective Doppler temperature definitions will be used: ‘BE1’, the volume-averaged effective Doppler temperature defined by Eq. (1); ‘NEA’, the weighted average of the surface and centerline temperatures defined by Eq. (2), ‘GDTL’ defined by Eq. (3) and ‘BE2’ the weighted average defined by Eq. (4). Fig. 5 compares the power evolution for the Doppler temperatures definition mentioned above. The ‘BE1’, ‘BE2’ and ‘GDTL’ solutions show a similar behavior. The ‘NEA’ solution shows a smaller power peak, but reaches a higher after-burst power level.
(a) Period 0.0 s to 2.0 s. Logarithmic scale. (b) Period 0.1 s to 0.2 seconds. Linear scale
Figure 5. Power evolution. Effect of the Doppler temperature definitions.
Value Diff (%) Value Diff (%)
Peak power (MW) 196400 168700 -14.1 183800 -6.4
Peak power time (s) 0.144 0.146 1.4 0.147 2.1
Pulse width (ms) 17.7 18.2 2.8 18.2 2.8
Pulse energy release (MJ) 3476 3070 -11.7 3345 -3.8
Peak power part time (s) 0.1617 0.1642 1.5 0.1652 2.2
Prompt fuel enthalpy (cal/g) 44.94 41.81 -7.0 44.24 -1.6
Prompt enthalpy rise (cal/g) 27.84 24.71 -11.2 27.14 -2.5
Peak fuel enthalpy (cal/g) 47.39 44.49 -6 46.63 -2
Peak enthalpy rise (cal/g) 30.29 27.39 -10 29.53 -3
CASMO-5Asymptotic kernelParameter CASMO-4
CASMO-5Exact kernel
1.E-04
1.E-03
1.E-02
1.E-01
1.E+00
1.E+01
1.E+02
1.E+03
1.E+04
0.00 0.50 1.00 1.50 2.00
Time (s)
Rel
ativ
e Po
wer
(% R
ated
Pow
er)
NEABE1BE2GDTL
0
1000
2000
3000
4000
5000
0.10 0.12 0.14 0.16 0.18 0.20
Time (s)
Rel
ativ
e Po
wer
(% R
ated
Pow
er)
NEABE1BE2GDTL

Gerardo Grandi et.al.
PHYSOR 2010 – Advances in Reactor Physics to Power the Nuclear Renaissance Pittsburgh, Pennsylvania, USA, May 9-14, 2010
10/13
Fig.6 shows the evolution of the Doppler reactivity and the Doppler temperature during the transient. During the initial rapid power increase the problem is almost adiabatic, and the pin fuel temperature peaks near the pellet surface due to the intra-pellet power shape (see Fig. 2). As the transient progresses, the heat conduction in the pin gradually reduces the surface temperature with respect to the centerline temperature. This behavior is illustrated in Fig. 7 for a pin in a fresh MOX assembly close to the ejected rod, and a pin in the UO2 assembly where the rod is ejected.
Figure 6. Doppler reactivity and Doppler temperature. Effect of Doppler temperature definitions.
Figure 7. Evolution of the intra-pellet fuel temperature for 2 representative fuel pins. Table V summarizes the rod ejection accident results, in terms of power and fuel enthalpy, for the four different effective Doppler temperature cases. Differences with respect to the ‘BE1’ solution are also provided. The main observations derived from Table V and Figs. 5-7 are:
The ‘NEA’ effective Doppler temperature may predict a lower power peak depending on the core life. However, the power generated in the after-burst computed using by the ‘NEA’ Doppler temperature will always be the highest because the heat conduction in the pin gradually increases the centerline temperature with respect to the surface temperature.
-1.00
-0.80
-0.60
-0.40
-0.20
0.00
0.20
0.0 0.5 1.0 1.5 2.0 2.5 3.0
Time (s)
Dop
pler
Rea
ctiv
ity ($
)
NEABE1BE2GDTL
-1.00
-0.95
-0.90
-0.85
-0.80
0.0 1.0 2.0 3.0 4.0 5.0Time (s)
Dop
pler
Rea
ctiv
ity ($
)
500
550
600
650
700
0.0 0.5 1.0 1.5 2.0 2.5 3.0
Time (s)D
oppl
er F
uel T
empe
ratu
re (K
)
NEABE1BE2GDTL
MOX Fuel - Burnup 0.15 GWd/T
500600700800900
100011001200
0 0.2 0.4 0.6 0.8 1
Relative radius
Tem
pera
ture
(K)
Time (s)0.0000.1400.1450.1500.1600.2040.5041.0042.0045.000
UO2 Fuel - Burnup 37.5 GWd/T
500600700800900
100011001200
0 0.2 0.4 0.6 0.8 1
Relative radius
Tem
pera
ture
(K)
Time (s)0.0000.1400.1450.1500.1600.2040.5041.0042.0045.000

Effect of CASMO-5 Cross-Section Data and Doppler Temperature Definitions on LWR Reactivity Initiated Accidents
PHYSOR 2010 – Advances in Reactor Physics to Power the Nuclear Renaissance Pittsburgh, Pennsylvania, USA, May 9-14, 2010
11/13
The ‘NEA’ definition produces larger pulse widths as noted by other researchers [4]. This effect partially compensates the lower power peak, and the energy generated during the power excursion differs only 1% with respect to the ‘BE1’ case.
The prompt enthalpy rise is barely affected by the choice of the Doppler temperature definition. However, the maximum fuel enthalpy could be affected. The under-prediction of the Doppler reactivity by the ‘NEA’ temperature results in a conservative estimate of the peak fuel enthalpy.
Table V: Transient parameters: effect of the Doppler temperature definition
6. CONCLUSIONS The effect of the cross-section data generated by CASMO-5, as well as the impact of different effective Doppler temperature definitions on LWR RIA was investigated. Key parameters of a PWR rod ejection accident scenario for a MOX/UO2 core assuming the known core state have been compared. The main conclusions are:
The LWR Doppler coefficient predicted using CASMO-5 cross-section data is ~10% more negative at typical HZP conditions.
The proper treatment of the 238U resonance elastic scattering is the main contributor to the more negative Doppler coefficient.
The use of the volume-averaged Doppler temperature, Eq. (1), may overestimate the Doppler reactivity. The ‘NEA’, Eq. (2), effective Doppler temperature definition leads to very conservative results because the Doppler worth is underestimated ~30% for quadratic profiles.
Temperature distribution effects for Doppler could be accurately accounted by the empirical weighting scheme described by Eq. (4).
LWR RIA calculated using CASMO-5 cross-section data should be milder. This means that the fuel safety parameters computed with CASMO-5 core-section data show more margin than the same parameters computed using CASMO-4 data for PWR rod ejection accidents and BWR rod drop accidents.
The prompt enthalpy rise is barely affected by the choice of the Doppler temperature definition. The under-prediction of the Doppler reactivity by the ‘NEA’ Doppler temperature results in a conservative estimate of the peak fuel enthalpy. Results computed with the ‘BE1’, ‘BE2’, and ‘GDTL’ effective Doppler temperatures, differ only a few percent.
Value Diff (%) Value Diff (%) Value Diff (%)
Peak power (MW) 168700 162500 -3.7 167600 -0.7 170200 0.9
Peak power time (s) 0.146 0.146 0.0 0.146 0.0 0.146 0.0
Pulse width (ms) 18.2 18.7 2.7 18.2 0.0 18.1 -0.5
Pulse energy release (MJ) 3070 3039 -1.0 3050 -0.7 3081 0.3
Peak power part time (s) 0.1642 0.1647 0.3 0.1642 0.0 0.1641 -0.1
Prompt fuel enthalpy (cal/g) 41.81 41.63 -0.4 41.73 -0.2 41.97 0.4
Prompt enthalpy rise (cal/g) 24.71 24.53 -0.7 24.63 -0.3 24.87 0.6
Peak fuel enthalpy (cal/g) 44.39 51.32 15.6 45.48 2.5 43.72 -1.5
Peak enthalpy rise (cal/g) 27.29 34.22 25.4 28.38 4.0 26.62 -2.5
GDTLParameter BE1 NEA BE2
Gerardo Grandi et.al.
PHYSOR 2010 – Advances in Reactor Physics to Power the Nuclear Renaissance Pittsburgh, Pennsylvania, USA, May 9-14, 2010
12/13
Further investigation of the CASMO-5 cross-section effects shall be performed using realistic UO2/MOX core designs in which the core state depends on the cross-section data set. Also, the CASMO-5 cross-section effects will be conducted for two other S3K mainstream applications, namely: BWR stability and fast operational transients.
REFERENCES 1. J. Borkowski, J. Rhodes, P. Esser, K. Smith, “Three Dimensional Transient Capability in
SIMULATE-3,” Trans. Am. Nucl. Soc., 71, 456, (1994). 2. G. Grandi and K. Smith, “SIMULATE-3K Explicit Fuel Pin Modelling in RIAs,” Trans. Am. Nucl.
Soc., 96, 627, (2007). 3. J. L. Eller, “Application of SIMULATE-3K To PWR Reactivity Insertion Accident,” Advances in
Nuclear Fuel Management (ANFM 2009), Hilton Head Island, South Carolina, April 12-15, on CD-ROM, (2009).
4. H. Ferroukhi, M.A. Zimmermann, “Study of the PWR REA Pulse Width for Realistic UO2 and MOX Core Designs using 3-D Kinetics,” Annals of Nuclear Energy, 36, pp.274-280 (2009).
5. K. Smith and J. Rhodes, “CASMO-4 Characteristic Methods for Two Dimensional PWR and BWR Core Calculations,” Trans. Am. Nucl. Soc., 83, 322, (2000).
6. J. Rhodes, K. Smith and D. Lee, “CASMO-5 Development and Applications,” Advances in Nuclear Analysis and Simulation (PHYSOR 2006), Vancouver, BC, Canada, September 10-14, (2006).
7. D. Lee, K. Smith and J. Rhodes, “The Impact of 238U Resonance Elastic Scattering Approximations on Thermal Reactor Doppler Reactivity,” Annals of Nuclear Energy, 36, pp.274-280 (2009).
8. D. Lee, J. Rhodes, K.Smith, “Quadratic Depletion Model for Gadolinium Isotopes in CASMO-5,” Advances in Nuclear Fuel Management IV (ANFM 2009), South Carolina, April 12-15, on CD-ROM, (2009).
9. A. Yamamoto, M. Tabuchi, N. Sugimura, T. Ushio And M. Mori, “Derivation of Optimum Polar Angle Quadrature Set for the Method of Characteristics Based on Approximation Error for the Bickley Function,” J. Nucl. Sci. Technol., 44, pp. 129-136 (2007).
10. B. Becker, R. Dagan, and G. Lohnert, “Proof and Implementation of the Stochastic Formula for Ideal Gas, Energy Dependent Scattering Kernel,” Annals of Nuclear Energy, 36, pp.1170-1183 (2009).
11. Y. Danon, E. Liu, D. Barry, and T. Ro, “Benchmark Experiment of Neutron Resonance Scattering Models In Monte Carlo Codes,” International Conference on Mathematics, Computational Methods and Reactor Physics (M&C 2009), Saratoga Springs, New York, May 3-7, on CD-ROM, (2009).
12. T. Kozlowski, T. J. Downar, “The PWR MOX/UO2 Core Transient Benchmark, Final Report”, NEA/NSC/DOC(2006)20.
13. A. O. Goltsev et al, “The Influence of a Non-Uniform Radial Temperature Distribution in the Fuel on the Results of Calculations of Transients,” Annals of Nuclear Energy, 30, pp.1135-1153 (2003).
14. D.D. Lanning, et al., “FRAPCON-3 Updates,” NUREG/CR-6534, Vol. 4, PNL-11513, (2005). 15. G. Grandi and D. Hagrman, “Improvements to the INTERPIN Code for High Burnup and MOX
Fuel,” Trans. Am. Nucl. Soc., 96, 614-615, (2007). 16. G. Grandi, “Effect of the Discretization and Neutronic Thermal Hydraulic Coupling on LWR
Transients,” Proceedings of the 13th International Topical Meeting on Nuclear Reactor Thermal Hydraulics (NURETH-13), Kanazawa, Ishikawa-Ken, Japan, September 27-October 2, on CD-ROM, (2009).
Effect of CASMO-5 Cross-Section Data and Doppler Temperature Definitions on LWR Reactivity Initiated Accidents
PHYSOR 2010 – Advances in Reactor Physics to Power the Nuclear Renaissance Pittsburgh, Pennsylvania, USA, May 9-14, 2010
13/13
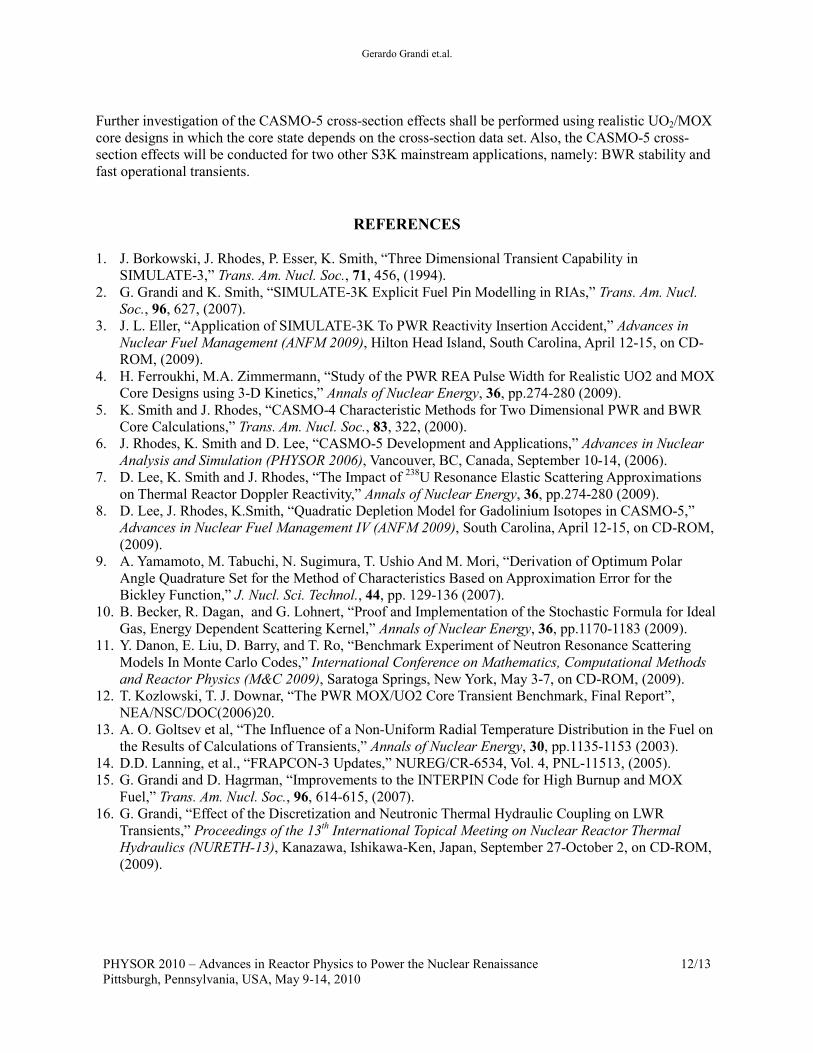
APPENDIX A: EFFECTIVE DOPPLER TEMPERATURE PROBLEM The geometry consists of a single pin-cell in a square lattice. The fuel is UO2 fuel, 3.527 % enriched, density 10.2 g/cm3. The cladding is Zirconium, density 6.550 g/cm3. The coolant is water, density 0.7116 g/cm3. The outer fuel pellet radius is 0.410 cm, the outer clad radius 0.475 cm and the pin pitch 1.26 cm. The fuel pellet was divided into 9 equal volume rings. Six cases were examined using this geometry. Case 1 consists of flat temperature profile within a pin at hot zero power conditions. Cases 2 and 3 are flat temperature profiles at normal and high power conditions respectively. Cases 4 and 5 represent quadratic temperature profiles at normal and high power conditions. Finally, in case 6, the temperature resembles the intra-pellet power distribution in a high burned pellet. In all cases the cladding and coolant temperatures are assumed to be 450 K. Table VI summarizes the conditions for each of the test cases. The alternative effective Doppler temperatures, computed using the equations in section 3, are also provided for completeness.
Table VI: Fuel Temperature Definitions
The results are used to determine the effect of including the temperature profile across the pin, and to determine an appropriate weighting scheme in a steady state or transient nodal simulator. By comparing the differences between Cases 2 and 4, Cases 3 and 5, and Cases 3 and 6 one can determine the impact of correctly modeling the temperature distribution.
Ring 1 450 900 1350 1300 2150 1200Ring 2 450 900 1350 1200 1950 1200Ring 3 450 900 1350 1100 1750 1200Ring 4 450 900 1350 1000 1550 1260Ring 5 450 900 1350 900 1350 1300Ring 6 450 900 1350 800 1150 1350Ring 7 450 900 1350 700 950 1400Ring 8 450 900 1350 600 750 1440Ring 9 450 900 1350 500 550 1800
450 900 1350 450 450 1800450 900 1350 900 1350 1350450 900 1350 1350 2250 1200
BE1 (Eq. 1) NEA (Eq. 2) GDTL (Eq. 3) BE2 (Eq. 4)
Case 3 Case 4 Case 5 Case 6Case 1 Case 2
450450
450
900900
900450 900
1350
900720
863
135013501350 860
1276
13501620
1387
1350990
1238 1339
Ave
rage
Tem
pera
ture
(K)
Dop
pler
Te
mpe
ratu
res
(K)
Surface Temp. (K)Average Temp. (K)
Centerline Temp. (K)