EFFECT OF CAPITAL STRUCTURE ON FINANCIAL PERFORMANCE...
52
EFFECT OF CAPITAL STRUCTURE ON FINANCIAL PERFORMANCE OF FIRMS LISTED AT THE NAIROBI SECURITIES EXCHANGE ROBERT OGINDA SIRO D61/63241/2011 A RESEARCH PROJECT PRESENTED IN PARTIAL FULFILLMENT OF THE REQUIREMENTS FOR THE DEGREE OF MASTER OF BUSINESS ADMINISTRATION OF THE UNIVERSITY OF NAIROBI. OCTOBER 2013
-
Upload
nguyendiep -
Category
Documents
-
view
218 -
download
1
Transcript of EFFECT OF CAPITAL STRUCTURE ON FINANCIAL PERFORMANCE...
EFFECT OF CAPITAL STRUCTURE ON FINANCIAL PERFORMANCE OF FIRMS
LISTED AT THE NAIROBI SECURITIES EXCHANGE
ROBERT OGINDA SIRO
D61/63241/2011
A RESEARCH PROJECT PRESENTED IN PARTIAL FULFILLMENT OF THE
REQUIREMENTS FOR THE DEGREE OF MASTER OF BUSINESS
ADMINISTRATION OF THE UNIVERSITY OF NAIROBI.
OCTOBER 2013
i
DECLARATION
This research project is my original work and has not been presented to any other institution or
university.
Sign_________________ Date _______________
ROBERT OGINDA SIRO
This research project has been submitted for examination with our approval as the university
supervisor.
Sign_________________ Date _______________
MR: CYRUS IRAYA
Lecturer.
Department of Accounting and Finance,
School of Business,
University of Nairobi

ii
ACKNOWLEDGEMENT
I thank God the almighty for giving me the means courage and strength and perseverance to
complete the project also great appreciation goes to my supervisor for his time and dedication to
ensure that I completed the project.

iii
DEDICATION
This project is dedicated to my family members for the prayers and encouragement.
May the Lord, God Almighty bless them abundantly.
iv
ABSTRACT
The choice between debt and equity financing has been directed to seek the optimal capital
structure. Several studies show that a firm with high leverage tends to have an optimal capital
structure and therefore it leads it to produce good performance, while the Modigliani-Miller
theorem proves that it has no effect on the value of firm. The importance of these issues has only
motivated researchers to examine the relationship between capital structure and firms financial
performance. The objective of this study was to establish the effects of capital structure on
financial performance of listed firms on securities exchange in Kenya.
The financial performance was measured in terms of return on equity while capital structure was
measured in terms of debt ratio. The period of study was 2012. It is important to note that during
this period of study, Kenya experienced political anxiety, leading to uncertainty in the securities
market. This presents an interesting period of study considering the ups and downs of the trade
cycle. The population of study consisted of all the 61 listed firms duly registered with capital
market authority of Kenya in 2012. Secondary data used was obtained from the Nairobi
securities exchange handbook and also in firm’s publications. Data analysis was done by use of
regression analysis model with the help of Statistical Package for Social sciences Software.
The results obtained reveal that there was an inverse relationship between capital structure and
financial performance of listed firms in securities exchange in Kenya. The findings indicate that
the higher the debt ratio, the less the return on equity which therefore supports the need to
increase more capital injection rather than borrowing, as the benefits of debt financing are less
than its cost of funding.

TABLE OF CONTENTS
DECLARATION ..................................................................................................................... i
ACKNOWLEDGEMENT ...................................................................................................... ii
DEDICATION ....................................................................................................................... iii
ABSTRACT ........................................................................................................................... iv
CHAPTER ONE ......................................................................................................................1
INTRODUCTION ...................................................................................................................1
1.1 Background .......................................................................................................................1
1.1.1 Capital Structure .............................................................................................................4
1.1.2 Financial Performance ....................................................................................................5
1.1.3 Capital Structure and financial performance ....................................................................6
1.1.4 Nairobi securities exchange.............................................................................................8
1.3 Objective of the study ...................................................................................................... 11
CHAPTER TWO ................................................................................................................... 13
LITERATURE REVIEW ...................................................................................................... 13
2.1 Introduction ..................................................................................................................... 13
2.2. Capital Structure Theory ................................................................................................. 13
2.2.1 Trade-off theory of Capital Structure and Taxes ............................................................ 14
2.2.2 Pecking Order Theory ................................................................................................... 15

2.3 Empirical evidence .......................................................................................................... 17
2.4 Summary ......................................................................................................................... 20
CHAPTER THREE ............................................................................................................... 23
RESEARCH METHODOLOGY .......................................................................................... 23
3.1 Introduction ..................................................................................................................... 23
3.2 Research Design .............................................................................................................. 23
3.3 Study Population.............................................................................................................. 23
3.4 Data Collection method ................................................................................................... 23
3.5 Data Analysis ................................................................................................................... 23
3.6 Measurement of Variables ............................................................................................... 24
3.6.1 Debt ratio ...................................................................................................................... 24
3.6.2 Firm Performance ...................................................................................................... 25
CHAPTER FOUR ................................................................................................................. 26
DATA ANALYSIS, FINDINGS AND DISCUSSIONS ...................................................... 26
4.1 Introduction ..................................................................................................................... 26
4.2 Regression analysis .......................................................................................................... 26
Table 4.2.0 ANOVA .............................................................................................................. 27
Table 4.2.1 Coefficients ......................................................................................................... 28
Table 4.2.2 Model Summary .................................................................................................. 29

CHAPTER FIVE ................................................................................................................... 31
SUMMARY, CONCLUSIONS AND RECOMMENDATIONS .......................................... 31
5.1 Introduction ..................................................................................................................... 31
5.2 Summary and conclusions ............................................................................................... 31
5.3 Policy Recommendations ................................................................................................. 32
5.4 Limitations of the study ................................................................................................... 34
5.5 Suggestions for Further Studies........................................................................................ 34
REFERENCES ...................................................................................................................... 36
APPENDIX I OF LISTED FIRMS ....................................................................................... 40

LIST OF TABLES
Table 4.2.0 ANOVA 20

ABBREVIATIONS AND ACRONYMS
NSE Nairobi Securities Exchange
CS Capital structure
1
CHAPTER ONE
INTRODUCTION
1.1 Background
To understand how companies finance their operations, it is necessary to examine the
determinants of their financing or capital structure decisions. Company financing decisions
involve a wide range of policy issues. At the private, they have implications for capital market
development, interest rate and security price determination, and regulation. At the private, such
decisions affect capital structure, corporate governance and company development (Green,
Murinde and Suppakitjarak, 2002).
Knowledge about capital structures has mostly been derived from data from developed
economies that have many institutional similarities (Booth et al., 2001). It is important to note
that different countries have different institutional arrangements, mainly with respect to their tax
and bankruptcy codes, the existing market for corporate control, and the roles banks and
securities markets play.
Capital structure refers to a mixture of a variety of long term sources of funds and equity shares
including reserves and surpluses of an enterprise. The historical attempt to building theory of
capital structure began with the presentation of a paper by Modigliani & miller (MM) (1958).
They revealed the situations under what conditions that the CS is relevant or irrelevant to the
financial performance of the listed companies. Most of the decision making process related to the
CS are deciding factors when determining the CS, a number of issues e.g. cost, various taxes and
rate, interest rate have been proposed to explain the variation in Financial Leverage across firms
2
(Van Horne,1993;Hampton,1998; Titman and Wessels,1998).these issues suggested that the
depending on attributes that caused the cost of various sources of capital the firm’s select CS and
benefits related to debt and equity financing.
The relationship between capital structure and financial performance is one that received
considerable attention in the finance literature. How important is the concentration of control for
the company performance or the type of investors exerting that control are questions that authors
have tried to answer for long time prior studies show that capital structure has relating with
corporate governance, which is the key issues of state owned enterprise.
To study the effects of capital structure or financial performance, will help us to know the
potential problems in performance and capital structure. The study on capital structure attempts
to explain the mix of securities and financing sources used by companies to finance investments
(Myers, 2001). Brigham (2004) referred to Capital structure as the way in which a firm finances
its operations which can either, be through debt or equity capital or a combination of both.
According to Myers (2001), there was no universal theory on the debt to equity choice but noted
that there were some theories that attempted to explain the capital structure mix. Myers (2001)
cited the tradeoff theory which states that firms seek debt levels that balance the tax advantages
of additional debt against the costs of possible financial distress.
The pecking order theory states that firms will borrow rather than issue equity when internal cash
flow is not sufficient to fund capital expenditure (Myers, 2001). The theory concluded that the
amount of debt will reflect the firms’ cumulative need for external funds. The free cash flow
theory on the other hand stated that dangerously high debt levels would increase firm value
3
despite the threat of finance distress when a firms’ operating cash flow significantly exceed its
profitable investment opportunities.
Financial performance is a subjective measure of how well a firm can use its’ assets from its’
primary business to generate revenues. Erasmus (2008) noted that financial performance
measures like profitability and liquidity among others provided a valuable tool to stakeholders to
evaluate the past financial performance and the current position of a firm. Brigham and Gapenski
(1996) argued that in theory, the Modigliani and Miller model was valid however in practice,
bankruptcy costs did exist and that these costs were directly proportional to the debt levels in a
firm. This conclusion implied a direct relationship between capital structure and financial
performance of a firm.
Financing and investment are two major decision areas in a firm. In the financing decision the
manager is concerned with determining the best financing mix or capital structure for his firm.
Capital structure decision is the mix of debt and equity that a company uses to finance its
business (Damodaran, 2001). Capital structure has been a major issue in financial economics
ever since Modigliani and Miller showed in 1958 that given frictionless markets, homogeneous
expectations; capital structure decision of the firm is irrelevant.
Berger & di Patti (2006) concluded that more efficient firms were more likely to earn a higher
return from a given capital structure, and that higher returns can act as a cushion against portfolio
risk so that more efficient firms are in a better position to substitute equity for debt in their
capital structure. This is an incidental of the trade-off theory of capital structure where
4
differences in efficiency enable firms to alter their optimal capital structure either upward or
downwards. In addition, Singh & Hamid (1992) in their research used data on the largest
companies in selected developing countries and found that firms in developing countries used
more of debt finance in financing their growth than was the case in industrialized countries. Abor
(2005) also found a positive relationship between total assets and return on equity and that
profitable firms in Ghana depended more on debt as a main financing option due to a Perceived
low financial risk.
1.1.1 Capital Structure
A firm’s capital structure refers to the mix of its financial liabilities. As financial capital is an
uncertain but critical resource for all firms, suppliers of finance are able to exert control over
firms (Harris and Raviv, 1991). Debt and equity are the two major classes of liabilities, with debt
holders and equity holders representing the two types of investors in the firm. Each of these is
associated with different levels of risk, benefits, and control. It is the way the corporation
finances its assets through some combination of equity, debt, or hybrid securities. A firm’s
capital structure is then a composition or structures of its liabilities.
A mix of a company's long-term debt, specific short-term debt, common equity and preferred
equity. The capital structure is how a firm finances its overall operations and growth by using
different sources of funds. Debt comes in the form of bond issues or long-term notes payable,
while equity is classified as common stock, preferred stock or retained earnings. According to
Harris and Raviv (1991), the Consensus is that “leverage increase with fixed assets, non-debt tax
shields, investment Opportunities, and firm size, and decreases with volatility, advertising
5
expenditure, the probability Of bankruptcy, profitability, and uniqueness of the product.” Titman
and Wessel (1988) state that Asset structure, non-debt tax shields, growth, uniqueness, industry
classification, size, earnings Volatility and profitability are factors that may affect leverage
according to different theories of Capital structure. Still, other authors may provide another set of
potential determinants of capital Structure. This clearly shows that even if there is a consensus
among researchers what factor may constitute a minimum set of attributes (Harris and Raviv,
1991).
1.1.2 Financial Performance
A firm’s financial performance, in the view of the shareholder, is measured by how better off the
shareholder is at the end of a period, than he was at the beginning and this can be determined
using ratios derived from financial statements; mainly the balance sheet and income statement, or
using data on stock market prices (Berger and Patti, 2002). ). These ratios give an indication of
whether the firm is achieving the owners’ objectives of making them wealthier, and can be used
to compare a firm’s ratios with other firms or to find trends of performance over time. Charreaux
(1997) in Severin (2002), states that an adequate performance measure ought to give an account
of all the consequences of investments, on the wealth of shareholders. The main objective of
shareholders in investing in a business, is to increase their wealth. Thus the measurement of
performance of the business must give an indication of how wealthier the shareholder, has
become as a result of the investment over a specific time.
6
1.1.3 Capital Structure and financial performance
Hutchinson (1995) in his scholarly works argued that, financial leverage had a positive effect on
the firm’s return on equity provided that earnings’ power of the firm’s assets exceeds the average
interest cost of debt to the firm. Taub (1975) also found significantly positive relationship
between debt ratio and measures of profitability. Nerlove (1968), Baker (1973) and Petersen and
Rajan (1994) also identified positive association between debt and profitability but for industries.
In their study of leveraged buyouts, Roden and Lewellen (1995) established a significantly
positive relation between profitability and total debt as a percentage of the total buyout-financing
package.
However, some studies have shown that debt has a negative effect on firm profitability. Fama
and French (1998), for instance argue that the use of excessive debt creates agency problems
among shareholders and creditors and that could result in negative relationship between leverage
and profitability. Majumdar and Chhibber (1999) found in their Indian study that leverage has a
negative effect on performance. Gleason et al. (2000) support a negative impact of leverage on
the profitability of the firm. In a polish study, Hammes (1998) also found a negative relationship
between debt and firm’s profitability. In another study, Hammes (2003) examined the relation
between capital structure and performance by comparing Polish and Hungarian firms to a large
sample of firms in industrialized countries. He used panel data analysis to investigate the relation
between total debt and performance as well as between different sources of debt namely, bank
loans, and trade credits and firms’ performance measured by profitability. His results show a
significant and negative effect for most countries. He found that the type of debt, bank loans or
trade credit is not of major importance, what matters is debt in general.
7
Mesquita and Lara (2003), in their study found that the relationship between rates of return and
debt indicates a negative relationship for long-term financing. They however, found a positive
relationship for short-term financing and equity. Abor (2007) in his scholarly works on debt
policy and performance of Medium Sized Enterprises found the effect of short-term debt to be
significantly and negatively associated with gross profit margin for both Ghana and South
African firms. This indicated that increasing the amount of short-term debt would result in a
decrease in the profitability of the firms.
8
1.1.4 Nairobi securities exchange
The Nairobi Securities Exchange, which was formed in 1954 as a voluntary organization of
stockbrokers, is now one of the most active capital markets in Africa. The administration of the
Nairobi Securities Exchange is located on Tosica five storey building located at 55 Westlands
road Nairobi. As a capital market institution, the Nairobi Securities Exchange plays an important
role in the process of economic development. It helps mobilize domestic savings thereby
bringing about the reallocation of financial resources from dormant to active agents. Long-term
investments are made liquid, as the transfer of securities between shareholders is facilitated. The
Nairobi Securities Exchange has also enabled companies to engage local participation in their
equity, thereby giving Kenyans a chance to own shares. Companies can also raise extra finance
essential for expansion and development. To raise funds, a new issuer publishes a prospectus,
which gives all pertinent particulars about the operations and future prospects and states the price
of the issue. Nairobi Securities Exchange also enhances the inflow of international capital. They
can also be useful tools for privatization programmes.
The Nairobi Securities Exchange, which was formed in 1954 as a voluntary organization of
stockbrokers, is now one of the most active capital markets in Africa. As a capital market
institution, the Nairobi Securities Exchange plays an important role in the process of economic
development. It helps mobilize domestic savings thereby bringing about the reallocation of
financial resources from dormant to active agents. Long-term investments are made liquid, as the
transfer of securities between shareholders is facilitated.
9
The Nairobi Securities Exchange has also enabled companies to engage local participation in
their equity, thereby giving Kenyans a chance to own shares. Companies can also raise extra
finance essential for expansion and development. To raise funds, a new issuer publishes a
prospectus, which gives all pertinent particulars about the operations and future prospects and
states the price of the issue. Nairobi Securities Exchange also enhances the inflow of
international capital. They can also be useful tools for privatization programmes. It is generally
accepted that firms declaring stock distributions of 25 per cent or greater consider them as stock
splits which, therefore, have no effect on retained earnings. Stock distributions of less than 25
per cent are considered as stock dividends that reduce the retained earnings account.
1.2 Research Problem
A firm’s capital structure refers to the mix of its financial liabilities. It has long been an
important issue from the strategic management standpoint since it is linked with a firm’s ability
to meet the demands of various stakeholders (Roy and Minfang, 2000). Debt and equity are the
two major classes of liabilities, with debt holders and equity holders representing the two types
of investors in the firm. Each of these is associated with different levels of risk, benefits, and
control. While debt holders exert lower control, they earn a fixed rate of return and are protected
by contractual obligations with respect to their investment. Equity holders are the residual
claimants, bearing most of the risk and have greater control over decisions.
An appropriate capital structure is a critical decision for any business organization. The decision
is important not only because of the need to maximize returns to various organizational
constituencies, but also because of the impact such a decision have on an organization’s ability to
10
deal with its competitive environment.Following the work of Modigliani and Miller (1958 and
1963), much research has been carried out in corporate finance to determine the influence of a
firm’s choice of capital structure on performance. The difficulty facing companies when
structuring their finance is to determine its impact on performance, as the performance of the
business is crucial to the value of the firm and consequently, its survival.
Managers have numerous opportunities to exercise their discretion with respect to capital
structure decisions. The capital structure employed may not be meant for value maximization of
the firm but for protection of the manager’s interest especially in organizations where corporate
decisions are dictated by managers and shares of the company closely held (Dimitris, and
Psillaki, 2008). Even where shares are not closely held, owners of equity are generally large in
number and an average shareholder controls a minute proportion of the shares of the firm. This
gives rise to the tendency for such a shareholder to take less interest in the monitoring of
managers who left to themselves pursue interest different from owners of equity.
In the past two years in Kenyan market in general, 2011 in particular the cost of funds increased
significantly in the Kenyan debt market, this was as result of inflation that triggered monetary
policy committee to increase the interest rates in the banking industry that spilled to the
borrowers. The cost of funds thus affected firm’s financial performance, increased prices of real
estate properties
Studies have been done on capital structure and financial performance Rutto (2011) effect of
capital structure change on share prices for firm quoted at the NSE, Lokong (2010) the
relationship between capital structure & profitability of micro finance institutions in Kenya,
11
Muia (2008) the relationship between capital structure and financial performance of SMEs in
Nairobi, kitony (2007) a test of relationship between capital structure and agency costs. Findings
appear to suggest that there is a significant impact of capital structure on company performance
after controlling for company specific characteristics such as company size, non-duality,
leverage and growth. The finding is of significant for investors and policy marker which will
serve as a guiding for better investment decision. No sufficient exploitation study has been done
on effect of capital structure on financial performance on listed firms in Nairobi security
exchange. This study therefore seeks to fill in this gap by investigating capital structure on
financial performance with specific reference to listed firms in Nairobi security exchange.
This research aims at determining how managers of the companies listed on the stock exchanges
In Kenya combine the different sources of funding for their businesses, given the Unique
characteristics of these economies and to determine, whether there exists a relationship between
the capital structure and the return on shareholders’ funding for these firms, as well as the
relationship between the macroeconomic factors of the interest rate and the inflation rate with
the capital structure and performance. Analysis of how the return on borrowed funds compared
with the return on assets financed will also be carried out to determine, whether the return on
assets warranted the borrowing.
1.3 Objective of the study
The focus of this study was to establish the Impact of Capital Structure on Performance of the
firms listed at the Nairobi securities exchange.
1.4 Value of the Study
In the past, studies carried out on capital structure have concentrated on the developed countries
12
and on the relationship between firm growth and firm value. The findings of this study was to
contribute information about the capital structure of firms in the developing countries like Kenya
and the behaviour of these structures in relation to shareholders’ objective of maximizing their
wealth. This information was to provide financial institutions, consultants and entrepreneurs with
the necessary tools to plan the financing of their businesses
The findings was also to provide information for the regulatory organizations involved in
promoting investment, such as the Capital Markets Authorities in Kenya, to assist them analyse
and harness the financial resources relevant to businesses.
It was also provide a basis for further research in capital structure theories, focusing on
developing countries.
13
CHAPTER TWO
LITERATURE REVIEW
2.1 Introduction
This chapter examines the literature relevant to the study. It follows the conceptual framework,
incorporate scholarly works and theories. The rationale of the study is to ascertain the role capital
structure played in determining financial performance. The literature under review will be
obtained from journal articles, websites and text.
2.2. Capital Structure Theory
Capital structure puts into perspective the way in which a firm finances its operations
Brigham(2004), this can either be through debt or equity capital or a combination of both David
(1979). Capital structure theory as attributed to Modigliani and Miller concluded that it doesn’t
matter how a firm finances its’ operations and that the value of a firm is independent of its’
capital structure making capital structure irrelevant. The study was based on the assumption that
there were no brokerage costs, earnings before interest and tax were not affected by the use of
debt and that investors could borrow at the same rate as corporations and lastly there was no
information asymmetry. Although this statement didn’t reject the possible preference of a firm’s
owner to a certain type of financing over others, it did affect the irrelevance of the value of the
firm to the means of financing it given a perfect market (Fischer, Heinkel, & Zechner, 1989). A
number of theories were from then onward advanced to explain capital structure notable among
which are the pecking order theory and trade off theory which have been often than not a centre
of debate.
14
2.2.1 Trade-off theory of Capital Structure and Taxes
Myers (2001) in his research on capital structure noted that the trade-off theory justifies
moderate debt ratios. The purpose of the trade-off theory of capital structure is to explain the
strategy a firm uses to finance investments which may be by equity and sometimes by debt.
Tradeoff theory predicts that a weak firm will rely exclusively on a bank for debt capital. That is,
for weak firms, bank debt dominates any mix of market and bank debt regardless of the priority
structure. This result contradicts the notion that small/young firms avoid public debt because
they lack access to such markets or face prohibitive costs in so doing (Hackbarth,Hennessy, &
Leland, 2007). Within the tradeoff theory, there is a debt “pecking-order” with bank debt being
preferred to market debt due to the lower implied bankruptcy costs. When the bank holds all ex
post bargaining power, the desired level of debt tax shields can be achieved using only bank debt
(Hackbarth et al., 2007). While Myers noted that the firm would borrow up to the point where
the marginal value of tax shields on additional debt is offset by the increase in the present value
of possible costs of financial distress (Myers 2001).
According to Modigliani & Miller (1958), the attractiveness of debt decreases with the personal
tax on the interest income. A firm experiences financial distress when the firm is unable to cope
with the debt holders' obligations. If the firm continues to fail in making payments to the debt
holders, the firm can even be insolvent. The theory can be explained by costs of financial distress
and agency costs (Pandey, 2005).
In addition direct costs of financial distress to include costs of insolvency which may manifest in
the form of demoralised employees, customers who eventually stop purchasing a company’s
15
products, investors who may decline to supply capital or avail it at a high cost and lastly
managers who may pass up profitable investment opportunities to in order to avoid any sort of
risk (Pandey, 2005).
Murinde et al (2002) stated that tax policy has an important effect on capital structure decisions
of a firm. This is in the sense that corporate tax allows firms to deduct interest on debt when
computing taxable profits. This suggests that tax advantages derived from debt would lead firms
to be entirely financed through debt because interest payments associated with debt are tax
deductable whereas payments associated with equity such as dividends aren’t tax allowable
deductions. This means that the effect of more or less debt in a firm may either reduce or
increase firm value depending on the nature of one’s business. It was concluded that trade-off
theory couldn’t account for the correlation between high profitability and low debt ratios. Rajan
et al (1995) also confirmed a negative correlation between profitability and leverage for the
United States, Japan and Canada although no significant correlations were found for France,
Germany, Italy and Britain.
2.2.2 Pecking Order Theory
The pecking order theory as developed by Myers (1984) stated that firms prefer internal sources
of finance; they adapt their target dividend payout ratios to their investment opportunities
although dividends and payout ratios are gradually adjusted to shifts in the extent of valuable
investment opportunities. In addition, Myers (1984) stated that in the event that external finance
is required, firms are most likely to issue the safest security first that is to say they start with debt
then possibly convertible debt then equity comes as last resort. In summary, Myers’ argument
was such that businesses adhere to a hierarchy of financing sources and prefer internal financing

16
when available. Should external financing be required,debt would be preferred over equity.
Pandey (2005), also concurred with Myers’ argument when he noted that managers always
preferred to use internal finance and would only resort to issuing shares as a last resort. He went
on to add that the pecking order theory was able to explain the negative inverse relationship
between profitability and debt ratio within an industry however; the theory did not fully explain
the capital structure differences between industries.Scherr et al (1993); Holmes et al (1991) and
Quan (2002) considered the pecking order theory as an appropriate description of Medium Sized
Enterprises’ financing practises because debt is by far the largest source of financing and that
small and medium enterprise managers tend to be owners of the business who do not normally
want to dilute their ownership. In addition, they concurred that firms consequently tend to prefer
internal financing to external financing of any sort and if they must obtain external funding, they
have a preference of debt over equity.
They also noted that the order of preference reflected the relative costs of various financing
options. Firms therefore would prefer internal sources of finance as compared to expensive or
costly external finance and that firms that are profitable and therefore generate earnings are
expected to use less debt than those that do not generate high earnings.
Cosh & Hughes (1994) on the other hand argued that within the overall pecking order theory,
Small and Medium Sized Enterprises’ when compared to large enterprises would depend more
on holding excess liquid assets to meet discontinuities in investment programs, depend more on
short term debt including trade credit and overdrafts, rely to a greater extent on hire purchase and
leasing equipment. Therefore in relation to Small Medium Enterprises financing, Cosh & Hughes
17
(1994) proposed a refinement of the theory due to its lack of information to assess risk both on
individual and collective basis.
2.3 Empirical evidence
The tradeoff theory suggests that firms can determine their optimal capital structure by striking a
balance between the benefits and costs related with debt financing. According to Myers (1984)
firms set a target debt to value ratio and steadily adjust towards the target ratio to balance the
tradeoff between tax savings and bankruptcy cost. The purpose of the trade-off theory of capital
structure is to explain the strategy a firm uses to finance investments which may be by equity and
sometimes by debt, it was concluded that trade-off theory couldn’t account for the correlation
between high profitability and low debt ratios. Levels of capital mix are liable to increase the
cost of debt and also the chance of default, bankruptcy and eventually liquidation of a firm
(Myers, 2001).
Though most studies assume that bankruptcy costs of firms exist, yet it is commonly believed
that such costs are negligible and the benefits of tax saving outweigh the bankruptcy costs.
Miller (1977) on the argued that it doesn’t matter how a firm finances its’ operations and that the
value of a firm is independent of its’ capital structure making capital structure irrelevance,
suggests that more profitable firms need to shelter their earnings and save taxes by opting for
higher leverage in their capital structure. It was found out that firm’s performance and high debt
level are positively associated, a hypothesis that is supported by a number of studies including
Gosh et al,(2000), Hadlock and James (2002), Abor (2005) and Bonaccorsi di patti (2006).
18
However, the static trade off theory is applicable only to one time period tradeoff between tax
saving against the deadweight cost of bankruptcy. In practice firms operate for a long period of
time, therefore dynamic trade off theories are more relevant to the real world in explaining the
relationship between firm’s performance and leverage. The focal point of these theories is that
firms pursue an optimal debt ratio and any deviations resulting from random shocks are adjusted
without any time lag and transaction costs. This proposition supports the view that firms would
maintain high levels of debt to avail the tax saving benefit Kane et al. (1984) Brennan &
Schwartz (1984) Goldstein et al. (2001) and Strebulaev (2007) However, the assumption that
firms rebalance debt ratios swiftly without any transactions cost is being questioned. It is argued
that since readjustment of debt ratios involve transaction costs, firms may take time to rebalance.
Rather they may let their capital structure to deviate from the optimal capital structure and will
rebalance only at the upper and lower limits (Fischer et al.,1989).
Empirically, studies reporting a negative relation between firm’s performance and capital
structure seem to be consistent with the predictions of pecking order theory in contrast to the
tradeoff theory However, this seems to be too simple a view of the relationship between firm’s
performance and its capital structure.
In practice it is observed that profitable firms tend to retire their debt and maintain leverage close
to the lower end, whereas loss making firms are found to have higher debt level and are close to
the higher limit of debt ratio. This indicates that profitability may also reflect the growth aspect
of firms. Thus in contrast to the static trade off theory the dynamic trade off theories suggests
that firm performance and leverage may be negatively related, implying that trade off theory is
19
ambiguous on profit and debt to equity relation (Frank & Goyal, 2007). Accordingly, profitable
firms are likely to use retained earnings and make less use of debt relative to less profitable
firms. It implies firm’s performance and debt are expected to be negatively associated.
Magara (2012) did a study on capital structure and its determinants at the Nairobi Securities
Exchange. The study sought to find out the major determinants of capital structure. It was
established that from the period 2007 to 2011, there was a positive significant relationship
between the firm size, tangibility and growth rate and the degree of leverage of the firm. The
study did not take into consideration macro- economic factors like inflation and interest rates.
Mwangi (2010) did a study on capital structure on firms listed at the Nairobi Stock Exchange
also tried to look on the relationship between capital structure and financial performance. Data
was collected using structured questionnaires. The study identified that a strong positive
relationship between leverage and return on equity, liquidity, and return on investment existed
This hypothesis is also supported by a number of studies, to them the benefits of debt financing
are less than it’s negative aspects, so firms will always prefer to fund investments by internal
sources Jensen and Meckling (1976) Kester (1986), Rajan and Zingales (1995) (Eriotis, et. al.
1997).and Fama and French (2002) Similarly, Harirs and Raviv (1991) Krishnan and Moyer
(1977) and Gleason, Mathur and Mathur (2000) all found a significant and negative impact of
capital structure on performance.
20
2.4 Summary
In comparison to the tradeoff theory the pecking order theory argues that pecking order behavior
is adopted when firms prefer to avoid costs related to adverse selection and agency cost issues. In
other words firms in the first place prefer to opt for internal source of retained earnings; if at all it
has to opt for external funds it prefers debt to equity. Myers (1984) and (Myers & Majluf, 1984)
Also the issuance equity imply involving external investors in the ownership structure, therefore
when a firm issues new shares investors may believe the firm is overvalued and the managers
may take advantage of this asymmetric information as he knows better about the firm’s risk level
than the investors (Myers,1984).
Thus, according to the pecking order theory the primary concern of a firm is to raise capital
through retained earnings while tradeoff between firm’s bankruptcy cost and tax shield of debt is
a secondary issue. Accordingly, profitable firms are likely to use retained earnings and make less
use of debt relative to less profitable firms. It implies firm’s performance and debt are expected
to be negatively associated.
This hypothesis is also supported by a number of studies, to them the benefits of debt financing
are less than it’s negative aspects, so firms will always prefer to fund investments by internal
sources Jensen and Meckling(1976) Kester (1986), Rajan and Zingales (1995) (Eriotis, et. al.
1997).and Fama and French(2002) Similarly, Harirs and Raviv (1991) Krishnan and Moyer
(1977) and Gleason, Mathur and Mathur (2000) all found a significant and negative impact of
capital structure on performance.
21
Although literature on capital structure theories and empirical evidence on the determinants of
capital structure is abundant in case of developed countries, however except a few studies, the
question whether capital structure of large firms influence their performance remains largely
unexplored in developing countries.
One such study testing the hypothesis that capital structure is one of the main determinants of
firm performance explains that the tax benefit of debt financing lead firms to borrow excessively.
In doing so firms very often ignore the bankruptcy costs stemming from declining returns to
excessive debt Therefore, profit maximizing firms when diverge from an appropriate capital
structure their bankruptcy or financing costs outweigh the tax benefits related with the tradeoff
between debt and equity. Zeitun and Tian (2007) finds that capital structure has a significant and
negative impact on firm’s performance and underestimation of bankruptcy costs may lead firms
to borrow excessively and carry high debt in their capital structure However, others find mixed
results regarding the impact of capital structure on firm’s performance (Ebaid, 2007).
Magara (2012) did a study on capital structure and its determinants at the Nairobi Securities
Exchange. The study sought to find out the major determinants of capital structure. It was
established that from the period 2007 to 2011, there was a positive significant relationship
between the firm size, tangibility and growth rate and the degree of leverage of the firm. The
study did not take into consideration macro- economic factors like inflation and interest rates.
Mwangi (2010) did a study on capital structure on firms listed at the Nairobi Stock Exchange
also tried to look on the relationship between capital structure and financial performance. Data

22
was collected using structured questionnaires. The study identified that a strong positive
relationship between leverage and return on equity, liquidity, and return on investment existed
23
CHAPTER THREE
RESEARCH METHODOLOGY
3.1 Introduction
This chapter sets out the methodology and design of the study. It describes the source of data,
method of collection and a summary of the analyses that were carried out.
3.2 Research Design
The study was carried out using a longitudinal research design, employing secondary
quantitative data. The data was obtained from Nairobi Securities Exchange Handbooks and
published books of accounts of the companies listed in the Nairobi Securities Exchange.
3.3 Study Population
The population for this study constituted all listed companies in the Nairobi Securities Exchange.
As at December 2012, there were 61 companies listed on the Nairobi Securities Exchange. A
census survey was carried out for the study.
3.4 Data Collection method
Secondary data was used in the study. All the data was collected by review of documents, annual
reports of the companies, the Nairobi Securities Exchange Handbooks and published books of
accounts.
3.5 Data Analysis
Collected data was validated, coded and checked for any errors and omissions. Later the data
was run through the statistical Package for Social Science (SPSS) Version 16. The objective was
24
met by computing the regression analysis of the variables. The β coefficients were calculated to
measure the percentage of debt ratio. ANOVA was used to measure the effect of debt ratio on
return on equity.
The equation for the regression model was expressed as:
ROE = α+ β1 (I) +β2 (FS) + ε
Where ROE = return on shareholders’ funding (equity)
α , β1, β2=Coefficients of the model
I = Debt ratio
Debt ratio = long term debt / (shareholders equity + long term debt or EBIT/ Interest
ROE = Return on Equity
Net Profit after Tax/ Equity
FS= firm size
ε= error term
3.6 Measurement of Variables
The capital structure was measured using the debt ratio and the firm financial performance was
measured using the return on equity.
3.6.1 Debt ratio
The value of debt was arrived at using the unconventional formula, where the total liabilities
(both long term and short term) were expressed as a proportion of the total funding. The values
for the indebtedness was computed as below.
Debt ratio = long term debt / (shareholders equity + long term debt)
25
3.6.2 Firm Performance
The performance of a company was considered as the return on equity. The benefit or return to
the shareholder was expressed as the ratio of the net profit after taxes to the shareholders’ funds.
The net profit after tax was arrived at after deducting all obligatory expenses of the business
including interest and taxes. The shareholder’s fund included share capital, retained profits and
other reserves. This ratio expressed the return in shillings for each shilling of the shareholder’s
funding. This was expressed mathematically by
ROE = Profits after tax / Shareholders’ funds (book value)
26
CHAPTER FOUR
DATA ANALYSIS, FINDINGS AND DISCUSSIONS
4.1 Introduction
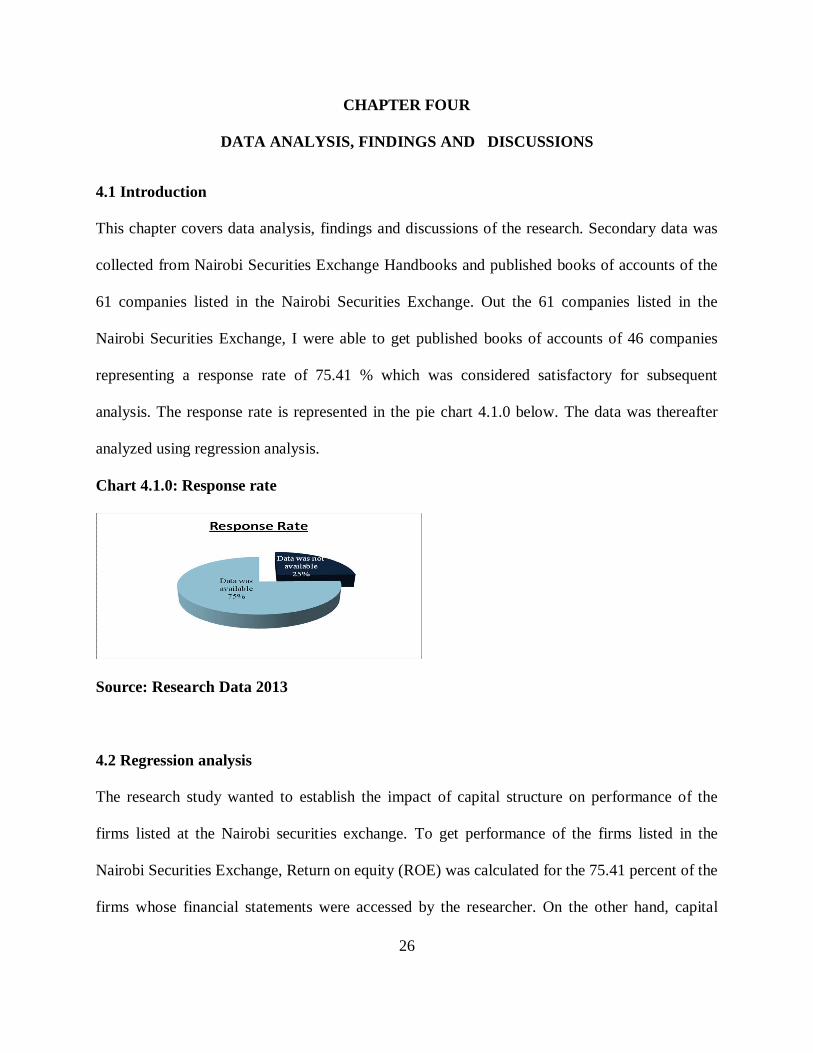
This chapter covers data analysis, findings and discussions of the research. Secondary data was
collected from Nairobi Securities Exchange Handbooks and published books of accounts of the
61 companies listed in the Nairobi Securities Exchange. Out the 61 companies listed in the
Nairobi Securities Exchange, I were able to get published books of accounts of 46 companies
representing a response rate of 75.41 % which was considered satisfactory for subsequent
analysis. The response rate is represented in the pie chart 4.1.0 below. The data was thereafter
analyzed using regression analysis.
Chart 4.1.0: Response rate
Source: Research Data 2013
4.2 Regression analysis
The research study wanted to establish the impact of capital structure on performance of the
firms listed at the Nairobi securities exchange. To get performance of the firms listed in the
Nairobi Securities Exchange, Return on equity (ROE) was calculated for the 75.41 percent of the
firms whose financial statements were accessed by the researcher. On the other hand, capital
27
structure of the firms listed in the Nairobi Securities Exchange was obtained by calculating the
debt ratio of the firms.
The research findings indicated that there was a weak positive relationship (R= 0.332) between
the variables. The study also revealed that 11.0% of capital structure of the firms listed at the
Nairobi securities exchange can be explained by the independent variables. From this study it is
evident that at 90% confidence level, the variables produce statistically significant values (high t-
values, p < 0.1.) hence when the variables are combined hence, they can be relied on to explain
capital structure of the firms listed at the Nairobi securities exchange. However, when tested
individually only debt ratio produces statistically significant values while firm size produces
statistically insignificant values. The below model was used to establish of the relationship
between capital structure and financial performance.
ROE = α+ β1 (I) +β2 (FS) + ε
The findings of the study are tabulated and discussed as below. They are as shown in the tables
4.2.0, 4.2.1 and 4.2.2 below.
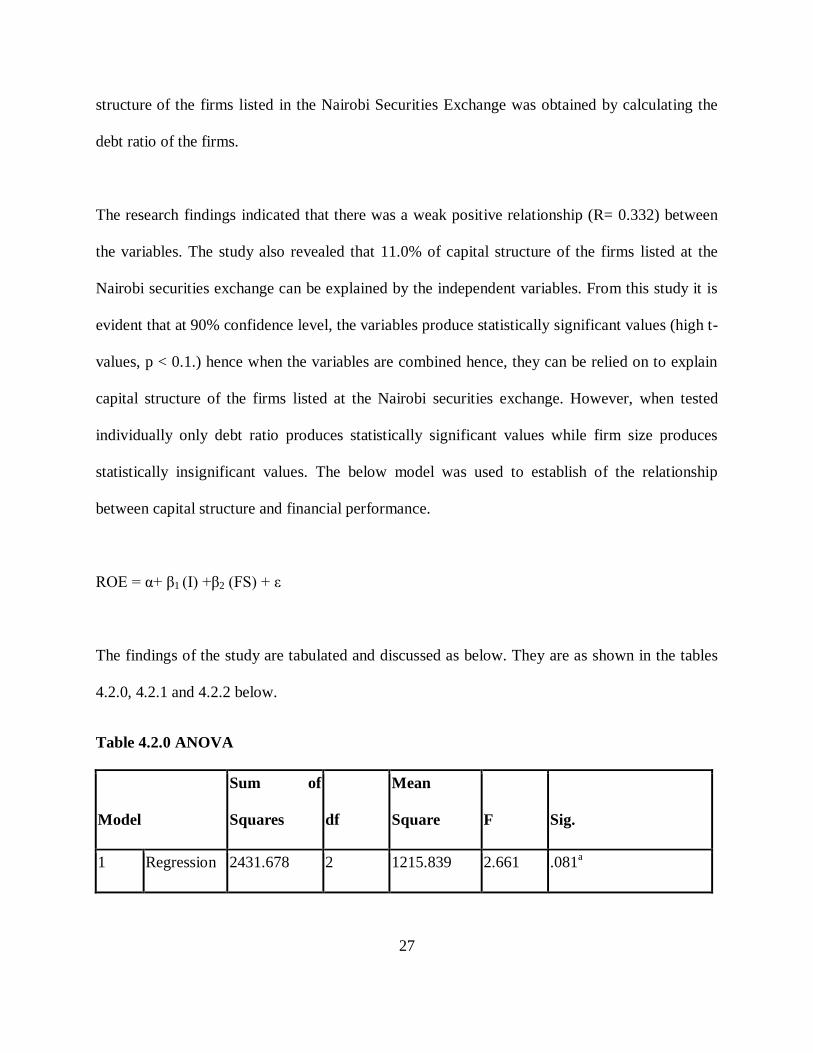
Table 4.2.0 ANOVA
Model
Sum of
Squares df
Mean
Square F Sig.
1 Regression 2431.678 2 1215.839 2.661 .081a
28
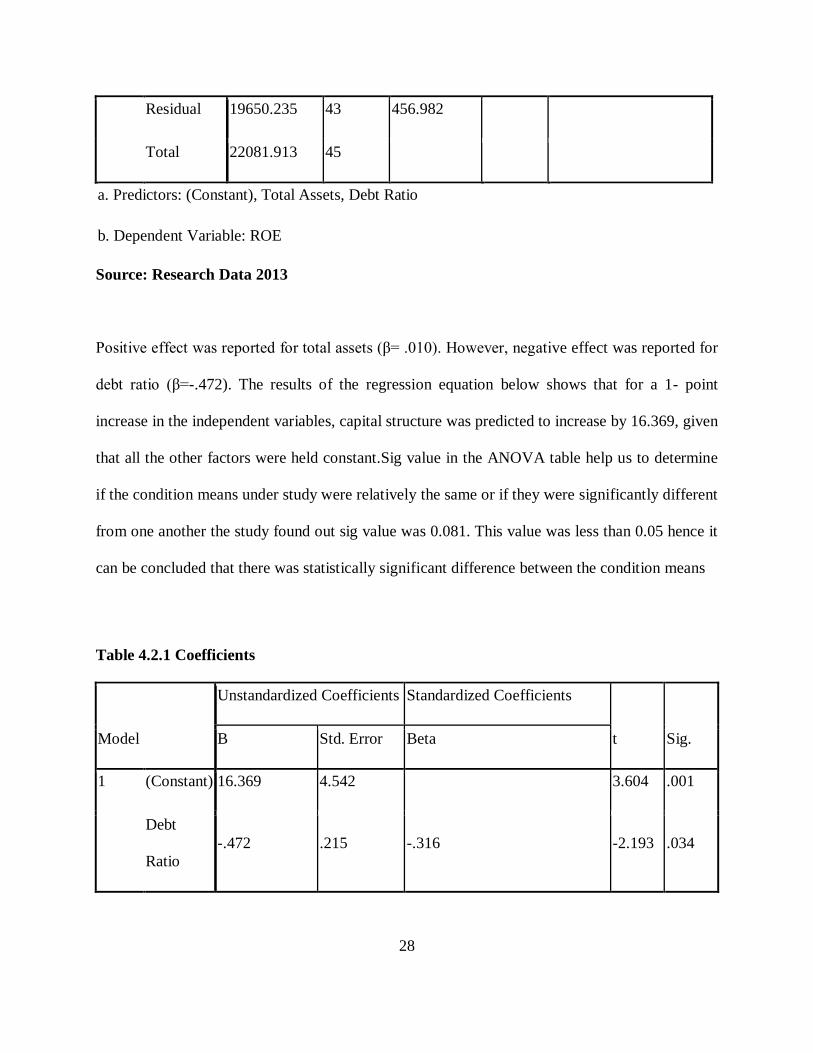
Residual 19650.235 43 456.982
Total 22081.913 45
a. Predictors: (Constant), Total Assets, Debt Ratio
b. Dependent Variable: ROE
Source: Research Data 2013
Positive effect was reported for total assets (β= .010). However, negative effect was reported for
debt ratio (β=-.472). The results of the regression equation below shows that for a 1- point
increase in the independent variables, capital structure was predicted to increase by 16.369, given
that all the other factors were held constant.Sig value in the ANOVA table help us to determine
if the condition means under study were relatively the same or if they were significantly different
from one another the study found out sig value was 0.081. This value was less than 0.05 hence it
can be concluded that there was statistically significant difference between the condition means
Table 4.2.1 Coefficients
Model
Unstandardized Coefficients Standardized Coefficients
t Sig. B Std. Error Beta
1 (Constant) 16.369 4.542 3.604 .001
Debt
Ratio -.472 .215 -.316 -2.193 .034
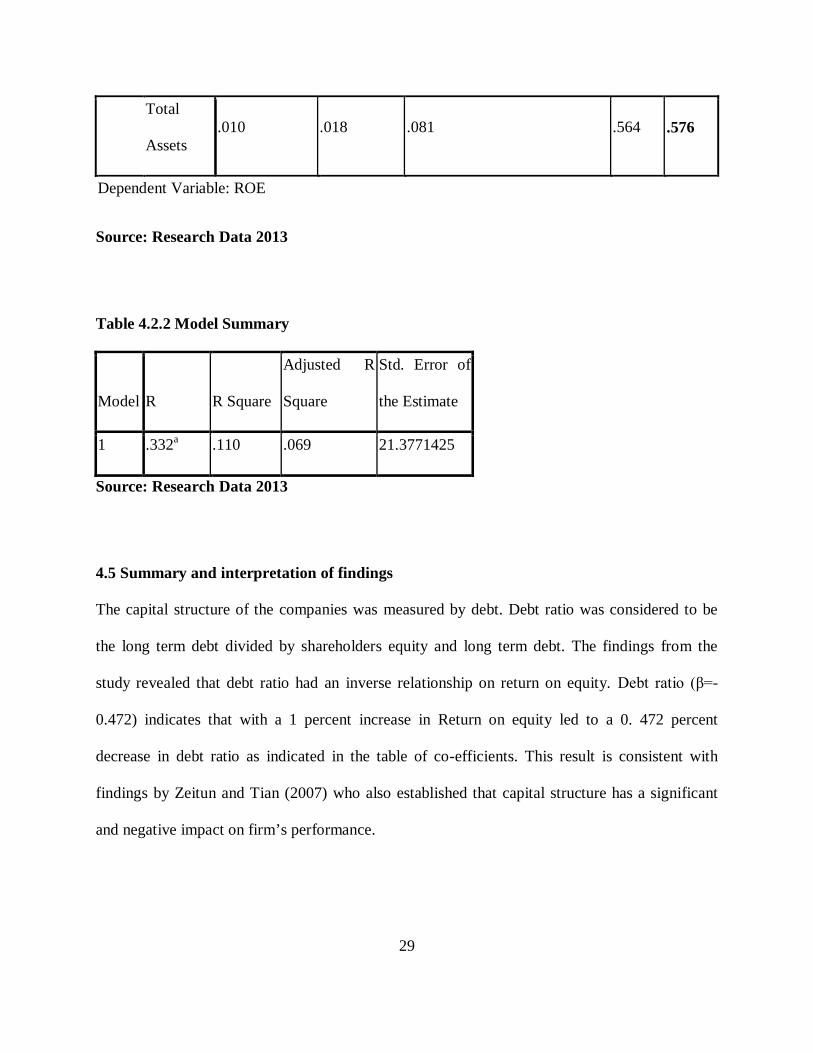
29
Total
Assets .010 .018 .081 .564 .576
Dependent Variable: ROE
Source: Research Data 2013
Table 4.2.2 Model Summary
Model R R Square
Adjusted R
Square
Std. Error of
the Estimate
1 .332a .110 .069 21.3771425
Source: Research Data 2013
4.5 Summary and interpretation of findings
The capital structure of the companies was measured by debt. Debt ratio was considered to be
the long term debt divided by shareholders equity and long term debt. The findings from the
study revealed that debt ratio had an inverse relationship on return on equity. Debt ratio (β=-
0.472) indicates that with a 1 percent increase in Return on equity led to a 0. 472 percent
decrease in debt ratio as indicated in the table of co-efficients. This result is consistent with
findings by Zeitun and Tian (2007) who also established that capital structure has a significant
and negative impact on firm’s performance.
30
From the study it was evident that at 95% confidence level, the debt ratio variable produced
statistically significant values (high t-values, p < 0.05). From statistical theory, if p > 0.1 then
the model is said not to be significant. This is concluded that a relationship could not be found
among the model variables. From the co-efficients table, findings indicate that the p value for
debt ratio was 0.034. 0.034 is found to be less than 0.05. The model was therefore significant at
95 % thus the findings can be accepted.
The result was also found not to be in agreement with Mwangi (2010) study on capital structure
on firms listed at the Nairobi Stock Exchange on the relationship between capital structure and
financial performance. Strong relationship was found to be between leverage and return on
equity, liquidity, and return on investment. However, others find mixed results regarding the
impact of capital structure on firm’s performance. This can best be supported by the argument
that borrowing introduces varying levels of risk to the company and on the return to
shareholders.
31
CHAPTER FIVE
SUMMARY, CONCLUSIONS AND RECOMMENDATIONS
5.1 Introduction
This chapter aims at linking and applying the results obtained from the study to solve real life
capital structure and financial performance misalignments as described afore in the problem
statement. This chapter will also elucidate the policy recommendations that policy makers can
implement in order to better align institutions capital raising initiatives with the firms
performance. Indeed, policy and firm decision makers can play a bigger role in ensuring that
leverage risk considerations forms part of the criteria that firms use when making financing
decisions as they know that it will ultimately impact on the firm’s performance.
5.2 Summary and conclusions
The main objective of this study was to establish the impact of Capital Structure on Performance
of the firms listed at the Nairobi securities exchange. To achieve the objective the researcher
sampled firms listed under the Nairobi securities exchange that exhibited the characteristics for
the study. Secondary data was used in this study. Data was collected by the review of documents,
annual reports of the sampled companies published books of accounts.
The research findings indicated that there was a weak positive relationship (R= 0.332) between
the variables. The study also revealed that 11.0% of capital structure of the firms listed at the
Nairobi securities exchange can be explained by the independent variables.
32
From this study it is evident that at 90% confidence level, the variables produce statistically
significant values (high t-values, p < 0.1.) hence when the variables are combined hence, they
can be relied on to explain capital structure of the firms listed at the Nairobi securities exchange.
From the study findings it would be safe to conclude that debt ratio had an inverse relationship
with return on equity. Capital structure theory as attributed to Modigliani and Miller concluded
that it doesn’t matter how a firm finances its’ operations and that the value of a firm is
independent of its’ capital structure making capital structure irrelevant.
The conclusion is supported by the results of the regression analysis that the higher the debt
ratio, the less the return on equity therefore showed us the need to increase more capital injection
rather than borrowing as supported by Jensen and Meckling (1976) to them the benefits of debt
financing are less than it’s negative aspects, so firms will always prefer to fund investments by
internal sources.
5.3 Policy Recommendations
It was considered to be very important when finance directors and managing directors trying to
fund the firm’s assets to understand the impact of capital structure on their financial performance
as well the cost of funds. It was evident from the study and analysis arising thereof. This study
established that capital analysis and asset structure analysis was a very important analysis used to
boost firm’s competitive advantage and consequently profitability. In addition the capital market
analyst as well investment analyst should advise the investors as well firms on the optimal
capital structure based on capital structure analysis.
Borrowing introduces a risk to the company and on the return to shareholders in terms of
reducing the amount of profit available to them, as well as exposing their assets to dissolution in
33
the event of failing to repay the debt in the stipulated time. When a business’s returns are likely
to fluctuate greatly the use of increased debt magnifies the risk. Adequate emphasis must be
placed on enabling such companies to employ more shareholders’ funding than debt and reduce
the risk that is inherent in the increased use of debt. Based on the results of the study the
following recommendations were made.
5.3.1 Use equity rather than borrowing
The conclusion that borrowing does not always improve a firm’s performance leads to the
recommendation that firms should use shareholders’ funds as much as possible before they
undertake to borrow, so that they minimize the risks related to borrowing, which include interest
on the debt exceeding the return on the assets they are financing. Firms must therefore be
encouraged or assisted to obtain equity by listing on the exchanges. This can be done by
educating and sensitization of business owners of the benefits of listing, as well as granting of
special fiscal measures to encourage them to list.
5.3.2 Consider the leverage risk or leverage chance of the asset to be financed
When a firm has exhausted its shareholders’ funding and chooses to finance its expansion of
operations by borrowing, special consideration must be taken to ensure that the assets financed
by the borrowed funds bring in a higher return than the interest the firm is required to pay on the
debt. If this is not done, the firm will erode the reserves in order to pay the debt as the assets
financed will not be making enough returns to cover the debt. The firm must select source of
funding carefully to avoid falling into the leverage risk trap.
5.3.3 Encourage companies to list
The increase in debt has been found to reduce performance over time and increase the risks to
the business owners. The Capital Market Authorities and the Exchanges should increase
34
education of the business community in the advantages of listing over borrowing. In Kenya a
large proportion of businesses are small and medium enterprises but very few of these are listed
on the NSE.
5.4 Limitations of the study
The researcher encountered quite a number of challenges related to the research and most
particularly during the process of data collection. Due to inadequate resources, the researcher
conducted this research under constraints of finances. In addition Nairobi Securities Exchange
analysts had to be pushed to assist with data. This was done through many calls to remind them.
Others wanted to be paid in order to give data. Other thought that the information they were
requested to volunteer was confidential.
Time allocated for the study was insufficient while holding a full time job and studying part
time. This was encountered during the collection of material as well as the data to see the study
success. However the researcher tried to conduct the study within the time frame as specified.
5.5 Suggestions for Further Studies
Arising from this study, the following directions for future research in Finance were
recommended as follows:
First, this study focused on all the 61 listed companies in the Nairobi Securities Exchange.
Therefore, generalisations could not adequately be extended to every listed company as they
have varying industry risk and asset structure. Based on this fact among others, it is therefore,
recommended that a narrow based study covering a specific segment or company be done to find
out the Impact of Capital Structure on Performance.

35
Similar studies to this can also be replicated in a few years to come to asses if the Impact of
Capital Structure on Performance of the firms listed at the Nairobi Securities Exchange has
changed as the Nairobi Securities Exchange continues to change.
Also the effect of capital structure on corporate strategy is also another area of interest which can
be under the area of further research and a more intense study along that area can come in handy.
36
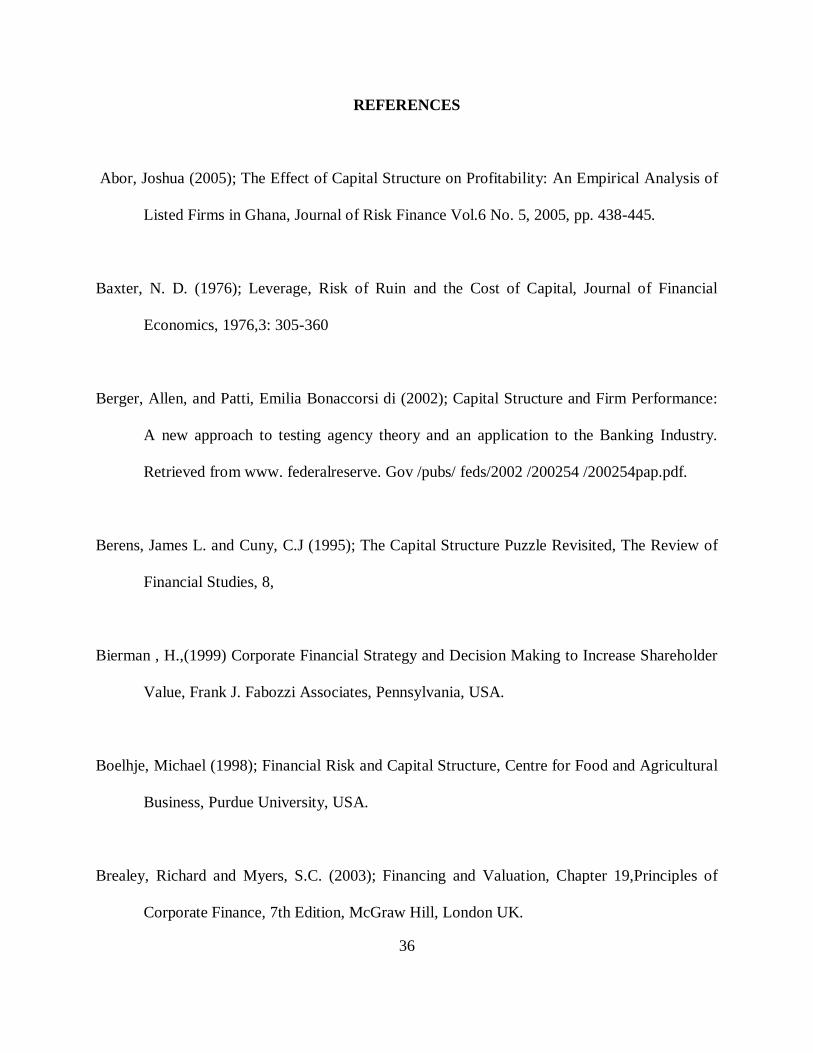
REFERENCES
Abor, Joshua (2005); The Effect of Capital Structure on Profitability: An Empirical Analysis of
Listed Firms in Ghana, Journal of Risk Finance Vol.6 No. 5, 2005, pp. 438-445.
Baxter, N. D. (1976); Leverage, Risk of Ruin and the Cost of Capital, Journal of Financial
Economics, 1976,3: 305-360
Berger, Allen, and Patti, Emilia Bonaccorsi di (2002); Capital Structure and Firm Performance:
A new approach to testing agency theory and an application to the Banking Industry.
Retrieved from www. federalreserve. Gov /pubs/ feds/2002 /200254 /200254pap.pdf.
Berens, James L. and Cuny, C.J (1995); The Capital Structure Puzzle Revisited, The Review of
Financial Studies, 8,
Bierman , H.,(1999) Corporate Financial Strategy and Decision Making to Increase Shareholder
Value, Frank J. Fabozzi Associates, Pennsylvania, USA.
Boelhje, Michael (1998); Financial Risk and Capital Structure, Centre for Food and Agricultural
Business, Purdue University, USA.
Brealey, Richard and Myers, S.C. (2003); Financing and Valuation, Chapter 19,Principles of
Corporate Finance, 7th Edition, McGraw Hill, London UK.
37
Brockington, Raymond (1990); Financial Management, 1992 Edition, ELBS, London,UK
Buehler, Kevin S. and Pritsch, Gunnar (2003); Running with Risk, The McKinsey Quarterly,
2003, Number 463
Buringuriza, Emmanuel and Hltenstam, Johan (2002); Capital Market Development in Uganda-
Statistical Profile of the Securities Market, Financial Systems Development (FSD) Programme,
FSD Series No. 10,
Carpentier, Cecile (2006); The Valuation Effects of Long-term Changes in Capital Structure,
International Journal of Managerial Finance, Volume 2, Issue 1 page 4-18.
Cook, Paul and Nixson, Frederick (2000); Finance and Small and Medium-sized Enterprise
Development, Paper No. 14 Working Paper Series, Finance and Development
Harris, M., and Raviv, A. (1991). The theory of the capital structure. Journal of Finance, 46, 297-
355.
Jensen M., Meckling W., (1976), Theory of the firm: managerial behavior, agency costs and
ownership structure”, Journal of Financial Economics 3, 305-360.
Jostarndt P., (2002), “Financing growth in innovative industries: agency conflicts and the role of
hybrid securities – empirical evidence from Nasdaq convertible debt offerings”, working
38
paper, Fisher Center for the Strategic Use of Information Techology, Haas School of
Business.
Kim E., McConnell J., (1977), “Corporate mergers and the coinsurance of corporate debt”,
Journal of Finance, 32, 349-365
Kitony (2007) a test of relationship between capital structure and agency costs: evidence from
the Nairobi Stock Exchange, Unpublished Management Research Project of the
University of Nairobi
Kochhar R., (1996), “Explaining firm capital structure: the role of agency theory vs transaction
cost economics”, Strategic Management Journal, 17, 713-728
Lokong (2010) the relationship between capital structure & profitability of micro finance
institutions in Kenya, Unpublished Management Research Project of the University of
Nairobi
Rutto (2011) effect of capital structure change on share prices for firm quoted at the NSE,
Unpublished Management Research Project of the University of Nairobi
Magara, M. (2012), Capital structure and its determinants at the Nairobi Securities Exchange,
Unpublished Management Research Project of the University of Nairobi
39
Modigliani F., Miller M., (1958), “The cost of capital, corporation finance and the theory of
finance, American Economic Review, 48(3), 291–297.
Mugai (2007), the role of executive development in corporate strategy implementation. a
comparative study of KCB & National bank of Kenya, Unpublished Management
Research Project of the University of Nairobi
Muia (2008) the relationship between capital structure and financial performance of SMEs in
Nairobi, Unpublished Management Research Project of the University of Nairobi
Myers S., (1977), Determinants of corporate borrowing, Journal of Financial Economics, 5, 146-
175.
Myers S., Majluf, (1984), Corporate financing and investment decision when firms have
information that investors do not have, Journal of Financial Economics, 13(2), 187-221
Mwangi, M. (2010), The relationship between capital structure and financial performance of
firms listed at the Nairobi Stock Exchange, Unpublished Management Research Project
of the University of Nairobi
Nickell S., (1996), Competition and corporate finance, Journal of Political Economy, 104, 724–
746.
40
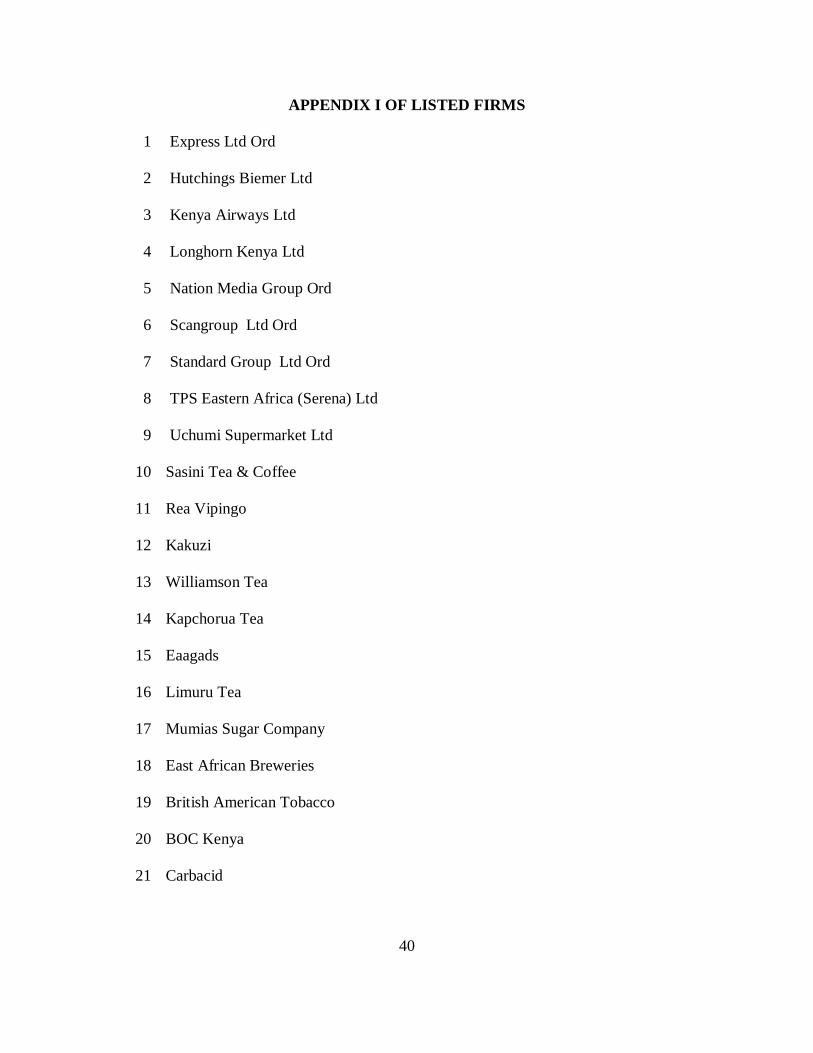
APPENDIX I OF LISTED FIRMS
1 Express Ltd Ord
2 Hutchings Biemer Ltd
3 Kenya Airways Ltd
4 Longhorn Kenya Ltd
5 Nation Media Group Ord
6 Scangroup Ltd Ord
7 Standard Group Ltd Ord
8 TPS Eastern Africa (Serena) Ltd
9 Uchumi Supermarket Ltd
10 Sasini Tea & Coffee
11 Rea Vipingo
12 Kakuzi
13 Williamson Tea
14 Kapchorua Tea
15 Eaagads
16 Limuru Tea
17 Mumias Sugar Company
18 East African Breweries
19 British American Tobacco
20 BOC Kenya
21 Carbacid

41
22 Unga Group
23 Eveready East Africa
24 City Trust
25 Olympia Capital
26 Centum (ICDCI)
27 TransCentury
28 Kenya Power
29 KenGen
30 KenolKobil
31 Umeme
32 Car & General
33 Sameer Africa
34 CMC Holdings
35 Marshalls (EA)
36 Equity Bank
37 Kenya Commercial Bank
38 Cooperative Bank
39 Barclays Bank
40 Standard Chartered Bank
41 Diamond Trust Bank Kenya
42 NIC Bank
43 CFC Stanbic

42
44 Housing finance
45 National bank
46 East African Cables
47 Crown Paints
48 Athi River Mining
49 Bamburi Cement
50 East Africa Portland Cement (EAPCC)
51 Safaricom
52 AccessKenya
53 Britam
54 CIC insurance
55 Jubille insurance
56 Kenya re insurance
57 Liberty kenya
58 Pan african insurance
Date: Dec 2012
Source: NSE