Effect of blue dyed bait - Department of Conservation · Effect of blue dyed bait on incidental...
22
Effect of blue dyed bait on incidental seabird mortalities and fish catch rates on a commercial longliner fishing off East Cape, New Zealand. Greg Lydon and Paul Starr 1 Abstract A pilot experiment was undertaken to test the potential effect of blue dyed bait on incidental seabird mortalities and on fish catch rates in the New Zealand domestic tuna longline fishery. The East Cape region on the east coast of the North Island of New Zealand was chosen as the area to conduct the experiment because fisheries in this area are known to have a relatively high rate of interactions with seabirds and this high rate potentially would maximise the probability of observing encounters between fishing gear and seabird species. Seven longline sets were observed over an eleven day trip. A total of 10,040 hooks were set, 4,999 of which held control baits (undyed squid) and the other 5,041 hooks held blue dyed squid. Two juvenile male Antipodean wandering albatross (Diomedea antipodensis) were caught in the first set on the control bait section of the longline, but no bird strikes were observed for the remainder of the experiment. Observations on how dyed bait affects seabird interactions with the longline are reported and recommendations are made for future research. An aversion response by seabirds, rather than a camouflage effect of bait, is put forward as a possible mechanism for how the use of blue dyed bait might reduce the attractiveness of longline baited hooks. Keywords: Seabirds, blue dye, mitigation, tuna, longliner, fishing 1 Greg Lydon and Paul Starr, SeaFIC, The NZ Seafood Industry Council Ltd, Box 24-901,Wellington, New Zealand, ph 64 4 385 4005, [email protected] , [email protected] , www.seafood.co.nz
Transcript of Effect of blue dyed bait - Department of Conservation · Effect of blue dyed bait on incidental...

Effect of blue dyed bait on incidental seabird mortalities and fish catch rates on a commercial longliner fishing off East Cape, New Zealand.
Greg Lydon and Paul Starr1
Abstract
A pilot experiment was undertaken to test the potential effect of blue dyed bait on incidental seabird mortalities and on fish catch rates in the New Zealand domestic tuna longline fishery. The East Cape region on the east coast of the North Island of New Zealand was chosen as the area to conduct the experiment because fisheries in this area are known to have a relatively high rate of interactions with seabirds and this high rate potentially would maximise the probability of observing encounters between fishing gear and seabird species. Seven longline sets were observed over an eleven day trip. A total of 10,040 hooks were set, 4,999 of which held control baits (undyed squid) and the other 5,041 hooks held blue dyed squid. Two juvenile male Antipodean wandering albatross (Diomedea antipodensis) were caught in the first set on the control bait section of the longline, but no bird strikes were observed for the remainder of the experiment. Observations on how dyed bait affects seabird interactions with the longline are reported and recommendations are made for future research. An aversion response by seabirds, rather than a camouflage effect of bait, is put forward as a possible mechanism for how the use of blue dyed bait might reduce the attractiveness of longline baited hooks.
Keywords: Seabirds, blue dye, mitigation, tuna, longliner, fishing
1 Greg Lydon and Paul Starr, SeaFIC, The NZ Seafood Industry Council Ltd, Box 24-901,Wellington, New Zealand, ph 64 4 385 4005, [email protected], [email protected], www.seafood.co.nz

2
IntroductionGlobally, there is increasing pressure on the seafood industry to review its operating standards to ensure that its fishing practices are environmentally sustainable. The 1996 New Zealand Fisheries Act provides for the utilisation of fisheries resources while ensuring sustainability. Fishermen must take into account the effects of fishing on the environment and on associated species by avoiding, remedying or mitigating any adverse effects of fishing on the aquatic environment (including interactions with seabirds). Additional responsibilities were placed on fishermen in April 2004, when the New Zealand Government released its ‘National Plan of Action to Reduce the Incidental Catch of Seabirds in New Zealand Fisheries’ (Ministry of Fisheries and Department of Conservation 2004). Under this action plan, domestic tuna longline fishermen are required to produce a ‘Code of Practice’ and to set voluntary seabird bycatch limits by 30 June 2005. Incidental mortality of seabirds on a longline is caused by seabirds either swallowing a baited hook, becoming incidentally hooked in another part of the body, or becoming entangled in the line. (Lokkeborg 2003).
Incidental catch of seabirds varies with:(a) fishing practice; i.e., setting method, (Gilman 2001) fish processing, offal disposal, (Cherel and Weimerskirch 1996) the mitigation measures used, (Tasker et al 2000) and (b) temporal and spatial distribution; i.e., area fished - the degree of overlap with seabird foraging range (Kock 2001), season (seabirds can be more aggressive during the breeding season), light level – time of setting, day/night, dusk or dawn, (Cherel and Weimerskirch 1996) moon phase - around the full moon is a danger time (Sanchez and Belda 2003),and weather conditions. Higher seabird captures can occur in rough weather Bartle (1991) and can affect one portion of the population (for example females or juveniles) disproportionally .
Fishermen in the United States during the mid-1970s were considered the first to experiment with dyed baits to improve swordfish fish catch in the Atlantic Ocean longline fishery (Boggs 2001). The dyes that have been used internationally are commercially available non-toxic food colouring dyes. Dyed bait is considered by fishermen to be more visible to target fish. Research on the effectiveness of blue dyed bait in reducing the incidental catch of seabirds has been carried out in Hawaii and Japan in the last five years (Minami and Kiyota 2002, Gilman et al 2003). Similar work is required in New Zealand because sea conditions, bird species and target fish species are different, which may affect efficacy of dyed bait as a bycatch mitigation measure.
Approximately 100 longliners target Southern bluefin tuna (Thunnus thynnus) in winter and Bigeye tuna (Thunnus obesus) throughout the year. Smaller vessels average about 1100 hooks per set and the estimated number of hooks set in the New Zealand Exclusive Economic Zone was 8.1 million in the 1999-2000 fishing year (Francis et al 2004)..
The East Cape region, on the east coast of the North Island of New Zealand (Figure 2), was chosen as the area to conduct the field experiment, based on the requirement that the probability of observing encounters between fishing gear and seabird species should be maximised while achieving high catch rates for the target tuna species. This selection was based on the small amount of observer information available from the domestic longline fleet in Area 1, where 26 percent of the observed sets and 50 percent of the observed vessels, reported seabird incidental captures in 2001/02 (Baird 2003).
Kellian (2003) noted that the most numerous seabird species following vessels around East Cape is the Flesh-footed shearwater (Puffinus carneipes), which is ranked by the International Union for Conservation of Nature and Natural Resources (IUCN) as ‘Lower Risk - Near Threatened’ (IUCN 2002). The Flesh-footed shearwater breeding season is from November to April, and during this period they forage aggressively behind tuna longliners.

3
Kirby et al (2003) demonstrated that tuna are not randomly distributed, either spatially or temporally, in New Zealand waters. Fishers target their effort in specific ‘hotspots’ where tuna are known to aggregate. The East Cape aggregation of tuna may be a result of the ecosystem dynamics in this region; i.e., prey concentrations result from local ocean conditions (currents, upwelling of plankton, temperature, depth) and other processes. Unwin et al (2003) discovered that sea surface temperature, hook depth, and moon brightness were important variables influencing the catch per unit effort for Bigeye and Southern bluefin tuna grounds off East Cape
In 2002, the New Zealand Department of Conservation (DoC) requested a proposal for a desktop design of an experiment to test the effectiveness of dyed bait to reduce seabird mortalities in New Zealand waters. The NZ Seafood Industry Council suggested that such a desktop design would not be very informative, given the lack of detailed hook-by-hook information from the longline fishery on the incidence of seabird mortalities because observer coverage of the domestic tuna longline fleet has been minimal (Ministry of Fisheries and Department of Conservation 2001). The most relevant current data available are reports from the 2001/02 fishing year, where observers reported 87 seabird captures from domestic vessels on the east coast of the North Island in ‘Area 1’ (Figure 1) (Baird 2003). Baird (2003) notes that in 2001/02:
“The mean seabird catch rate for Area 1 based on 119 observed sets is 0.625 (s.e. = 0.154) seabirds per 1000 hooks. The poor observer coverage and this unreliable catch rate (heavily biased by the fishing activity of one vessel observed in one part of Area 1) constrains the analysis of domestic tuna longline-seabird interactions to simple reporting of the fishing effort, numbers caught, and seabird species representation in the catch.”
Reid and Sullivan (2004) note that the mortality of seabirds on longlines is a statistically rare event which causes extreme skewness in the data and difficulties in obtaining a sufficiently large sample size for analysis. The difficulty with designing an experiment for testing blue-dyed bait and its effect on the rate of seabird bycatch is that there are very little data available to use for predicting the variation in seabird capture rates at the level of individual hooks. Such information is crucial when designing the number of lines and hooks that will be needed to demonstrate a statistical difference between the treatment effects (i.e., with and without blue dye). The current New Zealand observer programme provides estimates of seabird bycatch rates over large areas and relatively long time periods (on the order of a fishing season) but unfortunately does not provide data at a sufficiently detailed level to adequately design the experiment envisioned by DoC.
SeaFIC proposed a preliminary field experiment to investigate the effect of blue dyed bait compared to undyed bait to test the null hypotheses:
A. The total number of seabirds caught over the period of the experiment will be the same for the dyed and control bait types; and,
B. The number of fish caught will be the same when using either bait-type (control or blue dyed).
Both null hypotheses assume a binomial distribution, treating each hook observation as a presence/absence of a seabird or a fish, with an underlying variance associated with the mean strike rate or catch rate which is independent of the bait type.
Methodology
Prior to conducting the field study using actual longlines, an experiment was undertaken to investigate the characteristics of two brands of blue dyed bait to determine the degree of dye uptake by bait. Dye A, ‘MIX’ Special Blue Food Colour for Fishing, Code 373 (manufactured in Brazil)

4
was compared with Dye B2, Dalfcol ‘Brilliant Blue’ Powder Dye ‘FD & C Blue No 1’ (manufactured in New Zealand). Equal thawed weights (500 grams) of the three most commonly used longline baits in New Zealand (squid, sanmar, and pilchard) were dyed in equal concentrations of the two blue dyes (10 ml of dye powder dissolved in 10 L of water), for the same time periods (5, 10, 15, 30 and 60 minutes). The results indicated that ‘Brilliant Blue’ was more effective than the ‘MIX’ dye in terms of speed of dye uptake and depth of blue colour and was the primary dye type selected for the at-sea experiment. Squid bait turned a darker blue than sanmar or pilchard and was used as the bait type for the at-sea experiment. Pilchard was the worst candidate for blue dye uptake due to its oily skin and large scales. Using a colour chart3 to set the blue colour standard proved to be impractical and it was considered that using a prescribed ratio of blue dye, bait and water volumes (see below) was the best way to ensure a consistent blue dyed colour for the field experiment.
The at-sea experiment was conducted east of East Cape (Figure 2) between 16 and 27 March 2004 on the Fishing Vessel ‘Polaris II’4. The ‘Polaris II’ has a crew of four and is powered by a 500 horsepower engine at 1800 RPM. For this trip, the target species was Bigeye tuna (Thunnus obesus)and the only bait used was squid. The longline gear consisted of 30 nautical miles of heavy monofilament mainline. Twelve metre lengths of lighter monofilament snoods were manually clipped on to the mainline with shark clips at the stern, and baits were thrown either port or starboard of the main propeller wash. Buoys were attached between 8 hook baskets with buoy ropes between 5 and 15 metres in length. Hooks were set every 9 seconds while steaming at 7 knots. The weighting of the snood varied as 32, 50 and 110 gram sinkers were used with 55 gram lead swivels. Five different hook types varying in weight were deployed, and occasionally a light stick was attached to a snood. Hook depth varied between 25 and 70 metres below the surface. Each fishing day consisted of one longline set, up to a maximum of 1600 hooks. The line was hauled amidships on the starboard side of the vessel on the next day. The weighting of the longline remained constant for the entire experiment, although line depth was changed in response to fish target range.
Three changes from normal fishing practice were employed for this experiment to maximise the probability of incidental seabird capture:
1. Longlines were set during daylight. The tuna fleet usually set longlines at night in a co-ordinated fashion to avoid entanglements and seabird interactions. Vessels are in contact by radio, and state their intended longline positions to allow other vessels in the area to plot a two nautical mile buffer zone around the longline to compensate for drift with the tide, wind and currents.
2. No ‘tori line’ was used.5
3. Offal was released at times during setting. Normal practice is to hold offal until after line setting is finished
To counter the effect of these changes in fishing practices, DoC set a number of requirements designed to protect the rarer seabird species (Table 1). In particular, DoC required that, if the number of observed mortalities of petrels or albatrosses exceeded the specified value, the experiment would be terminated.
2 ‘Brilliant Blue’ is the dye used in seabird research in Japan and Hawaii (Kiyota pers. com.)3 US National Marine Services Regulations in the Hawaii longline fishery require vessels fishing north of 23 degree
north to use bait dyed to the colour intensity of a colour quality control card (Gilman et al 2003). 4 22.5 metre domestic tuna longliner, launched in 2002.5 By law tuna longliners in New Zealand must use a Tori line. Dispensation from the Ministry of Fisheries was
therefore obtained for the duration of the experiment.

5
Bait was dyed blue at sea using 30 grams (five heaped standard teaspoons) of Brilliant Blue dye placed in a one litre container and thoroughly mixed with 800 millilitres of freshwater. The concentrated dye mixture was poured into a 200 litre plastic drum which contained 40 litres of seawater and 400 squid (the process was repeated for a second drum containing another 400 baits). To ensure that all the bait surfaces had maximum exposure to the dye and that the bait had thawed, the bait and dye mixture was regularly stirred with a broom over the course of one hour before the longline set commenced. The result was that a consistent dye uptake by the squid bait was achieved. This at-sea, pre-fishing dyeing process is similar to the method used by fishermen in Hawaii. In Japan, researchers dye the bait blue on land and freeze it before the sea trip (Minami and Kiyota 2002).
Two deployment options (A and B) were selected for six of the seven longline sets and the determination of which deployment option came first during the field experiment was made randomly before the start of the voyage (Table 2). One option (Option A) consisted of dividing the longline set into ten alternating bait-type units with 20 metre gaps with no hooks between each unit. Each unit would contain either a dyed (A1) or control (A2) bait type. The other deployment option (Option B) consisted of dividing the longline set in half, with each half comprising a single bait type (B1: dyed; B2: control). The two bait types were separated by a 20 metre blank space containing no hooks. The bait type which constituted the first unit for any day of fishing was randomly selected before the trip began.
On the final day of the experiment, a third option (Option C) was deployed which compared two different types of blue dyed bait (‘Mix’ and ‘Brilliant Blue’) with a control. For this option, the longline was split into three sections, with about one quarter of the line containing ‘Mix’ dyed baits, a quarter of the line containing ‘Brilliant Blue’ dyed baits, and the remaining half of the longline containing control baits. Each section was separated by a 20 metre section with no hooks and the order of the different bait types on the longline was determined randomly.
This proposed design (Table 2) takes into account the fact that observations of capture on successive hooks on the longline are probably not independent of captures on adjacent hooks; i.e., the capture rate of seabirds on successive hooks is likely correlated. For this reason, designs which alternated the bait type on successive hooks were rejected because of the potential of confounding interaction effects when bait type treatments are adjacent to each other in an alternating design.
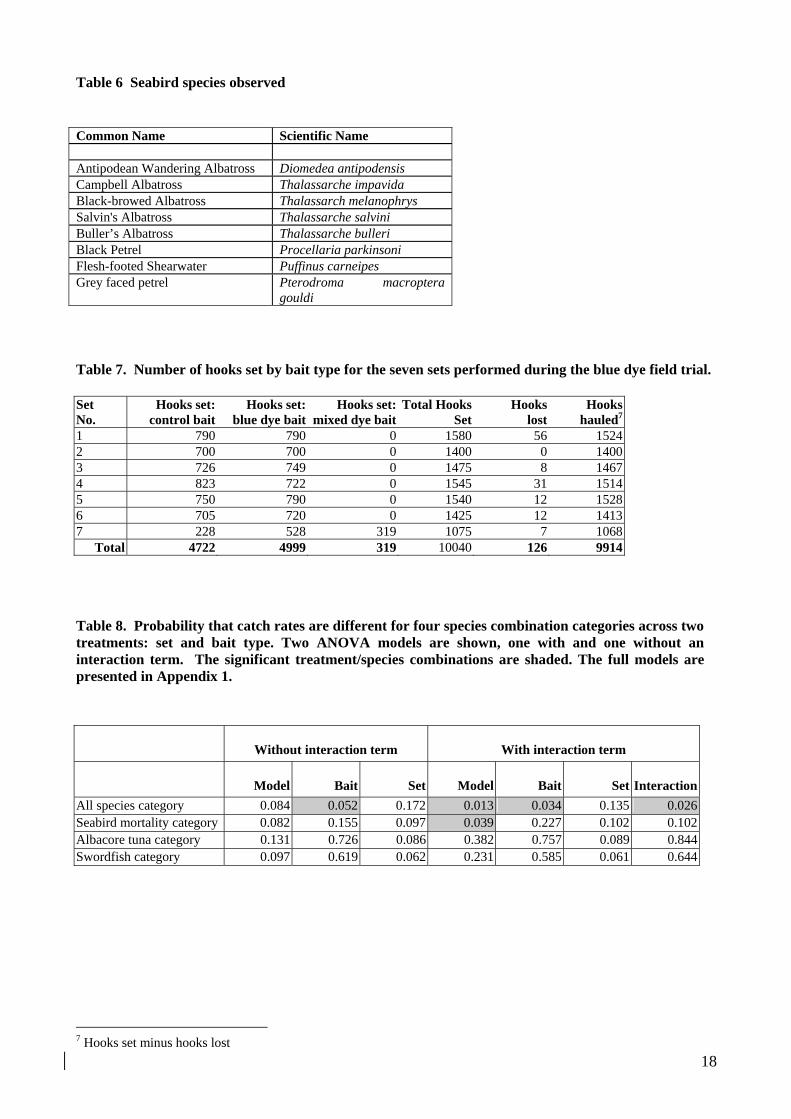
ResultsA total of seven longline sets were observed over a 12 day trip (Table 3). Typically, four to five hours were required to set approximately 1500 hooks during daylight hours (0600 untl 1900). Set 7 took three hours to set approximately 1000 hooks (Table 3). Soak time varied between 12 and 18 hours, with a median soak time of 15 hours. Sets were generally comparable in terms of speed, depth set, and length of buoy (Table 3). A total of 197 fish were taken in the 7 sets representing fourteen fish species. Not all fish were retained. For example, Ocean sunfish (Mola mola) were always released alive as they are not a commercial species (Table 4). A total of 79 fish were captured using the ‘Brilliant Blue’ dyed bait while 108 fish and 2 albatross were captured with the control bait (Table 5). Ten fish were taken with the Brazilian ‘Mix’ dyed bait in the last set. Eight seabird species were observed following the fishing vessel during fishing operations (Table 6). There were two incidents of seabird mortality in the first set on hooks using the control bait type (both juvenile male Antipodean albatross6 Diomedea antipodensis). A total of 10,040 hooks were set for the trip (Table 7).
The analysis was performed on a data set which included all the observed fish and bird mortalities. This consisted of 199 observations of hook captures and 9,715 hooks with zero catch. Note that lost
6 Autopsies and species identification performed by Chris Robertson (Wildpress Ltd) on 7 May 2004

6
hooks, which were not enumerated by bait type, were subtracted from the total number of hooks set by bait type by assuming that the hooks were lost equally between each bait type in a set. Binary dummy variables were constructed which indicated the presence/absence on a hook of a) any species; b) a seabird; c) a tuna species; d) a swordfish species.
Simple two-way ANOVA comparisons, which tested the hypothesis that catch rates were the same for the two model treatments (bait type and set number), were performed on the four binary variables (Table 8). An interaction term was added to some of the analyses, and the “mixed bait” type, which was only applied in set 7, was excluded from all analyses. More sophisticated analyses were not attempted because of the low incidence of observed bird interactions and the obvious lack of contrast between bait types in the catch data by species (Table 5).
Two of the models which included interaction terms showed significant differences in catch rates between the bait type treatments. These were the “all species” model and the model which contrasted the rate of seabird mortalities between bait types. The bait type term and the interaction term were both significant in the “all species” model while none of the individual treatment terms or the interaction term in the seabird model was significant (Table 8). None of the other models tested showed significant differences in catch rates (Table 8).
Neither of the two models which show significant differences in catch rates between the bait types are particularly convincing. The “all species” model lumps all catches, without differentiating between species, into a single category, essentially assuming that the effect of the blue bait type is equivalent across all the fish and bird species in the analysis. The seabird model is also not very persuasive, given the non-significance of the individual model terms and the low number of observed seabird moralities. The lack of statistical power to distinguish between the individual experimental treatments is consistent with the lack of contrast in the catch data and the low number of positive observations in the data set.
The mean catch rates per 100 hooks for each of the four species combination categories investigated, for both bait types tested and for both bait types combined, are uniformly low and highly variable (Table 9). The high variance associated with each of these mean catch rates indicates how difficult it will be to obtain meaningful comparisons in this type of experimental setting. It is perhaps fortuitous that the mean seabird mortality rate (0.02/100 hooks; Table 9) reported for this experiment is in the same order of magnitude as that reported by Baird for Area 1 (0.625/1000 hooks; Baird 2003).
The analyses reported in Table 8 and Appendix 1 may not be the most appropriate for this data set because the underlying distributional assumptions of the ANOVA model may not be met. It is known that CPUE data are generally lognormally distributed, but this is for catching methods that can result in occasional very large catches. The catch data reported in this field experiment do not conform to the lognormal assumption because they are analysed at the level of individual hook observations. In this situation, once a hook is occupied, it is no longer available for capturing other individuals. This makes the analysis binary, where the assumption of a binomial distribution seems more appropriate and is the simplest one to make. The binomial distribution is probably reasonably well approximated by the ANOVA normal distribution, given the large number of hooks included in this analysis (about 10,000).
This analysis also assumes independence between the four species categories listed in Table 8 and Table 9. By analysing each species component separately, the analysis assumes that each species has an equal probability of occupying any of the 10,000 hooks that were set. This is clearly not the case, given the binary nature of the data. However, because only 2% of the hooks captured any fish or seabirds, independence is probably a reasonable approximation in this situation.

7
What defeats the experimental approach adopted here is the low number of positive observations and the inherent high level of variability. The design must be able to detect differences in mean catch per hook of a rare event associated with a high CV (Table 9). It will require a large number of observations to achieve this target, probably on the order of several hundred. The possibility of obtaining such experimental results is probably extremely unlikely, given the high societal value placed on seabirds and the long time period over which the data will have to be collected. Others (e.g., Reid and Sullivan 2004) also note that mortality of seabirds on longlines is a statistically rare event which causes difficulties in obtaining a sufficiently large sample to detect differences in mean mortality rates.
Observations of seabird behaviour relative to bait type The contrast in observed seabird behaviour around the longline between the two bait types was distinctive on six of the seven longline sets. When the control bait was used (normal squid bait), seabirds landed on the water, fought over bait, investigated the baited hooks by placing their head underwater or by occasionally diving. A seabird hierarchy or pecking order based on relative size appeared to exist because initially it was the smaller flesh footed shearwaters or black petrels who would locate the bait and then squabble over it (‘scrounging’). These seabirds tended to fly in tight figures of eight behind the vessel over the longline and vessel wake. At the same time, medium sized Black–browed, Campbell, Salvin’s or Buller’s albatrosses would be flying in wider patterns which were further away from the vessel wake. It seemed as if these larger seabirds were attracted to the bait by the commotion and vocalisation of petrels and shearwaters as they fought over the bait or offal and these larger seabirds would land with wings upraised to scare the smaller seabirds away. A further size-based hierarchy was observed when the largest seabird species (Antipodean wandering albatross) was attracted to the commotion, causing all the other seabirds to abandon the bait or offal.
When the blue dyed bait section of the longline was deployed, seabird flight patterns behind the vessel appeared to change. Large sweeping figure of eight flight paths ensued with very infrequent and brief landings on the sea surface (‘running’ on water surface and immediate takeoff). The number of seabirds following the setting of the longline also appeared to reduce in six of the seven observed longlines (while no reduction was noted in the seventh set).
The apparent indifference amongst the seabirds to the blue dyed bait was also obvious when hauling the longline. Discarded control bait was fought over by seabirds, while the discarded blue dyed bait, although detected, was either pecked at and released uneaten or ignored by the seabirds. This behaviour occurred even when the water clarity was good, with the blue dyed bait being still visible to the human eye at depth. Although the ocean water colour changes frequently, the blue dyed bait did not appear to be camouflaged even when the seawater was turbid, or green in colour. Therefore it was concluded that the lack of interest in the dyed bait by seabirds was probably not due to detection failure. When given a choice, seabirds generally avoided or ignored the blue dyed bait and appeared to actively prefer the control bait.
The final set of the trip (the seventh longline) proved to be the exception to these observations, with seabird behaviour appearing to change markedly. During this set, seabirds actively attacked the blue dyed bait (‘Mix’ and ‘Brilliant Blue’), despite setting conditions (time of day, water colour, cloud cover etc) which were similar to the previous six sets. Seabirds were observed at times persistently struggling with blue dyed baits with outstretched flapping wings at the same position on the longline until lost from view astern, but no mortalities were recorded on the haul.
DiscussionThe benefits of using dyed longline baits for enhancing seabird conservation have been reported by a number of researchers in different countries. Blue dye is a non-toxic food colouring and is

8
considered to be a form of ‘stealth gear’ designed to visually camouflage bait from seabirds while not affecting the attractiveness of the bait to the target fish species. This hypothesis requires that the dyed bait becomes more difficult for birds to detect because it reduces the contrast between the bait colour and sea colour (Gilman et al 2003), thus acting as a deception tool and hiding the dyed bait from seabirds. Another hypothesis is that the dyed bait might mask the olfactory cues for seabirds. Minami and Kiyota (2002) found that blue dyed bait reduced the feeding activity of seabirds. Boggs (2001) considered blue dyed bait to be an effective deterrent in the Hawaii pelagic longline swordfish fishery, reducing seabird contacts with blue dyed bait by 95% for Black footed albatrosses (Phoebastria nigripes) and 92% for Laysan albatrosses (Phoebastria immutabilis).
Observations made during this pilot experiment did not support the hypothesis that seabirds are deceived by blue bait. Seabirds appeared to detect blue dyed bait and were then observed to ignore it, peck at it and then discard it, or, on one of the seven sets, feed on it. This behaviour has also been observed for Laysan albatross in Hawaii (Kiyota pers. com). The hypothesis that blue dyed bait matches the sea colour is possibly biased to human eyesight. Zeigler and Bischof (1993) note that avian visual perception is sophisticated and adapted to behavioural needs – “of all the vertebrate classes, birds are the most visually dependent”. In comparison to other vertebrates, avian eyes are relatively large in proportion to body size which reflects the need for higher acuity at longer focal distance (Fernandez-Juricic et al 2004). An understanding of avian eyesight is therefore crucial to the way seabirds detect longline baits. Varela et al (1993) state that “birds have arguably the most elaborate and interesting colour vision.” This is based on the types of cells and pigments in the retina, behavioural experiments which demonstrate chromatic abilities, and ecological observations. Avian colour vision is significant for courtship displays, detecting danger signals, choice of food on land (for example, coloured fruits) and possibly navigation. Avian eyes are more morphologically complex than for mammals. For example, the inner segment of the cones contain a coloured oil droplet which forms a filter for light which varies between bird species (Zeigler and Bischof 1993).
Gilman et al (2003) suggested that blue dye was not always effective as a mitigation measure, stating:
“Crew perceive that blue-dyed bait is inconsistently effective depending on weather, light, sea surface colour and other variable environmental conditions, in addition to the inconsistency due to variability in where different crew deploy baited hooks.”
The hypothesis that seabirds avoid or reject blue dyed bait due to its colour seems to be a more likely explanation for the mechanism by which blue-dyed bait affects seabird behaviour, based on the observations made during this pilot experiment. This hypothesis assumes that seabirds detect blue dyed bait with vision that is probably more acute than human sight but either perceive blue dyed bait as unusual or as dangerous. Unfortunately, at times blue dyed bait was not effective as a deterrent to seabird feeding. This change in response to the dyed bait may be due to changes in the sea conditions, habituation, extreme hunger or some other factor. Other published research has also recorded less than 100% mitigation success with blue dyed bait (Boggs 2001, Gilman et al 2003).
Tuna longline fishermen on the East Cape of New Zealand are voluntarily increasing their use of dye in their fishing practices but tend to prefer red or green dyes because they believe these colours improve their catch rates. They hypothesize that dyed baits provide a more visible shape for target fish species. Other measures are used to reduce the incidence of seabird mortalities in the New Zealand domestic tuna longline fleet, which include night setting, offal retention during setting, and the deployment of tori lines. The voluntary use of dyed bait in this fishery is occurring because of an intention of increasing fish catch rates rather than as a seabird mitigation measure but coincidentally it may also help reduce seabird interactions, particularly when setting lines during daylight hours or near the full moon period of the lunar cycle. Further testing of dye colours other than blue would be required to confirm their efficacy.

9
A different season or area could be considered if this type of experimental work is to be repeated. One possible option would be to test red and green dye in the East Northland/Bay of Islands region, setting during the period of the full moon in July (a time when fishermen consider seabird interactions to be high). A mixture of squid and sanmar bait could be tested as fishermen have suggested that Flesh footed shearwaters seem to prefer the oily sanmar bait.
The species mix and the quantity of seabirds which follow a longline vessel while setting is highly variable and potentially affects the frequency of interactions with fishing gear. Although it is difficult to do well, future experiments should estimate the seabird abundance and species composition within a 500 metre distance astern of the vessel while setting. This will provide a direct measure of the effects of different bait types and will allow comparison with other studies of seabird interactions with longline fishing vessels. Two experienced observers would be necessary to perform such a count.
ConclusionsSeven observed longline sets in this pilot study provided insufficient data to make any definitive conclusions about the effectiveness of blue dyed bait as a measure to mitigate seabird mortalities in New Zealand waters. This preliminary field experiment indicates that a large number of observations of seabird mortalities need to be made to detect statistically significant differences between the tested treatments, given the low average mortality rate and the extremely high variance associated with these observations. The response by seabirds to blue-dyed bait is complex and requires further investigation to determine the effects that dyed baits have on seabird behaviour. Observational data on seabird behaviour may be more informative regarding the relative benefits of the different dye types than from directly observing mortality events. This could be achieved by observing differences in seabird behaviour around the various bait types and to infer the possible relative benefits from these bait types based on these observations.
Acknowledgements Laurie Hill Skipper of the ‘Polaris II’ is thanked for all of his help and advice, and the crew, Shaun Aucket, John Curry and Mita Poara for all their assistance. John Wilmer and Philippe Lallemand helped with graphics. Anjali Pande released MFish Observer data on seabird bycatch and valuable advice was provided by Masashi Kiyota, Neville Smith, Suze Baird and Ed Melvin. Chris Robertson kindly performed the autopsies and species identification on the two albatross mortalities and Pete Lamb at ‘Southern Bait and Tackle’ generously provided the bait for the preliminary dyeing experiments. This work was funded by the Conservation Services Programme, Department of Conservation, New Zealand.

10
References
Baird, S. J. 2004 Incidental capture of seabird species in commercial fisheries in New Zealand waters, 2001–02. New Zealand Fisheries Assessment Report 2004/60. 51 p.
Bartle, J.A. 1991 ‘Incidental Captue of Seabirds in the New Zealand Subantartic Squid Trawl Fishery, 1990 Bird Conserv. Intern., 1, p 351 – 359.
Boggs C.H. 2001 ‘Deterring Albatross From Catching Baits During Swordfish Longline Sets.’ (p 79-94) In Melvin E.F and Parrish J.K. (Editors) ‘Seabird Bycatch: Trends, Roadblocks and Solutions’. University of Alaska Sea Grant, AK-SG-01-01 Fairbanks 206 p.
Cherel Y. and Weimerskirch H. 1996, ‘Interactions Between Longline Vessels and Seabirds in Kerguelen Waters and a Method to Reduce Seabird Mortality’. Biological Conservation 75 p. 63-70
Fernandez-Juricic E, Erichsen J and Kacelnik A. 2004 ‘Visual Perception and Social Foraging in Birds.’ Trends in Ecology and Evolution Vol.19 (1) p.25-31.
Francis M.P, Griggs L.H, Baird S.J. 2004 ‘Fish Bycatch in New Zealand Tuna Longline Fisheries, 1998-99 to 1999-2000’ New Zealand Fisheries Assessment Report 2004/22, 62 p.
Gilman E. 2001 ‘Integrated Management to Address the Incidential Mortality of Seabirds in Longline Fisheries’. Aquatic Conserv: Mar.Freshw. Ecosyst. 11 p. 391-414.
Gilman E., Brothers N., Kobayashi D., Martin S., Cook J., Ray J., Ching G., Woods B. 2003 ‘Performance Assessment of Underwater Setting Chutes, Side Setting, and Blue-Dyed Bait to Minimize Seabird Mortality in Hawaii Pelagic Longline Tuna and Swordfish Fisheries’. Final Report. National Audubon Society, Hawaii Longline Association, U.S. National Marine Fisheries Service Pacific Islands Science Center, U.S. Western Pacific Regional Fishery Management Council: Honolulu, HI, USA. 42 p
IUCN 2002. 2002 IUCN Red List of Threatened Species. www.redlist.org/info/categories_criteria.html
Lokkeborg S. 2003 ‘Review and Evaluation of Three Mitigation Measures – Bird Scaring Line, Underwater Setting and Line Shooter – To Reduce Seabird Bycatch in the North Atlantic Longline Fishery’ Fisheries Research 60, p. 11-16
Kellian D. 2003 ‘New Zealand Northern Tuna Fleet: Report of Advisory Officer – Seabird/Fisheries Interactions 2001/02’ Doc Internal Series 99. Department of Conservation, Wellington 22 p.
Kirby D. S. Abraham E.R. Uddstrom M.J. and Dean H. 2003 ‘Tuna Schools/Aggregations in Surface Longline Data 1993-98.’ New Zealand Journal of Marine and Freshwater Research Vol. 37: 633-644.

11
Kock K. 2001 ‘The Direct Influence of Fishing and Fishery-related Activities on Non-target Species in the Southern Ocean with Particular Emphasis on Longline Fishing and its Impact on Albatrosses and Petrels – A Review’ Reviews in Fish Biology and Fisheries 11 p. 31-56.
Minami H. and Kiyota 2002 ‘Effect of Blue- Dyed Bait on Reduction of Incidental Take of Seabirds’ (draft) 4 p.
Ministry of Fisheries and the Department of Conservation 2004 ‘National Plan of Action to Reduce the Incidental Catch of Seabirds in New Zealand Fisheries’ April 2004 Prepared by the Ministry of Fisheries and Department of Conservation 58 p.
Reid T. A., Sullivan B.J. 2004 ‘Longliners, black browed albatross mortality and bait scavenging in Falkland Island waters: what is the relationship? Polar Biology Vol 27, (3) p. 131-139
Sanchez A, Belda E.J. 2003. ‘Bait Loss Caused by Seabirds on Longline Fisheries in the Northwestern Mediterranean: is Night Setting an Effective Mitigation Measure?’ Fisheries Research 60 p. 99-106
Tasker M.L., Camphuysen C.J., Cooper J.. Garthe S., Montevecchi W.A. and Blaber S.J.M. 2000, ‘The Impacts of Fishing on Marine Birds’ ICES J. of Mar. Sci. 57 p. 531-547.
Unwin M, Uddstrom M and Zheng X. 2003 ‘Hotspots for Catching Tuna’ Seafood New Zealand Sept. 2003 Vol. 11 (8). P 22-24.
Varela F.J, Palacios A.G. and Goldsmith T.H. 1993 ‘Colour Vision of Birds’ (pp 77-101 in Zeigler and Bischof 1993)
Zeigler H.P. and Bischof H.J. Eds 1993 ‘Vision, Brain and Behaviour in Birds’ Cambridge, MA:MIT Press 415 p.

12
Figure 1 ‘Area 1’ (from Baird 2003)

13
200m
1000m
7e
7s
6e
6s
5e
5s
4e
4s 3e
3s
2e
2s 1e1s
174°30'E
174°30'E
175°30'E
175°30'E
176°30'E
176°30'E
177°30'E
177°30'E
178°30'E
178°30'E
179°30'E
179°30'E
179°30'0"W
179°30'0"W
178°30'0"W
178°30'0"W
42°S 42°S
41°30'S 41°30'S
41°S 41°S
40°30'S 40°30'S
40°S 40°S
39°30'S 39°30'S
39°S 39°S
38°30'S 38°30'S
38°S 38°S
37°30'S 37°30'S
37°S 37°S
36°30'S 36°30'S
36°S 36°S
35°30'S 35°30'S
35°S 35°S
34°30'S 34°30'S
-0 30 60 9015Nautical Miles
Blue dye bait experiment - 2004
© New Zealand Seafood Industry Council, Ltd 2004
Figure 2 Location of seven long line sets made between 16 and 27 March 2004. Sets are numbered and the start(s) and end (e) of the longline is marked accordingly.

14
Table 1 New Zealand Department of Conservation Seabird Mortality Trip Limit
Albatross Common Name Scientific Name Limit
Gibson’s Wandering Diomedea gibsoni 5
Antipodean Wandering Diomedea antipodensis 5
Northern Royal Diomedea sanfordi 5
Southern Royal Diomedea epomophora 5
Light-mantled Sooty Phoebetria palpebrata 5
Grey-headed Thalassarche chrysostoma 3
Chatham Island * Thalassarche eremita 0Maximum Total No. Albatrosses (over all species) 10
Petrels/shearwaters
Black petrel Procellaria parkinsoni 5
Grey petrel Procellaria cinerea 15
Buller's shearwater Puffinus bulleri 15Other petrels & Shearwaters (per species) 20
Maximum Total No. Petrels/shearwaters 40
*Terminate experiment if one enters area, and restart after it has left

Tab
le 2
Exp
erim
enta
l Des
ign
Op
tion
s fo
r B
ait
Dep
loym
ent
by
Day
D
esig
n O
pti
on*
Set
ting
Ord
er –
F
irst
Set
ting
Ord
er -
Sec
ond
S
etti
ng O
rder
–
Th
ird
Day
1
B
B2
con
trol
(un
dyed
bai
t)
B1
Blu
e dy
ed b
ait
D
ay 2
A
A
2 co
ntro
l (un
dyed
bai
t)
A1
Blu
e dy
ed b
ait
D
ay 3
B
B
1 bl
ue d
yed
bait
B
2 co
ntro
l (un
dyed
bai
t)
D
ay 4
A
A
1 B
lue
dyed
bai
t A
2 co
ntro
l (un
dyed
bai
t)
D
ay 5
B
B
2 c
ontr
ol (
undy
ed b
ait)
B
1 B
lue
dyed
bai
t
Day
6
A
A2
cont
rol (
undy
ed b
ait)
A
1 B
lue
dyed
bai
t
Day
7
C
C1
Bri
llia
nt b
lue
dyed
bai
t C
2 co
ntro
l (un
dyed
bai
t)
C3
Bra
zil b
lue
dyed
bai
t
*A:
lon
glin
e is
div
ided
into
10
alte
rnat
ing
un
its
B:
lon
glin
e is
div
ided
in h
alf
C:
lon
glin
e is
div
ided
into
3 u
nit
s
Tab
le 3
D
ata
sum
mar
y fo
r th
e se
ven
set
s u
nd
erta
ken
du
rin
g th
e b
lue
dye
d b
ait
fiel
d t
rial
. T
he
‘tim
e se
t’ i
s th
e ti
me
from
th
e fi
rst
hoo
k s
et t
o th
e la
st.
Wh
ile
‘soa
k t
ime’
is t
he
per
iod
fro
m t
he
firs
t h
ook
set
to
the
retr
ieva
l of
the
firs
t h
ook
. Th
e ‘b
uoy
rop
e le
ngt
h’
is t
he
dis
tan
ce t
he
bu
oys
wer
e at
tach
ed t
o th
e li
ne.
Th
e m
inim
um
an
d m
axim
um
dep
ths
refe
r to
th
e d
epth
bel
ow t
he
surf
ace .
Set
No.
Dat
e S
tart
L
atit
ud
e L
ongi
tud
eF
inis
hL
atit
ud
e L
ongi
tud
eT
ime
of d
ay
wh
en li
ne
set
Tim
e ta
ken
to
set
lin
e (h
) S
oak
tim
e (h
)L
engt
h li
ne
(km
) N
o.b
aske
ts
Sp
eed
(k
m/h
)B
uoy
Rop
e le
ngt
h (
m)
Min
.d
epth
(m
) M
ax.
dep
th (
m)
% c
lou
d
cove
rage
Bar
o-m
eter
1
17/0
3/20
04
39:4
0 S
17
9:39
W
39:4
0 S
17
8:51
W
14:5
0 4.
67
15.4
2 60
.2
200
13.9
5
25
45
90%
99
5 2
18/0
3/20
04
39:3
8 S
17
9:17
W
39:4
9 S
17
9:52
W
16:2
0 4.
17
18.4
2 51
.9
175
13.0
5
25
45
50%
99
8 3
20/0
3/20
04
37:4
9 S
17
9:18
W
37:2
4 S
17
8:56
W
6:10
4.
58
11.8
3 55
.6
188
13.9
5
30
50
20%
99
8 4
21/0
3/20
04
37:2
5 S
18
0:00
E
36:5
1 S
18
0:00
E
1:20
4.
33
16.3
3 59
.3
160
13.0
15
25
70
40
%
998
5 22
/03/
2004
36
:36
S
179:
53 E
37
:03
S
179:
45 E
15
:30
4.25
15
.00
59.3
11
0 13
.0
10
35
55
15%
99
8 6
24/0
3/20
04
39:1
3 S
17
9:15
E
38:4
7 S
17
9:22
E
14:1
5 4.
08
16.2
5 53
.7
107
13.0
10
45
65
50
%
987
7 25
/03/
2004
39
:47
S
179:
35 E
40
:08
S
179:
33 E
16
:05
2.92
14
.92
38.9
78
14
.3
10
40
60
30%
99
9

Table 4 Common and scientific name of fish species caught during the experimental fishery
Common Name Scientific Name Commercial Species?
Albacore Thunnus alalunga YesBigeye thresher shark Alopias superciliosus YesBlack Marlin Makaira indica NoBlue shark Prionace glauca YesBroadbill swordfish Xiphias gladius YesMako shark Isurus oxyrinchus YesMoonfish Lampris guttatus YesOcean Sunfish Mola mola NoOilfish Ruvettus pretiosus YesPelagic ray Pteroplatytrygon violacea NoPorbeagle shark Lamna nasus YesRay’s bream Brama brama YesRudderfish Centrolophus niger YesShort snouted Lancetfish Alepisaurus breviostris No

17
Table 5 Number of species captured by set and bait type (including a total across all three bait types).
Set Number 1 2 3 4 5 6 7 Total
Blue dye bait only Species captured Albacore 2 1 3 Blue Shark 6 1 1 2 1 6 17 Lancetfish 3 9 3 4 1 4 24 Mako Shark 1 1 Moonfish 1 1 1 3 Pelagic stingray 1 1 2 Porbeagle Shark 2 2 Rays Bream 1 1 Rudderfish 1 1 2 1 5 Sunfish 1 1 2 2 6 Swordfish 6 3 3 2 1 15 Total 18 15 9 12 6 18 1 79
Control bait only
Albatross 2 2 Albacore 1 1 2 4 Black Marlin 1 1 2 Blue Shark 3 2 4 6 2 2 19 Lancetfish 11 2 3 4 2 1 3 26 Mako Shark 1 1 1 2 1 6 Moonfish 3 3 Oilfish 1 1 Pelagic stingray 1 1 1 3 Porbeagle Shark 3 3 Rudderfish 1 2 1 5 2 2 13 Sunfish 2 2 1 1 2 8 Swordfish 4 1 4 5 3 1 18 Thresher shark 1 1 Unknown 1 1 Total 24 9 11 17 24 13 12 110
‘Mix’ dyed bait only
Blue Shark 2 2 Moonfish 1 1 Porbeagle Shark 1 1 Rudderfish 6 6 Total 10 10
All bait types combined
Albatross 2 2 Albacore 1 3 3 7 Black Marlin 1 1 2 Blue Shark 9 1 3 6 7 8 4 38 Lancetfish 14 11 6 8 3 5 3 50 Mako Shark 1 1 2 2 1 7 Moonfish 1 1 3 1 1 7 Oilfish 1 1 Pelagic stingray 2 1 2 5 Porbeagle Shark 2 4 6 Rays Bream 1 1 Rudderfish 2 2 1 6 4 9 24 Sunfish 3 3 1 3 2 2 14 Swordfish 10 4 7 7 4 1 33 Thresher shark 1 1 Unknown 1 1 Total 42 24 20 29 30 31 23 199
18
Table 6 Seabird species observed
Common Name Scientific Name
Antipodean Wandering Albatross Diomedea antipodensisCampbell Albatross Thalassarche impavida Black-browed Albatross Thalassarch melanophrys Salvin's Albatross Thalassarche salviniBuller’s Albatross Thalassarche bulleriBlack Petrel Procellaria parkinsoniFlesh-footed Shearwater Puffinus carneipes Grey faced petrel Pterodroma macroptera
gouldi
Table 7. Number of hooks set by bait type for the seven sets performed during the blue dye field trial.
SetNo.
Hooks set: control bait
Hooks set: blue dye bait
Hooks set: mixed dye bait
Total Hooks Set
Hookslost
Hookshauled7
1 790 790 0 1580 56 1524 2 700 700 0 1400 0 1400 3 726 749 0 1475 8 1467 4 823 722 0 1545 31 1514 5 750 790 0 1540 12 1528 6 705 720 0 1425 12 1413 7 228 528 319 1075 7 1068
Total 4722 4999 319 10040 126 9914
Table 8. Probability that catch rates are different for four species combination categories across two treatments: set and bait type. Two ANOVA models are shown, one with and one without an interaction term. The significant treatment/species combinations are shaded. The full models are presented in Appendix 1.
Without interaction term With interaction term
Model Bait Set Model Bait Set Interaction
All species category 0.084 0.052 0.172 0.013 0.034 0.135 0.026Seabird mortality category 0.082 0.155 0.097 0.039 0.227 0.102 0.102Albacore tuna category 0.131 0.726 0.086 0.382 0.757 0.089 0.844Swordfish category 0.097 0.619 0.062 0.231 0.585 0.061 0.644
7 Hooks set minus hooks lost

19
Table 9. Mean, standard deviation (SD) and coefficient of variation (CV) of the catch rate per 100 hooks for each bait type and for both bait types combined for each of the four species combination categories. The “mixed bait” type has been dropped from these summaries.
Blue bait type Control bait type Both bait types combined
Mean SD CV(%) Mean SD CV(%) Mean SD CV(%)
All species category 1.70 12.91 762 2.23 14.76 663 1.97 13.89 706Seabird mortality category 0.00 0.00 – 0.04 2.01 4969 0.02 1.44 6940Albacore tuna category 0.06 2.54 3939 0.08 2.85 3513 0.07 2.70 3703Swordfish category 0.32 5.66 1760 0.36 6.03 1654 0.34 5.85 1703
APPENDIX 1. ANALYSIS OF VARIANCE TESTS PERFORMED ON FULL DATA SET
Note: all analyses exclude the “Mix blue dyed bait” used in set 7
1. All species with bait and set
Two-way:
Number of obs = 9598 R-squared = 0.0013 Root MSE = .138905 Adj R-squared = 0.0006
Source Partial SS df MS F Prob > F Model .242207165 7 .034601024 1.79 0.0839 bait .073011153 1 .073011153 3.78 0.0518
set .174264864 6 .029044144 1.51 0.1719
Residual 185.03608 9590 .01929469
Total 185.278287 9597 .019305855
Two-way with interactions:
Number of obs = 9598 R-squared = 0.0028 Root MSE = .138844 Adj R-squared = 0.0015
Source Partial SS df MS F Prob > F Model .519974942 13 .039998072 2.07 0.0126 bait .0862821 1 .0862821 4.48 0.0344 set .188107455 6 .031351242 1.63 0.1354 bait*set .277767777 6 .04629463 2.40 0.0255 Residual 184.758312 9584 .019277787 Total 185.278287 9597 .019305855

20
2. Seabird mortalities with bait and set
Two-way:
Number of obs = 9598 R-squared = 0.0013 Root MSE = .01443 Adj R-squared = 0.0006
Source Partial SS df MS F Prob > F Model .002630216 7 .000375745 1.80 0.0818 bait .000422297 1 .000422297 2.03 0.1545 set .002236925 6 .000372821 1.79 0.0968 Residual 1.99695303 9590 .000208233 Total 1.99958325 9597 .000208355
Two-way with interactions:
Number of obs = 9598 R-squared = 0.0024 Root MSE = .014427 Adj R-squared = 0.0011
Source Partial SS df MS F Prob > F Model .00483259 13 .000371738 1.79 0.0393bait .000304508 1 .000304508 1.46 0.2265 set .002202375 6 .000367062 1.76 0.1023
bait*set .002202375 6 .000367062 1.76 0.1023 Residual 1.99475066 9584 .000208133 Total 1.99958325 9597 .000208355
3. Albacore tuna catch with bait and set
Two-way:
Number of obs = 9598 R-squared = 0.0012 Root MSE = .026992 Adj R-squared = 0.0004
Source Partial SS df MS F Prob > F Model .008144909 7 .001163558 1.60 0.1311 bait .000089575 1 .000089575 0.12 0.7259 set .008078631 6 .001346438 1.85 0.0858 Residual 6.98674986 9590 .000728545 Total 6.99489477 9597 .000728863

21
Two-way with interactions:
Number of obs = 9598 R-squared = 0.0014 Root MSE = .026996 Adj R-squared = 0.0001
Source Partial SS df MS F Prob > F Model .01012241 13 .000778647 1.07 0.3818 bait .000069625 1 .000069625 0.10 0.7573 set .008001467 6 .001333578 1.83 0.0892 Bait*set .001977501 6 .000329583 0.45 0.8438 Residual 6.98477236 9584 .000728795 Total 6.99489477 9597 .000728863
4. Swordfish catch with bait and set
Two-way:
Number of obs = 9598 R-squared = 0.0013 Root MSE = .058523 Adj R-squared = 0.0005
Source Partial SS df MS F Prob > F Model .041516307 7 .005930901 1.73 0.0968 bait .000846203 1 .000846203 0.25 0.6192 set .041080574 6 .006846762 2.00 0.0622 Residual 32.8450226 9590 .003424924 Total 32.8865389 9597 .003426752
Two-way with interactions:
Number of obs = 9598 R-squared = 0.0017 Root MSE =.058528 Adj R-squared = 0.0003
Source Partial SS df MS F Prob > F Model .056035688 13 .004310438 1.26 0.2306 bait .001023113 1 .001023113 0.30 0.5847 set .041319071 6 .006886512 2.01 0.0607 bait*set .014519381 6 .002419897 0.71 0.6444 Residual 32.8305032 9584 .003425553 Total 32.8865389 9597 .003426752

22