Effect of aggregate type, casting, thickness and curing...
12
Original Article Effect of aggregate type, casting, thickness and curing condition on restrained strain of mass concrete Pongsak Choktaweekarn* and Somnuk Tangtermsirikul Construction and Maintenance Technology Research Center, Sirindhorn International Institute of Technology, Thammasat University, Pathum Thani, 12120 Thailand. Received 5 January 2009; Accepted 5 July 2010 Abstract In this paper, a three-dimensional finite element analysis is used for computing temperature and restrained strain in mass concrete. The model takes into account time, material properties, and mix proportion dependent behavior of concrete. The hydration heat and thermal properties used in the finite element analysis are obtained from our previously proposed adiabatic temperature rise model and are used as the input in the analysis. The analysis was done by varying size of mass concrete (especially thickness) and the casting method in order to explain their effect on temperature and restrained strain in mass concrete. The casting methods used in the analysis are continuous and discontinuous casting. The discontinuous casting consists of layer casting and block casting. Different types of aggregate were used in the analysis for studying the effect of thermal properties of aggregate on temperature and restrained strain in mass concrete. Different conditions of curing (insulation and normal curing) were also studied and compared. It was found from the analytical results that the maximum temperature increases with the increase of the thickness of structure. The use of layer casting is more effective for thermal cracking control of mass concrete. The insulation curing method is preferable for mass concrete. Aggregate with low co- efficient of thermal expansion is beneficial to reduce the restrained strain. Keywords: finite element analysis, semi-adiabatic temperature, restrained strain, mass concrete, thermal cracking Songklanakarin J. Sci. Technol. 32 (4), 391-402, Jul. - Aug. 2010 1. Introduction Mass concrete is defined for large dimension construc- tion such as dams, and mat foundations. In massive concrete structures, the temperature rise due to heat of hydration causes the temperature gradients which can induce cracks especially at early age. In some construction projects, thermal insulating blankets were used to minimize the interior and exterior concrete temperature gradient (Whittier et al., 2004). Generally, for crack control, maximum temperature difference within the concrete mass should not exceed 20C (Neville, 1995), but with limestone aggregate, the difference can be allowed up to 31C (Portland Cement Association, 2003). The prediction of temperature gradient of mass concrete is essen- tially useful for crack control analysis and design. Several techniques have been reported in the literature for evaluation of the thermal stress and specifying construction technique. For example, the U.S. Army Corps of Engineers, in Engineer- ing and Technical Letter (1997) and ACI (2005) provide design guides for thermal analysis of mass concrete. However, those design guides are complicate for manual calculation and cannot be used for various types of cementitious materials or complicate methods of construction. Many researchers have developed models to simulate temperature of mass concrete (Isgor and Razaqpur, 2004; Kwak et al., 2006; Sarker et al., 1999; Maekawa et al., 1999; Wang and Dilger, 1994; Park et al., 2008; Faria et al., 2006; Saengsoy and Tangterm- sirikul, 2003). Some of them did not include the effect of fly ash (Isgor and Razaqpur, 2004; Park et al., 2008). In this study, the adiabatic temperature rise model which was devel- * Corresponding author. Email address: [email protected]
Transcript of Effect of aggregate type, casting, thickness and curing...
Original Article
Effect of aggregate type, casting, thickness and curing conditionon restrained strain of mass concrete
Pongsak Choktaweekarn* and Somnuk Tangtermsirikul
Construction and Maintenance Technology Research Center, Sirindhorn International Institute of Technology,Thammasat University, Pathum Thani, 12120 Thailand.
Received 5 January 2009; Accepted 5 July 2010
Abstract
In this paper, a three-dimensional finite element analysis is used for computing temperature and restrained strain inmass concrete. The model takes into account time, material properties, and mix proportion dependent behavior of concrete.The hydration heat and thermal properties used in the finite element analysis are obtained from our previously proposedadiabatic temperature rise model and are used as the input in the analysis. The analysis was done by varying size of massconcrete (especially thickness) and the casting method in order to explain their effect on temperature and restrained strain inmass concrete. The casting methods used in the analysis are continuous and discontinuous casting. The discontinuouscasting consists of layer casting and block casting. Different types of aggregate were used in the analysis for studying theeffect of thermal properties of aggregate on temperature and restrained strain in mass concrete. Different conditions of curing(insulation and normal curing) were also studied and compared. It was found from the analytical results that the maximumtemperature increases with the increase of the thickness of structure. The use of layer casting is more effective for thermalcracking control of mass concrete. The insulation curing method is preferable for mass concrete. Aggregate with low co-efficient of thermal expansion is beneficial to reduce the restrained strain.
Keywords: finite element analysis, semi-adiabatic temperature, restrained strain, mass concrete, thermal cracking
Songklanakarin J. Sci. Technol.32 (4), 391-402, Jul. - Aug. 2010
1. Introduction
Mass concrete is defined for large dimension construc-tion such as dams, and mat foundations. In massive concretestructures, the temperature rise due to heat of hydrationcauses the temperature gradients which can induce cracksespecially at early age. In some construction projects, thermalinsulating blankets were used to minimize the interior andexterior concrete temperature gradient (Whittier et al., 2004).Generally, for crack control, maximum temperature differencewithin the concrete mass should not exceed 20C (Neville,1995), but with limestone aggregate, the difference can beallowed up to 31C (Portland Cement Association, 2003). The
prediction of temperature gradient of mass concrete is essen-tially useful for crack control analysis and design. Severaltechniques have been reported in the literature for evaluationof the thermal stress and specifying construction technique.For example, the U.S. Army Corps of Engineers, in Engineer-ing and Technical Letter (1997) and ACI (2005) provide designguides for thermal analysis of mass concrete. However, thosedesign guides are complicate for manual calculation andcannot be used for various types of cementitious materialsor complicate methods of construction. Many researchershave developed models to simulate temperature of massconcrete (Isgor and Razaqpur, 2004; Kwak et al., 2006; Sarkeret al., 1999; Maekawa et al., 1999; Wang and Dilger, 1994;Park et al., 2008; Faria et al., 2006; Saengsoy and Tangterm-sirikul, 2003). Some of them did not include the effect of flyash (Isgor and Razaqpur, 2004; Park et al., 2008). In thisstudy, the adiabatic temperature rise model which was devel-
* Corresponding author.Email address: [email protected]
P. Choktaweekarn & S. Tangtermsirikul / Songklanakarin J. Sci. Technol. 32 (4), 391-402, 2010392
oped by Saengsoy and Tangtermsirikul (2003) to predict heatgenerated from the hydration and pozzolanic reaction andadiabatic temperature rise of mass concrete with fly ash isadopted. Details of the model are briefly mentioned in section2. Verifications of the model showed that the proposed modelwas satisfactory for predicting the adiabatic temperature ofvarious test results. Heat of hydration and pozzolanic re-actions which was obtained from the adiabatic temperaturerise model was used as the input for a FEM program, MARC,by Choktaweekarn and Tangtermsirikul (2007) to analyze thesemi-adiabatic temperature rise of concrete. Details of themodel were mentioned in Choktaweekarn and Tangterm-sirikul (2007). The verifications showed that the model weresatisfactory for predicting temperature of the test results inlaboratory and measured results in some real mass concretefootings. In this paper, FEM program was used to calculatenot only the semi-adiabatic temperature but also restrainedstrain. The analytical results of the proposed model were veri-fied with the test results obtained from the real mass concretefooting. An example of the verification for a real massconcrete footing is shown in section 3. Tensile strain capacity(TSC) of concrete is used as the criterion of failure to eva-luate thermal cracking in mass concrete (Lu et al., 2001;Tongaroonsri and Tangtermsirikul, 2008). TSC of concreteused in this study was obtained from Tongaroonsri andTangtermsirikul (2008) and test results conducted by Lu et al.(2001).
In the case of massive concrete with very large size,casting usually cannot be finished at one time. Technique ofdiscontinuous casting typically layer casting or block castingwas used in order to minimize temperature gradient of massconcrete. The selection of proper dimension and numbers ofconcrete blocks or layers in order to prevent thermal crackingis one of the important steps for mass concrete construction.The use of different type of aggregate has an effect onthermal properties of concrete which influences semi-adiabatic temperature and thermal stress. Curing method andcuring period are also important to prevent thermal crackingduring the construction process. Many massive structurescrack because of the application of unsuitable curing methodand curing period. The objectives of this study are to explainand propose a method to compute the temperature andrestrained strain in mass concrete by taking into account thefooting dimension, casting method, aggregate type, curingcondition and curing period in order to prevent thermalcracking.
2. Method of Analysis
Heat of hydration and pozzolanic reaction which wereobtained from adiabatic temperature rise model were used asthe input for a FEM program, MARC. Thermal properties;which are specific heat, thermal conductivity and coefficientof thermal expansion (CTE) are obtained from Choktawee-karn et al. (2009a), Choktaweekarn et al. (2009b) and Chok-taweekarn and Tangtermsirikul, (2006), respectively. FEM
program was used to analyze the semi-adiabatic temperaturerise of concrete. For the proposed model, three dimensionaleight-node brick was used in the analysis. The consideredtime interval is divided into several increments, each incre-ment equals to one hour. The couple thermo-mechanicalproblem was used in the analysis in which thermal analysisis solved first. The temperature obtained from the thermalanalysis is used as the input for the computation of therestrained strain. The details are elaborated below.
2.1 Thermal analysis
By the use of the common thermal analysis which wasmentioned by many researchers (Isgor and Razaqpur, 2004;Kwak et al., 2006; Sarker et al., 1999; Maekawa et al., 1999;Wang and Dilger, 1994; Park et al., 2008; Faria et al., 2006)with the heat of hydration and pozzolanic reaction andthermal properties models obtained from Saengsoy andTangtermsirikul (2003), Choktaweekarn et al. (2009a), Chok-taweekarn et al. (2009b), Choktaweekarn and Tangtermsirikul(2006) and Choktaweekarn and Tangtermsirikul, (2009), thesemi-adiabatic temperature distribution in the concrete masscan be analyzed.
The governing equation of heat transfer for tempera-ture prediction of mass concrete with consideration of heatof hydration is shown in Eq. (1).
zTk
zyTk
yxTk
xq
tTc zyxhy
(1)where: kx, ky, kz are the thermal conductivity of concrete in x,y and z direction, respecitvely (kcal/m hr C). r is concretedensity (kg/m3), c is specific heat of concrete (kcal/ kg C),qhy is the rate of internal heat generated by hydration andpozzolanic reaction per unit volume (kcal/m3 hr). t is age ofconcrete (hr.). T is temperature of concrete (C).
The total heat generation of concrete was computedfrom the summation of the heat liberated due to the reactionof each cement compounds including the formation ofettringite and monosulphate and the reaction of fly ash as
( )Q t 3 2 3 4
( ) ( ) ( ) ( )C S C S C A C AFQ t Q t Q t Q t
3 4( ) ( ) ( )C AET C AFET FAQ t Q t Q t (2)
where Q(t) is the total heat generation of concrete at theconsidered age (kcal/kg of concrete). ),t(Q),t(Q),t(Q ACSCSC 323
)t(Qand),t(Q FAAFC4 are the cumulative heat generation of
C3S, C2S, C3A, C4AF, and fly ash, respectively, at the consid-ered age (kcal/kg of concrete). )t(Q AETC3
and )t(Q AFETC4are
cumulative heat generation of the ettringite and monosul-phate formation by C3A, and C4AF reacting with gypsum,respectively, at the considered age (kcal/kg of concrete).
Some details for calculation of heat generation arebriefly mentioned below. More details can be found inSaengsoy and Tangtermsirikul (2003). The cumulative heatgeneration of each cement compound was considered to be
393P. Choktaweekarn & S. Tangtermsirikul / Songklanakarin J. Sci. Technol. 32 (4), 391-402, 2010
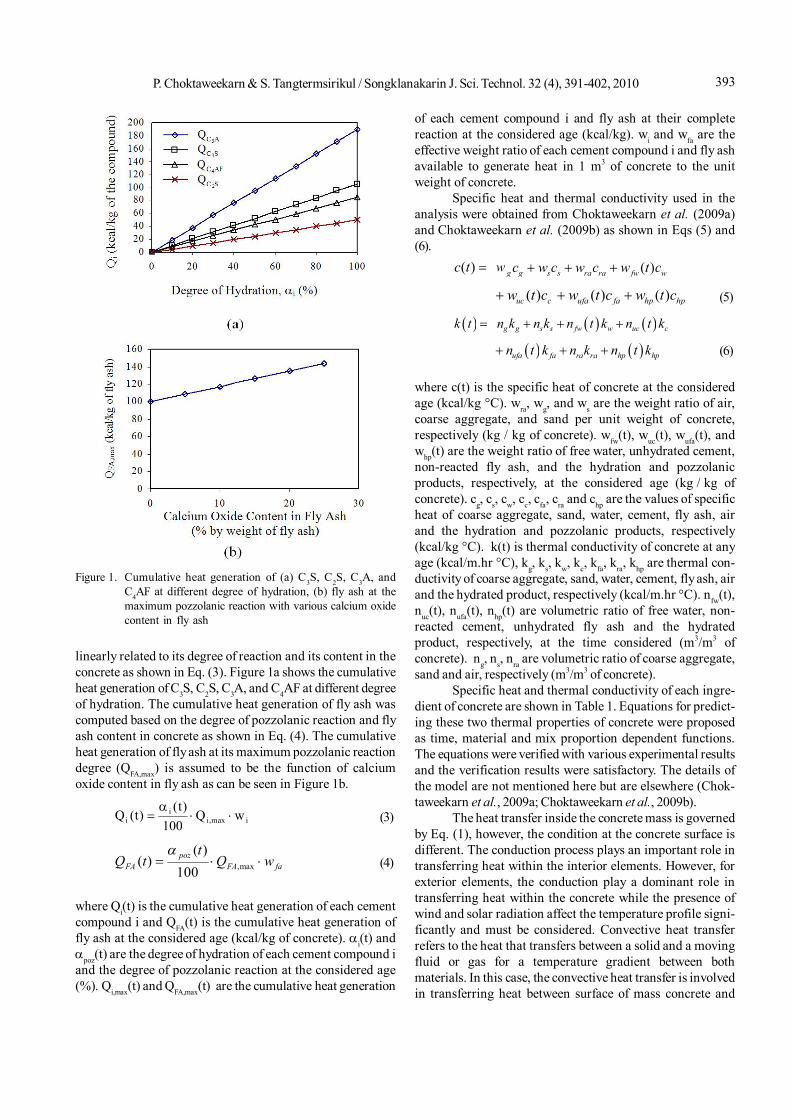
linearly related to its degree of reaction and its content in theconcrete as shown in Eq. (3). Figure 1a shows the cumulativeheat generation of C3S, C2S, C3A, and C4AF at different degreeof hydration. The cumulative heat generation of fly ash wascomputed based on the degree of pozzolanic reaction and flyash content in concrete as shown in Eq. (4). The cumulativeheat generation of fly ash at its maximum pozzolanic reactiondegree (QFA,max) is assumed to be the function of calciumoxide content in fly ash as can be seen in Figure 1b.
imax,ii
i wQ100
)t()t(Q
(3)
faFApoz
FA wQt
tQ max,100)(
)(
(4)
where Qi(t) is the cumulative heat generation of each cementcompound i and QFA(t) is the cumulative heat generation offly ash at the considered age (kcal/kg of concrete). i(t) andpoz(t) are the degree of hydration of each cement compound iand the degree of pozzolanic reaction at the considered age(%). Qi,max(t) and QFA,max(t) are the cumulative heat generation
of each cement compound i and fly ash at their completereaction at the considered age (kcal/kg). wi and wfa are theeffective weight ratio of each cement compound i and fly ashavailable to generate heat in 1 m3 of concrete to the unitweight of concrete.
Specific heat and thermal conductivity used in theanalysis were obtained from Choktaweekarn et al. (2009a)and Choktaweekarn et al. (2009b) as shown in Eqs (5) and(6).
( )c t w ( )g g s s ra ra fw wc w c w c w t c
( ) ( ) ( )uc c ufa fa hp hpw t c w t c w t c (5)
k t g g s s fw w uc cn k n k n t k n t k
ufa fa ra ra hp hpn t k n k n t k (6)
where c(t) is the specific heat of concrete at the consideredage (kcal/kg °C). wra, wg, and ws are the weight ratio of air,coarse aggregate, and sand per unit weight of concrete,respectively (kg / kg of concrete). wfw(t), wuc(t), wufa(t), andwhp(t) are the weight ratio of free water, unhydrated cement,non-reacted fly ash, and the hydration and pozzolanicproducts, respectively, at the considered age (kg / kg ofconcrete). cg, cs, cw, cc, cfa, cra and chp are the values of specificheat of coarse aggregate, sand, water, cement, fly ash, airand the hydration and pozzolanic products, respectively(kcal/kg °C). k(t) is thermal conductivity of concrete at anyage (kcal/m.hr °C), kg, ks, kw, kc, kfa, kra, khp are thermal con-ductivity of coarse aggregate, sand, water, cement, fly ash, airand the hydrated product, respectively (kcal/m.hr °C). nfw(t),nuc(t), nufa(t), nhp(t) are volumetric ratio of free water, non-reacted cement, unhydrated fly ash and the hydratedproduct, respectively, at the time considered (m3/m3 ofconcrete). ng, ns, nra are volumetric ratio of coarse aggregate,sand and air, respectively (m3/m3 of concrete).
Specific heat and thermal conductivity of each ingre-dient of concrete are shown in Table 1. Equations for predict-ing these two thermal properties of concrete were proposedas time, material and mix proportion dependent functions.The equations were verified with various experimental resultsand the verification results were satisfactory. The details ofthe model are not mentioned here but are elsewhere (Chok-taweekarn et al., 2009a; Choktaweekarn et al., 2009b).
The heat transfer inside the concrete mass is governedby Eq. (1), however, the condition at the concrete surface isdifferent. The conduction process plays an important role intransferring heat within the interior elements. However, forexterior elements, the conduction play a dominant role intransferring heat within the concrete while the presence ofwind and solar radiation affect the temperature profile signi-ficantly and must be considered. Convective heat transferrefers to the heat that transfers between a solid and a movingfluid or gas for a temperature gradient between bothmaterials. In this case, the convective heat transfer is involvedin transferring heat between surface of mass concrete and
Figure 1. Cumulative heat generation of (a) C3S, C2S, C3A, andC4AF at different degree of hydration, (b) fly ash at themaximum pozzolanic reaction with various calcium oxidecontent in fly ash
P. Choktaweekarn & S. Tangtermsirikul / Songklanakarin J. Sci. Technol. 32 (4), 391-402, 2010394
environment (between concrete and air). The amount of heattransfer per unit surface through convection at the surfaceof concrete can be calculated according to Newton’s coolinglaw. The convection heat transfer coefficient, h, is depend-ent on the type of media, gas or liquid, the flow propertiessuch as velocity, viscosity and other flow and temperaturedependent properties. For simplicity, the radiation is usuallyaccounted together with the convection, through a singleconvection-radiation coefficient (Faria et al., 2006). The con-vective heat transfer at concrete surface can be expressed as
as TThq (7)
where q is the convective heat flux per unit area, h is thecombined convection-radiation heat transfer coefficients(kcal/m2 hr oC), Ts and Ta are the surface and air temperature.
In the real mass concrete footing, heat loss to sur-rounding air is also processed by convection. Normally, theside and bottom surfaces of a footing are covered by subsoiland heat dissipates from concrete to the surrounding soil byconduction process. However, the problem can be simplifiedby the assumption that the amount of heat loss to the sur-rounding subsoil is assumed to be done by the convectionprocess. This kind of assumption and boundary conditionwere used in previous study of other researchers (Faria et al.,2006).
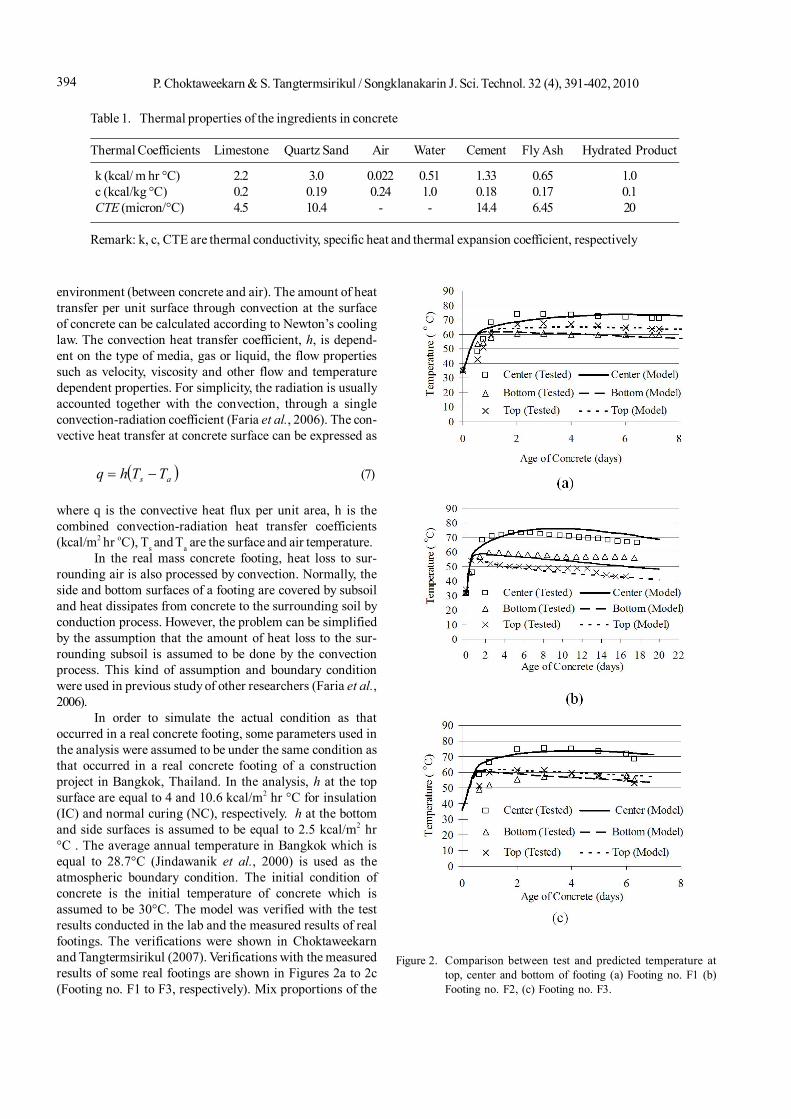
In order to simulate the actual condition as thatoccurred in a real concrete footing, some parameters used inthe analysis were assumed to be under the same condition asthat occurred in a real concrete footing of a constructionproject in Bangkok, Thailand. In the analysis, h at the topsurface are equal to 4 and 10.6 kcal/m2 hr °C for insulation(IC) and normal curing (NC), respectively. h at the bottomand side surfaces is assumed to be equal to 2.5 kcal/m2 hr°C . The average annual temperature in Bangkok which isequal to 28.7°C (Jindawanik et al., 2000) is used as theatmospheric boundary condition. The initial condition ofconcrete is the initial temperature of concrete which isassumed to be 30°C. The model was verified with the testresults conducted in the lab and the measured results of realfootings. The verifications were shown in Choktaweekarnand Tangtermsirikul (2007). Verifications with the measuredresults of some real footings are shown in Figures 2a to 2c(Footing no. F1 to F3, respectively). Mix proportions of the
Table 1. Thermal properties of the ingredients in concrete
Thermal Coefficients Limestone Quartz Sand Air Water Cement Fly Ash Hydrated Product
k (kcal/ m hr °C) 2.2 3.0 0.022 0.51 1.33 0.65 1.0 c (kcal/kg °C) 0.2 0.19 0.24 1.0 0.18 0.17 0.1 CTE (micron/°C) 4.5 10.4 - - 14.4 6.45 20
Remark: k, c, CTE are thermal conductivity, specific heat and thermal expansion coefficient, respectively
Figure 2. Comparison between test and predicted temperature attop, center and bottom of footing (a) Footing no. F1 (b)Footing no. F2, (c) Footing no. F3.
395P. Choktaweekarn & S. Tangtermsirikul / Songklanakarin J. Sci. Technol. 32 (4), 391-402, 2010
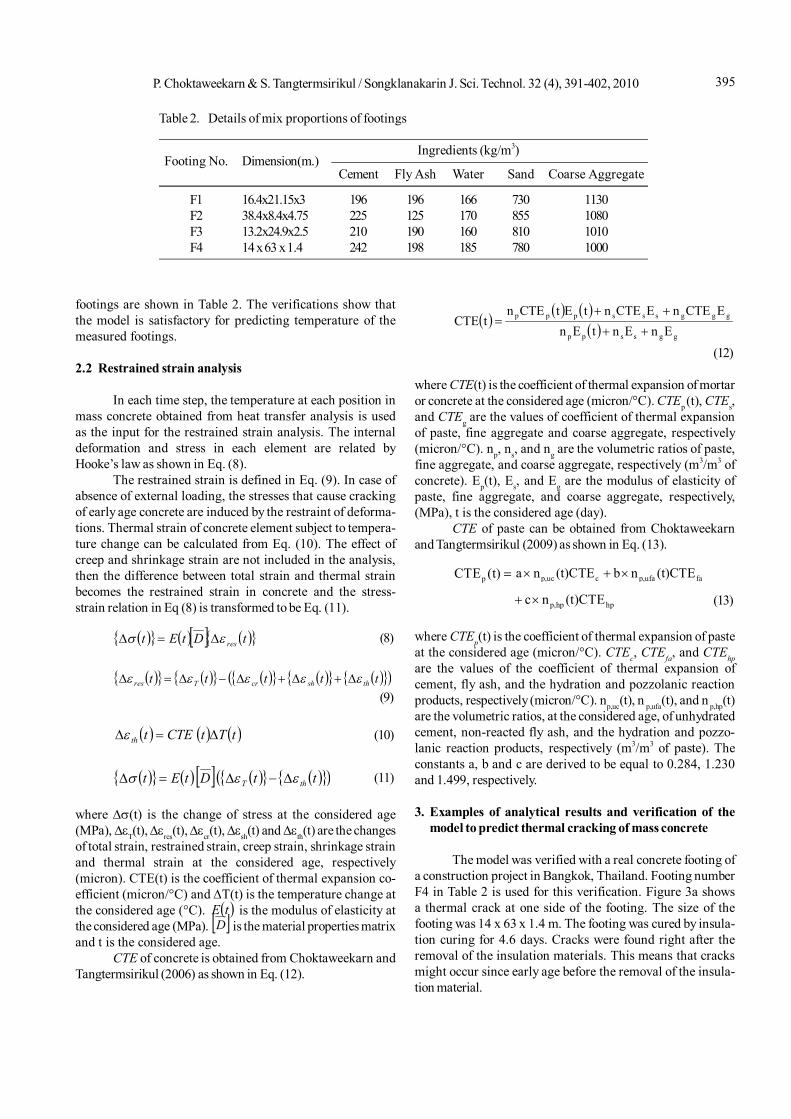
footings are shown in Table 2. The verifications show thatthe model is satisfactory for predicting temperature of themeasured footings.
2.2 Restrained strain analysis
In each time step, the temperature at each position inmass concrete obtained from heat transfer analysis is usedas the input for the restrained strain analysis. The internaldeformation and stress in each element are related byHooke’s law as shown in Eq. (8).
The restrained strain is defined in Eq. (9). In case ofabsence of external loading, the stresses that cause crackingof early age concrete are induced by the restraint of deforma-tions. Thermal strain of concrete element subject to tempera-ture change can be calculated from Eq. (10). The effect ofcreep and shrinkage strain are not included in the analysis,then the difference between total strain and thermal strainbecomes the restrained strain in concrete and the stress-strain relation in Eq (8) is transformed to be Eq. (11).
tDtEt res (8)
ttttt thshcrTres (9)
tTtCTEtth (10)
ttDtEt thT (11)
where (t) is the change of stress at the considered age(MPa), T(t), res(t), cr(t), sh(t) and th(t) are the changesof total strain, restrained strain, creep strain, shrinkage strainand thermal strain at the considered age, respectively(micron). CTE(t) is the coefficient of thermal expansion co-efficient (micron/°C) and T(t) is the temperature change atthe considered age (°C). tE is the modulus of elasticity atthe considered age (MPa). D is the material properties matrixand t is the considered age.
CTE of concrete is obtained from Choktaweekarn andTangtermsirikul (2006) as shown in Eq. (12).
ggsspp
gggsssppp
EnEntEnECTEnECTEntEtCTEn
tCTE
(12)
where CTE(t) is the coefficient of thermal expansion of mortaror concrete at the considered age (micron/°C). CTEp (t), CTEs,and CTEg are the values of coefficient of thermal expansionof paste, fine aggregate and coarse aggregate, respectively(micron/°C). np, ns, and ng are the volumetric ratios of paste,fine aggregate, and coarse aggregate, respectively (m3/m3 ofconcrete). Ep(t), Es, and Eg are the modulus of elasticity ofpaste, fine aggregate, and coarse aggregate, respectively,(MPa), t is the considered age (day).
CTE of paste can be obtained from Choktaweekarnand Tangtermsirikul (2009) as shown in Eq. (13).
pCTE (t) p,uc c p,ufa faa n (t)CTE b n (t)CTE
p,hp hpc n (t)CTE (13)
where CTEp(t) is the coefficient of thermal expansion of pasteat the considered age (micron/°C). CTEc, CTEfa, and CTEhpare the values of the coefficient of thermal expansion ofcement, fly ash, and the hydration and pozzolanic reactionproducts, respectively (micron/°C). np,uc(t), n p,ufa(t), and n p,hp(t)are the volumetric ratios, at the considered age, of unhydratedcement, non-reacted fly ash, and the hydration and pozzo-lanic reaction products, respectively (m3/m3 of paste). Theconstants a, b and c are derived to be equal to 0.284, 1.230and 1.499, respectively.
3. Examples of analytical results and verification of themodel to predict thermal cracking of mass concrete
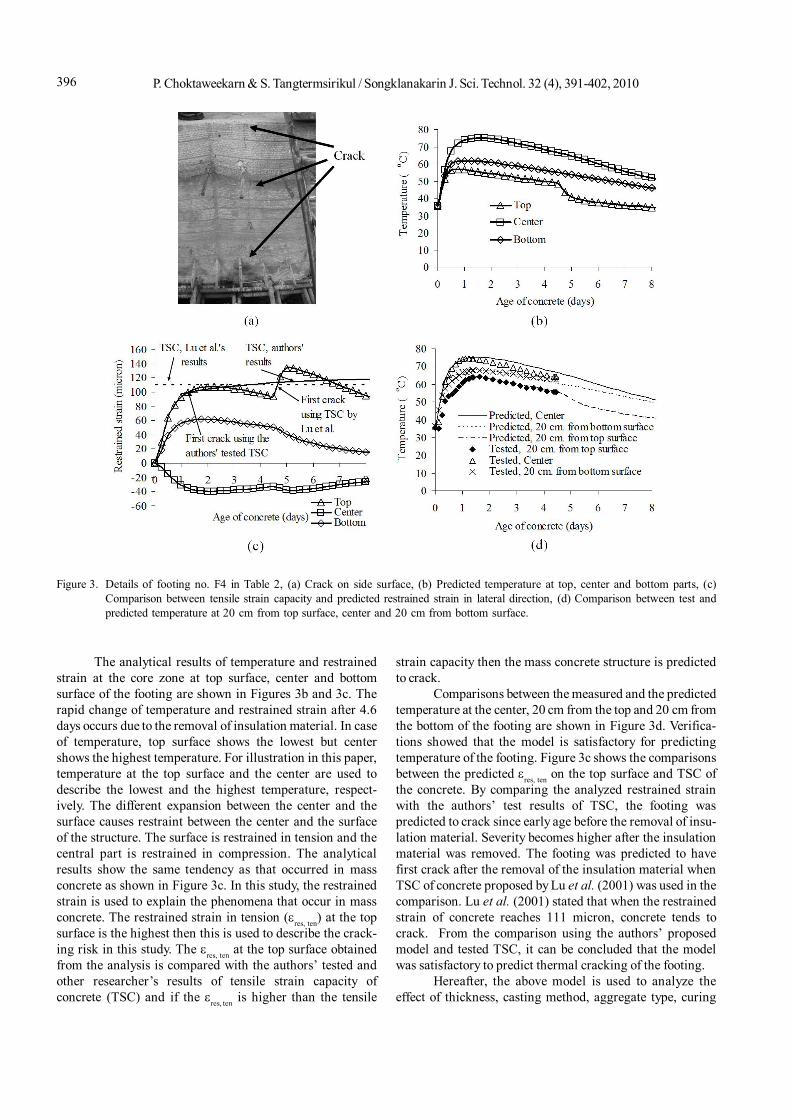
The model was verified with a real concrete footing ofa construction project in Bangkok, Thailand. Footing numberF4 in Table 2 is used for this verification. Figure 3a showsa thermal crack at one side of the footing. The size of thefooting was 14 x 63 x 1.4 m. The footing was cured by insula-tion curing for 4.6 days. Cracks were found right after theremoval of the insulation materials. This means that cracksmight occur since early age before the removal of the insula-tion material.
Table 2. Details of mix proportions of footings
Ingredients (kg/m3)Footing No. Dimension(m.)
Cement Fly Ash Water Sand Coarse Aggregate
F1 16.4x21.15x3 196 196 166 730 1130F2 38.4x8.4x4.75 225 125 170 855 1080F3 13.2x24.9x2.5 210 190 160 810 1010F4 14 x 63 x 1.4 242 198 185 780 1000
P. Choktaweekarn & S. Tangtermsirikul / Songklanakarin J. Sci. Technol. 32 (4), 391-402, 2010396
The analytical results of temperature and restrainedstrain at the core zone at top surface, center and bottomsurface of the footing are shown in Figures 3b and 3c. Therapid change of temperature and restrained strain after 4.6days occurs due to the removal of insulation material. In caseof temperature, top surface shows the lowest but centershows the highest temperature. For illustration in this paper,temperature at the top surface and the center are used todescribe the lowest and the highest temperature, respect-ively. The different expansion between the center and thesurface causes restraint between the center and the surfaceof the structure. The surface is restrained in tension and thecentral part is restrained in compression. The analyticalresults show the same tendency as that occurred in massconcrete as shown in Figure 3c. In this study, the restrainedstrain is used to explain the phenomena that occur in massconcrete. The restrained strain in tension (res, ten) at the topsurface is the highest then this is used to describe the crack-ing risk in this study. The res, ten at the top surface obtainedfrom the analysis is compared with the authors’ tested andother researcher’s results of tensile strain capacity ofconcrete (TSC) and if the res, ten is higher than the tensile
Figure 3. Details of footing no. F4 in Table 2, (a) Crack on side surface, (b) Predicted temperature at top, center and bottom parts, (c)Comparison between tensile strain capacity and predicted restrained strain in lateral direction, (d) Comparison between test andpredicted temperature at 20 cm from top surface, center and 20 cm from bottom surface.
strain capacity then the mass concrete structure is predictedto crack.
Comparisons between the measured and the predictedtemperature at the center, 20 cm from the top and 20 cm fromthe bottom of the footing are shown in Figure 3d. Verifica-tions showed that the model is satisfactory for predictingtemperature of the footing. Figure 3c shows the comparisonsbetween the predicted res, ten on the top surface and TSC ofthe concrete. By comparing the analyzed restrained strainwith the authors’ test results of TSC, the footing waspredicted to crack since early age before the removal of insu-lation material. Severity becomes higher after the insulationmaterial was removed. The footing was predicted to havefirst crack after the removal of the insulation material whenTSC of concrete proposed by Lu et al. (2001) was used in thecomparison. Lu et al. (2001) stated that when the restrainedstrain of concrete reaches 111 micron, concrete tends tocrack. From the comparison using the authors’ proposedmodel and tested TSC, it can be concluded that the modelwas satisfactory to predict thermal cracking of the footing.
Hereafter, the above model is used to analyze theeffect of thickness, casting method, aggregate type, curing
397P. Choktaweekarn & S. Tangtermsirikul / Songklanakarin J. Sci. Technol. 32 (4), 391-402, 2010
condition and curing period on temperature and restrainedstrain of mass concrete.
4. Analytical Parameters
4.1 Mix proportions and properties of concrete
The mix proportions and properties of concrete usedin the analysis are shown in Table 3. Mix 1 was used to studythe effect of thickness of mass concrete structure, castingmethod and curing condition. Mixes 1 and 2 were used toinvestigate the effect of type of aggregate.
4.2 Thicknesses of structure
In order to investigate the effect of thickness of massconcrete, thickness was varied to be 0.5, 1.0, 1.5, 2.0, 2.5, 3.0,4.0, 5.0, 6.0, 8.0 and 10.0 m. whereas the width and lengthwere fixed at 33 and 49.2 m., respectively. An example ofdescription of the dimension designation is as follow; “d0.5”means the structure which has size 33 x 49.2 x 0.5 m. Insula-tion curing was used in the analysis.
4.3 Casting methods
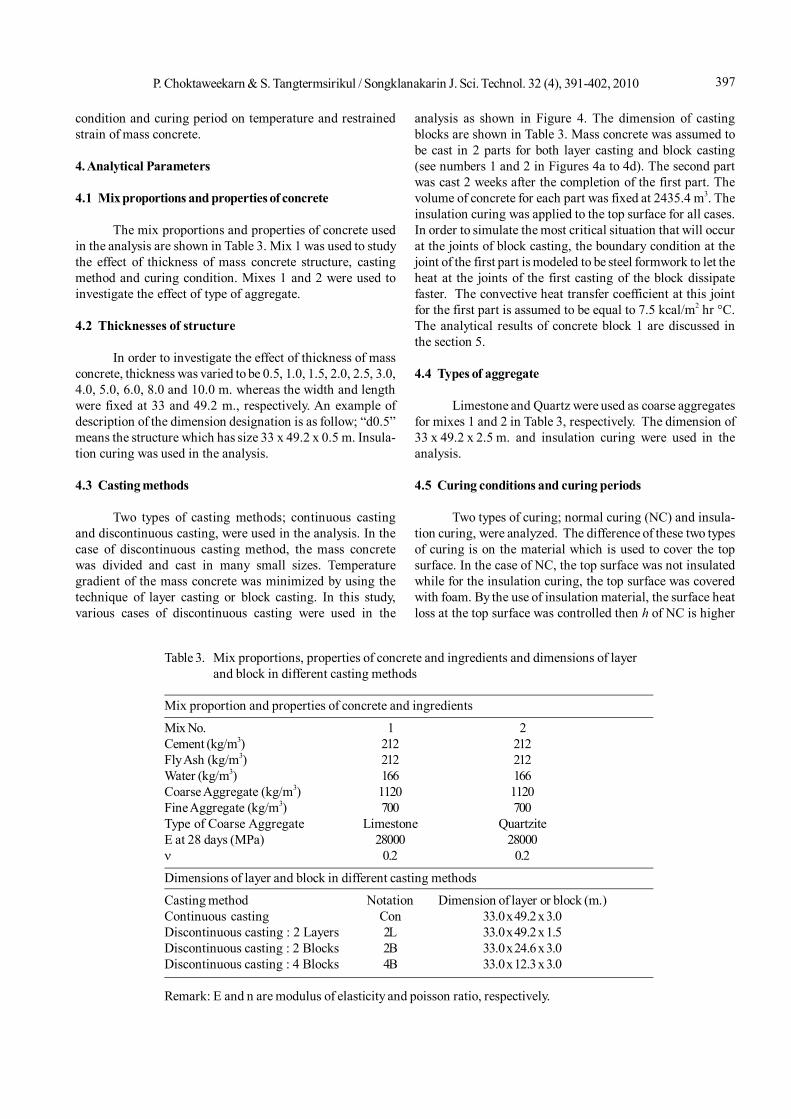
Two types of casting methods; continuous castingand discontinuous casting, were used in the analysis. In thecase of discontinuous casting method, the mass concretewas divided and cast in many small sizes. Temperaturegradient of the mass concrete was minimized by using thetechnique of layer casting or block casting. In this study,various cases of discontinuous casting were used in the
analysis as shown in Figure 4. The dimension of castingblocks are shown in Table 3. Mass concrete was assumed tobe cast in 2 parts for both layer casting and block casting(see numbers 1 and 2 in Figures 4a to 4d). The second partwas cast 2 weeks after the completion of the first part. Thevolume of concrete for each part was fixed at 2435.4 m3. Theinsulation curing was applied to the top surface for all cases.In order to simulate the most critical situation that will occurat the joints of block casting, the boundary condition at thejoint of the first part is modeled to be steel formwork to let theheat at the joints of the first casting of the block dissipatefaster. The convective heat transfer coefficient at this jointfor the first part is assumed to be equal to 7.5 kcal/m2 hr °C.The analytical results of concrete block 1 are discussed inthe section 5.
4.4 Types of aggregate
Limestone and Quartz were used as coarse aggregatesfor mixes 1 and 2 in Table 3, respectively. The dimension of33 x 49.2 x 2.5 m. and insulation curing were used in theanalysis.
4.5 Curing conditions and curing periods
Two types of curing; normal curing (NC) and insula-tion curing, were analyzed. The difference of these two typesof curing is on the material which is used to cover the topsurface. In the case of NC, the top surface was not insulatedwhile for the insulation curing, the top surface was coveredwith foam. By the use of insulation material, the surface heatloss at the top surface was controlled then h of NC is higher
Table 3. Mix proportions, properties of concrete and ingredients and dimensions of layerand block in different casting methods
Mix proportion and properties of concrete and ingredients
Mix No. 1 2Cement (kg/m3) 212 212Fly Ash (kg/m3) 212 212Water (kg/m3) 166 166Coarse Aggregate (kg/m3) 1120 1120Fine Aggregate (kg/m3) 700 700Type of Coarse Aggregate Limestone QuartziteE at 28 days (MPa) 28000 28000 0.2 0.2
Dimensions of layer and block in different casting methods
Casting method Notation Dimension of layer or block (m.)Continuous casting Con 33.0 x 49.2 x 3.0Discontinuous casting : 2 Layers 2L 33.0 x 49.2 x 1.5Discontinuous casting : 2 Blocks 2B 33.0 x 24.6 x 3.0Discontinuous casting : 4 Blocks 4B 33.0 x 12.3 x 3.0
Remark: E and n are modulus of elasticity and poisson ratio, respectively.
P. Choktaweekarn & S. Tangtermsirikul / Songklanakarin J. Sci. Technol. 32 (4), 391-402, 2010398
than that of the insulation curing. For insulation curing, thecuring period were divided into two cases; continuous insula-tion curing (CIC) and discontinuous insulation curing (DIC).For continuous insulation curing (CIC), the insulation mate-rial was kept until the end of the analysis while for the dis-continuous insulation curing (DIC), the insulation materialwas removed a few days after a peak temperature was reached.
5 Analytical Results
5.1 Effect of thickness
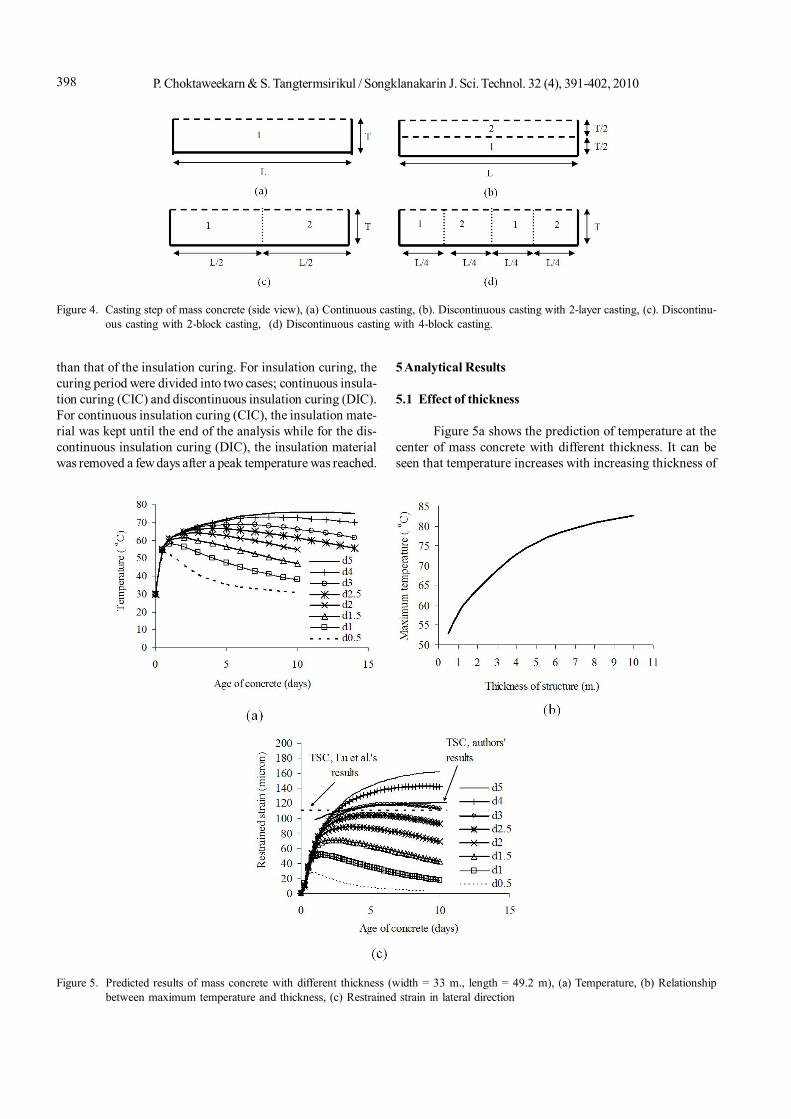
Figure 5a shows the prediction of temperature at thecenter of mass concrete with different thickness. It can beseen that temperature increases with increasing thickness of
Figure 4. Casting step of mass concrete (side view), (a) Continuous casting, (b). Discontinuous casting with 2-layer casting, (c). Discontinu-ous casting with 2-block casting, (d) Discontinuous casting with 4-block casting.
Figure 5. Predicted results of mass concrete with different thickness (width = 33 m., length = 49.2 m), (a) Temperature, (b) Relationshipbetween maximum temperature and thickness, (c) Restrained strain in lateral direction
399P. Choktaweekarn & S. Tangtermsirikul / Songklanakarin J. Sci. Technol. 32 (4), 391-402, 2010
the mass concrete and the peak temperature age is longer.Figure 5b shows the relationship between the maximum tem-perature at the center and the thickness of the mass concrete.The maximum temperature increases with increasing thick-ness. However, when the thickness is thicker, the rate ofincrease diminishes. When the thickness is large, the behav-ior of the mass concrete becomes nearly adiabatic. The res, ten(see Figure 5c) shows the same tendency as that of the tem-perature because temperature difference between the centerand the surface is higher when thickness increases.
5.2 Effect of casting method
The analytical results in Figure 5c show that the massconcrete structure with thickness higher than 3 m. tends tocrack because the res, ten is higher than TSC. In order toprevent thermal cracking, several techniques are possible.One of them is to apply discontinuous casting method. Thefooting with the thickness of 3 m. was used as an example tostudy the effect of casting method.
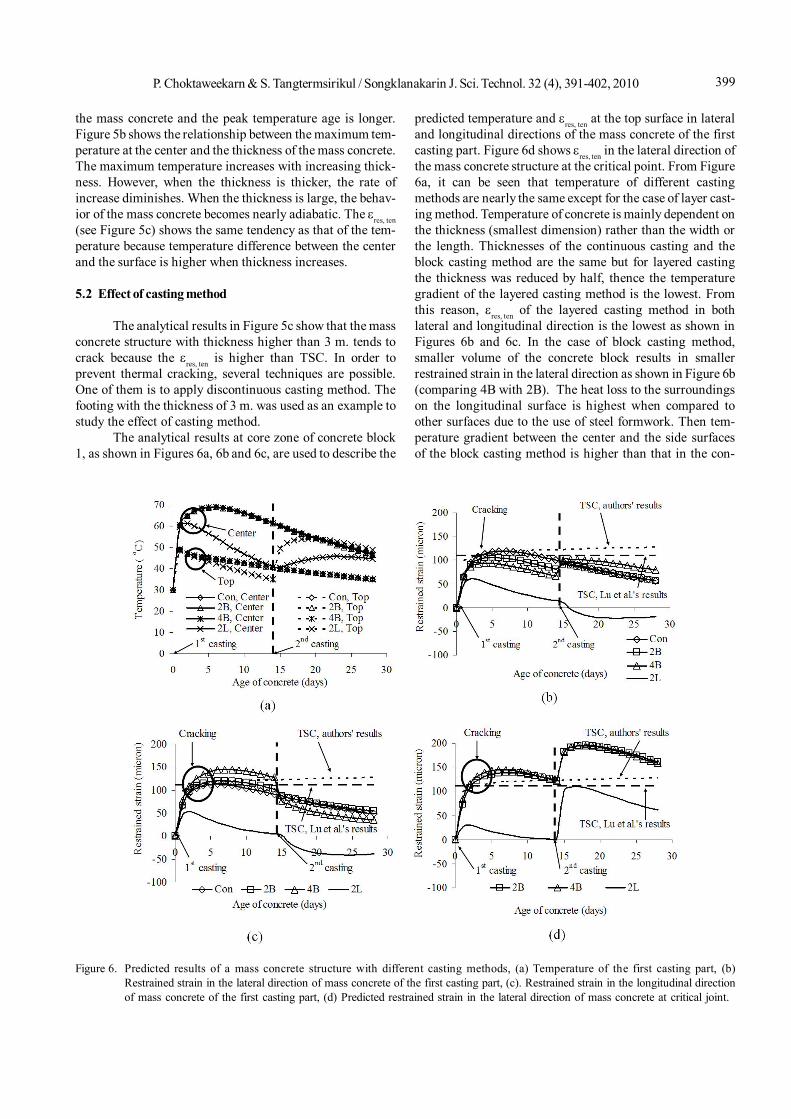
The analytical results at core zone of concrete block1, as shown in Figures 6a, 6b and 6c, are used to describe the
predicted temperature and res, ten at the top surface in lateraland longitudinal directions of the mass concrete of the firstcasting part. Figure 6d shows res, ten in the lateral direction ofthe mass concrete structure at the critical point. From Figure6a, it can be seen that temperature of different castingmethods are nearly the same except for the case of layer cast-ing method. Temperature of concrete is mainly dependent onthe thickness (smallest dimension) rather than the width orthe length. Thicknesses of the continuous casting and theblock casting method are the same but for layered castingthe thickness was reduced by half, thence the temperaturegradient of the layered casting method is the lowest. Fromthis reason, res, ten of the layered casting method in bothlateral and longitudinal direction is the lowest as shown inFigures 6b and 6c. In the case of block casting method,smaller volume of the concrete block results in smallerrestrained strain in the lateral direction as shown in Figure 6b(comparing 4B with 2B). The heat loss to the surroundingson the longitudinal surface is highest when compared toother surfaces due to the use of steel formwork. Then tem-perature gradient between the center and the side surfacesof the block casting method is higher than that in the con-
Figure 6. Predicted results of a mass concrete structure with different casting methods, (a) Temperature of the first casting part, (b)Restrained strain in the lateral direction of mass concrete of the first casting part, (c). Restrained strain in the longitudinal directionof mass concrete of the first casting part, (d) Predicted restrained strain in the lateral direction of mass concrete at critical joint.
P. Choktaweekarn & S. Tangtermsirikul / Songklanakarin J. Sci. Technol. 32 (4), 391-402, 2010400
tinuous casting method. As a result, res, ten is higher whencompared to the case of continuous casting method (asshown in Figure 6c).
However, the most severe part of block castingoccurred at the joint between each block as shown in Figure6d. According to the use of steel formwork, temperaturegradient between the center and this surface is highest whencompared to other surfaces thence the res, ten on this surfaceis the highest. When compare res, ten to TSC, it was foundthat both 2B and 4B casting have high chance to crack dueto thermal cracking. Figure 6d shows that severity increasesafter casting of the second block at the cold joint. Duringheating up stage of the second block, the first block ispulled by the second block, resulting in a rapid increase ofrestrained strain on the side surface of the first block.
For layered casting, the most critical point occurs atthe middle of the bottom surface of the first layer. Duringheating up stage of the second layer, the heat on the toplayer transfer to the bottom layer then the temperature on thetop surface of the first layer increases as shown in Figure 6a.This results in the change of phenomena of the footing to bethe same as continuous casting where the center is subjectedto compressive restraint while the top and the bottomsurfaces are subjected to tensile restraint. The res, ten at thebottom face increases rapidly after the casting of the secondpart (as shown in Figure 6d). From Figures 6b, 6c and 6d,res, ten was compared to TSC and it was found that layeredcasting is the most effective method for the control of thermalcracking. In real practice, it is recommended to provideadequate amount of temperature steel near the former castsurface of each cold joint or near the exposed surfaces of themass concrete in order to reduce the possibility of crackingand to minimize thermal crack widths to be within acceptablevalues if cracking is unavoidable. It must be mentioned herethat in this analysis, the cold joints between each blocks areassumed to have perfect bond. The modulus of elasticity ofconcrete at an early age, especially at a few hours after cast-ing, is much lower than the value used in this analysis thenthe increase of the restrained strain after casting of thesecond block is not as fast as that shown in this paper. How-ever, the analytical results can be used to illustrate thebehavior as that occurred in real practices of discontinuouscasting of mass concrete with reasonable results.
5.3 Effect of type of aggregate
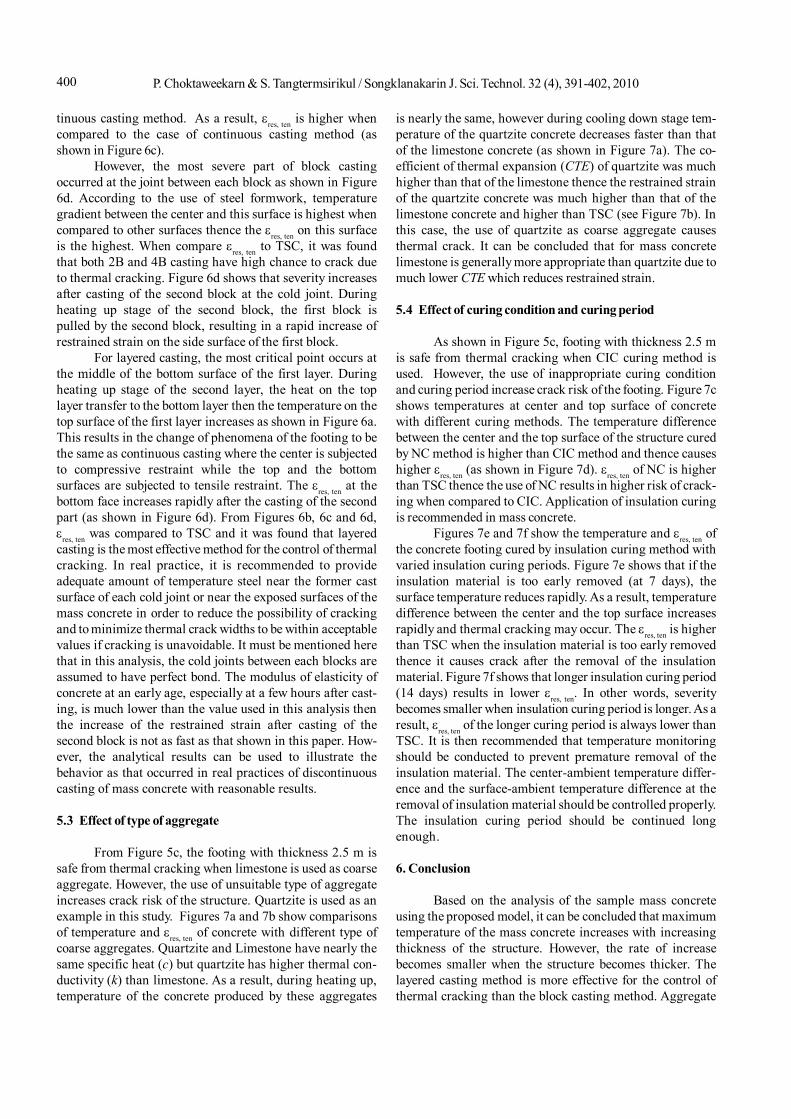
From Figure 5c, the footing with thickness 2.5 m issafe from thermal cracking when limestone is used as coarseaggregate. However, the use of unsuitable type of aggregateincreases crack risk of the structure. Quartzite is used as anexample in this study. Figures 7a and 7b show comparisonsof temperature and res, ten of concrete with different type ofcoarse aggregates. Quartzite and Limestone have nearly thesame specific heat (c) but quartzite has higher thermal con-ductivity (k) than limestone. As a result, during heating up,temperature of the concrete produced by these aggregates
is nearly the same, however during cooling down stage tem-perature of the quartzite concrete decreases faster than thatof the limestone concrete (as shown in Figure 7a). The co-efficient of thermal expansion (CTE) of quartzite was muchhigher than that of the limestone thence the restrained strainof the quartzite concrete was much higher than that of thelimestone concrete and higher than TSC (see Figure 7b). Inthis case, the use of quartzite as coarse aggregate causesthermal crack. It can be concluded that for mass concretelimestone is generally more appropriate than quartzite due tomuch lower CTE which reduces restrained strain.
5.4 Effect of curing condition and curing period
As shown in Figure 5c, footing with thickness 2.5 mis safe from thermal cracking when CIC curing method isused. However, the use of inappropriate curing conditionand curing period increase crack risk of the footing. Figure 7cshows temperatures at center and top surface of concretewith different curing methods. The temperature differencebetween the center and the top surface of the structure curedby NC method is higher than CIC method and thence causeshigher res, ten (as shown in Figure 7d). res, ten of NC is higherthan TSC thence the use of NC results in higher risk of crack-ing when compared to CIC. Application of insulation curingis recommended in mass concrete.
Figures 7e and 7f show the temperature and res, ten ofthe concrete footing cured by insulation curing method withvaried insulation curing periods. Figure 7e shows that if theinsulation material is too early removed (at 7 days), thesurface temperature reduces rapidly. As a result, temperaturedifference between the center and the top surface increasesrapidly and thermal cracking may occur. The res, ten is higherthan TSC when the insulation material is too early removedthence it causes crack after the removal of the insulationmaterial. Figure 7f shows that longer insulation curing period(14 days) results in lower res, ten. In other words, severitybecomes smaller when insulation curing period is longer. As aresult, res, ten of the longer curing period is always lower thanTSC. It is then recommended that temperature monitoringshould be conducted to prevent premature removal of theinsulation material. The center-ambient temperature differ-ence and the surface-ambient temperature difference at theremoval of insulation material should be controlled properly.The insulation curing period should be continued longenough.
6. Conclusion
Based on the analysis of the sample mass concreteusing the proposed model, it can be concluded that maximumtemperature of the mass concrete increases with increasingthickness of the structure. However, the rate of increasebecomes smaller when the structure becomes thicker. Thelayered casting method is more effective for the control ofthermal cracking than the block casting method. Aggregate
401P. Choktaweekarn & S. Tangtermsirikul / Songklanakarin J. Sci. Technol. 32 (4), 391-402, 2010
used in mass concrete should have low CTE to lower therestrained strain. The insulation curing method is preferablefor mass concrete and in order to prevent cracking, thecenter-ambient temperature difference and the surface-ambient temperature difference at the removal of insulationmaterial should be controlled properly by providing suffic-ient insulation curing period.
References
ACI committee 207, 2005, Mass Concrete. ACI manual ofconcrete practice Part 1. Reported by ACI Committee207, pp. 207.1R-1 -207.1 R42.
Choktaweekarn, P., Saengsoy, W. and Tangtermsirikul, S.2009a, A Model for Predicting Specific Heat capacity
Figure 7. Predicted results of a mass concrete (a) and (b) with limestone and quartzite as coarse aggregates, (c) and (d) cured by normaland insulation curing methods, (e) and (f) cured by continuous and discontinuous insulation curing methods
P. Choktaweekarn & S. Tangtermsirikul / Songklanakarin J. Sci. Technol. 32 (4), 391-402, 2010402
of fly-ash concrete, ScienceAsia, 35(2), 178-182.Choktaweekarn, P., Saengsoy, W. and Tangtermsirikul, S.
2009b. A Model for Predicting Thermal Conductivityof Concrete, Magazine of Concrete Research, 61(4),271-280
Choketaweekarn, P. and Tangtermsirikul, S. 2006, “ThermalExpansion Coefficient of Concrete”, Proceedings ofthe 10th East Asia Pacific Conference on StructuralEngineering and Construction (EASEC-10), Bangkok,Thailand, 3-5 August, 2006, pp. 561-566
Choktaweekarn, P. and Tangtermsirikul, S. 2007. A Study ofDispersion Effect of Fly Ash on Heat of Hydration andModel for Predicting Temperature of Mass Concrete,Proceeding of The Twelve National Convention onCivil Engineering, 2-4 May 2007, Phitsanuloke, pp.304-309.
Choktaweekarn, P. and Tangtermsirikul, S. 2009. A Modelfor Predicting Coefficient of Thermal Expansion ofCementitious Paste, ScienceAsia, 35(1), 57-63.
Department of the Army U.S. Army corps of Engineers, 1997,Engineering and Design Thermal Studies of MassConcrete Structures, Engineer Technical LetterETL1110-2-542.
Faria, R., Azenha, M. and Figueiras, J.A. 2006. Modeling ofconcrete at early ages: Application to an externallyrestrained slab, Cement and Concrete Composites,28(6), 572-585
Isgor, O.B. and Razaqpur, A.G. 2004. Finite element modelingof coupled heat transfer, moisture transport and car-bonation processes in concrete structures, Cementand Concrete Composites, 26(1), 57-73.
Jindawanik, T., Chukiert, K. and Wasuwat, P. 2000. Weatherdata of Thailand for energy conservation 1981-1998[CD-ROM]. Thailand: Chulalongkorn University.
Kwak, H.-G., Ha, S.-J. and Kim, J.-K. 2006. Non-structuralcracking in RC walls: Part I. Finite element formulation,Cement and Concrete Research, 36(4), 749-760.
Lu, H.R., Swaddiwudhipong, S. and Wee, T.H., 2001. Evalua-tion of Thermal Crack by a Probabilistic Model usingthe Tensile Strain Capacity, Magazine of ConcreteResearch, 53(1), 28 -30.
Maekawa, K., Chaube, R. and Kishi, T. 1999. Modelling ofConcrete Performance, E & FN Spon, London
Neville, A. M. 1995. Properties of Concrete. (4th ed.), Longman.London.
Park, K.-B., Jee, N.-Y., Yoon, I.-S. and Lee, H.-S. 2008. Pre-diction of Temperature Distribution in High-StrengthConcrete Using Hydration Model, ACI MaterialsJournal, 105(2), March-April 2008.
Portland Cement Association, 2003. Design and Control ofConcrete Admixtures, 14th ed-CD Version, CD100.1.
Saengsoy, W. and Tangtermsirikul, S. 2003. Model for Pre-dicting Temperature of Mass Concrete. Proceedingsof the 1st National Concrete Conference, EngineeringInstitute of Thailand, Kanchanaburi, pp. 211-218.
Sarker, P.K., Jitvutikrai, P., Tangtermsirikul ,S. and Kishi, T.,1999. Modeling of Temperature Rise in Concrete UsingFly Ash, Concrete Model Code for Asia IABSE Collo-quium, Vol. 80, Phuket, Thailand, 1999, pp. 126-132.
Tongaroonsri, S. and Tangtermsirikul, S. 2008. Influence ofMixture Condition and Moisture on Tensile Strain Ca-pacity of Concrete, ScienceAsia, 34(1), 59-68.
Wang, C. and Dilger, W.H. 1994. Prediction of TemperatureDistribution in Hardening Concrete, in : Springensch-mid R. (Ed.), Thermal Cracking in Concrete at EarlyAges, E & FN Spon, London, UK, pp. 21-28.
Whittier, S., Olyniec, J. and Mcglohn, R., 2004. MinimizingTemperature Differentials in Mass Concrete. ConcreteInternational, December 2004, pp. 42-45