Effect of a Coconut Oil Supplement (2g/d) on Total ...weeks on cholesterol concentrations,...
104
Effect of a Coconut Oil Supplement (2g/d) on Total Cholesterol to HDL Cholesterol Ratio in Healthy Adults by Rachel Shedden A Thesis Presented in Partial Fulfillment of the Requirements for the Degree Master of Science Approved September 2016 by the Graduate Supervisory Committee Carol Johnston, Chair Christy Lespron Christina Shepard ARIZONA STATE UNIVERISTY May 2017
Transcript of Effect of a Coconut Oil Supplement (2g/d) on Total ...weeks on cholesterol concentrations,...
Effect of a Coconut Oil Supplement (2g/d) on Total Cholesterol to HDL Cholesterol
Ratio in Healthy Adults
by
Rachel Shedden
A Thesis Presented in Partial Fulfillment of the Requirements for the Degree
Master of Science
Approved September 2016 by the Graduate Supervisory Committee
Carol Johnston, Chair
Christy Lespron Christina Shepard
ARIZONA STATE UNIVERISTY
May 2017
ii
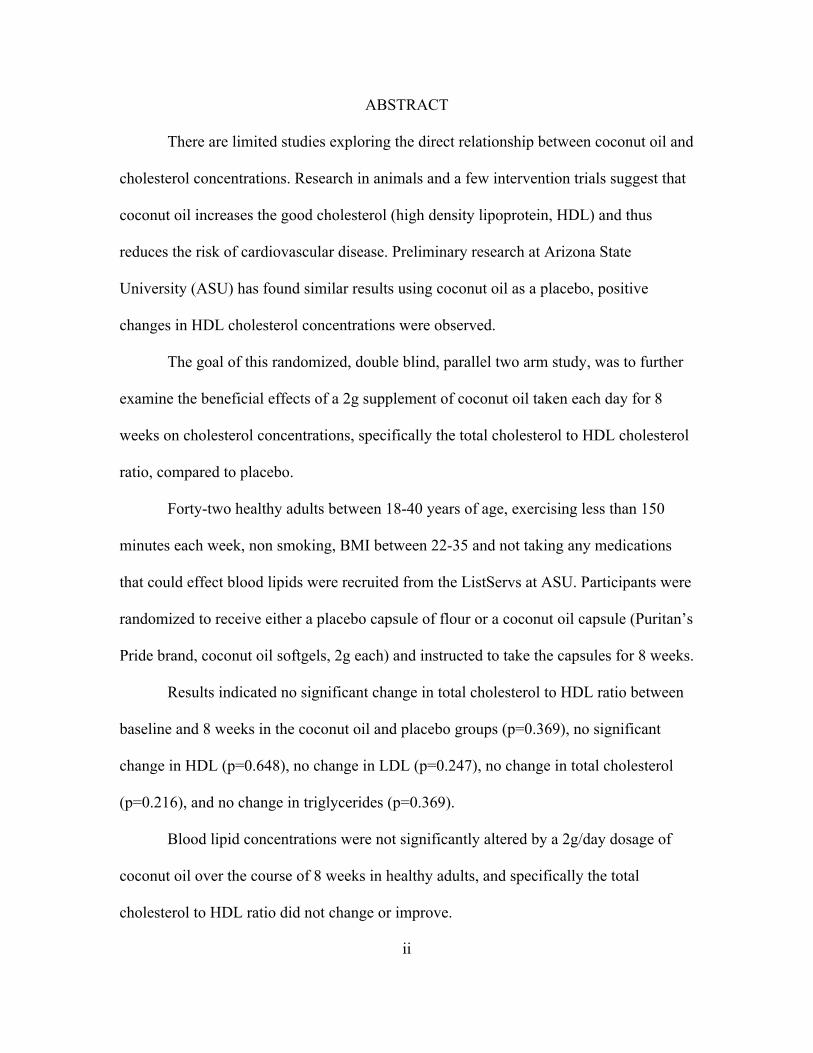
ABSTRACT
There are limited studies exploring the direct relationship between coconut oil and
cholesterol concentrations. Research in animals and a few intervention trials suggest that
coconut oil increases the good cholesterol (high density lipoprotein, HDL) and thus
reduces the risk of cardiovascular disease. Preliminary research at Arizona State
University (ASU) has found similar results using coconut oil as a placebo, positive
changes in HDL cholesterol concentrations were observed.
The goal of this randomized, double blind, parallel two arm study, was to further
examine the beneficial effects of a 2g supplement of coconut oil taken each day for 8
weeks on cholesterol concentrations, specifically the total cholesterol to HDL cholesterol
ratio, compared to placebo.
Forty-two healthy adults between 18-40 years of age, exercising less than 150
minutes each week, non smoking, BMI between 22-35 and not taking any medications
that could effect blood lipids were recruited from the ListServs at ASU. Participants were
randomized to receive either a placebo capsule of flour or a coconut oil capsule (Puritan’s
Pride brand, coconut oil softgels, 2g each) and instructed to take the capsules for 8 weeks.
Results indicated no significant change in total cholesterol to HDL ratio between
baseline and 8 weeks in the coconut oil and placebo groups (p=0.369), no significant
change in HDL (p=0.648), no change in LDL (p=0.247), no change in total cholesterol
(p=0.216), and no change in triglycerides (p=0.369).
Blood lipid concentrations were not significantly altered by a 2g/day dosage of
coconut oil over the course of 8 weeks in healthy adults, and specifically the total
cholesterol to HDL ratio did not change or improve.

iii
ACKNOWLEDGMENTS
Through the sweat and tears of writing this thesis I realized that I gained not only
academic skills, but also personal skills that have helped me become a more confident
person. I would like to express my sincere gratitude to my chair of committee, professor,
and mentor, Dr. Carol Johnston. She took me under her wing, and I feel incredibly lucky
to have had this opportunity to learn from someone so passionate about nutrition and
research. I appreciate the welcoming smile she gave me when I popped into her office
more than once a day, I could not have successfully completed my thesis without her. I
would also like to extend my thanks to my committee member Dr. Christy Lespron for all
the pep talks, words of wisdom, constant encouragement, and always pushing me to
dream big and get my PhD so I can come back and work with her. I am grateful to my
professor and committee member Dr. Punam Ohri-Vachaspati, for being a constant
source of guidance, motivation and urging me to see research from different perspectives.
I am very thankful for Tina Shepard for stepping in when Dr. Punam Ohri-Vachaspati
was no longer able to be on my committee, and for making it possible to get my master’s
degree and dietetic internship accomplished. This project would not have been completed
without the tireless work of Ginger Hook. I immensely enjoyed the time I spent working
with Ginger up in the lab and am still in awe of how great she does her job. I would also
like to thank Claudia Thompson-Felty for being my supervisor, mentor, and friend. She
was always willing to teach me the steps, and help me survive the process. Finally, I
would like to express my gratitude to my parents for their support, kindness, and
sympathy. I especially appreciate those times they cooked and sent me healthy meals

iv
when I was at my busiest. They are always looking out for me. Thank you all for the love
and support.
v
TABLE OF CONTENTS
Page
LIST OF TABLES .................................................................................................................. x
LIST OF FIGURES ................................................................................................................ xi
CHAPTER
1 INTRODUCTION ............................................................................................... 1
Overview ............................................................................................... 1
Purpose of the Study ............................................................................. 2
Research Aim and Hypotheses .............................................................. 3
Definition of Terms ............................................................................... 3
Delimitations and Limitations ............................................................... 3
2 REVIEW OF LITERATURE .............................................................................. 5
Overview ............................................................................................... 5
Risk Factors for Cardiovascular Disease .............................................. 5
Blood Pressure ............................................................................... 5
Smoking ........................................................................................ 6
Physical Activity ........................................................................... 7
Diabetes ......................................................................................... 8
Family History .............................................................................. 8
Alcohol .......................................................................................... 9
vi
CHAPTER Page
High Blood Cholesterol ............................................................... 10
Biomarkers of Cardiovascular Disease ............................................... 11
Lipids ............................................................................... 11
CRP .................................................................................. 12
Blood Pressure ................................................................. 12
Cardiovascular Disease Lifestyle Interventions .................................. 13
Smoking Cessation ....................................................................... 13
Exercise ....................................................................................... 13
Decreasing Alcohol Intake .......................................................... 13
Losing Weight ............................................................................. 14
Dietary Modifications ................................................................. 14
The DASH Diet ........................................................................... 14
The Ornish Diet ........................................................................... 15
The Vegetarian Diet .................................................................... 16
Diet Comparisons ........................................................................ 17
Functional Foods and Supplements ............................................ 19
Pharmaceutical Interventions ...................................................... 21
Statin Drugs ..................................................................... 21
vii
CHAPTER Page
Fibrates ............................................................................. 22
Niacin ............................................................................... 23
Bile Acid Binding Resin .................................................. 25
Cholesterol Metabolism, Measurements, and Biomarkers ................. 25
Lipoproteins ................................................................................. 26
Apoproteins .................................................................................. 27
Triglycerides ................................................................................ 27
Fatty Acids ................................................................................... 27
Trans Fatty Acids ......................................................................... 29
Cholesterol Metabolism ............................................................... 30
Measuring Cholesterol ................................................................. 31
Coconut Oil ......................................................................................... 31
Extraction Methods ...................................................................... 32
Composition ................................................................................. 32
Metabolism .................................................................................. 34
Health Effects ............................................................................... 35
History of Coconut Oil and Medicinal Effects ............................ 36
Animal Studies ............................................................................. 37
Epidemiological Studies .............................................................. 38
viii
CHAPTER Page
Intervention Trials ........................................................................ 40
Summary ...................................................................................... 41
3 METHODS ........................................................................................................ 42
Study Design ....................................................................................... 42
Measures ............................................................................................. 44
Statistical Analysis .............................................................................. 44
4 DATA AND RESULTS .................................................................................... 45
Descriptive Characteristics .................................................................. 45
Adjusted Relationships Between Blood Cholesterol Levels ............... 47
5 DISCUSSION .................................................................................................... 54
Overview ............................................................................................. 54
Limitations ........................................................................................... 54
Strengths of the Study ......................................................................... 56
6 CONCLUSION AND RECOMMENDATIONS .............................................. 58
REFERENCES ...................................................................................................................... 59
APPENDIX
A INSTITUTIONAL REVIEW BOARD APPROVAL ....................................... 73
B STUDY DESIGN .............................................................................................. 76
C POWER ANALYSIS ......................................................................................... 78
ix
APPENDIX Page
D SUPPLEMENT LABEL ................................................................................... 80
E CONSORT DIAGRAM ..................................................................................... 82
F MEDICAL HISTORY QUESTIONNAIRE ....................................................... 84
G PROFILE OF MOOD STATES QUESTIONNAIRE ....................................... 88
H RECRUITMENT ONLINE SURVEY .............................................................. 90
x
LIST OF TABLES
Table Page
1. Non Pharmaceutricals for Cardiovascular Disease .............................................. 19
2. Cholesterol Measurements .................................................................................... 31
3. Coconut Oil Composition .................................................................................... 33
4. Baseline Characteristics by Group ........................................................................ 46
5. Blood Cholesterol Levels by Group ..................................................................... 47
xi
LIST OF FIGURES
Figure Page
1. Comparison of Blood Lipid Concentrations between Groups at Week 1 and Week
8 ........................................................................................................................... 48
2. Comparison of Total Cholesterol to HDL Ratio between Groups at Week 1 and
Week 8 ................................................................................................................ 49
3. Comparison of HDL Cholesterol between Groups at Week 1 and Week 8 ........ 50
4. Comparison of LDL Cholesterol between Groups at Week 1 and Week 8 ........ 51
5. Comparison of Triglycerides between Groups at Week 1 and Week 8 .............. 52
6. Comparison of Total Cholesterol between Groups at Week 1 and Week 8 ....... 53
1
Chapter 1
INTRODUCTION
The American Heart Association predicts that by 2030 40.5% of the US
population will have some form of CVD ranging from of heart failure, strokes,
hypertension or coronary heart disease (1). The cost of direct and indirect medical care
related to cardiovascular disease was $403.1 billion in 2006 (2). If other factors such as
obesity and diabetes continue to rise the estimated cost and prevalence of CVD could be
higher than expected (3). Even with programs such as the National High Blood Pressure
Education Program and the National Cholesterol Education program designed to help
lower blood lipid concentrations, reduce smoking, and dietary fat intake, CVD continues
to be a problem (4,5). Risks involved with developing CVD include smoking, high
sodium intake, decreased physical activity, high blood pressure, low HDL cholesterol,
age and gender along with a family history of heart disease (6,7).
Desirable concentrations for cholesterol in adults are less than 200mg/dL for total
cholesterol, less than 100mg/dL for LDL, and 60mg/dL or greater for HDL (8). The total
cholesterol to high-density lipoprotein ratio, or Castelli index, is a better predictor of
cardiovascular risk than single measurements of HDL, LDL and total cholesterol. The
total cholesterol to HDL ratio is considered at risk for men if above 5.0 and above 4.5 for
women. Higher HDL cholesterol is desirable because it will be divided into the total
cholesterol and decrease the overall ratio. There is lower cardiovascular risk with a low
Castelli index ratio (9). An epidemiological study found for every 1mg/dl reduction in
HDL the risk for coronary disease increases by 2 to 3% (10). A randomized controlled
double blind study called The Helsinki Heart Study reported that high LDL and
2
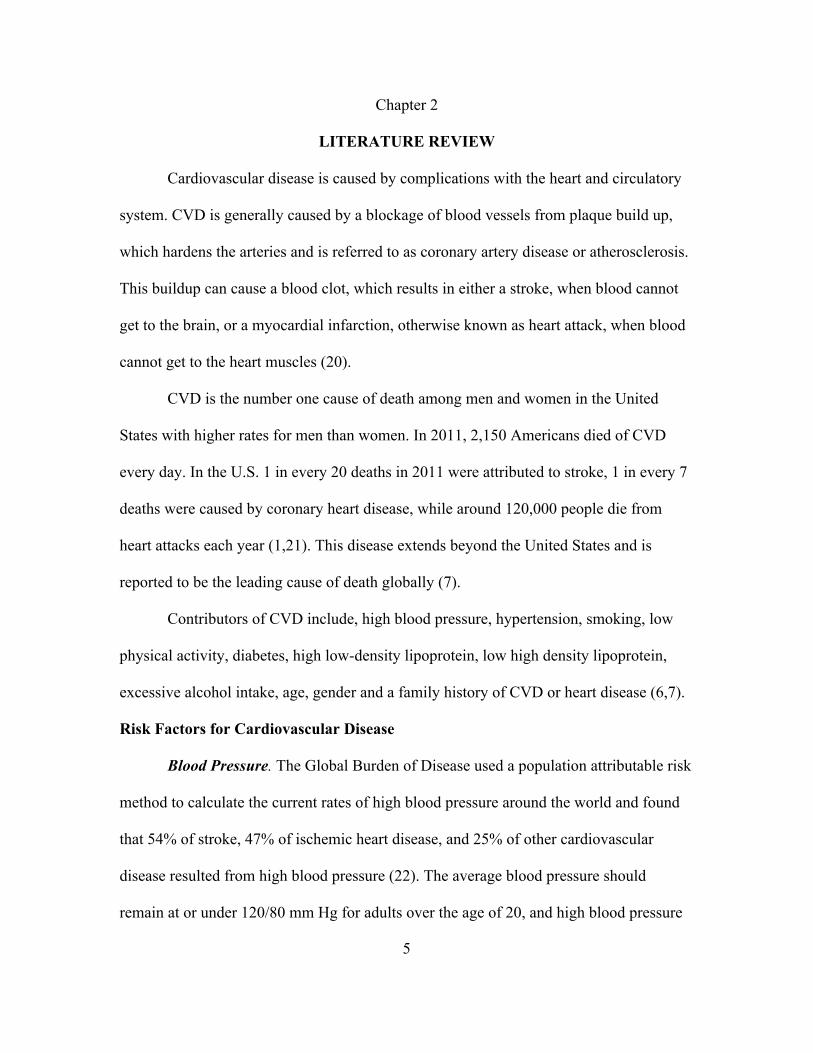
triglycerides along with low HDL increased the risk of heart disease (11). There has been
success in lowering LDL in plasma with drugs like statins, but not much research has
been done in the way of raising HDL (12). Exercise and a modest intake of alcohol have
been shown to raise HDL (13,14). HDL is claimed “good cholesterol” because of its
protective effect and role in reverse cholesterol transport (RCT). During this process
HDL removes free cholesterol from peripheral tissues, esterifies it via plasma lecithin
cholesterol acyltransferase (LCAT), which traps cholesterol inside the HDL particle, and
sends it back to the liver to be excreted into bile (15). HDL also lowered the amount of
free radicals in blood as well as inflammation from plaque development (16). A cross
sectional study done by the Heart Research Institute in Australia observed increased
biomarkers of inflammation like hsCRP and IL-6 along with endothelial activation and
oxidative stress in subjects with low HDL concentrations compared to the group with
optimal HDL concentrations (17). CVD can be caused by inflammation and oxidative
stress (18). Higher HDL concentrations have the potential to remove more LDL
cholesterol from the arterial wall and decreases atherosclerosis related complications of
CVD (19). Hence, there is much interest in determining strategies to compliment the
benefits gained from lowering LDL cholesterol.
Purpose of Study
At Arizona State University, preliminary research observed an improvement in
HDL cholesterol in adults at a much lower dose of coconut oil (2 grams). Coconut oil
may be a simple and inexpensive way to raise HDL concentration. This study was
designed to further examine the beneficial effects of a 2g supplement of coconut oil a day
on HDL cholesterol compared to placebo.

3
Hypothesis
In free-living healthy adults, 2g/day of coconut oil will decrease the total
cholesterol to HDL ratio significantly compared to a placebo capsule after an 8-week trial
with no diet or physical activity modification.
Limitations
Participant adherence to protocol and supplement intake. Self reported data is
prone to error due to recall bias and time constraints. The coconut oil supplement dosage
of 2g/day could be a limitation. The sample size (n=32) could limit the generalizability of
the results. The short trial duration (8 weeks) may not show any long term effects of the
coconut oil supplementation.
Delimitations
This test was done on healthy participants and results cannot be generalized to
those taking lipid-lowering medications. The results derived from this study using
Puritan’s Pride Brand Coconut oil soft gels may not be generalizable to other coconut oil
supplements.
Definition of Terms
• Cardiovascular disease: Disorders involving the heart and blood vessels.
• Obese: BMI of 30.0 or higher is considered obese. Having excess body fat that
could increase health risks.
• Coconut Oil: Puritan’s Pride 1000mg Rapid Release Softgels.
• Coronary heart disease: Plaque build up in the coronary arties, hardens and
restricts blood flow to the heart.

4
• Low density lipoprotein: A molecule made up of lipids and proteins that carries
cholesterol from the liver to the tissues. Higher concentrations are associated with
a greater risk of cardiac problems.
• High density lipoproteins: A molecule made up of lipids and protein that carries
cholesterol from the tissues to the liver to be excreted in the bile. Higher
concentrations are associated with a protective effect against cardiac problems.
• BMI: (Weight (lb) / height (in) x height (in)) x 703). <18.5 is underweight, 18.5-
24.9 is normal, 25.0-9.9 is overweight, and >30 is obese
• Castelli risk index (CRI-1): Ratio of total cholesterol to HDL cholesterol used to
predict risk of cardiac health.
• Triglyceride: Major form of fat stored in the body, made of three fatty acids with
a glycerol backbone.
• Statin drugs: Drugs that lower lipid concentrations in the blood and used to
prevent heart disease. They promote receptor binding of LDL cholesterol.
• hsCRP: High-sensitivity C-reactive protein is a biomarker of inflammation. Low
risk for CVD is less than 1.0 mg/L, average risk is between 1.0 to 3.0 mg/L and
high risk is above 3.0 mg/L.
• IL-6: A protein and a pro-inflammatory cytokine that increases synthesis and
secretion of immunoglobulin by B lymphocytes.
• Hypocaloric diet: Reduced calorie diet, usually between 1,00-1,200 kcal/day.
• Healthy: No chronic health conditions.
• Regular smoker: Greater than or equal to 10 cigarettes per day.
5
Chapter 2
LITERATURE REVIEW
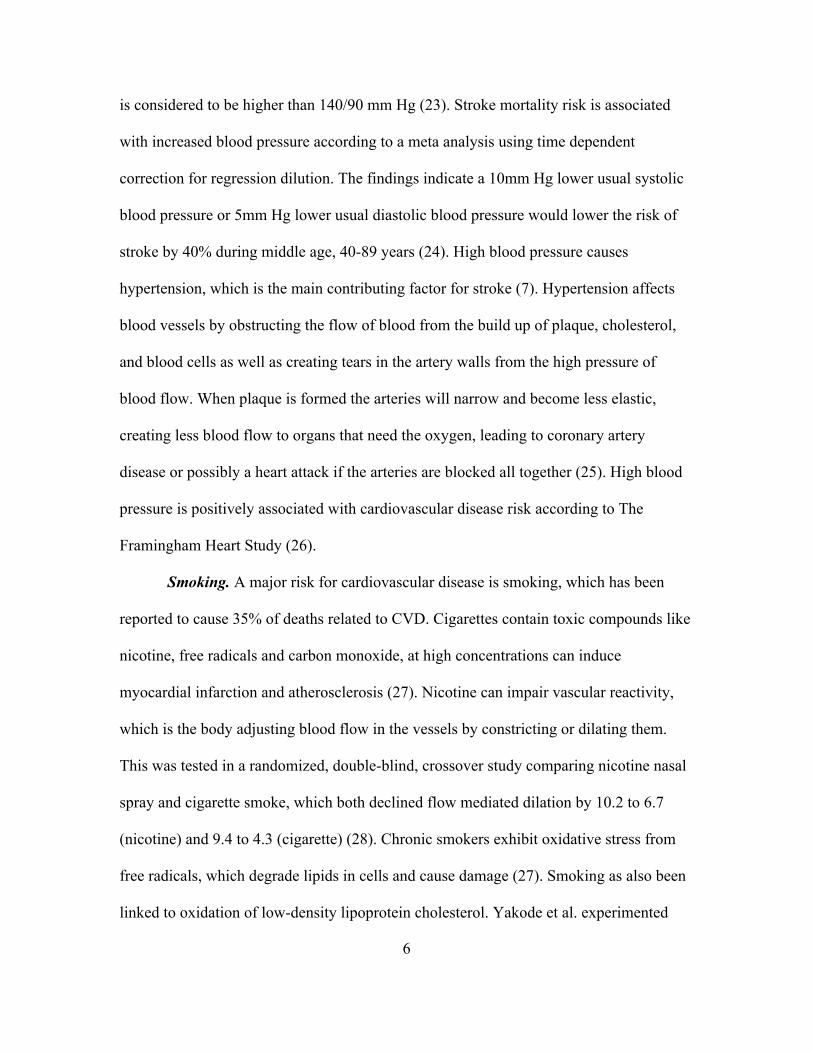
Cardiovascular disease is caused by complications with the heart and circulatory
system. CVD is generally caused by a blockage of blood vessels from plaque build up,
which hardens the arteries and is referred to as coronary artery disease or atherosclerosis.
This buildup can cause a blood clot, which results in either a stroke, when blood cannot
get to the brain, or a myocardial infarction, otherwise known as heart attack, when blood
cannot get to the heart muscles (20).
CVD is the number one cause of death among men and women in the United
States with higher rates for men than women. In 2011, 2,150 Americans died of CVD
every day. In the U.S. 1 in every 20 deaths in 2011 were attributed to stroke, 1 in every 7
deaths were caused by coronary heart disease, while around 120,000 people die from
heart attacks each year (1,21). This disease extends beyond the United States and is
reported to be the leading cause of death globally (7).
Contributors of CVD include, high blood pressure, hypertension, smoking, low
physical activity, diabetes, high low-density lipoprotein, low high density lipoprotein,
excessive alcohol intake, age, gender and a family history of CVD or heart disease (6,7).
Risk Factors for Cardiovascular Disease
Blood Pressure. The Global Burden of Disease used a population attributable risk
method to calculate the current rates of high blood pressure around the world and found
that 54% of stroke, 47% of ischemic heart disease, and 25% of other cardiovascular
disease resulted from high blood pressure (22). The average blood pressure should
remain at or under 120/80 mm Hg for adults over the age of 20, and high blood pressure
6
is considered to be higher than 140/90 mm Hg (23). Stroke mortality risk is associated
with increased blood pressure according to a meta analysis using time dependent
correction for regression dilution. The findings indicate a 10mm Hg lower usual systolic
blood pressure or 5mm Hg lower usual diastolic blood pressure would lower the risk of
stroke by 40% during middle age, 40-89 years (24). High blood pressure causes
hypertension, which is the main contributing factor for stroke (7). Hypertension affects
blood vessels by obstructing the flow of blood from the build up of plaque, cholesterol,
and blood cells as well as creating tears in the artery walls from the high pressure of
blood flow. When plaque is formed the arteries will narrow and become less elastic,
creating less blood flow to organs that need the oxygen, leading to coronary artery
disease or possibly a heart attack if the arteries are blocked all together (25). High blood
pressure is positively associated with cardiovascular disease risk according to The
Framingham Heart Study (26).
Smoking. A major risk for cardiovascular disease is smoking, which has been
reported to cause 35% of deaths related to CVD. Cigarettes contain toxic compounds like
nicotine, free radicals and carbon monoxide, at high concentrations can induce
myocardial infarction and atherosclerosis (27). Nicotine can impair vascular reactivity,
which is the body adjusting blood flow in the vessels by constricting or dilating them.
This was tested in a randomized, double-blind, crossover study comparing nicotine nasal
spray and cigarette smoke, which both declined flow mediated dilation by 10.2 to 6.7
(nicotine) and 9.4 to 4.3 (cigarette) (28). Chronic smokers exhibit oxidative stress from
free radicals, which degrade lipids in cells and cause damage (27). Smoking as also been
linked to oxidation of low-density lipoprotein cholesterol. Yakode et al. experimented
7
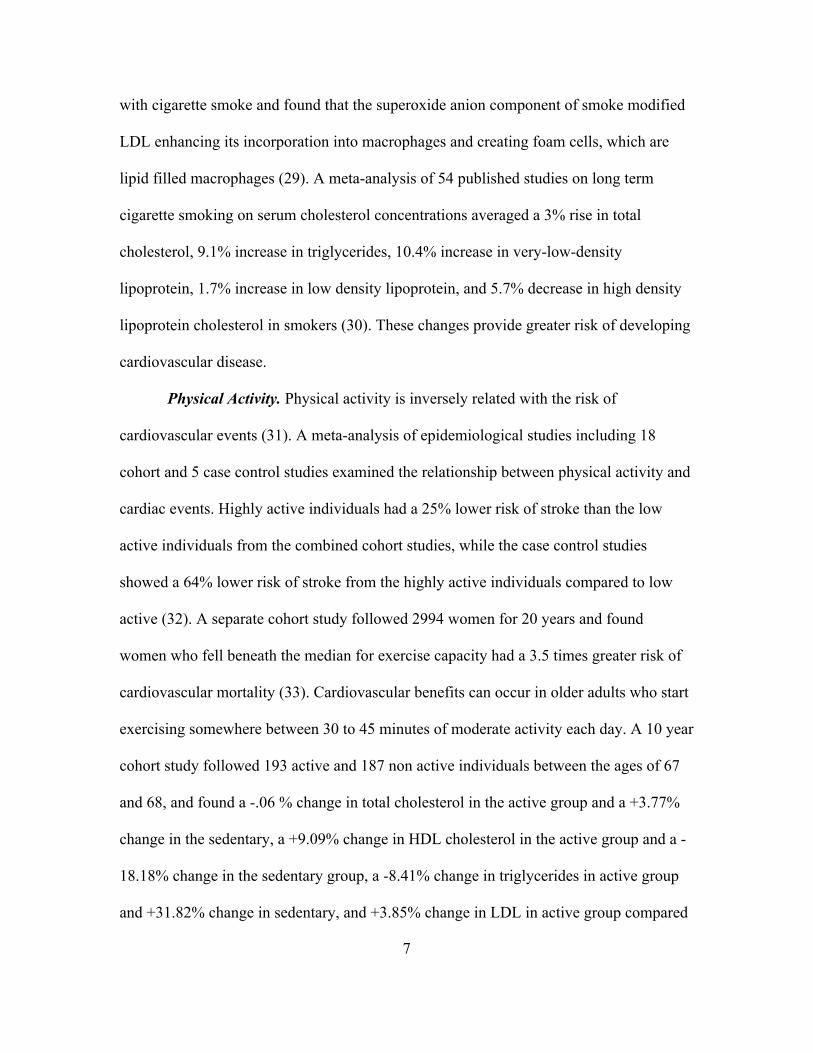
with cigarette smoke and found that the superoxide anion component of smoke modified
LDL enhancing its incorporation into macrophages and creating foam cells, which are
lipid filled macrophages (29). A meta-analysis of 54 published studies on long term
cigarette smoking on serum cholesterol concentrations averaged a 3% rise in total
cholesterol, 9.1% increase in triglycerides, 10.4% increase in very-low-density
lipoprotein, 1.7% increase in low density lipoprotein, and 5.7% decrease in high density
lipoprotein cholesterol in smokers (30). These changes provide greater risk of developing
cardiovascular disease.
Physical Activity. Physical activity is inversely related with the risk of
cardiovascular events (31). A meta-analysis of epidemiological studies including 18
cohort and 5 case control studies examined the relationship between physical activity and
cardiac events. Highly active individuals had a 25% lower risk of stroke than the low
active individuals from the combined cohort studies, while the case control studies
showed a 64% lower risk of stroke from the highly active individuals compared to low
active (32). A separate cohort study followed 2994 women for 20 years and found
women who fell beneath the median for exercise capacity had a 3.5 times greater risk of
cardiovascular mortality (33). Cardiovascular benefits can occur in older adults who start
exercising somewhere between 30 to 45 minutes of moderate activity each day. A 10 year
cohort study followed 193 active and 187 non active individuals between the ages of 67
and 68, and found a -.06 % change in total cholesterol in the active group and a +3.77%
change in the sedentary, a +9.09% change in HDL cholesterol in the active group and a -
18.18% change in the sedentary group, a -8.41% change in triglycerides in active group
and +31.82% change in sedentary, and +3.85% change in LDL in active group compared
8
with +6.89% change in sedentary group (34). These results associate physical exercise
with protection against abnormal lipid concentrations, resulting in less comorbidity from
cardiovascular events among active adults.
Diabetes. Diabetes is a disease that affects insulin secretion and impairs glucose
tolerance, and can increase the likelihood of getting cardiovascular disease. A cohort
study followed 2,629 Native Americans for 12 years, of those 1,104 had diabetes.
Baseline data reported systolic and diastolic blood pressure was higher in those with
diabetes. Elevated blood pressure is a co-morbidly of cardiovascular disease. Diabetes
increased the risk of cardiovascular disease by 2.9% in this cohort study (35). Diabetes
can cause damage to blood vessels from malfunctions with the pancreas not producing
enough insulin to combat glucose broken down from the ingestion of food. A prolonged
exposure to glucose leads to lipid build up and foam cell formation along with oxidative
stress. Glucose builds up in the blood and this increases the production of free radicals
which will cause apoptosis, or premature cell death, as well as reducing nitric oxide
causing blood vessels to tense and decrease blood flow, individuals are then more
vulnerable to atherosclerosis and stroke from lack of blood and oxygen. (36,37). Having
diabetes can increase the risk of developing cardiovascular disease two to four times
compared to those without (37).
Family History. Family history of cardiovascular disease is positively associated
with an increase in risk. A community in California was studied over 9 years to assess the
prevalence of cardiac risk factors and cardiac death. The researchers looked at different
ages, degree of relative, and history of heart attack, failure, or stroke. Of 4014 men and
women, men less than 60 years of age with previous family history of cardiac attacks had

9
higher risk of CVD and ischemic heart disease, since blood pressure and cholesterol were
also tested to be high. On the other hand women with a family history of CVD were not
strongly associated with a risk for CVD since both groups (positive family history and
negative family history) had similar death rates (38). A separate study conducted a
validated family history study in a retrospective cohort study to assess coronary heart
disease and hypertension risk in the current population based of family history. When two
or more 1st degree relatives suffered from one of these diseases, 8% of the family
population had a relative risk of 3.3 for women and 5.9 for men less than 40 years of age
(39). A family history of CVD or other heart conditions can lead to increased risk of
developing the disease for family members.
Alcohol. Alcohol and its association with CVD is dose dependent. The American
Stroke Association defines reasonable alcohol consumption as 2 drinks per day for men
and 1 drink per day for men, and a drink being 12 ounces of beer, 5 ounces of wine, and
1.25 to 1.5 ounces of liquor (40). The American Diabetic Association guidelines indicate
that 15 to 30g of alcohol a day is related to a reduced risk of coronary heart disease and
stroke (41). A study followed women from the Women’s Health Study and men from the
Physician’s health study, all without hypertension or cardiovascular disease at baseline
and after a 9.8 year follow up found that light to moderate alcohol intake, which is one
drink per day, reduced hypertension risk in women, but raised the risk in men. Women
drinking more than 4 drinks a day had a relative risk of 2.45 for hypertension (42). A
cross sectional study used data from the National Health and Nutrition Examination
Survey (NHANES II) to examine HDL cholesterol and alcohol concentrations among the
United States population. A daily intake of alcohol showed a positive change in HDL of
10
5.1mg/dL, and the regression analyses showed with every 1 g of alcohol consumed
increased the mean HDL by 0.87 mg/dL (43). The dangers of heavy drinking include a
higher risk for arrhythmia, high blood pressure, stroke, and heart muscle disease, while
the benefits of moderate drinking include reducing atherosclerosis and blood clot
formation (44).
High Blood Cholesterol. High blood cholesterol is a contributing factor in cardiovascular
disease. There are two types of molecules that transport cholesterol around in the body.
There is low-density lipoprotein cholesterol, which carries cholesterol to the arteries
where it can accumulate and cause atherosclerosis, this is considered the “bad
cholesterol”. High-density lipoprotein cholesterol, which grabs unesterfied cholesterol
and transports it back to the liver where it can be excreted in the bile, is considered the
“good cholesterol” (45). Non-HDL cholesterol is HDL cholesterol subtracted from the
total cholesterol and indicates the atherogenic cholesterol remaining. Non-HDL
cholesterol is comprised of LDL, lipoprotein a, intermediate-density lipoprotein (IDL),
and very low-density lipoprotein (VLDL) (46). Recent studies have suggested that non-
HDL cholesterol and the ratio of total cholesterols to be a more accurate predictor of
CVD than LDL or HDL cholesterol alone (47). The Strong Heart Study on American
Indian tribes collected data on diabetic subjects over 9 years and found the non-HDL
cholesterol had a hazard ratio (HR) of 2.23 for men and 1.80 for women, while the HDL
cholesterol had a HR of 0.59 in men and 0.97 in women, and LDL cholesterol had an HR
of 1.71 in men and 1.61 in women. The ratio of total/HDL cholesterol was a better
indicator of CVD for men with an HR at 2.46, but slightly less than non-HDL cholesterol
for women with a HR of 1.48. Total/HDL ratio was associated with a higher HR for

11
coronary heart disease, while non-HDL cholesterol was associated with higher HR for
myocardial infarction (48). When blood cholesterol is elevated it is important to consider
what exactly is raising it. A total cholesterol concentration above 240 mg/dL is
considered high, while less than 200 mg/dL is desired. Depending on LDL and HDL
cholesterol concentrations, the higher total cholesterol could be detrimental. If LDL
cholesterol is also high around 190 mg/dL this is considered very high and less than 100
mg/dL is best for health. HDL cholesterol concentration less than 40 mg/dL are
considered very low and over 60 mg/dL are optimal for health according to the American
Heart Association (49,130).
Biomarkers of Cardiovascular Disease
Lipids. Cellular lipid interactions in plasma, serum, and blood are the traditional
biomarkers to determine cardiovascular disease risk factors. A fasting blood sample of
lipid measurements like LDL cholesterol, HDL cholesterol, and triglycerides is preferred
(50). Total cholesterol to HDL cholesterol ratio has been shown to be a better predictive
measurement than isolated lipid parameters like LDL and HDL. The reason for this
relates to the fluctuation in HDL, if HDL is higher and total cholesterol stays the same,
this will result in a lower ratio, which is considered less risk for CVD, but if HDL
concentrations were low the ratio to total cholesterol would then be high indicating a
greater risk of CVD. This is more descriptive than only looking at total cholesterol or
HDL alone. Primary prevention risk concentrations for men include a total cholesterol to
HDL cholesterol ratio greater than 5, and greater than 4.5 for women. The ideal ratio for
men is less than 4.5 and less than 4 for women. Risk concentration of the LDL
cholesterol to HDL cholesterol ratio for men is greater than 3.5 and greater than 3 for
12
women. The ideal ratio for men is less than 3 and less than 2.5 for women. The ApoB to
ApoA-I ratio risk concentration for men is greater than 1 and greater than 0.9 for women.
The ideal ratio is less than 0.9 for men and less than 0.8 for women (9).
CRP. With atherosclerosis, inflammation can occur from the formation of plaque
on vessel walls. Endothelial dysfunction can develop and C-reactive protein (CRP), an
acute phase reactant produced in the liver, is a marker of inflammation. Lipids and
cholesterol build up in the arteries causing a blockage in blood flow, and vascular
inflammation (51). A 12-year observational study called The Cardiovascular Health
Study, including 5888 participants, measured CRP in relation to atherosclerosis detected
on a carotid ultrasound. Those with a CRP greater than 3 mg/L and had atherosclerosis
had a 72% increased risk for CVD death (52). CRP was evaluated as a biomarker in death
risk from cardiac issues in a clinical trial where 917 patients with coronary artery disease
were followed for an average of 37 months. At a two year follow up those with CRP
concentrations above 10 mg/L had significantly higher risk of death at 12.6%, compared
to a 5.1% risk in subjects with CRP concentrations less than 2 mg/L (53). Desirable
concentrations of CRP are less than 1.0 mg/L, concentrations between 1.0 mg/L and 3.0
mg/L indicate risk of CVD, while concentrations over 3.0 mg/L are considered high risk
for CVD (54).
Blood Pressure. Ideal systolic blood pressure is less than 115 mm Hg, and levels
higher than 140 mm Hg indicate systemic hypertension. Ideal diastolic blood pressure is
less than 80 mm Hg, and levels higher than 90 mm Hg also indicate hypertension (55).
Systolic blood pressure refers to the blood pressure in the arteries, which carry blood
away from the heart during heart muscle contractions. Diastolic blood pressure refers to
13
the blood pressure between contractions. Abnormal systolic blood pressure is a better
indicator of cardiovascular disease (56). The auscultatory technique is the typical method
used to get blood pressure measurements (57).
Cardiovascular Disease Lifestyle Interventions
As previously discussed, excess alcohol, smoking, and physical activity are major
risk factors, which are modifiable by lifestyle changes, and studies demonstrate that the
cessation of smoking, and increasing physical activity while keeping alcohol at a
moderate intake could lower the risks of cardiovascular disease. (58).
Smoking Cessation. People who are currently suffering from coronary heart
disease reduce the risk of repeated heart attacks or other cardiac events by stopping
smoking (59). A study done by Critchley et al. did a systematic review of prospective
cohort studies on patients diagnosed with coronary heart disease and the association
between smoking cessation rates. From 665 articles, relative risk of mortality dropped by
36% among patients who quit smoking with existing coronary heart disease compared to
those who did not quit (60).
Exercise. The Centers for Disease Control and Prevention and the American
College of Sports Medicine recommend adults should exercise 30 minutes or more each
day doing moderate physical activity such as walking briskly, swimming, and cycling
(61). A report on male residents in the Netherlands, between that ages of 35-69,
compared a high activity group to low activity and the relative risk for coronary heart
disease ranged from 1.2 to 2.3, vigorous exercise compared to no vigorous exercise, and a
14
relative risk of 1.1 to 2.1, moderate exercise compared to occasional low activity (62).
Increasing physical activity reduces the risk of coronary heart disease.
Decreasing Alcohol Intake. Decreasing alcohol consumption from excessive
amounts is another way to avoid risks of developing cardiac problems. Corrao and his
colleges examined epidemiological articles from 1966 to 1988, and 51 were selected for a
meta-analysis to which they found the average relative risk associated with drinking 89
grams or more of alcohol per day was around 1.05 (63). Heavy drinkers are at higher risk
of acquiring high blood pressure, heart failure, cardiac arrhythmia, and stroke and the
American Heart Association recommends the average intake be 1-2 drinks for men and 1
drink for women each day, and to keep it in moderation (64).
Losing Weight. Losing excess weight can be another key factor in reducing the
risk of CVD. Obese patients with a BMI over 30, generally have higher cardiac output
and workload and this pressure cause left ventricular chamber dilation and have other
negative effects on diastolic and systolic blood pressure from fat, especially intra
abdominal fat (36,65). The American Heart Association reports that with every 10kg
increase in body weight, systolic blood pressure can increase 3.0-mm Hg, and diastolic
blood pressure can increase 2.3-mm HG, and this increases coronary heart disease risk by
an estimate of 12% and stroke risk by 24% (66). An individual in the overweight or obese
category is recommended to consider losing weight to reduce some risks of
cardiovascular disease.
Dietary Modifications. The American Heart Association stresses the importance
of a healthy diet to combat heart problems. Nutrient dense foods are recommended, those
full of vitamins and minerals. A colorful variety of fruits and vegetables should be
15
included in the diet along with whole grain options, nuts, low fat dairy products, and a
limited amount of trans fats, sodium, and sweetened drinks (67).
The DASH Diet. One diet the American Heart Association recommends is the
DASH diet, which stands for Dietary Approaches to Stop Hypertension, which is
considered a heart healthy diet for handling high blood pressure and helping to reduce
any risks of stroke and heart attack (67,68). The DASH diet is intended to lower blood
pressure that is already high and recommends a diet low in saturated fat, cholesterol, and
total fat, red meats, sweets, and sugared beverages, while consuming higher amounts of
vegetables, fruits, whole grains, poultry, fish, nuts, and low-fat dairy. The DASH diet
eating plan differs depending on if the individual is trying to lose weight or not, but some
tips to help is to use fruit as a dessert, choosing whole grain foods over white, and using
half the butter or fat currently being used. Another focus of the DASH diet includes using
less sodium to keep blood pressure from increasing. Consuming six grams, about one
teaspoon, or less is recommended. Buying food labeled “no added salt” as well as
cooking meals like rice and pasta without salt is advised. Replacing salt with spices is
another way to keep flavor while consuming less sodium (69). The DASH diet held a
randomized controlled trial where participants with untreated systolic blood pressure
lower than 160mm Hg and diastolic blood pressure of 80-95 mm Hg, were fed a
controlled diet of either high fruits and vegetables or DASH diet recommendations over
an 8 week period. Sodium was kept at 3000 mg/day in both diets. The DASH diet showed
decreases in systolic blood pressure by -3.5 mm Hg in normal participants and -11.6
mmHg in hypertensive participants, and decreased diastolic blood pressure by -2.2 mm
Hg in normal participants and -5.3 mm Hg in hypertensive participants (70).
16
The Ornish Diet. The Ornish diet focuses on low fat intake, such as full fat dairy
and red meat, and increasing complex carbohydrates like fruits, vegetables, whole grains,
soy products, non fat dairy, and legumes, while including some fish, nuts, and seeds.
Consuming omega 3 fatty acid is another recommendation in food or supplement form.
The Ornish diet breakdown of calories includes no more than 10% of calories from fat,
10 milligrams of cholesterol a day, consuming sugar and sodium in moderation, and
getting protein from plant based sources (71). One randomized controlled trial took
patients with coronary artery disease and split them up into the experimental group
involving an Ornish diet with less than 5 mg/d cholesterol, less than 10% of total kcal
from fat, with mild exercise and stress management with the control group getting the
usual care in an outpatient setting. Cardiac positron emission tomographic scans were
taken after 5 years and most participants in the experimental group stopped the
progression of coronary heart disease (72,73). The experimental group showed
improvements in percent diameter stenosis, stenosis flow reserve, and lumen diameter
and the percentage of patients with significant changes in size and severity of myocardial
perfusion abnormalities with 99% of patients having better or no change compared to
55% of the control group. There was also a significant change in total cholesterol
between the experimental group and baseline data (-50 mg/dL ± 37), and the control
group and baseline data (-20 mg/dL ± 43) (73). The Ornish diet aims to reverse the
progression of heart disease by emphasizing real foods high in complex carbohydrates,
healthy fats, and plant-based proteins.
The Vegetarian Diet. The American Dietetic Association supports research
showing vegetarian diets are associated with lower risk of ischemic heart disease, lowers
17
LDL cholesterol, blood pressure, and hypertension. The vegetarian diet is one excluding
all forms of meat including seafood (74). A study measuring antioxidant status, oxidative
stress, and inflammation found vegetarians (individuals who had been vegetarians for
over 5 years), had a combined difference of -0.29 mm/L compared to the non vegetarians.
C-reactive protein was also -0.53 mg/L less in vegetarians than non vegetarians (75).
Plant based foods like fruits and vegetables have dietary fiber, flavonoids, and
antioxidants, also associated with reducing CVD risk. The Nurses’ Health Study and the
Health Professionals’ Follow up Study examined the relationship between vegetable
intake and multivariate relative risks of CVD. The relative risks (RRs) of all vegetable
intake is 0.82 for CAD and 0.90 for stroke, and all fruit intake is 0.80 for CAD and 0.69
for stroke. Intake is dose responsive and at least 8 servings of fruit and vegetables a day is
associated with the lowest risk for CAD (76). Clinical studies have also been done on the
cardioprotective effects of nuts, another vegetarian food. One six week trial had
participants consuming walnuts (41-56 g/day) and found that the change in LDL
cholesterol decreased by -22.0 mg/dL, and total cholesterol decreased from -24.7 mg/dL,
and Triglycerides decreased by -4.64 mg/dL (72). The protective effects of a vegetarian
diet are due to a variety of plant based foods containing nutrients like omega 3 fatty
acids, antioxidants, phytochemicals, fiber, folate, and other vitamins and minerals in
fruits, vegetables, nuts, and whole grains (76).
Diet Comparisons. The Institute of Medicine and the Adult Treatment Panel III
agree that saturated fat should be reduced to prevent CVD, but replacing it with a specific
macronutrient has not been suggested yet. A couple diets have been recommended such
as diets rich in monounsaturated fats, which have been shown to raise HDL cholesterol
18
and reduce triglycerides, diets rich in protein to lower blood pressure, and diets high in
carbohydrates like DASH to reduce blood pressure and LDL cholesterol (78). The
Optimal Macronutrient Intake Trial to Prevent Heart Disease (OmniHeart) conduced an
18 week randomized clinical crossover feeding trial in healthy adults over 30 years with a
systolic blood pressure between 120-159 mm Hg or a diastolic blood pressure between
80-99 mm Hg. The three diets were set up to have distinguishable differences in
macronutrients. Carbohydrates in the carbohydrate diet composed 55% of kcal, protein in
the protein diet composed 25% of kcal, and unsaturated fat in the unsaturated fat diet
composed 31% of total kcal. The protein diet had over half of the protein coming from
plant-based sources such as nuts, soy, seeds, grains, and legumes. The unsaturated diet
used oils like canola, olive, and safflower along with nuts and seeds to meet the percent
in kcal needed. Results showed that compared with the high carbohydrate diet, the high
protein diet decreased mean systolic blood pressure by 1.4 mm Hg in adults without
hypertension and decreased by -3.5 mm Hg in those with hypertension. LDL cholesterol
also decreased by -3.3 mg/dL, and triglycerides decreased by -15.7 mg/dL. The
unsaturated fat diet compared to the carbohydrate diet decreased systolic blood pressure
by -1.3 mm Hg in those without hypertension and decreased by -2.9 with hypertension,
while also increasing HDL cholesterol by +1.1 mg/dL. Risk factor changes were also
analyzed using the Framingham risk equation and Prospective Cardiovascular Munster
risk equation to calculate the average 10 year risk of coronary heart disease on each diet.
The CHD risk percent average between men and women in the protein diet reduced by -
5.8% compared to the carbohydrate diet, and the unsaturated fat diet reduced by -4.2%
compared to the carbohydrate diet (78). Based on this data, partial replacement of
19
carbohydrates with either monounsaturated fat or protein could help improve blood lipids
and reduce the risk of cardiovascular disease.
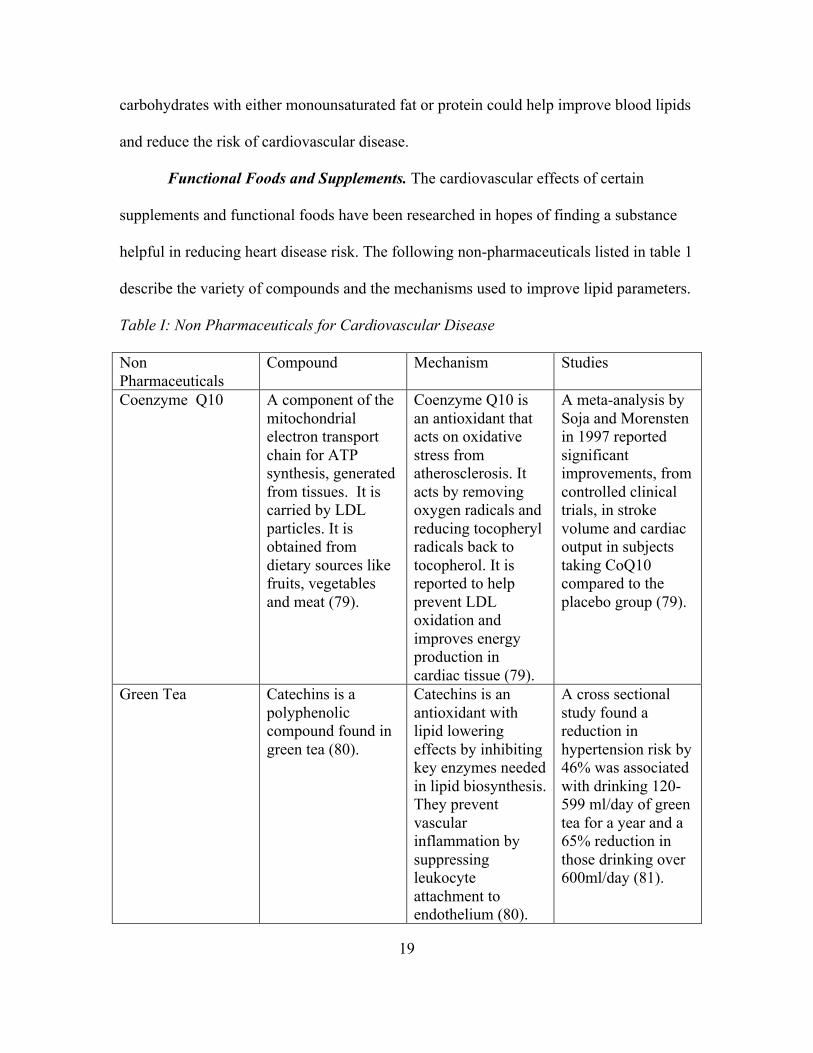
Functional Foods and Supplements. The cardiovascular effects of certain
supplements and functional foods have been researched in hopes of finding a substance
helpful in reducing heart disease risk. The following non-pharmaceuticals listed in table 1
describe the variety of compounds and the mechanisms used to improve lipid parameters.
Table I: Non Pharmaceuticals for Cardiovascular Disease Non Pharmaceuticals
Compound Mechanism Studies
Coenzyme Q10 A component of the mitochondrial electron transport chain for ATP synthesis, generated from tissues. It is carried by LDL particles. It is obtained from dietary sources like fruits, vegetables and meat (79).
Coenzyme Q10 is an antioxidant that acts on oxidative stress from atherosclerosis. It acts by removing oxygen radicals and reducing tocopheryl radicals back to tocopherol. It is reported to help prevent LDL oxidation and improves energy production in cardiac tissue (79).
A meta-analysis by Soja and Morensten in 1997 reported significant improvements, from controlled clinical trials, in stroke volume and cardiac output in subjects taking CoQ10 compared to the placebo group (79).
Green Tea Catechins is a polyphenolic compound found in green tea (80).
Catechins is an antioxidant with lipid lowering effects by inhibiting key enzymes needed in lipid biosynthesis. They prevent vascular inflammation by suppressing leukocyte attachment to endothelium (80).
A cross sectional study found a reduction in hypertension risk by 46% was associated with drinking 120-599 ml/day of green tea for a year and a 65% reduction in those drinking over 600ml/day (81).
20
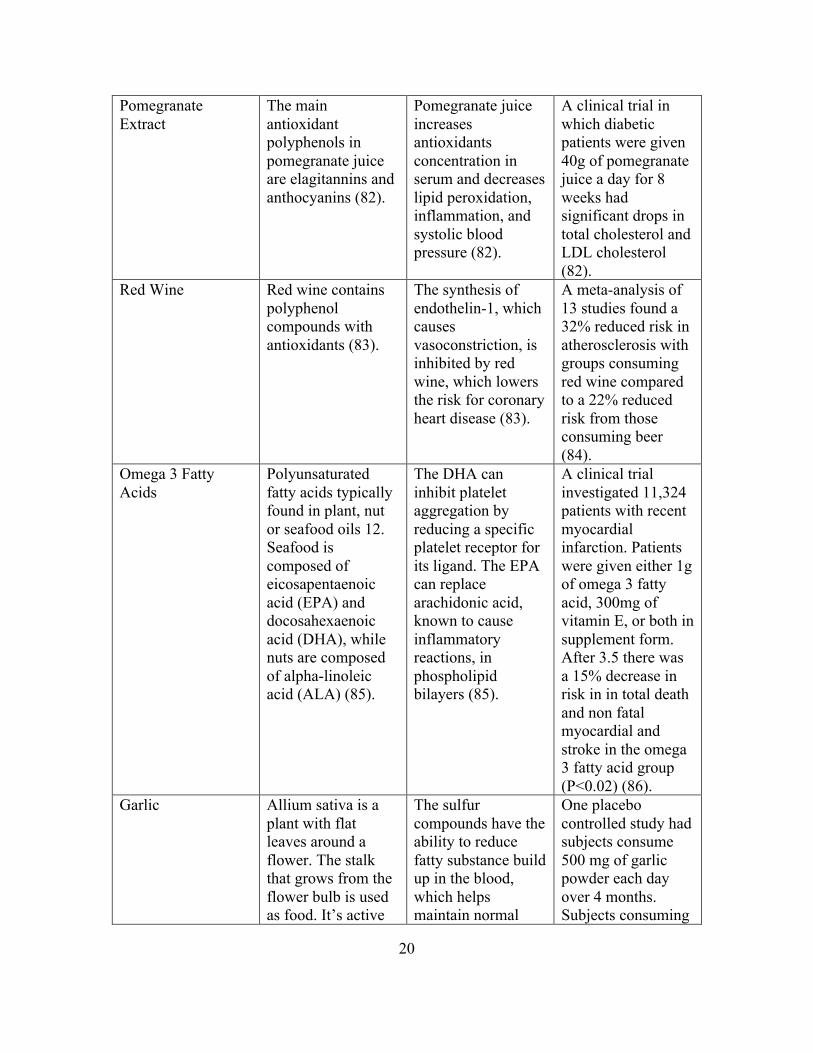
Pomegranate Extract
The main antioxidant polyphenols in pomegranate juice are elagitannins and anthocyanins (82).
Pomegranate juice increases antioxidants concentration in serum and decreases lipid peroxidation, inflammation, and systolic blood pressure (82).
A clinical trial in which diabetic patients were given 40g of pomegranate juice a day for 8 weeks had significant drops in total cholesterol and LDL cholesterol (82).
Red Wine Red wine contains polyphenol compounds with antioxidants (83).
The synthesis of endothelin-1, which causes vasoconstriction, is inhibited by red wine, which lowers the risk for coronary heart disease (83).
A meta-analysis of 13 studies found a 32% reduced risk in atherosclerosis with groups consuming red wine compared to a 22% reduced risk from those consuming beer (84).
Omega 3 Fatty Acids
Polyunsaturated fatty acids typically found in plant, nut or seafood oils 12. Seafood is composed of eicosapentaenoic acid (EPA) and docosahexaenoic acid (DHA), while nuts are composed of alpha-linoleic acid (ALA) (85).
The DHA can inhibit platelet aggregation by reducing a specific platelet receptor for its ligand. The EPA can replace arachidonic acid, known to cause inflammatory reactions, in phospholipid bilayers (85).
A clinical trial investigated 11,324 patients with recent myocardial infarction. Patients were given either 1g of omega 3 fatty acid, 300mg of vitamin E, or both in supplement form. After 3.5 there was a 15% decrease in risk in in total death and non fatal myocardial and stroke in the omega 3 fatty acid group (P<0.02) (86).
Garlic Allium sativa is a plant with flat leaves around a flower. The stalk that grows from the flower bulb is used as food. It’s active
The sulfur compounds have the ability to reduce fatty substance build up in the blood, which helps maintain normal
One placebo controlled study had subjects consume 500 mg of garlic powder each day over 4 months. Subjects consuming
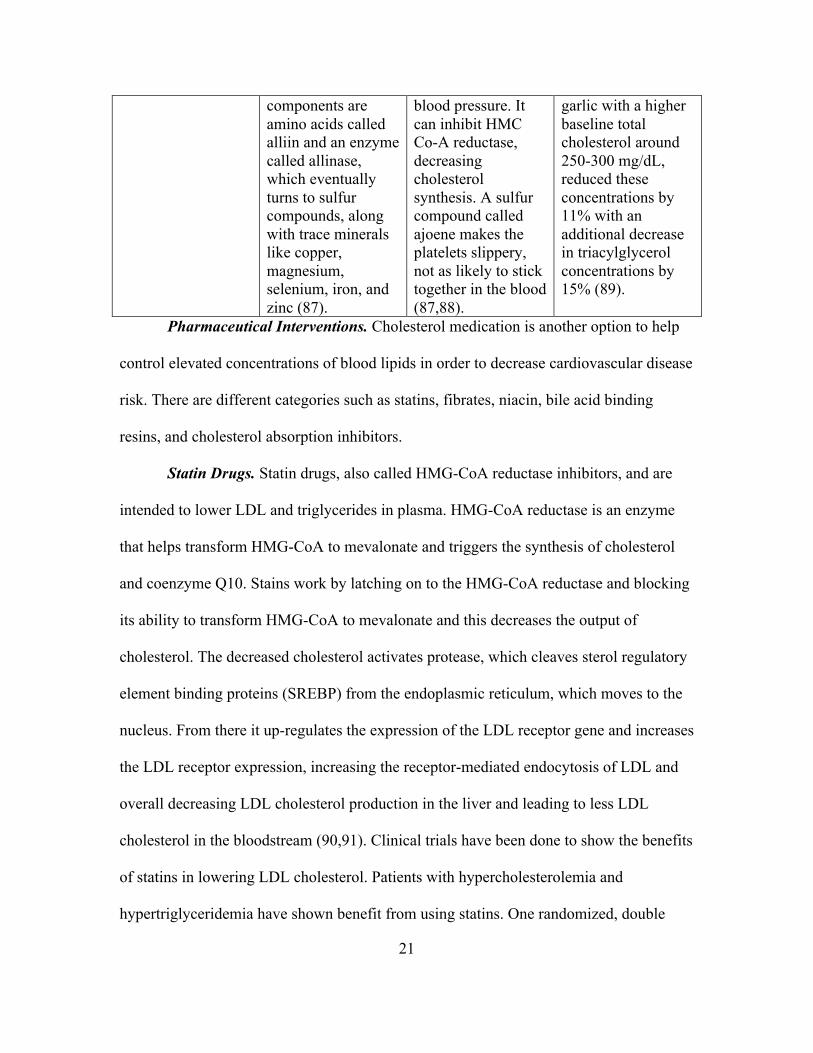
21
components are amino acids called alliin and an enzyme called allinase, which eventually turns to sulfur compounds, along with trace minerals like copper, magnesium, selenium, iron, and zinc (87).
blood pressure. It can inhibit HMC Co-A reductase, decreasing cholesterol synthesis. A sulfur compound called ajoene makes the platelets slippery, not as likely to stick together in the blood (87,88).
garlic with a higher baseline total cholesterol around 250-300 mg/dL, reduced these concentrations by 11% with an additional decrease in triacylglycerol concentrations by 15% (89).
Pharmaceutical Interventions. Cholesterol medication is another option to help
control elevated concentrations of blood lipids in order to decrease cardiovascular disease
risk. There are different categories such as statins, fibrates, niacin, bile acid binding
resins, and cholesterol absorption inhibitors.
Statin Drugs. Statin drugs, also called HMG-CoA reductase inhibitors, and are
intended to lower LDL and triglycerides in plasma. HMG-CoA reductase is an enzyme
that helps transform HMG-CoA to mevalonate and triggers the synthesis of cholesterol
and coenzyme Q10. Stains work by latching on to the HMG-CoA reductase and blocking
its ability to transform HMG-CoA to mevalonate and this decreases the output of
cholesterol. The decreased cholesterol activates protease, which cleaves sterol regulatory
element binding proteins (SREBP) from the endoplasmic reticulum, which moves to the
nucleus. From there it up-regulates the expression of the LDL receptor gene and increases
the LDL receptor expression, increasing the receptor-mediated endocytosis of LDL and
overall decreasing LDL cholesterol production in the liver and leading to less LDL
cholesterol in the bloodstream (90,91). Clinical trials have been done to show the benefits
of statins in lowering LDL cholesterol. Patients with hypercholesterolemia and
hypertriglyceridemia have shown benefit from using statins. One randomized, double
22
blind parallel study looked at the effects of 80mg/day dose of simvastatin, a type of statin
drug, on 521 hypercholesterolemia patients in 24 weeks. From baseline data LDL
cholesterol decreased by a mean of 46%, total cholesterol decreased by a mean of 35%,
triglycerides decreased by a mean of 25%, and HDL cholesterol increased by a mean of
6.1%. Statins also lower triglycerides and raise HDL slightly (92). A separate double
blind study dispersed either 40mg of pravastatin, a type of statin drug, or a placebo to
4159 men and women with myocardial infarction and over the course of five years stroke
incidents were lower by 31% among the group taking the statin compared to placebo, a
difference of 78 to 54 patients. Death from coronary heart disease occurred in only 96
patients in the pravastatin group compared to the 119 patients in the placebo group as
well as nonfatal myocardial infarction occurred in 182 patients in the pravastatin group
compared with 231 patients in the placebo group (93). The FDA warns about the possible
side effects of statins, such as cognitive impairment, increased blood sugar levels, and the
most reported, muscle damage (94).
Fibrates. Fibrates are another lipid lowering drug intended to work on fatty acids
and decreasing triglycerides. Fibrates trigger the peroxisome proliferator-activated
receptors (PPARs) to induce the formation of a nuclear transcription complex, which
ends up increasing HDL synthesis and lipoprotein lipase. They also prompt the uptake of
fatty acid and catabolism by the beta-oxidation pathways, which end up reducing fatty
acid and triglyceride synthesis. Fibrates increase apoA-I and apoA-II along with HDL
(95). Fibrates are the first drug selected for hypertriglyceridemia since triglycerides are
significantly decreased after use. A clinical study examined 1000 patients with different
types of hyperlipoproteinemia and a drug called bezafibrate, a form of fibrate medication,
23
on blood lipid concentrations. A placebo group was compared to the bezafibrate group,
the median % change in total cholesterol was -14.6% in the benzafibrate group and only
dropped -0.8% in the placebo group (among hyperlipoproteinemia patients with type IIa).
The median % change in total triglycerides in the bezafibrate group was -29.9%, while
the placebo had a -2.1% drop. LDL cholesterol fell -16.4% in the bezafibrate group and -
0.4% in the placebo group. The HDL cholesterol to total cholesterol ratio increased
+31.3% in the bezafibrate group compared to the +0.2% increase in the placebo group.
This study suggests that fibrates are a safe and effective medication to improve lipid and
lipoprotein concentrations (96). Fibrates work by increasing the clearance of very low-
density lipoprotein cholesterol and reducing cholesterol synthesis in the liver, effects that
have been shown to help decrease coronary heart disease. A clinical trial testing the effect
of gemfibrozil, a type of fibrate drug, on 700 CHD patients with type 2 diabetes and low
HDL cholesterol compared blood lipids concentrations after a five year period and found
triglycerides decreased by 24% and HDL increased by 7.5% with no significant change in
LDL and an overall decrease in coronary heart disease by 22% (97). Rhabdomyolysis is a
possible side effect of taking fibrates. A study of 132 men and 145 women observed
22.8% were experiencing adverse skin reactions, 9.8% had GI diseases like pancreatitis,
and 6% had nervous system disorders (98).
Niacin. Niacin is known to modify lipoproteins and is used for the treatment of
dyslipidemia and cardiovascular disease. Also called nicotinic acid or vitamin B3 and is
found in food and prescriptions. It was the first medication used for lipid regulation and it
has been shown to successfully lower total cholesterol, LDL cholesterol (including small
dense LDL), total triglycerides, and lipoprotein-a (99). Niacin works by inhibiting
24
triglyceride lipolysis in the adipose tissue, thus reducing free fatty acids. It also hinders
hepatocyte diacylglycerol acyltransferase, which causes an increase in apolipoprotein-B
break down and reduces the secretion of VLDL and LDL cholesterol. Niacin can also
increase lipoprotein-A1, which is a component of HDL (100,101). The Coronary Drug
Project tested the effects of niacin compared with a placebo in 8,341 men using a dosage
of 2000 mg of niacin over the course of 6.2 average years. The niacin group experienced
26% less incidences of myocardial infarction and 24% less cerebrovascular events. Total
mortality was 11% less than the placebo group at a 15 year follow up (102). A
randomized, double blind, placebo controlled trial by Morgan et al. compared 122
patients in three separate groups, placebo group, 1000 mg/day Niaspan (an extended
release capsule of niacin) and 2000 mg/day Niaspan. Over the 12 week trial Niaspan
reduced low-density lipoprotein by 6% in the 1000 mg/day group and 14% in the 2000
mg/day group and high-density lipoprotein increased by 17% and 23% for the 1000
mg/day group and 2000 mg/day group. The placebo group showed no significant
improvements in lipids except for a small increase in HDL by 4%. Serum lipoprotein-a
and triglyceride concentrations decreased by 27% and 29% in the 2000 mg/day group as
well (103). Some negative effects of niacin use include flushing, where the skin becomes
warm, usually in the face, possible increases in blood sugar concentrations, as well as
gastrointestinal discomfort. A randomized controlled study by Mills et al. looked at these
symptoms in a 500mg supplement of niacin in 68 men and women, 33 in niacin group, 35
in placebo group, and found that all 33 participants in the niacin group experienced
flushing within a mean time of 18.2 minutes after ingestion. Gastrointestinal issues
occurred in 30% of the volunteers (104). Tingling and itching sensations can also occur.
25
Since flushing is the most common side effect of niacin, alternatives like statin drugs are
the more popular form of cholesterol lowering medication (105).
Bile Acid Binding Resin. Bile acid binding resin (BAR) is an alternative
treatment for hyperlipidemia and has been used for over 40 years. BAR works by
absorbing bile acids, in the lumen of the intestines and increases the excretion of
cholesterol in fecal matter. In both human and rodent trials BAR was shown to improve
glucagon-like peptide-1 (GLP-1) secretion, which is a neuropeptide that helps slow down
gastric emptying and increases satiety (106,107). A study by Glueck et al. observed the
cholesterol change in children heterozygous for familial hypercholesterolemia taking a
type of bile acid resin called cholestyramine over the course of 5 years. There was a
12.5% decrease in total cholesterol concentration in 32 children taking resins (108).
Cholestyramine is another generic name for bile acid binding resin and helps move more
cholesterol through the liver to be excreted in the fecal matter by binding to bile acids in
the gastrointestinal tract. Nine participants with primary hypercholesteremia were
followed for four years and given cholestyramine and total serum cholesterol was shown
to decrease in eight out of nine participants. It was also observed that cholesterol would
rise again once cholestyramine administration was interrupted (109). Some side effects of
bile acid resins include heartburn, gas, upset stomach, and constipation. They can also
interfere with medications treating low blood sugar (110).
Cholesterol Metabolism, Measurements, and Biomarkers
Cholesterol is a waxy compound found in the tissues of animals and humans and
is mainly produced in the liver. Cholesterol is acquired through food and diet in dairy,
meat, fish, poultry and oil products even though the body makes enough cholesterol

26
endogenously to meet its needs. It is necessary for the absorption of fat soluble vitamins
like A, D, E, and K, and production of steroid hormones. Around 300 to 400mg of
cholesterol comes from dietary intake each day, while the rest is synthesized in the liver
(111). Cholesterol is made from the conversion of three acetyl CoAs into 3-hydroxy-3-
methylglutaryl-CoA or HMG-CoA, which is then converted to mevalonate by HMG-CoA
reductase, then isopentenyl pyrophosphate (IPP), losing carbon dioxide and converting to
squalene, then finally cholesterol (112).
Lipoproteins. Lipoproteins contain varying amounts of cholesterol and transport it
throughout the body. Lipoproteins consist of high-density lipoprotein HDL, low-density
lipoprotein LDL, very low-density lipoprotein VLDL, intermediate density lipoprotein
IDL, and chylomicrons. HDL is made in the liver and then moves through the blood in
tissues, absorbing unesterfied cholesterol to transport it back to the liver for excretion.
VLDL is formed mainly in the liver and partially in the intestines and transports new
triglycerides and lipids from the liver to adipose tissues throughout the body. LDL is
formed in the blood from VLDL and becomes this when triglycerides are removed from
the VLDL. LDL then transports cholesterol from the liver to the blood and tissues in the
body. LDLs are made up of higher amounts of cholesterol and contain smaller amounts
of protein. HDL is the opposite containing high amounts of protein and little cholesterol.
Chylomicrons are formed in the gastrointestinal tract, transported to the lymph system
and then to the blood, transporting dietary fat into the blood, and tissues throughout the
body. Triglycerides are embedded in the chylomicron and once they are removed the
remains of the chylomicron are absorbed by the liver (110,91,113).
27
Apoproteins. Lipoproteins contain different fractions of triglycerides, cholesterol,
phospholipids, and proteins called apoproteins (A,B,C,D,E). Apoproteins help the
enzymes responsible for lipoprotein break down and metabolism (114). Apolipoprotein
(apo) B-100 represents a majority of the protein in LDL and is also in IDL and VLDL.
Apo B-48 is made in the intestines and is the major protein on chylomicrons (111).
Apolipoprotein A-I is the major protein in HDL and in charge of initiating reverse
cholesterol transport. A high ratio of Apo B to Apo A-I results in more cholesterol
circulating through the blood, which could increase atherosclerosis risk (9). Apo C-II is
needed for lipoprotein lipase activation, which hydrolyzes triglycerides, converting
chylomicrons into chylomicron remnants and VLDL to IDL, which ends up being LDL
(115).
Triglycerides. Triglycerides are a type of lipid composed of three fatty acids
attached to one glycerol backbone. They mainly exist as fat in food sources or storage in
fatty tissues and vary depending on the length of fatty acid chain and degree of saturation
and are synthesized by the liver or intestines for energy (116). Triglycerides from dietary
fat are incorporated into chylomicrons and transported in the blood to tissues. Daily
intake ranges from 70 to 150g (117). Triglycerides are considered a marker for heart
disease risk. Normal triglyceride concentrations should be less than 150 mg/dL and the
American Heart Association recommends a fasting concentration of 100 mg/dL for
increased heart and blood vessel protection. The highest risk for acute pancreatitis is
triglyceride concentrations above 500 mg/dL (118).
Fatty Acids. Fatty acids are the basic building blocks of fats and are considered
either saturated, monounsaturated, or polyunsaturated (116). According to chain length
28
fatty acids are divided into three categories, short chain fatty acids, which are 2-6 carbon
atoms, medium chain fatty acids, which are 8-12 carbon atoms, and long chain fatty
acids, which are 14 carbon atoms or more. According to the degree of saturation and the
presence of a double bond or not, fat is classified as either saturated or unsaturated.
Saturated fatty acids have no double bond and have many hydrogens attached.
Unsaturated fatty acids have one or more double bonds and differ by isomers being either
cis or trans where hydrogens are either on the same side or opposite sides of the chain.
Long chain fatty acids are broken down into saturated and unsaturated (119). Saturated
fats consist of tropical oils like coconut and palm kernel oil, animal fats, butter and milk
(120). Unsaturated fats are further divided into polyunsaturated fats and monounsaturated
fats. Polyunsaturated fats consist of omega 3 fatty acids, some common ones being
eicosapentanoic acid (EPA) from sources like fish as well as docosahexanoic acid (DHA)
also from fish sources as well as alpha linolenic acid (ALA), which comes from plant
sources like walnuts, soybeans and flaxseeds. Omega 6 fatty acids generally come from
sources like vegetables oils such as corn or safflower (121). They can decrease LDL
cholesterol and are less resistant to oxidation. Monounsaturated fats contain omega 9
fatty acids and are found in food sources like nuts, olives, and avocados (122). Omega 9
fatty acids can decreased LDL cholesterol, but are more resistant to oxidation than
polyunsaturated fatty acids. In the U.S. omega 6 fatty acids are the most commonly
consumed fatty acids because of the popularity of vegetable oils, but the body lacks the
enzymes needed to convert omega 6 fatty acids into omega 3 fatty acids (123). Omega is
the last letter in the Greek alphabet and refers to the last carbon atom in the fatty acid
chain. The omega fatty acid gets its name based on the position of the first unsaturation.
29
Omega 3 would indicate that the first double bond is at the third carbon-carbon bond
from the methyl end of the fatty acid (124).
Trans Fatty Acids. Trans fatty acids are artificially processed plant oils that
involve the hydrogenation of unsaturated fatty acids where there is a change in the
isomerism of the double bond in the chain length and cis is switched to trans to produce a
product that resist rancidity and has a higher melting point. Trans fatty acids became the
popular alternative to tropical fats like coconut oil since food industries desired solid fats
with a longer shelf life (125). There is an association between trans fatty acids and
negative blood lipid parameters due to studies that tested the effects of dietary trans fatty
acids on cholesterol concentrations. A study done by Mensink et al. placed 34 women
and 25 men on three mixed diets with 10% of daily energy intake coming from either
saturated fatty acids, trans isomers of omega 9 fatty acid (oleic), or omega 9 fatty acid in
the cis form. The ratio of total cholesterol to HDL cholesterol in the trans isomers of
omega 9 fatty acid diet changed by an increase of +11.99 mg/dL, while the saturated fatty
acid diet increased +0.77 mg/dL, and the cis isomers of omega 9 fatty acid diet decreased
-13.15 mg/dL. Trans fatty acids diet also raised LDL cholesterol by +14.31 mg/dL and
lowered HDL cholesterol by -6.57 mg/dL compared to the cis isomers omega 9 fatty acid
diet (125). Based on a meta analysis of prospective studies there is a 24-32% increased
risk of myocardial infarction and coronary heart disease death with every 2% increase in
trans fatty acid consumption when replacing either carbohydrates, short chain fatty acids,
cis medium chain fatty acids and cis polyunsaturated fatty acids (126). In 2013 the FDA
stated partially hydrogenated oils were no longer generally recognized as safe and should
30
not be used in the production of food. The FDA released June 2015 a statement giving
food manufacturers three years to remove all trans fats from their products (127).
Cholesterol Metabolism. The exogenous pathway of cholesterol starts with fat
and cholesterol absorption in the gut, and from there apoproteins, unesterfied cholesterol,
and phospholipids cling to the newly absorbed triglyceride or cholesterol and are
packaged into a chylomicron. This chylomicron will then move through the lymph
system in the intestine and enter the blood where it then latches on to the adipose and
skeletal muscle tissue cells. Lipoprotein lipase reacts with the chylomicron releasing the
free fatty acids, which then move through the endothelial cells and end up stored in the
adipose and skeletal muscle tissues. Once the free fatty acids and triglycerides are
removed the remnant chylomicron particle, made up of apoproteins binds to the liver
cells to be broken down by lysosomes. Empty HDL is another product of this process and
these can pick up LDL and phospholipids from peripheral tissues. The chylomicron
remnant travels to the liver where apoE binds to the remnant receptor and at this point
cholesterol is free and the liver could excrete it in the bile or package it into VLDL to be
sent back to the tissues. The endogenous pathway starts at the liver where triglycerides
are packaged on to VLDL. VLDL’s then travel through blood to peripheral tissues and
release as glycerol and fatty acids at muscle and adipose tissue. When this happens the
VLDL becomes smaller and is now called IDL. IDL are absorbed into the liver from the
blood and are broken down by hepatic lipase, apoproteins break off and cholesterol esters
are traded for triglycerides and LDL is formed. LDL contains high amounts of cholesterol
and is absorbed by peripheral tissue by binding to LDL receptors, while extra LDL is
absorbed by the liver (114,127,128). Reverse cholesterol transport occurs when there is
31
excess cholesterol in the peripheral tissues and HDL interacts with ATP binding cassette
transporter A1 (ABCA1) and takes cholesterol back to the liver (129). Cholesterol is
excreted in the bile as free cholesterol or bile salts (128).
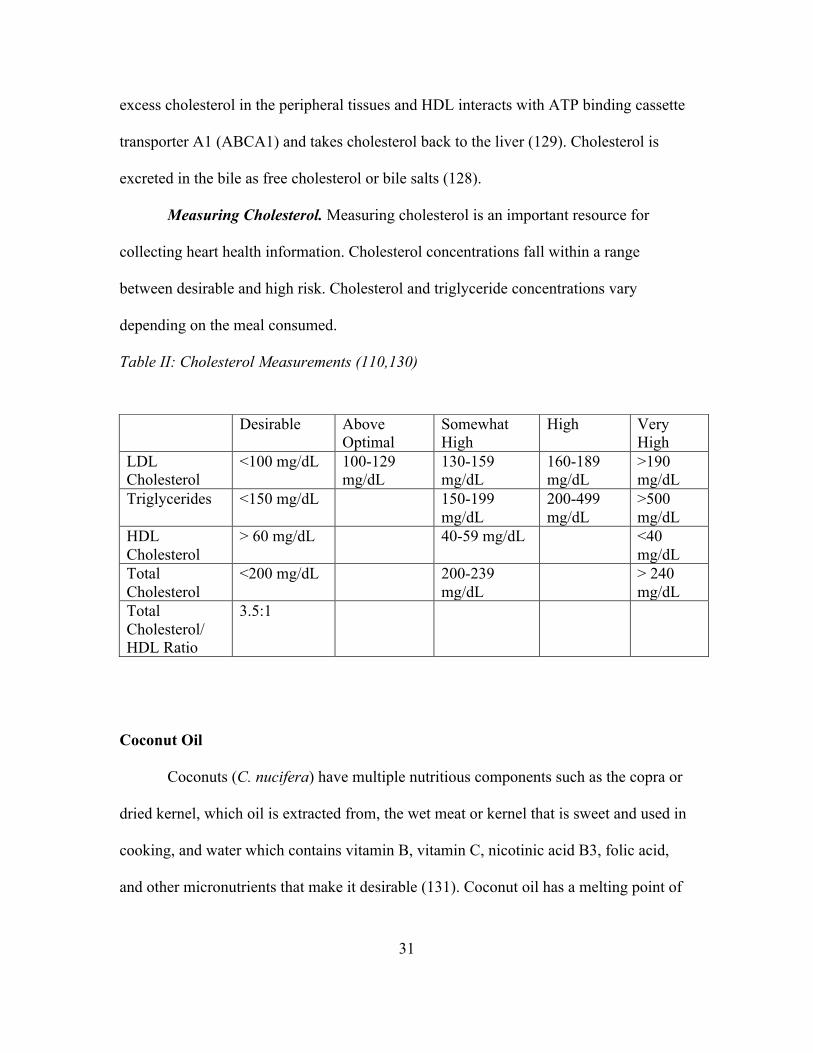
Measuring Cholesterol. Measuring cholesterol is an important resource for
collecting heart health information. Cholesterol concentrations fall within a range
between desirable and high risk. Cholesterol and triglyceride concentrations vary
depending on the meal consumed.
Table II: Cholesterol Measurements (110,130)
Coconut Oil
Coconuts (C. nucifera) have multiple nutritious components such as the copra or
dried kernel, which oil is extracted from, the wet meat or kernel that is sweet and used in
cooking, and water which contains vitamin B, vitamin C, nicotinic acid B3, folic acid,
and other micronutrients that make it desirable (131). Coconut oil has a melting point of
Desirable Above Optimal
Somewhat High
High Very High
LDL Cholesterol
<100 mg/dL 100-129 mg/dL
130-159 mg/dL
160-189 mg/dL
>190 mg/dL
Triglycerides <150 mg/dL 150-199 mg/dL
200-499 mg/dL
>500 mg/dL
HDL Cholesterol
> 60 mg/dL 40-59 mg/dL <40 mg/dL
Total Cholesterol
<200 mg/dL 200-239 mg/dL
> 240 mg/dL
Total Cholesterol/ HDL Ratio
3.5:1
32
23-26 degrees Celsius, which makes it solid at room temperature below 73 degrees (132).
Virgin coconut oil has a natural coconut aroma, is colorless, and resists rancidity (133).
Extraction Methods. The dry process of collecting coconut oil is made from
copra, where is it exposed to high heat or sunlight for several days and the end product is
called copra oil. The outer shell from a fallen or manually picked nut is split and the
endosperm meat is then dried. Drying the meat can be done in the sun or in an oven. A
screw press is first used to expel the copra, then n-Hexane is used to extract the oil (132).
The wet process involves extracting oil from coconut milk under controlled settings and
heat and the end product is called virgin coconut oil (134). There are multiple means of
separating the oil from water, such as fermentation, refrigeration, enzyme action,
centrifugal separation, and micro-expelling (133).
Composition. Virgin coconut oil is a mixture of free fatty acids, 85%
triglycerides, 7% diglycerides, and 3% monoglycerides (135). Coconut oil is a saturated
fat mainly made up of medium chain fatty acids (MCFAs), around 65%, which are
comprised of 8-12 carbons, and is more water soluble than other vegetables oils
(131,135). The fatty acid breakdown of coconut oil extracted from the seed kernel of
Cocos nucifera is 44.6g per 100g 12:0 medium chain, saturated fatty acid (lauric acid),
16.8g per 100g of 14:0 long chain, saturated fatty acid (myristic acid), and 8.2g per 100g
of 16:0 long chain, saturated fatty acid (palmitic acid) (136) Marina et al. looked at ten
virgin coconut oil samples from Malaysia and Indonesia and compared them with refined
coconut oil. These samples were composed of caprylic, caproic, capric, lauric, myristic,
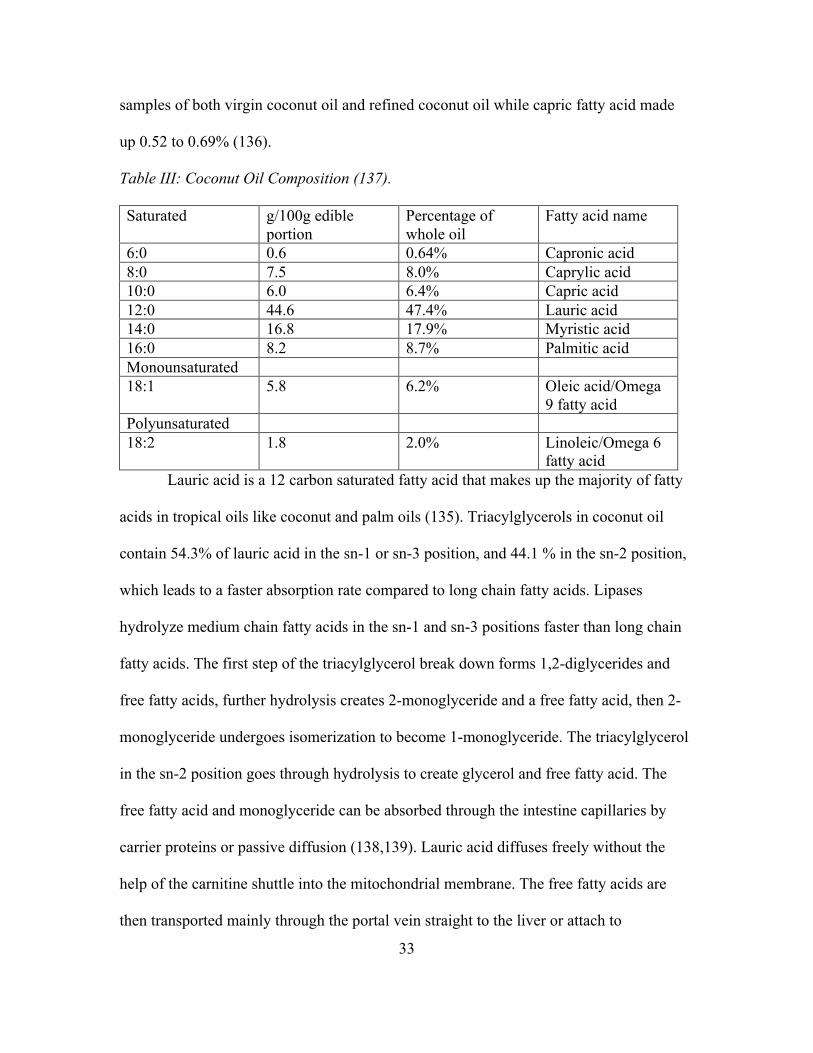
stearic, palmitic, and linoleic acid (136). Lauric acid made up 46 to 53% between the
33
samples of both virgin coconut oil and refined coconut oil while capric fatty acid made
up 0.52 to 0.69% (136).
Table III: Coconut Oil Composition (137). Saturated g/100g edible
portion Percentage of whole oil
Fatty acid name
6:0 0.6 0.64% Capronic acid 8:0 7.5 8.0% Caprylic acid 10:0 6.0 6.4% Capric acid 12:0 44.6 47.4% Lauric acid 14:0 16.8 17.9% Myristic acid 16:0 8.2 8.7% Palmitic acid Monounsaturated 18:1 5.8 6.2% Oleic acid/Omega
9 fatty acid Polyunsaturated 18:2 1.8 2.0% Linoleic/Omega 6
fatty acid Lauric acid is a 12 carbon saturated fatty acid that makes up the majority of fatty
acids in tropical oils like coconut and palm oils (135). Triacylglycerols in coconut oil
contain 54.3% of lauric acid in the sn-1 or sn-3 position, and 44.1 % in the sn-2 position,
which leads to a faster absorption rate compared to long chain fatty acids. Lipases
hydrolyze medium chain fatty acids in the sn-1 and sn-3 positions faster than long chain
fatty acids. The first step of the triacylglycerol break down forms 1,2-diglycerides and
free fatty acids, further hydrolysis creates 2-monoglyceride and a free fatty acid, then 2-
monoglyceride undergoes isomerization to become 1-monoglyceride. The triacylglycerol
in the sn-2 position goes through hydrolysis to create glycerol and free fatty acid. The
free fatty acid and monoglyceride can be absorbed through the intestine capillaries by
carrier proteins or passive diffusion (138,139). Lauric acid diffuses freely without the
help of the carnitine shuttle into the mitochondrial membrane. The free fatty acids are
then transported mainly through the portal vein straight to the liver or attach to
34
chylomicrons and go through the lymph vessels (139). A study by Bragdon et al. looked
at the fatty acid composition of olive oil, cod liver oil, and coconut oil in rats and found
that only 15-55% of lauric acid from coconut oil is absorbed by the lymph while the rest
is absorbed through the portal system and then less than 5% was found in feces (140)
Another study by Goransson explained that the faster absorption rates of medium chain
fatty acids from the blood have to do with their high solubility in water. Lauric acid is
less hydrophobic and more polar than other fatty acids. Lauric acid disappeared the
quickest from blood samples of rats injected with lauric acid, myristic acid, and palmitic
acid (141). Palmitic acid is the major saturated fat consumed by Americans, so
cholesterol raising effects found in a high saturated fatty acid diet could be due to this
particular type of fatty acid and not from lauric acid (142).
Metabolism. Coconut oil is made of mostly medium chain fatty acids, and these
are metabolized differently from other fatty acids. Medium chain fatty acids are absorbed
through the lumen in the intestinal mucosa and travel through the portal vein to the liver,
they do not enter degradation or re-esterification, they bypasses the lipoprotein lipase
regulated metabolic pathway and are not deposited in adipose tissues, which mean they
provide readily available form of energy (137,143). Unlike long chain fatty acids,
medium chain fatty acids do not participate in the transport of cholesterol, they do not
need pancreatic lipase, or carnitine acyltransfereanse for transport and absorption, they
are not carried by chylomicrons to eventually undergo beta oxidation in the liver to create
cholesterol or triglycerides (137). A randomized, double blind trial measured fatty acid
metabolism among 10 healthy subjects by comparing an intervention fat formula of 72%
medium chain fatty acids and 22% omega 3 long chain polyunsaturated fatty acids in a
35
1,500 kcal/day diet with 55.5% of energy being fat. The placebo fat formula was
vegetable oils composed of mainly long chain fatty acids. Each formula contained 82.8
kcal or 9.2 grams of total energy coming from fat. The lipid profile of blood plasma was
evaluated and the change in cholesterol concentration decreased in the intervention group
by -44.6 mg/dL from baseline to day 15, while the placebo group only had a change of -
22.2 mg/dL. Triacylglycerol in plasma had a change of -77 mg/dL in the intervention
group, while the placebo group had a change of -12.4 mg/dL. Generally dietary fat has an
inability to promote fat oxidation, but medium chain fatty acid are absorbed and
metabolized in a way where fatty acid oxidation, and hepatocellular beta oxidation is
stimulated creating rapid fat release in the blood (143).
Health Effects. Virgin coconut oil has a higher polyphenol content compared to
refined coconut oil, which helps prevent the oxidation of LDL. Polyphenols trap reactive
oxygen in plasma and interstitial fluid preventing LDL oxidation. The polyphenols and
tocopherols could also play a role in preventing carbonyl formation of LDL (144). A
study on rodents compared the polyphenol effects of virgin coconut oil compared to
copra oil. The total polyphenol content of virgin coconut oil given to the rats was around
80mg/100g of oil, while copra oil had around 65mg/100g of oil. Rats given the virgin
coconut oil ended up having higher HDL cholesterol concentrations, lower LDL
cholesterol concentrations, total cholesterol, triglycerides, and phospholipids in serum
and tissues such as the liver, heart and kidneys than the group given copra oil. Anti-
oxidative properties of the polyphenols from the virgin coconut oil and copra oil on
copper induced LDL cholesterol oxidation were measured as well. Virgin coconut oil had
a significant impact on preventing LDL cholesterol oxidation compared with copra oil
36
and had around a 90% inhibition rate on carbonyl formation during the copper induced
LDL oxidation compared with around a 80% inhibition rate from copra oil (134). This
may be due to a higher amount of unsaponifiable components in the virgin coconut oil,
which keep tocopherols and phytosterols intact. A separate study found the
unsaponifiables in coconut oil to be 0.5% and squalene in oil to be 16 ug/g of oil (145).
Squalene is an isoprenoid compound, composed of two or more hydrocarbons, involved
in the metabolism of cholesterol and protects against lipid peroxidation (146). The total
phenolic content (mg GAE/100g oil) ranged from 7.9% to 29.2% among virgin coconut
oil and 6.1% for refined coconut oil. The total antioxidant activity ranged from 49.8% to
79.9% for virgin coconut oil and 49.6% for refined coconut oil. This difference in virgin
coconut oil and refined coconut oil antioxidant concentrations could be caused by the
process of heating during the refining process (136). The more polyphenol substance in
the oil the more antioxidant activity, which can help reverse cholesterol transport and
reduce cholesterol absorption in the intestines and overall lower cholesterol.
History of Coconut Oil and Medicinal Effects. Historically coconut oil has been
used in larger quantities in places like the Pacific Islands, Asia, and India, and the East
Indies even calls it green gold (147). Indonesia produces the most coconuts followed by
India, Brazil, and Sri Lanka (132). These communities have used coconut oil for cooking,
medicinal, and cosmetics reasons for many years (148). In Sri Lanka the coconut is
known as the Tree of life and makes up about 80% of their total fat intake (149). Most
households in Sri Lanka have about 20% of total energy coming from fat, with 70% from
coconut alone. Coconut contributes to a large part of fat intake for all socio economic
classes. Lower class levels are receiving about 69-71% kcal of what the Food and
37
Agriculture Organization (FAO) and World Health Organization (WHO) suggest (150).
A study examining the diet of 60 individuals in the central province of Sri Lanka found
the mean average energy intake to range from 1902 kcal/day in a low coconut fat diet to
2018 kcal/day in a high coconut fat diet (151). About 274 kcal/day would be coming
from just coconut. According to the Demographic Yearbook of the United Nations, Sri
Lanka had the lowest death rate from heart disease in 1978, but has increased in recent
years (152).
After the mid 1940s coconut oil increased in international trade, but then
decreased in 1987 when this tropical oil fell under scrutiny by certain companies and
researchers such as the American Soybean Association and American Medical
Association for being linked to heart disease (153). During this time replacing saturated
fat with polyunsaturated fat was recommended as well as encouraging food
manufacturers to discontinue to the use of tropical oils in their food products (153). In the
U.S. around 2002 the National Academy of Science’s Institute of medicine found trans
fats to increase low density lipoprotein, which prompted the FDA to start requiring trans
fats to be in nutrition labels in 2006 (154). According to the World Health Organization
the world coconut oil consumption increased from around 3.3 million metric tons in 2008
to over 3.8 in 2009 (155).
Animal Studies. Several studies involving rodents have investigated the effects of
coconut oil on blood lipid parameters. A study done by Nevin et al. examined blood lipid
concentrations of Male rats given 8g/100g weight of virgin coconut oil, copra oil, or
ground nut oil after a 45 day feeding period. Serum cholesterol between rats fed ground
nut oil and virgin coconut oil had a difference of 15.9mg/dL, and the difference of
38
14.7mg/dL between copra oil and virgin coconut oil. Virgin coconut oil displayed the
lowest concentrations of cholesterol in serum, liver, and the heart. Virgin coconut oil had
higher concentrations of HDL, and lower concentrations of LDL and VLDL compared to
copra oil and ground nut oil as well (134). Bird carcasses and their serum lipids were
examined in a separate study, where four intervention diets of soybean oil was replaced
with either 25%, 50%, 75%, or 100% coconut oil. After 42 days, serum lipids showed
total cholesterol to HDL ratio in the 100% coconut oil diet to be 1.27mg/dL compared to
1.33mg/dL for the control group containing only soybean oil. The total cholesterol to
HDL ratio for 75% coconut oil was the lowest at 1.2mg/dL (156). A study on rats
compared the lipid parameters between groups fed either coconut oil or soybean oil. Rats
fed 20% coconut oil after six weeks had a total cholesterol score of 3.6mg/dL and an
HDL cholesterol of 1.8mg/dL, while those fed 20% soybean oil had a total cholesterol of
2.8mg/dL and an HDL cholesterol of 1.6 mg/dL (157). A separate study involving
different dosages of coconut oil ranging from 1ml/day, 2ml/day, and 4ml/day were
administered to three groups of five pregnant rats for 20 days, while the control group
was given tap water. Student’s t-test showed no significant difference in total cholesterol
and triglyceride concentrations between control and intervention groups (158).
Epidemiological Studies. One longitudinal study in the Philippines that started
back in 1983 has current records from 2005 that looked at 1,896 women between the ages
of 25-69. Of those 1,839 were not pregnant or on any lipid lowering medication. Coconut
oil was measured using two different 24 hour food recalls and was estimated to be about
9.54 grams/day in the 92% of women who used coconut oil in their cooking. Among the
low coconut oil intake group the mean HDL was 39.3mg/dL and the high coconut oil
39
intake group had a mean HDL of 42.4mg/dL. Total cholesterol to HDL cholesterol ratio
was 4.8mg/dL in the low coconut oil intake group compared to 4.8mg/dL in the high
coconut oil intake group (159). The Tokelau island migrant study followed Polynesian
immigrants in New Zealand that had migrated from Tokelau 7.1 years prior. Men who
had migrated to New Zealand in 1966 had higher concentrations of LDL cholesterol,
triglycerides, and lower concentrations of HDL cholesterol compared to the original
Tokelau men. The Tokelau population consumed around 53% kcal from a diet rich in
coconuts, while the immigrants in New Zealand decreased their intake in coconut
consumption and cholesterol concentrations increased. In 1977, 24-hour dietary food
recalls and blood samples were collected from randomly selected families, 808
participants in Tokelau and 1217 participants in New Zealand. Saturated fat energy
among Tokelau participants averaged to about 45% compared to 21% among New
Zealand participants. Total cholesterol average from male participants in Tokelau ages
15-84 was 182.1mg/dL and 198.5mg/dL for those in New Zealand. HDL cholesterol was
49.9mg/dL for Tokelau women and 47.6mg/dL for men, while New Zealand women had
an average HDL cholesterol of 48.8mg/dL and men had an average of 45.2mg/dL. LDL
cholesterol average in Tokelau men was 119.3mg/dL and 132.6mg/dL in New Zealand
men. The Tokelau dietary studies that took place between 1968 and 1976 found the mean
energy intake from three points of time was around 1770 kcal/day. Total fat energy
consumed was about 51% kcal, and of that about 46% kcal came from just saturated fat,
so about 415 kcal/day of saturated fat. Compared to Tokelau, where coconut, taro and
breadfruit are the staple foods consumed, New Zealand has replaced these with bread and
potatoes since they are cheaper (160).
40
Intervention Trials. Randomized controlled studies in humans have investigated
the effects of coconut oil (CO) on waist circumferences and plasma lipids. A study done
in Brazil tested the effects of CO supplements verses soybean oil supplements on a group
of 40 women, between the ages of 20-40, over a 12-week period. Subjects followed a
hypocaloric diet and were instructed to walk 50 minutes each day. Their exclusion
criteria included pregnant women, subjects with a BMI over 35 kg/m2, or women with
hypertension or chronic diseases. Baseline data showed the mean HDL of half the group
taking 30ml CO (14% kcal of CO from 1,893 kcal mean diet) to be 45.5 mg/dL and
increased to 48.7 mg/dL by the end of the 12 weeks. There was a 3.2 mg/dL change
within the CO group as well as a 9.7 mg/dL change between the soybean oil group
(soybean oil decreased HDL by -6.5mg/dL). The total cholesterol to HDL ratio went
from 4.23 to 4.06 (161). A separate study at Texas A&M University followed 19 free-
living men with an average age of 26 years for 5 weeks. Two meals were made for each
participant and containing 15% of protein, 50% of carbohydrates and 35% fat. The test
fats made up 60% of the total fat and their meals had a mean of 3,400 kcal/day (21% of
kcal or 714 kcal from CO each day). They tested beef fat, CO, and safflower oil. The
baseline HDL for CO was 45 mg/dL and this increased to 46 mg/dL by the end of the 5
weeks. HDL concentrations from beef fat and safflower oil dropped from 44 mg/dL(BF)
and 42 mg/dL(SO) to 40 mg/dL for both. HDL increased by +6mg/dL between these
groups. The total cholesterol to HDL ratio went from 3.51 to 3.73 (162). The third study
looked at the plasma lipids and lipoproteins among 41 Pacific Islanders in New Zealand
for a 6-week study. The age ranged from 19 to 72 and they provided 39g or 17.5% kcal
from butter, CO or safflower from a 8.4MJ/d diet (2,007kcal/day diet). The change in
41
HDL increased by 5.8 mg/dL between groups and 4.25mg/dL within the CO group (HDL
rose from 42.5 mg/dL to 46.8 mg/dL in CO group. The total cholesterol to HDL ratio
went from 5.01 at baseline to 4.52 (163). A recent study in 2015 by Cardoso et al.
examined the effects of a diet high in coconut oil on lipid profiles in patients between 45-
85 years of age on secondary prevention of coronary artery disease. Out of 136 eligible
patients 92 finished the study in the coconut oil group and 22 finished in the diet group.
The coconut oil group received 13mL each day for six months and serum HDL
concentrations had a positive change of +3.1 mg/dL while the diet group had a negative
change of -1.2 mg/dL in serum HDL. The P value was less than 0.01 for the HDL scores
and found statistically significant. There were no changes in total cholesterol, LDL
cholesterol and triglycerides (164). A separate randomized control study in 2015
measured blood lipid markers among men and women ages 18 to 50. Fourteen
participants had no dietary change while 21 replaced their normal cooking oils with
coconut oil for a span on four weeks. There was a negative change in HDL by -9.67
mg/dL in the control group and a positive change of +3.09 mg/dL in the virgin coconut
oil group. Total cholesterol had a positive increase of +0.77 mg/dL in the control group
and a negative drop of -0.77 mg/dL in the virgin coconut oil group, except these results
were found not significant based on a P value above 0.05 for total cholesterol and HDL
scores. (165).
Coconut oil being a saturated fat has been vilified and claimed to increase the risk
of atherosclerosis and heart disease, but it’s unique composition of fatty acids allows it to
be metabolized differently than other saturated fats. In fact, consuming coconut oil had a
positive effect on blood lipids in some human and animal randomized trials.
42
Chapter 3
METHODS
Subjects and Study Design. This 8-week study was a randomized placebo
controlled trial. Healthy adults, free from chronic disease, between the ages of 18 and 40
were recruited through Arizona State University (ASU) ListServs. Interested subjects
were referred to an online survey (www.surveymonkey.com) to determine eligibility
based on physical activity (Inactive: does not meet the U.S. guidelines, <150 minutes of
moderate exercise in a week), smoking habits (non smoking), self reported
anthropometric measurements (22-35 kg/m2 Body Mass Index, BMI), non pregnant or
lactating women and ability to meet at Arizona State University’s downtown campus on
3 separate occasions. The exclusion criteria is based on the use of prescription
medications that may interfere with blood lipids, corticosteroids, diabetes drugs, statins,
thyroid medications, non steroidal anti inflammatory drugs, and taking birth control less
than three months. Participants were recruited starting September 2015 after Arizona
State University Institutional Review Board (IRB) approval and qualified based on age
and BMI. Eligible subjects were contacted to schedule a screening visit (study visit 1).
All participants provided written consent (see Appendix-A).
At screening visit (study visit 1) eligible participants were asked to complete a
health history questionnaire, and validated physical activity questionnaire and HDL
measurements were collected via fingerpick. Baseline anthropometric measurements,
including weight, height, waist circumference, and percent body fat will were measured.
Height and weight were measured using a stadiometer and bioelectrical impedance scale,
(Tanita, Tanita corporation of America, Inc. Arlington Heights, Illinois).
43
Participants who qualified were stratified based on age, BMI, weight, and HDL
then randomly assigned to the treatment group (CO) or the control group (CON). An
online randomizer was used to group the subjects. Participants were then asked to record
their daily food intake on a food log 1 week before the start of the study to evaluate the
typical saturated fat and caloric intake.
During the baseline study or week 0 (study visit 2), supplements were distributed
using a double-blind procedure. Subjects received either a placebo capsule of all purpose
white flour or coconut oil capsule (Puritan’s Pride, coconut oil softgels, 2g each, see
Appendix-D). Subjects were instructed to ingest 2 capsules in the morning, preferably
with food. Participants were instructed not to adjust their diet or physical activity during
the 8 week trial. A validated mood questionnaire was collected during this visit, along
with a fasting blood sample, weight, BMI, percent body fat from the Tanita, and waist
measurements, as well as Dual-energy X-ray absorptiometry (DEXA) scans. A $10
Target gift card incentive was distributed to participants. Compliance calendars were
given to each participant to record through capsule intake on a calendar check-off system
as well as a dietary food log for a record of subject’s three day intake before their
scheduled last visit. Subjects were asked to write two check marks for two capsules taken
each day, and leave days blank when capsules were not taken. Biweekly email reminders
were sent to all subjects to keep up compliance to the study protocol.
On the last visit or week 8 (study visit 3) weight, percent body fat, BMI, waist
circumferences, validated mood questionnaire, physical activity questionnaire (metabolic
equivalent of task, MET), dietary food logs, compliance calendars, left over capsules and
44
fasting blood samples were collected during this visit and a $15 Target gift card incentive
was administered (see Appendex-B).
To determine sample size, a power analysis was calculated using a probability of
0.05 and a power of 0.8 as well as a verified sample size calculator. The average standard
deviation was 4.9 mg/dL from previous studies (161,162,163) testing dietary
supplementation on HDL, with an average expected change of 4.8 mg/dL, yielding a
calculated sample size of 36. Forty-two participants were enrolled in the study (see
Appendix-C).
Blood Measures. Fifteen milliliters of plasma blood samples were collected in
green top tubes (Li-Heparin) with Ethylenediaminetetraacetic acid (EDTA) as an
anticoagulant. Within 30 minutes of collection, samples were labeled, pipetted, and
centrifuged at 1000 x g for 15 minutes. The plasma was separated and stored at -80
degrees F until ready for analysis. HDL was tested in COBAS.
Statistical analysis plan. Statistical analyses were conducted using SPSS Version
23.0 software (SPSS, Inc., Chicago, IL, USA). Descriptive statistics were used to
describe baseline data and compare individuals in both treatment and control groups. An
independent T-test was conducted on each dependent variable to determine the mean
difference between the intervention and control groups. Data were examined for
normality using Shapiro-Wilk test and transformed if necessary. Participants were
considered compliant to the treatment plan if the value is > or equal to 75% for %
adherence. Data were reported as the means ± SD. P < 0.05 was considered statistically
significant results. A repeated measures analysis of variance (ANOVA) was used for
statistical analyses.

45
Chapter 4
RESULTS
Recruitment for this trial took place in October 2015 and the 8-week intervention
was completed in December 2015 at Arizona State University’s downtown Phoenix
campus. An online survey was administered through Listserv, flyers, and media posts.
Out of 154 respondents who completed the survey, 74 were excluded and the remainders
(n=80) were invited to the screening visit. Forty-two respondents came to the screening
visit and provided written consent. One participant revealed that she had started to smoke
cigarettes since completing the online survey and was thus excluded. Two additional
subjects withdrew because of scheduling conflicts with school or work or the morning
blood fasting collection time. The 39 subjects were stratified by age, gender, and BMI
and randomized to the experiment (CO) group (n=19) or the control (PL) group (n=20).
Of the 39 subjects who started data collection, 32 subjects finished the third visit and
final data collection 14 and 18 for CO ad PL respectively. The 7 participants who did not
complete the 8-week trial were lost to attrition. Seven men and 25 women completed the
study and were used for data analysis. There was an 89.8% adherence in the CO group
and an 87.9% adherence in the PL group throughout the 8 weeks. Subject adherence was
verified using a compliance calendar. Additionally 3-day food logs were collected at visit
2 and 3 to track dietary consumption throughout the 8-week trial.
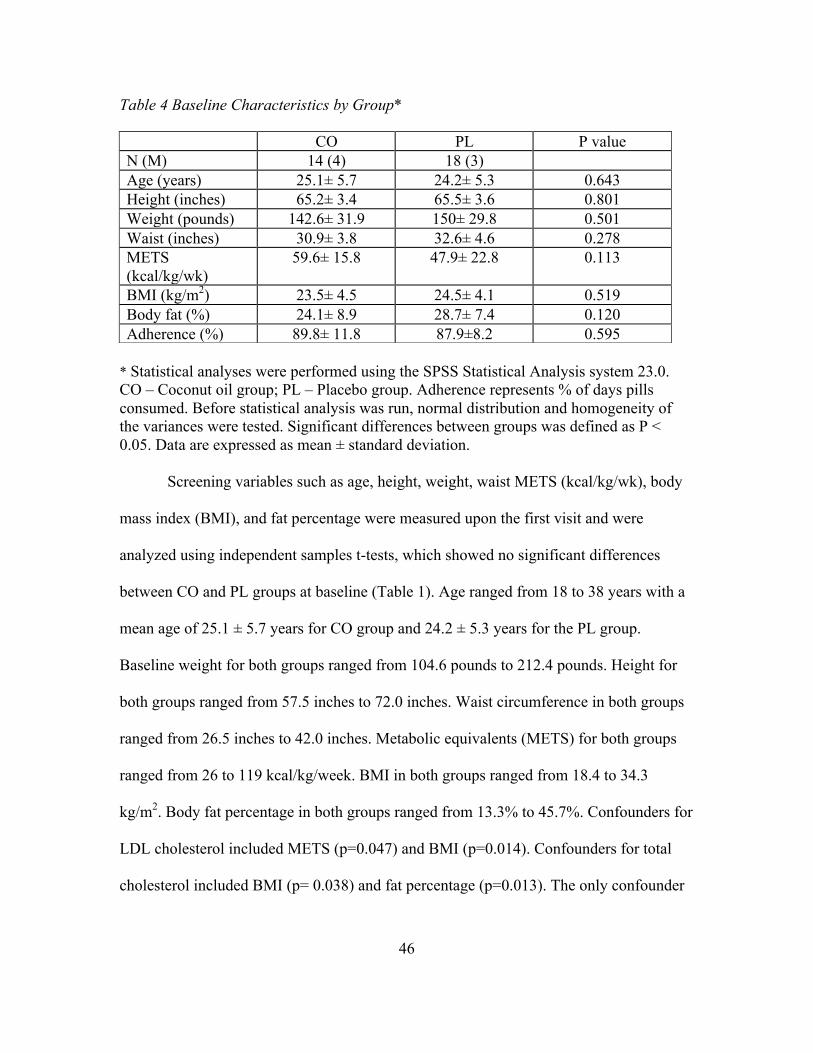
46
Table 4 Baseline Characteristics by Group*
* Statistical analyses were performed using the SPSS Statistical Analysis system 23.0. CO – Coconut oil group; PL – Placebo group. Adherence represents % of days pills consumed. Before statistical analysis was run, normal distribution and homogeneity of the variances were tested. Significant differences between groups was defined as P < 0.05. Data are expressed as mean ± standard deviation.
Screening variables such as age, height, weight, waist METS (kcal/kg/wk), body
mass index (BMI), and fat percentage were measured upon the first visit and were
analyzed using independent samples t-tests, which showed no significant differences
between CO and PL groups at baseline (Table 1). Age ranged from 18 to 38 years with a
mean age of 25.1 ± 5.7 years for CO group and 24.2 ± 5.3 years for the PL group.
Baseline weight for both groups ranged from 104.6 pounds to 212.4 pounds. Height for
both groups ranged from 57.5 inches to 72.0 inches. Waist circumference in both groups
ranged from 26.5 inches to 42.0 inches. Metabolic equivalents (METS) for both groups
ranged from 26 to 119 kcal/kg/week. BMI in both groups ranged from 18.4 to 34.3
kg/m2. Body fat percentage in both groups ranged from 13.3% to 45.7%. Confounders for
LDL cholesterol included METS (p=0.047) and BMI (p=0.014). Confounders for total
cholesterol included BMI (p= 0.038) and fat percentage (p=0.013). The only confounder
CO PL P value N (M) 14 (4) 18 (3) Age (years) 25.1± 5.7 24.2± 5.3 0.643 Height (inches) 65.2± 3.4 65.5± 3.6 0.801 Weight (pounds) 142.6± 31.9 150± 29.8 0.501 Waist (inches) 30.9± 3.8 32.6± 4.6 0.278 METS (kcal/kg/wk)
59.6± 15.8 47.9± 22.8 0.113
BMI (kg/m2) 23.5± 4.5 24.5± 4.1 0.519 Body fat (%) 24.1± 8.9 28.7± 7.4 0.120 Adherence (%) 89.8± 11.8 87.9±8.2 0.595
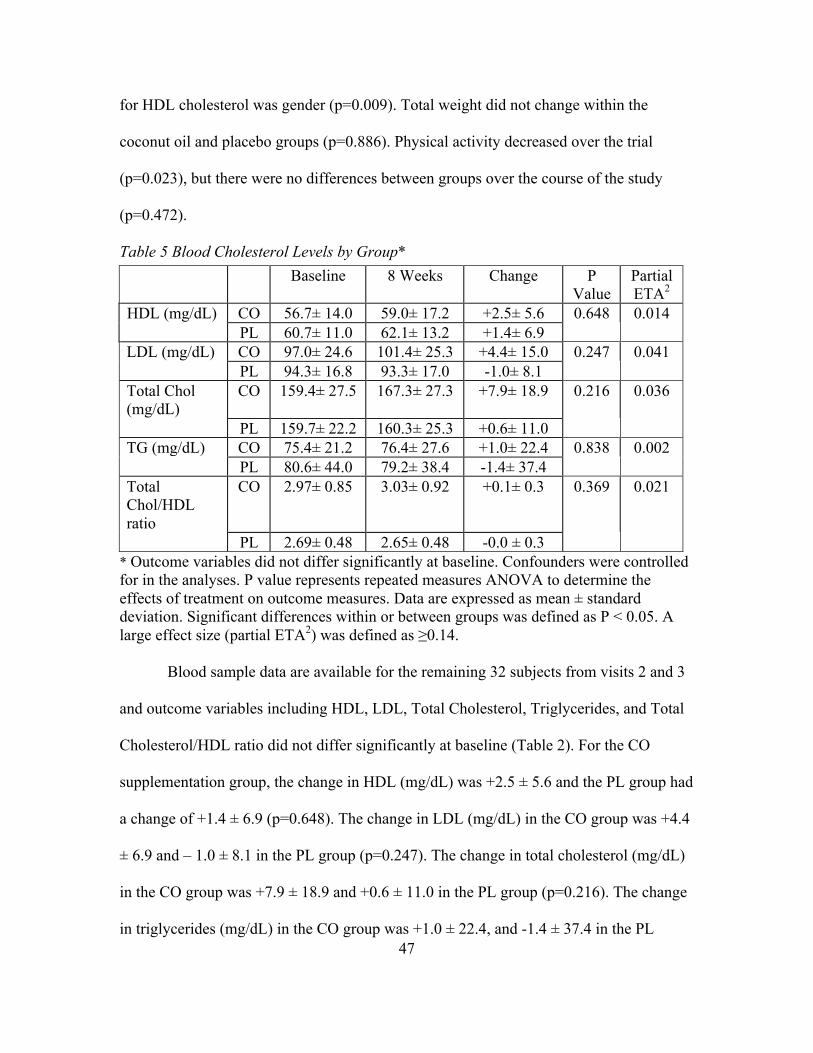
47
for HDL cholesterol was gender (p=0.009). Total weight did not change within the
coconut oil and placebo groups (p=0.886). Physical activity decreased over the trial
(p=0.023), but there were no differences between groups over the course of the study
(p=0.472).
Table 5 Blood Cholesterol Levels by Group*
* Outcome variables did not differ significantly at baseline. Confounders were controlled for in the analyses. P value represents repeated measures ANOVA to determine the effects of treatment on outcome measures. Data are expressed as mean ± standard deviation. Significant differences within or between groups was defined as P < 0.05. A large effect size (partial ETA2) was defined as ≥0.14.
Blood sample data are available for the remaining 32 subjects from visits 2 and 3
and outcome variables including HDL, LDL, Total Cholesterol, Triglycerides, and Total
Cholesterol/HDL ratio did not differ significantly at baseline (Table 2). For the CO
supplementation group, the change in HDL (mg/dL) was +2.5 ± 5.6 and the PL group had
a change of +1.4 ± 6.9 (p=0.648). The change in LDL (mg/dL) in the CO group was +4.4
± 6.9 and – 1.0 ± 8.1 in the PL group (p=0.247). The change in total cholesterol (mg/dL)
in the CO group was +7.9 ± 18.9 and +0.6 ± 11.0 in the PL group (p=0.216). The change
in triglycerides (mg/dL) in the CO group was +1.0 ± 22.4, and -1.4 ± 37.4 in the PL
Baseline 8 Weeks Change P Value
Partial ETA2
HDL (mg/dL) CO 56.7± 14.0 59.0± 17.2 +2.5± 5.6 0.648 0.014
PL 60.7± 11.0 62.1± 13.2 +1.4± 6.9
LDL (mg/dL) CO 97.0± 24.6 101.4± 25.3 +4.4± 15.0 0.247 0.041
PL 94.3± 16.8 93.3± 17.0 -1.0± 8.1
Total Chol (mg/dL)
CO 159.4± 27.5 167.3± 27.3 +7.9± 18.9 0.216 0.036
PL 159.7± 22.2 160.3± 25.3 +0.6± 11.0
TG (mg/dL) CO 75.4± 21.2 76.4± 27.6 +1.0± 22.4 0.838 0.002
PL 80.6± 44.0 79.2± 38.4 -1.4± 37.4
Total Chol/HDL ratio
CO 2.97± 0.85 3.03± 0.92 +0.1± 0.3 0.369 0.021
PL 2.69± 0.48 2.65± 0.48 -0.0 ± 0.3
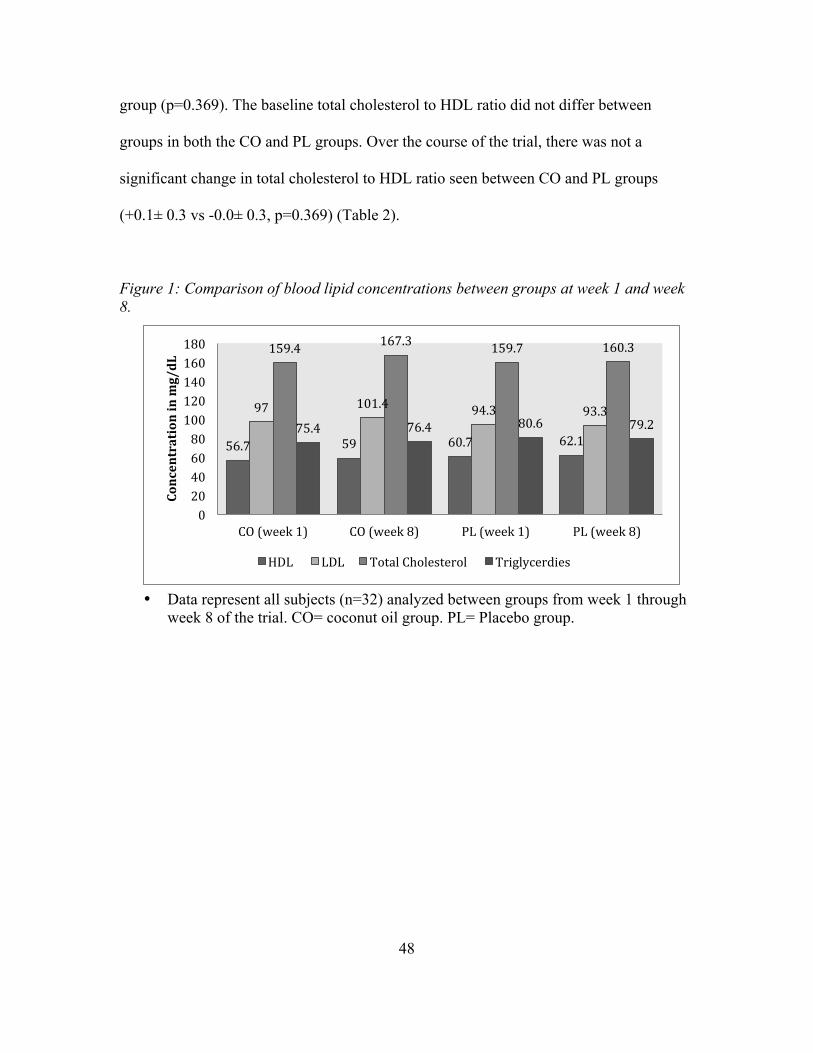
48
group (p=0.369). The baseline total cholesterol to HDL ratio did not differ between
groups in both the CO and PL groups. Over the course of the trial, there was not a
significant change in total cholesterol to HDL ratio seen between CO and PL groups
(+0.1± 0.3 vs -0.0± 0.3, p=0.369) (Table 2).
Figure 1: Comparison of blood lipid concentrations between groups at week 1 and week 8.
• Data represent all subjects (n=32) analyzed between groups from week 1 through week 8 of the trial. CO= coconut oil group. PL= Placebo group.
56.7 59 60.7 62.1
97 101.4 94.3 93.3
159.4 167.3 159.7 160.3
75.4 76.4 80.6 79.2
0 20 40 60 80 100 120 140 160 180
CO (week 1) CO (week 8) PL (week 1) PL (week 8)
Concentration in mg/dL
HDL LDL Total Cholesterol Triglycerdies
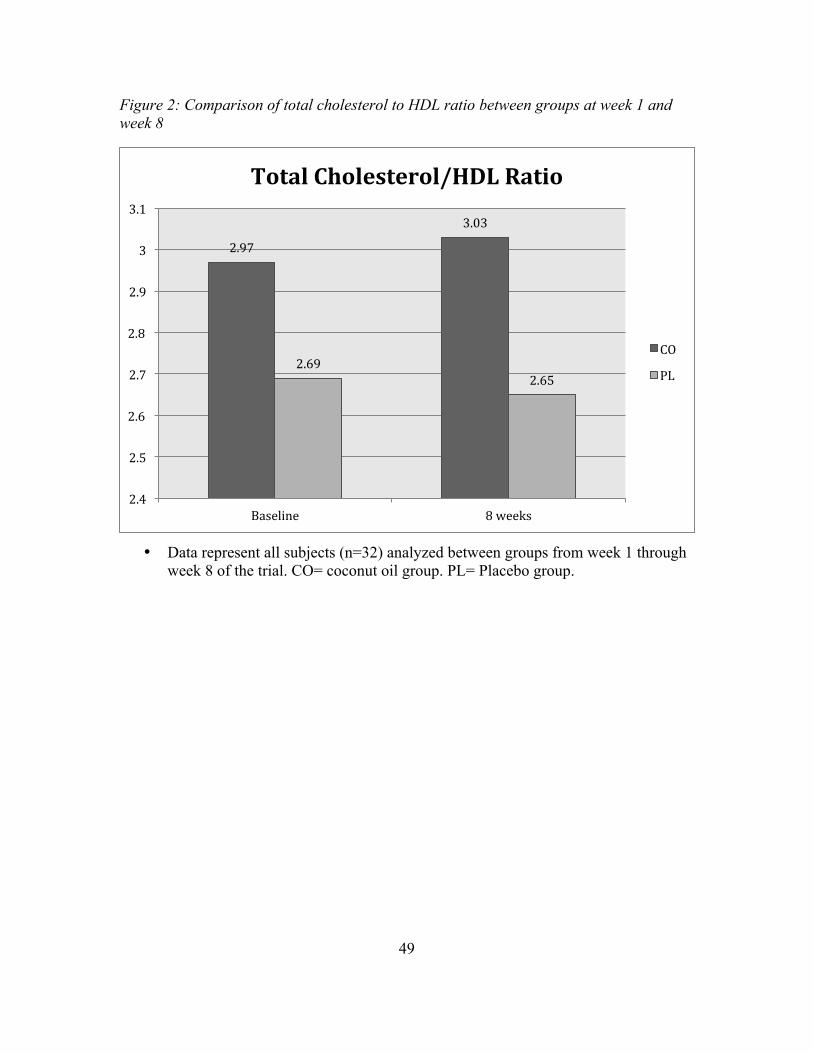
49
Figure 2: Comparison of total cholesterol to HDL ratio between groups at week 1 and week 8
• Data represent all subjects (n=32) analyzed between groups from week 1 through week 8 of the trial. CO= coconut oil group. PL= Placebo group.
2.97
3.03
2.69 2.65
2.4
2.5
2.6
2.7
2.8
2.9
3
3.1
Baseline 8 weeks
Total Cholesterol/HDL Ratio
CO
PL

50
Figure 3: Comparison of HDL cholesterol between groups at week 1 and week 8
• Data represent all subjects (n=32) analyzed between groups from week 1 through week 8 of the trial. CO= coconut oil group. PL= Placebo group.
56.7
59
60.7
62.1
54
55
56
57
58
59
60
61
62
63
Baseline 8 weeks
Concentration in mg/dL
HDL Cholesterol
CO
PL
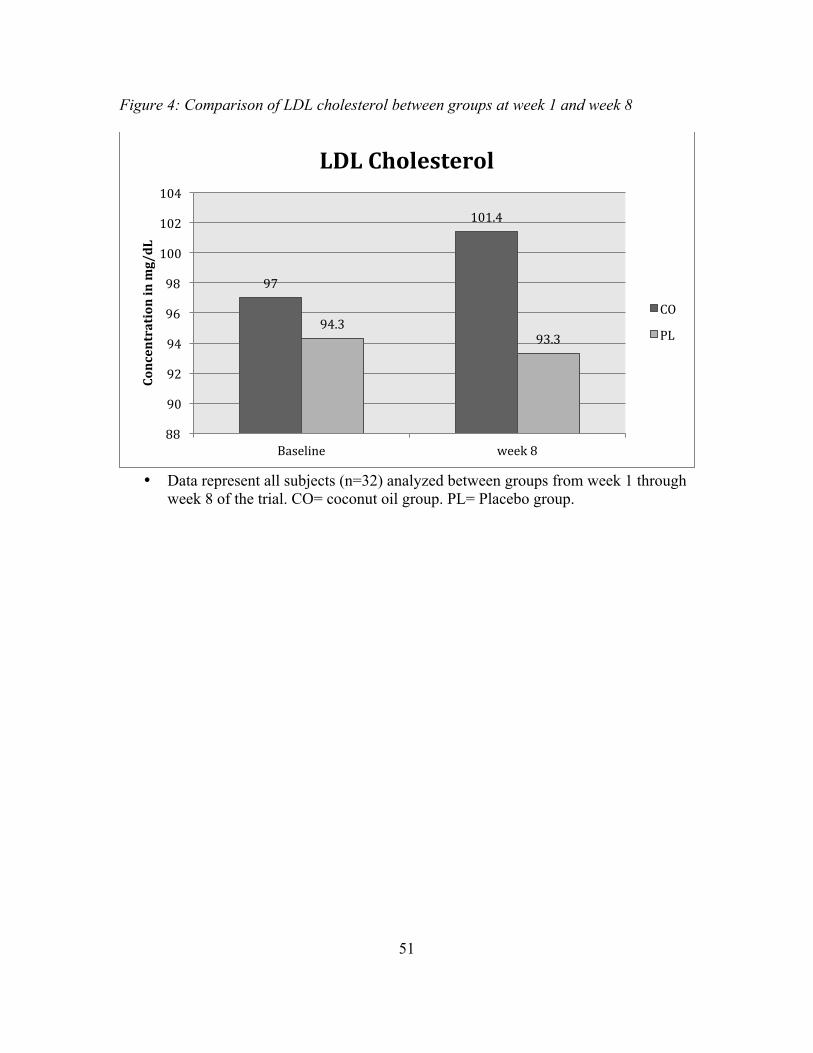
51
Figure 4: Comparison of LDL cholesterol between groups at week 1 and week 8
• Data represent all subjects (n=32) analyzed between groups from week 1 through
week 8 of the trial. CO= coconut oil group. PL= Placebo group.
97
101.4
94.3 93.3
88
90
92
94
96
98
100
102
104
Baseline week 8
Concentration in mg/dL
LDL Cholesterol
CO
PL
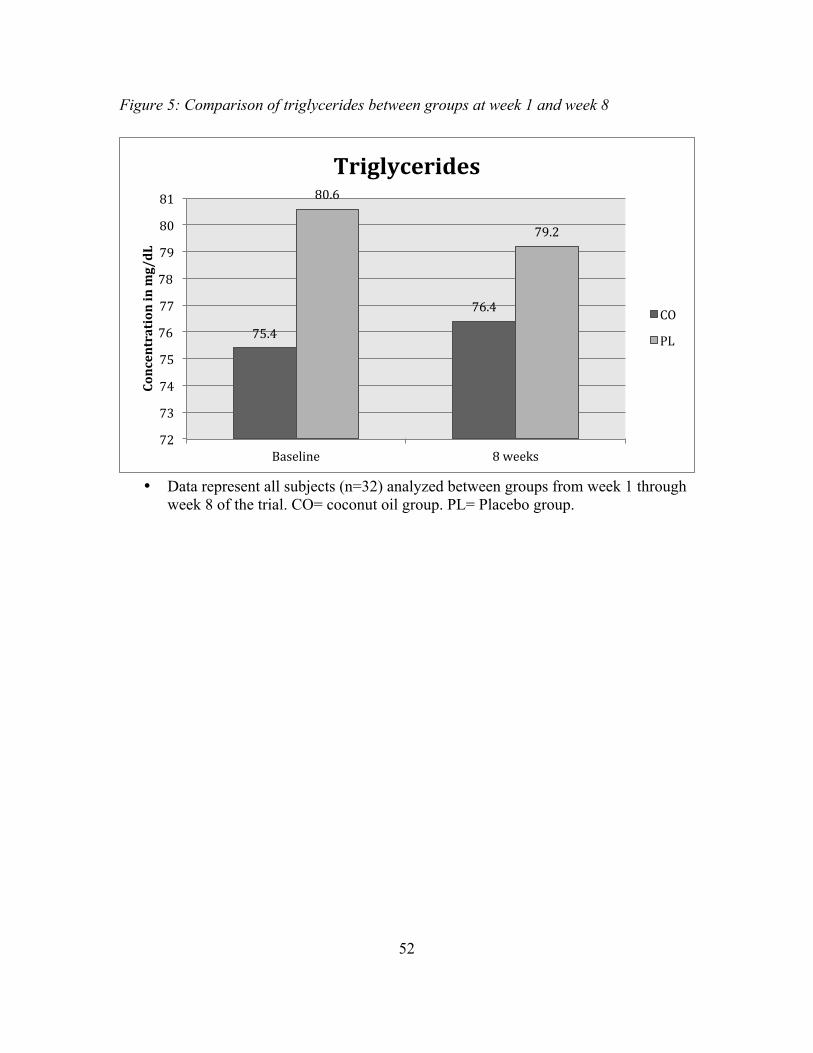
52
Figure 5: Comparison of triglycerides between groups at week 1 and week 8
• Data represent all subjects (n=32) analyzed between groups from week 1 through week 8 of the trial. CO= coconut oil group. PL= Placebo group.
75.4
76.4
80.6
79.2
72
73
74
75
76
77
78
79
80
81
Baseline 8 weeks
Concentration in mg/dL
Triglycerides
CO
PL
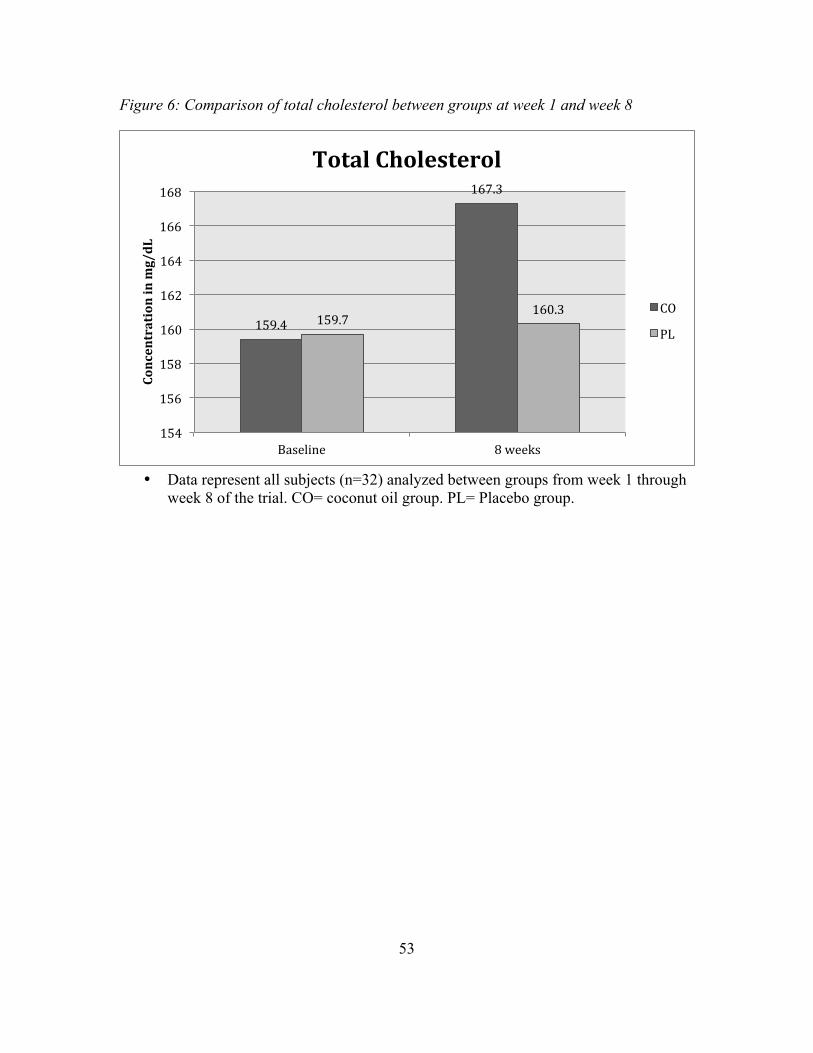
53
Figure 6: Comparison of total cholesterol between groups at week 1 and week 8
• Data represent all subjects (n=32) analyzed between groups from week 1 through week 8 of the trial. CO= coconut oil group. PL= Placebo group.
159.4
167.3
159.7 160.3
154
156
158
160
162
164
166
168
Baseline 8 weeks
Concentration in mg/dL
Total Cholesterol
CO
PL
54
Chapter 5
DISCUSSION
This randomized, double-blind, placebo-controlled 8 week trial represents a blood
lipid comparison between healthy individuals taking a 2 gram/day coconut oil
supplement versus a control group. The biomarkers examined included total cholesterol,
LDL cholesterol, HDL cholesterol, and triglycerides. Findings indicate there was no
significant change in the total cholesterol to HDL cholesterol ratio from consuming
coconut oil. Research testing the efficacy of coconut oil is limited, but this saturated fat
has been shown to positively influence blood lipid concentrations in some animal and
intervention trials, although this was not shown in this current study
(134,156,157,161,162,163,164).
The length of time of this study could be a limiting factor, since 8 weeks might be
considered a relatively short time for any significant changes to occur. Previous studies
that have been done in humans and animals observing the effects of coconut oil on lipid
parameters have been short time periods between 20 days to 12 weeks with the average
around 6 weeks and one single study lasting 6 months. The study by Cardoso et al.
showed statistically significant data for increased HDL concentrations after six months,
while the shorter study done in 4 weeks by Webb et al. showed no significant changes in
HDL or total cholesterol (164,165).
Another limiting factor are studies that used hydrogenated coconut oil versus
virgin coconut oil, which was found to have higher amounts of polyphenols and
antioxidants. Previous studies that have experimented with coconut oil and found it to
increase adverse blood lipid concentrations have been judged for using hydrogenated
55
coconut oil and the trans fatty acids associated (159). It is not clear from the intervention
trials mentioned in chapter 2 if the coconut oil used was in fact non-hydrogenated, but
this study used organic, non-hydrogenated coconut oil by the supplement brand Puritan’s
Pride. Puritan’s Pride coconut oil supplements are not USP-verified, 3rd party tested, or
evaluated by the Food and Drug Administration.
Dosage differences in each study could account for the conflicting data on the
effects of coconut oil on lipid concentrations. The coconut oil supplement in this trial was
2g/day, which was chosen based on the dosage used in previous research in an ASU
clinical trial using coconut oil as a placebo since a positive change in HDL cholesterol
was observed. Compared to previous studies, a 2g dosage is exceptionally small. The
study done on women in Brazil used 30ml of coconut oil a day, or 27.9g (1ml of coconut
oil is equal to .93g) (161). The New Zealand study had participants taking 39g a day
(163). The study from Texas A&M University had men take 79.3g of coconut oil a day,
or 714kcal from a 3,400kcal diet (162). The most recent study by Cardoso et al. had
subjects taking 13mL or 12.1g of coconut oil a day (164). Compared to these dosages it is
clear that 2g is way below the average intake in intervention trials, and this could be a
factor as to why there was no significant findings in the data. The Puritan’s Pride brand
of coconut oil supplementation recommends 2g/day, which is also another reason for
testing this dosage. The health effects from this 2g/day dosage would need to be further
investigated, because it had no significant change in blood lipid concentrations after an 8-
week period.
The gender differences should be considered since 7 men and 25 women
completed the study. Forty-four percent of women reported the use of birth control, and
56
while this shouldn’t impact results of the study (given the exclusion criteria included
women taking oral contraceptives less than three months) oral contraceptives have been
known to decrease HDL cholesterol in women. One clinical experiment had 26 women
start on oral contraceptives and compared HDL cholesterol before and after therapy.
After two months HDL decreased significantly from 56 ± 14.4 mg/dL to 52 ± 12.3 mg/dL
(166). This could limit the generalizability of the results to women not on birth control,
the elderly, and males.
Age could also be a factor, given the average age was 25 years for the coconut oil
group and 24 for the placebo group. Typically the cholesterol concentrations of this age
group are at optimal levels and this type of study may not have an effect. Data from a
study done at University of Minnesota found the average total cholesterol concentrations
of normal men between the ages of 17-25 years to be 176.7 mg/dL and 210.3 mg/dL at
ages 30-45 years (167). The average baseline total cholesterol in the coconut oil group is
159.4 mg/dL, which compared to the ATP III Guidelines, is desirable below 200 mg/dL.
The average baseline HDL cholesterol in the coconut oil group is 56.7 mg/dL, which falls
short of the American Heart Association recommendation >60 mg/dL (130,168). There is
room for improvement in the HDL concentrations, but the results show a non-significant
change of +2.5 mg/dLin HDL after 8 weeks.
Some strengths of this study include the screening and inclusion and exclusion
criteria designed to get a balanced sample of healthy subjects. The inclusion criteria
included non-smokers, free of chronic diseases, meets the U.S. weekly exercise
guidelines, BMI between 22-35, between the ages of 18-40, not taking medications
affecting blood lipids, non lactating or pregnant women, no food restrictions, and not
57
taking birth control less than three months. Investigator bias was also prevented using the
double blind method to randomize the subjects into groups. Blood draws on participants
were done during fasting, which helped prevent skewed data.
The hypothesis states that in free-living healthy adults, 2g/day of coconut oil will
decrease the total cholesterol to HDL ratio significantly compared to a placebo capsule
after an 8-week trial with no diet or physical activity modification; according to the data,
this hypothesis is not supported.
58
Chapter 6
CONCLUSION AND RECOMMENDATIONS
Conclusion. The results of this study did not demonstrate a significant change in
total cholesterol to HDL cholesterol concentrations in individuals taking 2g of coconut oil
a day for 8 weeks. Blood lipid parameters including total cholesterol, LDL cholesterol,
HDL cholesterol, and triglycerides were not significantly altered in either direction
among those in both the coconut oil and placebo groups. Coconut oil does not appear to
increase HDL cholesterol at a 2g/day dose. The effects of coconut oil on blood lipids and
CVD risk markers have been researched in previous studies, however more research is
needed to find the appropriate dosage needed to make a beneficial impact.
Recommendation. Future research in this area should consider a more diverse
sample of men and women, extending the length of time for the trial, and increasing the
dosage to see if blood lipid parameters are altered. By possibly increasing and
diversifying the sample group, this could be more generalizable to the public. The lack of
change observed in cholesterol levels could account for the small dosage used in this
study. More research is needed to assess the current recommended dosage from
supplement brands and find an optimal and effective dose. Increasing the dosage and
period of the trial could also achieve more significant results.
59
REFERENCES
1. Heidenreich, Paul A., et al. "Forecasting the future of cardiovascular disease in the United States a policy statement from the American heart association." Circulation 123.8 (2011): 933-944.
2. Trogdon, Justin G., et al. "The economic burden of chronic cardiovascular disease for major insurers." Health promotion practice 8.3 (2007): 234-242.
3. Lightwood, James, et al. "Forecasting the future economic burden of current
adolescent overweight: an estimate of the coronary heart disease policy model." American Journal of Public Health 99.12 (2009): 2230.
4. Whelton, Paul K., et al. "Primary prevention of hypertension: clinical and public
health advisory from The National High Blood Pressure Education Program." Jama 288.15 (2002): 1882-1888.
5. Berra, Kathy, and Linda Klieman. "National Cholesterol Education Program:
Adult Treatment Panel III—new recommendations for lifestyle and medical management of dyslipidemia." Journal of Cardiovascular Nursing 18.2 (2003): 85-92.
6. Catapano, Alberico L., et al. "ESC/EAS Guidelines for the management of
dyslipidaemias: the Task Force for the management of dyslipidaemias of the European Society of Cardiology (ESC) and the European Atherosclerosis Society (EAS)." Atherosclerosis 217 (2011): 1-44.
7. World Health Organization. Cardiovascular diseases (CVDs). Fact sheet N317.
January 2015.
8. NIH Medline Plus. Cholesterol levels: what you need to know. National Institutes of Health. Summer 2012;7(2):6-7.
9. Millán, Jesús, et al. "Lipoprotein ratios: Physiological significance and clinical
usefulness in cardiovascular prevention." Vascular Health and Risk Management 5 (2009): 757.
10. Pasternak, Richard C., et al. "Task Force 3. Spectrum of risk factors for coronary
heart disease." Journal of the American College of Cardiology 27.5 (1996): 978-990.
11. Manninen, Vesa, et al. "Joint effects of serum triglyceride and LDL cholesterol
and HDL cholesterol concentrations on coronary heart disease risk in the Helsinki Heart Study. Implications for treatment." Circulation 85.1 (1992): 37-45.

60
12. Linsel-Nitschke, Patrick, and Alan R. Tall. "HDL as a target in the treatment of atherosclerotic cardiovascular disease." Nature Reviews Drug Discovery 4.3 (2005): 193-205.
13. Halverstadt, Amy, et al. "Endurance exercise training raises high-density
lipoprotein cholesterol and lowers small low-density lipoprotein and very low-density lipoprotein independent of body fat phenotypes in older men and women." Metabolism 56.4 (2007): 444-450.
14. Thornton, John, Carol Symes, and Kenneth Heaton. "Moderate alcohol intake
reduces bile cholesterol saturation and raises HDL cholesterol." The Lancet 322.8354 (1983): 819-822.
15. Verdier, Céline, et al. "Targeting high-density lipoproteins: update on a promising
therapy." Archives of cardiovascular diseases 106.11 (2013): 601-611.
16. Hao, Wenrui, and Avner Friedman. "The LDL-HDL profile determines the risk of atherosclerosis: a mathematical model." PloS one 9.3 (2014): e90497.
17. Wan Ahmad, W. N. H., et al. "Low Serum High Density Lipoprotein Cholesterol
Concentration is an Independent Predictor for Enhanced Inflammation and Endothelial Activation." PloS one 10.1 (2015): e0116867.
18. Stoner, Lee, et al. "Inflammatory biomarkers for predicting cardiovascular
disease." Clinical biochemistry 46.15 (2013): 1353-1371.
19. Francis, Gordon A. "The complexity of HDL." Biochimica et Biophysica Acta (BBA)-Molecular and Cell Biology of Lipids 1801.12 (2010): 1286-1293.
20. The American Heart Association. (2015) What is Cardiovascular Disease?
American Heart Association, Inc.
21. The American Heart Association. (2014). Heat disease and stroke statistics 2015 update: a report from the American Heart Association. Circulation. Doi: 10.1161
22. Lawes, Carlene MM, Stephen Vander Hoorn, and Anthony Rodgers. "Global
burden of blood-pressure-related disease, 2001." The Lancet 371.9623 (2008): 1513-1518.
23. Pinto, Elisabete. "Blood pressure and ageing." Postgraduate medical journal
83.976 (2007): 109-114.
24. Prospective Studies Collaboration. "Age-specific relevance of usual blood pressure to vascular mortality: a meta-analysis of individual data for one million adults in 61 prospective studies." The Lancet 360.9349 (2002): 1903-1913.
61
25. American Heart Association. Heart and Artery Damage and High Blood Pressure.
September 2014.
26. Franklin, S. S. "Ageing and hypertension: the assessment of blood pressure indices in predicting coronary heart disease." Journal of hypertension. Supplement: official journal of the International Society of Hypertension 17.5 (1999): S29-36.
27. Ambrose, John A., and Rajat S. Barua. "The pathophysiology of cigarette
smoking and cardiovascular disease: an update." Journal of the American College of Cardiology 43.10 (2004): 1731-1737.
28. Neunteufl, Thomas, et al. "Contribution of nicotine to acute endothelial
dysfunction in long-term smokers." Journal of the American College of Cardiology 39.2 (2002): 251-256.
29. Yokode, Masayuki, et al. "Cholesteryl ester accumulation in macrophages
incubated with low density lipoprotein pretreated with cigarette smoke extract." Proceedings of the National Academy of Sciences 85.7 (1988): 2344-2348.
30. Craig, Wendy Y., Glenn E. Palomaki, and James E. Haddow. "Cigarette smoking
and serum lipid and lipoprotein concentrations: an analysis of published data." British Medical Journal 298.6676 (1989): 784-788.
31. Manson, JoAnn E., et al. "Walking compared with vigorous exercise for the
prevention of cardiovascular events in women." New England Journal of Medicine 347.10 (2002): 716-725.
32. Do Lee, Chong, Aaron R. Folsom, and Steven N. Blair. "Physical activity and
stroke risk a meta-analysis." Stroke 34.10 (2003): 2475-2481.
33. Mora, Samia, et al. "Ability of exercise testing to predict cardiovascular and all-cause death in asymptomatic women: a 20-year follow-up of the lipid research clinics prevalence study." Jama 290.12 (2003): 1600-1607.
34. Petrella, Robert John, et al. "Can adoption of regular exercise later in life prevent
metabolic risk for cardiovascular disease?." Diabetes care 28.3 (2005): 694-701.
35. Zhang, Ying, et al. "Prehypertension, diabetes, and cardiovascular disease risk in a population-based sample the Strong Heart Study." Hypertension 47.3 (2006): 410-414.
36. World Heart Federation. Diabetes. (2015) World Heart Federation.
62
37. American Diabetes Association. Differences Between Type 1 and Type 2 Diabetes. 2015. Diabetes.org.
38. Barrett-Connor, E. L. I. Z. A. B. E. T. H., and K. Khaw. "Family history of heart
attack as an independent predictor of death due to cardiovascular disease." Circulation 69.6 (1984): 1065-1069.
39. Hunt, Steven C., Roger R. Williams, and Gary K. Barlow. "A comparison of
positive family history definitions for defining risk of future disease." Journal of chronic diseases 39.10 (1986): 809-821.
40. National Stroke Association. Lifestyle Risk Factors. 2015. National Stroke
Association.
41. Bantle, John P., et al. "Nutrition recommendations and interventions for diabetes-2006: a position statement of the American Diabetes Association." Diabetes care 29.9 (2006): 2140.
42. Sesso, Howard D., et al. "Alcohol consumption and the risk of hypertension in
women and men." Hypertension 51.4 (2008): 1080-1087.
43. Linn, Shai, et al. "High-density lipoprotein cholesterol and alcohol consumption in US white and black adults: data from NHANES II." American Journal of Public Health 83.6 (1993): 811-816.
44. Zakhari, Sam. "Alcohol and the cardiovascular system: molecular mechanisms for
beneficial and harmful action." Alcohol health and research world 21.1 (1996): 21-29.
45. Centers for Disease Control and Prevention. LDL and HDL: “Bad” and “Good”
Cholesterol. March 2015. U.S. Department of Health and Human Services.
46. Saiedullah, M., et al. "Non-HDL Cholesterol versus LDL Cholesterol as a CVD risk factor in diabetic subjects." Journal of Bangladesh College of Physicians and Surgeons 31.4 (2014): 199-203.
47. Cui, Yadong, et al. "Non–high-density lipoprotein cholesterol level as a predictor
of cardiovascular disease mortality." Archives of Internal Medicine 161.11 (2001): 1413-1419.
48. Lu, Weiquan, et al. "Non-HDL cholesterol as a predictor of cardiovascular
disease in type 2 diabetes the strong heart study." Diabetes care 26.1 (2003): 16-23.
63
49. National Heart Lung and Blood Institute. "High blood cholesterol: What you need to know." Retrieved October 6 (2001): 2002.
50. Upadhyay, Ravi Kant. "Emerging risk biomarkers in cardiovascular diseases and
disorders." Journal of lipids 2015 (2015).
51. Tousoulis, Dimitris, and Christodoulos Stefanadis, eds. Biomarkers in Cardiovascular Diseases. CRC Press, 2013.
52. Cao, Jie J., et al. "Association of carotid artery intima-media thickness, plaques,
and C-reactive protein with future cardiovascular disease and all-cause mortality the cardiovascular health study." Circulation 116.1 (2007): 32-38.
53. Lindahl, Bertil, et al. "Markers of myocardial damage and inflammation in
relation to long-term mortality in unstable coronary artery disease." New England Journal of Medicine 343.16 (2000): 1139-1147.
54. Ridker, P. M., P. Libby, and J. Buring. "Risk markers and the primary prevention
of cardiovascular disease." Braunwald's Heart Disease: A Textbook of Cardiovascular Medicine. 10th ed. Philadelphia, PA: Elsevier Saunders (2014).
55. Vasan, Ramachandran S. "Biomarkers of cardiovascular disease molecular basis
and practical considerations." Circulation 113.19 (2006): 2335-2362.
56. The American Heart Association. (2015) “Understanding Blood Pressure Readings”. American Heart Association, Inc.
57. Pickering, Thomas G., et al. "Recommendations for blood pressure measurement
in humans and experimental animals part 1: blood pressure measurement in humans: a statement for professionals from the Subcommittee of Professional and Public Education of the American Heart Association Council on High Blood Pressure Research." Hypertension 45.1 (2005): 142-161.
58. World Health Organization. "Prevention of cardiovascular disease: pocket
guidelines for assessment and management of cardiovascular risk:(WH." (2007).
59. Sandmaier Marian. National Heart, Lung, and Blood Institute. Your Guide to Living Well With Heart Disease. November 2005. National Institutes of Health. USA.org.
60. Critchley, Julia A., and Simon Capewell. "Mortality risk reduction associated
with smoking cessation in patients with coronary heart disease: a systematic review." Jama 290.1 (2003): 86-97.
64
61. American College of Sports Medicine. "Physical activity and public health: a recommendation." Jama 273 (1995): 402-407.
62. Powell, Kenneth E., et al. "Physical activity and the incidence of coronary heart
disease." Annual review of public health 8.1 (1987): 253-287.
63. Corrao, Giovanni, et al. "Alcohol and coronary heart disease: a meta-analysis." Addiction 95.10 (2000): 1505-1523.
64. American Heart Association. Alcohol and Heart Health. January 2015. American
Heart Association.
65. Lavie, Carl J., Richard V. Milani, and Hector O. Ventura. "Obesity and cardiovascular disease: risk factor, paradox, and impact of weight loss." Journal of the American College of Cardiology 53.21 (2009): 1925-1932.
66. Poirier, Paul, et al. "Obesity and cardiovascular disease: pathophysiology,
evaluation, and effect of weight loss an update of the 1997 American Heart Association Scientific statement on obesity and heart disease from the obesity committee of the council on nutrition, physical activity, and metabolism." Circulation 113.6 (2006): 898-918.
67. American Heart Association. The American Heart Association’s Diet and
Lifestyle Recommendations. August 2015. American Heart Association.
68. American Heart Association. Managing Blood Pressure with a Heart-Healthy Diet. July 2015. American Heart Association.
69. National Heart Lung and Blood Institute. "Your guide to lowering your blood
pressure with DASH." NIH publication 06-4082 (2006).
70. Svetkey, Laura P., et al. "Effects of dietary patterns on blood pressure: subgroup analysis of the Dietary Approaches to Stop Hypertension (DASH) randomized clinical trial." Archives of internal medicine 159.3 (1999): 285-293.
71. Ornish Lifestyle Medicine. (2016) “Nutrition” ornish.com.
72. Ornish, Dean. "Statins and the soul of medicine." The American journal of
cardiology 89.11 (2002): 1286-1290.
73. Gould, K. Lance, et al. "Changes in myocardial perfusion abnormalities by positron emission tomography after long-term, intense risk factor modification." Jama 274.11 (1995): 894-901.
65
74. Craig, Winston J., and Ann Reed Mangels. "Position of the American Dietetic Association: vegetarian diets." Journal of the American Dietetic Association 109.7 (2009): 1266-1282.
75. Szeto, Y. T., Timothy CY Kwok, and Iris FF Benzie. "Effects of a long-term
vegetarian diet on biomarkers of antioxidant status and cardiovascular disease risk." Nutrition 20.10 (2004): 863-866.
76. Hu, Frank B. "Plant-based foods and prevention of cardiovascular disease: an
overview." The American journal of clinical nutrition 78.3 (2003): 544S-551S.
77. Kris-Etherton, Penny M., et al. "The effects of nuts on coronary heart disease risk." Nutrition Reviews 59.4 (2001): 103-111.
78. Appel, Lawrence J., et al. "Effects of protein, monounsaturated fat, and
carbohydrate intake on blood pressure and serum lipids: results of the OmniHeart randomized trial." Jama 294.19 (2005): 2455-2464.
79. Singh, Uma, Sridevi Devaraj, and Ishwarlal Jialal. "Coenzyme Q10
supplementation and heart failure." Nutrition Reviews 65.6 (2007): 286-293.
80. Velayutham, Pon, Anandh Babu, and Dongmin Liu. "Green tea catechins and cardiovascular health: an update." Current medicinal chemistry 15.18 (2008): 1840.
81. Yang, Yi-Ching, et al. "The protective effect of habitual tea consumption on
hypertension." Archives of internal medicine 164.14 (2004): 1534-1540.
82. Basu, Arpita, and Kavitha Penugonda. "Pomegranate juice: a heart-healthy fruit juice." Nutrition reviews 67.1 (2009): 49-56.
83. Corder, Roger, et al. "Health: Endothelin-1 synthesis reduced by red wine."
Nature 414.6866 (2001): 863-864.
84. Szmitko, Paul E., and Subodh Verma. "Red wine and your heart." Circulation 111.2 (2005): e10-e11.
85. Kris-Etherton, Penny M., et al. "Fish consumption, fish oil, omega-3 fatty acids,
and cardiovascular disease." circulation 106.21 (2002): 2747-2757.
86. GISSI-Prevenzione Investigators. "Dietary supplementation with n-3 polyunsaturated fatty acids and vitamin E after myocardial infarction: results of the GISSI-Prevenzione trial." The Lancet 354.9177 (1999): 447-455.
66
87. Paradox, Patience, and Teresa G. Odle. "Garlic." The Gale Encyclopedia of Alternative Medicine. Ed. Jacqueline L. Longe. 2nd ed. Vol. 2. Detroit: Gale, 2005. 809-812. Gale Virtual Reference Library. Web. 12 Aug. 2016.
88. Loy, Michelle H., and Richard S. Rivlin. "Garlic and cardiovascular disease."
Nutrition in Clinical Care 3.3 (2000): 145-152.
89. Mader, F. H. "Treatment of hyperlipidaemia with garlic-powder tablets. Evidence from the German Association of General Practitioners' multicentric placebo-controlled double-blind study." Arzneimittel-Forschung 40.10 (1990): 1111-1116.
90. FDA Center for Drug Evaluation and Research. Cholesterol from you. Fda.gov.
91. Gropper, Sareen, and Jack Smith. Advanced nutrition and human metabolism.
Cengage Learning, 2012.
92. Stein, Evan A., et al. "Efficacy and safety of simvastatin 80 mg/day in hypercholesterolemic patients." The American journal of cardiology 82.3 (1998): 311-316.
93. Sacks, Frank M., et al. "The effect of pravastatin on coronary events after
myocardial infarction in patients with average cholesterol levels." New England Journal of Medicine 335.14 (1996): 1001-1009.
94. US Food and Drug Administration. (2015) "FDA Expands Advice on Statin
Risks."
95. Staels, Bart, et al. "Mechanism of action of fibrates on lipid and lipoprotein metabolism." Circulation 98.19 (1998): 2088-2093.
96. Bradford, Reagan H., et al. "Double-blind comparison of bezafibrate versus
placebo in male volunteers with hyperlipoproteinemia." Atherosclerosis 92.1 (1992): 31-40.
97. Fazio, Sergio, and MacRae F. Linton. "The role of fibrates in managing
hyperlipidemia: mechanisms of action and clinical efficacy." Current atherosclerosis reports 6.2 (2004): 148-157.
98. Sgro, C., and A. Escousse. "[Side effects of fibrates (except liver and muscle)]."
Therapie 46.5 (1990): 351-354.
99. Meyers, C. Daniel, Vajinath S. Kamanna, and Moti L. Kashyap. "Niacin therapy in atherosclerosis." Current opinion in lipidology 15.6 (2004): 659-665.
67
100. Ganji, Shobha H., Vaijinath S. Kamanna, and Moti L. Kashyap. "Niacin and cholesterol: role in cardiovascular disease (review)." The Journal of nutritional biochemistry 14.6 (2003): 298-305.
101. Guyton, John R. "Niacin in cardiovascular prevention: mechanisms,
efficacy, and safety." Current opinion in lipidology 18.4 (2007): 415-420.
102. Canner, Paul L., et al. "Fifteen year mortality in Coronary Drug Project patients: long-term benefit with niacin." Journal of the American College of Cardiology 8.6 (1986): 1245-1255.
103. Morgan, J. M., et al. "Treatment effect of Niaspan, a controlled-release niacin, in patients with hypercholesterolemia: a placebo-controlled trial." Journal of cardiovascular pharmacology and therapeutics 1.3 (1996): 195-202.
104. Mills, Edward, et al. "The safety of over-the-counter niacin. A randomized
placebo-controlled trial [ISRCTN18054903]." BMC Pharmacology and Toxicology 3.1 (2003): 4.
105. Digby, Janet E., Neil Ruparelia, and Robin P. Choudhury. "Niacin in
cardiovascular disease: recent preclinical and clinical developments." Arteriosclerosis, thrombosis, and vascular biology 32.3 (2012): 582-588.
106. Tagawa, Hirotsune, et al. "Bile acid binding resin improves hepatic insulin
sensitivity by reducing cholesterol but not triglyceride levels in the liver." Diabetes research and clinical practice (2015).
107. Baggio, Laurie L., and Daniel J. Drucker. "Biology of incretins: GLP-1
and GIP." Gastroenterology 132.6 (2007): 2131-2157.
108. Glueck, Charles J., et al. "Safety and efficacy of long-term diet and diet plus bile acid-binding resin cholesterol-lowering therapy in 73 children heterozygous for familial hypercholesterolemia." Pediatrics 78.2 (1986): 338-348.
109. Hashim, Sami A., and Theodore B. Van Itallie. "Cholestyramine resin
therapy for hypercholesteremia: clinical and metabolic studies." JAMA 192.4 (1965): 289-293.
110. Ma, Hongbao. "Cholesterol and human health." Nature and Science
(2004): 17.
111. Mittal, Satish, SpringerLink (Online service), and MyiLibrary. Coronary Heart Disease in Clinical Practice. 1;1st; ed. London: Springer, 2005;2006;. Web.
68
112. Berg, Jeremy M., John L. Tymoczko, and Lubert Stryer. "Cholesterol Is Synthesized from Acetyl Coenzyme A in Three Stages." (2002).
113. National Heart, Lung and Blood Institute. What is Cholesterol? September
2012. National Institutes of Health. USA.gov.
114. Cox, R. A., and M. R. Garcia-Palmieri. "Cholesterol, triglycerides, and associated lipoproteins." (1990).
115. Werner, Anniek, Folkert Kuipers, and Henkjan J. Verkade. "Fat
absorption and lipid metabolism in cholestasis." Molecular Pathogenesis of Cholestasis (2004): 314-328.
116. Kirkpatrick, Nadine J. Nutrition and Health Info Sheet: Facts about Fat.
UCANR Publications.
117. Mittal, Satish. Coronary heart disease in clinical practice. Springer Science & Business Media, 2005.
118. The American Heart Association. (2011). “Triglycerides: Frequently
Asked Questions”. American Heart Association.
119. Rustan, Arild C., and Christian A. Drevon. "Fatty acids: structures and properties." eLS (2005).
120. De Souza, Russell J., et al. "Intake of saturated and trans unsaturated fatty
acids and risk of all cause mortality, cardiovascular disease, and type 2 diabetes: systematic review and meta-analysis of observational studies." (2015): h3978.
121. The American Heart Association. (2015) “Polyunsaturated Fats”.
American Heart Association, Inc.
122. Din, Jehangir N., David E. Newby, and Andrew D. Flapan. "Omega 3 fatty acids and cardiovascular disease--fishing for a natural treatment." Bmj 328.7430 (2004): 30-35.
123. Kris-Etherton, Penny M., et al. "Polyunsaturated fatty acids in the food
chain in the United States." The American journal of clinical nutrition 71.1 (2000): 179S-188S.
124. Goodnight, Scott H., et al. "Polyunsaturated fatty acids, hyperlipidemia,
and thrombosis." Arteriosclerosis, Thrombosis, and Vascular Biology 2.2 (1982): 87-113.
69
125. Mensink, Ronald P., and Martijn B. Katan. "Effect of dietary trans fatty acids on high-density and low-density lipoprotein cholesterol levels in healthy subjects." New England Journal of Medicine 323.7 (1990): 439-445.
126. Mozaffarian, D., A. Aro, and W. C. Willett. "Health effects of trans-fatty
acids: experimental and observational evidence." European journal of clinical nutrition 63 (2009): S5-S21.
127. L'Abbé, Mary R., et al. "Approaches to removing trans fats from the food
supply in industrialized and developing countries." European Journal of Clinical Nutrition 63 (2009): S50-S67.
128. Berg, Jeremy M., John L. Tymoczko, and Lubert Stryer. "The complex regulation of cholesterol biosynthesis takes place at several levels." (2002).
129. Oram, John F. "HDL apolipoproteins and ABCA1 partners in the removal
of excess cellular cholesterol." Arteriosclerosis, thrombosis, and vascular biology 23.5 (2003): 720-727.
130. The American Heart Assocation. (2014). “Numbers That Count For a
Healthy Heart”. American Heart Association, Inc.
131. DebMandal, Manisha, and Shyamapada Mandal. "Coconut (Cocos nucifera L.: Arecaceae): in health promotion and disease prevention." Asian Pacific Journal of Tropical Medicine 4.3 (2011): 241-247.
132. Aballero, Benjamin, Paul Finglas, and Fidel Toldrá. Encyclopedia of Food
and Health. Academic Press, 2015. Page 519.
133. Kappally, Shijna, Arun Shirwaikar, and Annie Shirwaikar. "COCONUT OIL–A REVIEW OF POTENTIAL APPLICATIONS." (2015).
134. Nevin, K. G., and T. Rajamohan. "Beneficial effects of virgin coconut oil
on lipid parameters and in vitro LDL oxidation." Clinical biochemistry 37.9 (2004): 830-835.
135. Lauric Acid., 2004. Web.
136. Marina, A. M., et al. "Chemical properties of virgin coconut oil." Journal
of the American Oil Chemists' Society 86.4 (2009): 301-307.
137. Pehowich, D. J., A. V. Gomes, and J. A. Barnes. "Fatty acid composition and possible health effects of coconut constituents." The West Indian medical journal 49.2 (2000): 128-133.
70
138. Dayrit, Fabian M. "The properties of Lauric acid and their significance in coconut oil." Journal of the American Oil Chemists' Society 92.1 (2015): 1-15.
139. Dayrit, Fabian M. "Lauric Acid is a Medium-Chain Fatty Acid, Coconut
Oil is a Medium-Chain Triglyceride." Philippine Journal of Science 143.2 (2014): 157-166.
140. Bragdon, J. H., and A. Karmen. "The fatty acid composition of
chylomicrons of chyle and serum following the ingestion of different oils." Journal of Lipid Research 1.2 (1960): 167-170.
141. GÖRANSSON, GÖRAN. "The metabolism of fatty acids in the rat VIII.
Lauric acid and myristic acid." Acta Physiologica Scandinavica 64.4 (1965): 383-386.
142. Keys, Ancel, Joseph T. Anderson, and Francisco Grande. "Serum
cholesterol response to changes in the diet: IV. Particular saturated fatty acids in the diet." Metabolism 14.7 (1965): 776-787.
143. Beermann, Christopher, et al. "Short Term Effects of Dietary Medium-
Chain Fatty Acids and n-3 Long-Chain Polyunsaturated Fatty Acids on the Fat Metabolism of Healthy Volunteers." Lipids in health and disease 2.1 (2003): 10-. Web.
144. Nevin, K. Govindan, and Thankappan Rajamohan. "Wet and dry
extraction of coconut oil: impact on lipid metabolic and antioxidant status in cholesterol coadministered rats." Canadian journal of physiology and pharmacology 87.8 (2009): 610-616.
145. Gutfinger, Tamar, and A. Letan. "Studies of unsaponifiables in several
vegetable oils." Lipids 9.9 (1974): 658-663.
146. Kelly, Gregory S. "Squalene and its potential clinical uses." Alternative medicine review: a journal of clinical therapeutic 4.1 (1999): 29-36.
147. Punchihewa, P. G., and R. N. Arancon. "Coconut: post-harvest
operations." Asian and Pacific Coconut Community (1999).
148. Carandang, Emil V. "Coconut Oil: Uses and Issues on its Health and Neutraceutical Benefits." CoconutOil. com. 2003< http://www. coconutoil. com/carandang. htm (2007).
149. Amarasiri, W. A. L. D., and A. S. Dissanayake. "Coconut fats." (2006).
71
150. Mendis, Shanthi, U. Samarajeewa, and R. O. Thattil. "Coconut fat and serum lipoproteins: effects of partial replacement with unsaturated fats." British Journal of Nutrition 85.05 (2001): 583-589.
151. Harding, Winsome R., et al. "Dietary surveys from the Tokelau Island
migrant study." Ecology of Food and Nutrition 19.2 (1986): 83-97.
152. Abeywardena, Mahinda Y. "Dietary fats, carbohydrates and vascular disease: Sri Lankan perspectives." Atherosclerosis 171.2 (2003): 157-161.
153. "Tropical Oils: Nutritional and Scientific Issues." Critical reviews in food
science and nutrition 31.1-2 (1992): 79-102. Web. 154. US Food and Drug Administration. (2015) "FDA Cuts Trans Fat in
Processed Foods." 155. Uauy, R., et al. "WHO Scientific Update on trans fatty acids: summary
and conclusions." European Journal of Clinical Nutrition 63 (2009): S68-S75.
156. Wang, Jianhong et al. “Effects of Dietary Coconut Oil as a Medium-Chain Fatty Acid Source on Performance, Carcass Composition and Serum Lipids in Male Broilers.” Asian-Australasian Journal of Animal Sciences 28.2 (2015): 223–230. PMC. Web. 28 Feb. 2016.
157. Feoli, Ana M., et al. "Serum and Liver Lipids in Rats and Chicks Fed with
Diets Containing Different Oils." Nutrition 19.9 (2003): 789-93. Web.
158. Nandakumaran, Moorkath, et al. "Influence of Coconut Oil Administration on some Hematologic and Metabolic Parameters in Pregnant Rats." Journal of Maternal-Fetal and Neonatal Medicine 24.10 (2011): 1254-8. Web.
159. Feranil, Alan B., et al. "Coconut oil predicts a beneficial lipid profile in
pre-menopausal women in the Philippines." Asia Pacific journal of clinical nutrition 20.2 (2011): 190.
160. Stanhope, John M., Vivienne M. Sampson, and Ian AM Prior. "The
Tokelau Island migrant study: serum lipid concentrations in two environments." Journal of chronic diseases 34.2 (1981): 45-55.
161. Assunçao, Monica L., et al. "Effects of dietary coconut oil on the
biochemical and anthropometric profiles of women presenting abdominal obesity." Lipids 44.7 (2009): 593-601.
162. Reiser, Raymond, et al. "Plasma lipid and lipoprotein response of humans
to beef fat, coconut oil and safflower oil." The American journal of clinical nutrition 42.2 (1985): 190-197.
72
163. Cox, C., et al. "Effects of dietary coconut oil, butter and safflower oil on
plasma lipids, lipoproteins and lathosterol levels." European journal of clinical nutrition 52.9 (1998): 650-654.
164. Cardoso, Diuli A., et al. "A coconut extra virgin oil-rich diet increases
HDL cholesterol and decreases waist circumference and body mass in coronary artery disease patients." Nutr Hosp 32.5 (2015): 2144-2152.
165. Webb, J., I. Alaunyte, and F. Amirabdollahian. "An investigation into the
effects of dietary supplementation of coconut oil on blood lipids and anthropometric measurements in healthy adults." Proceedings of the Nutrition Society 74.OCE5 (2015): E309.
166. Bierenbaum, Marvin L., et al. "Increased platelet aggregation and decreased high-density lipoprotein cholesterol in women on oral contraceptives." American journal of obstetrics and gynecology 134.6 (1979): 638-641.
167. Keys, Ancel, et al. "The concentration of cholesterol in the blood serum of
normal man and its relation to age." Journal of Clinical Investigation 29.10 (1950): 1347.
168. National Institutes of Health, and National Heart, Lung, and Blood
Institute. "ATP III guidelines at-a-glance quick desk reference." NIH publication 01-3305 (2001).

73
APPENDIX A
INSTITUTIONAL REVIEW BOARD APPROVAL

74
APPROVAL: EXPEDITED REVIEW
Carol Johnston SNHP: Nutrition 602/827-2265 [email protected]
Dear Carol Johnston:
On 9/10/2015 the ASU IRB reviewed the following protocol:
Type of Review: Initial Study Title: Dietary Supplementation and Health
Investigator: Carol Johnston IRB ID: STUDY00003159
Category of review: (9) Convened IRB determined minimal risk Funding: Name: Graduate College
Grant Title: Grant ID:
Documents Reviewed: • adherence calendar, Category: Other (to reflect anything not captured above); • consent, Category: Consent Form; • protocol, Category: IRB Protocol; • mood measure, Category: Measures (Survey questions/Interview questions /interview guides/focus group questions); • online survey, Category: Recruitment Materials; • physical activity measure, Category: Measures (Survey questions/Interview questions /interview guides/focus group questions); • health history, Category: Screening forms; • flyer, Category: Recruitment Materials; • verbal script, Category: Recruitment Materials; • diet record, Category: Other (to reflect anything not captured above);
The IRB approved the protocol from 9/10/2015 to 9/9/2016 inclusive. Three weeks before 9/9/2016 you are to submit a completed Continuing Review application and required attachments to request continuing approval or closure.
75
If continuing review approval is not granted before the expiration date of 9/9/2016 approval of this protocol expires on that date. When consent is appropriate, you must use final, watermarked versions available under the “Documents” tab in ERA-IRB.
In conducting this protocol you are required to follow the requirements listed in the INVESTIGATOR MANUAL (HRP-103).
Sincerely,
IRB Administrator
cc: Rachel Shedden Claudia Thompson-Felty

76
APPENDIX B
STUDY DESIGN
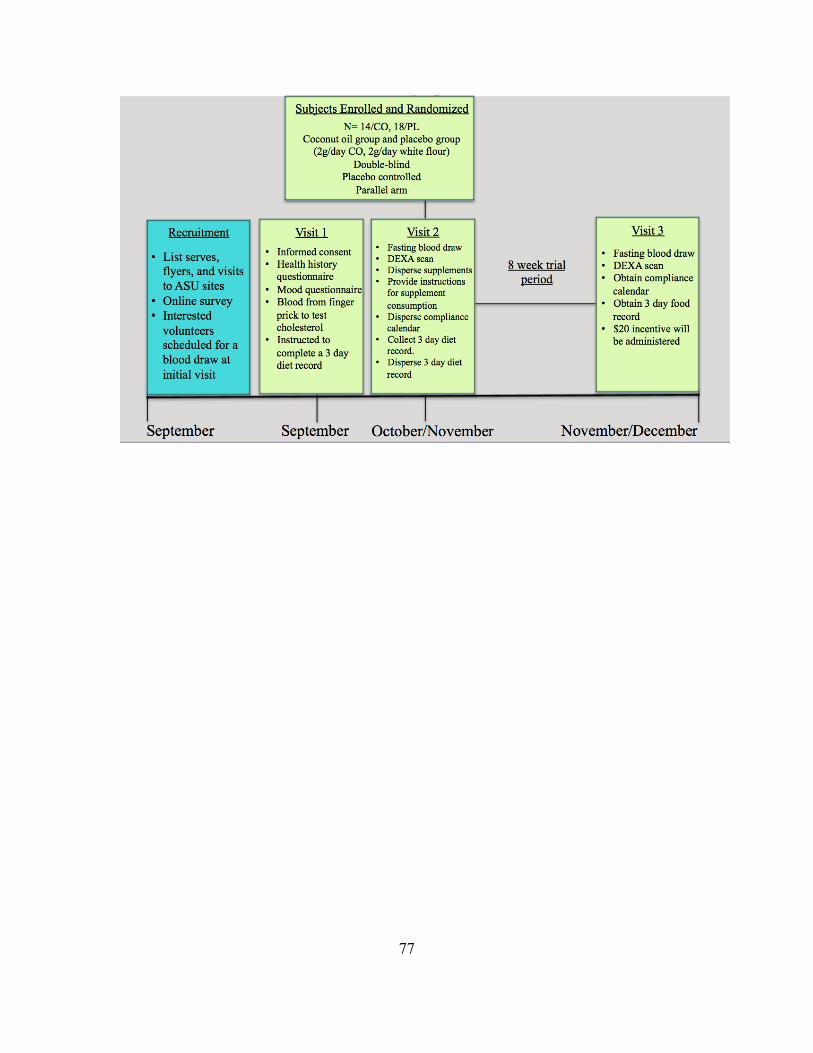
77

78
APPENDIX C
POWER ANALYSIS CALCULATION
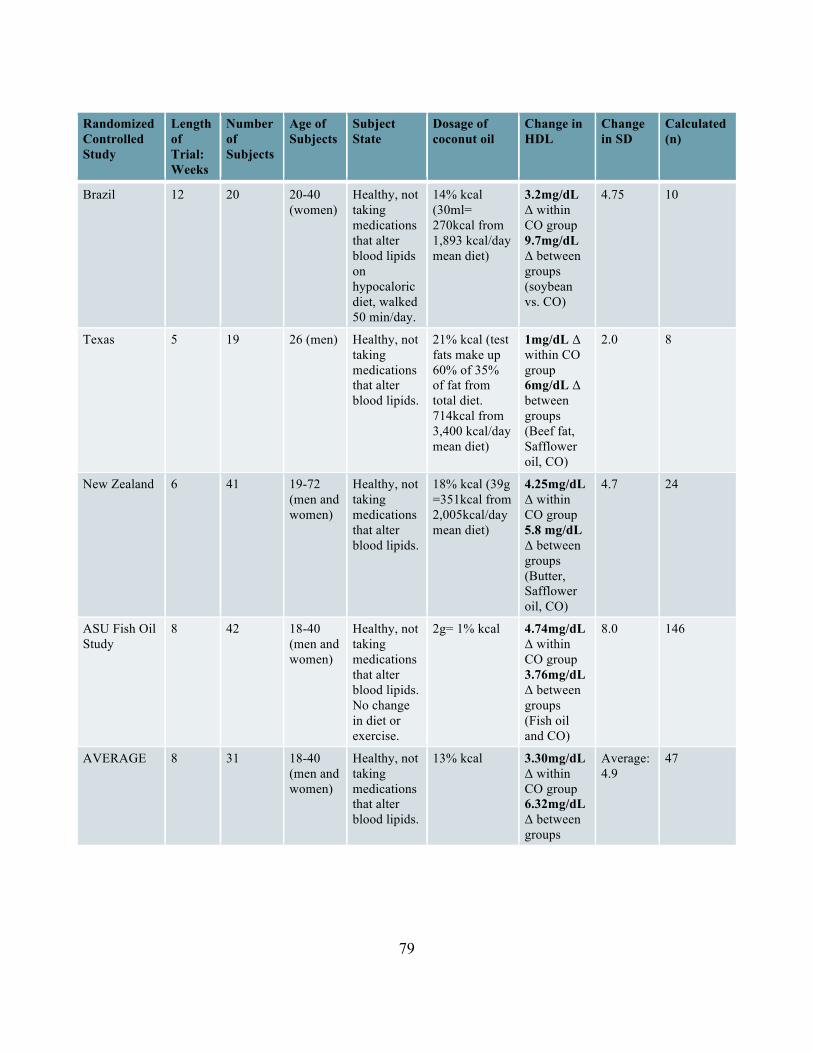
79
Randomized Controlled Study
Length of Trial: Weeks
Number of Subjects
Age of Subjects
Subject State
Dosage of coconut oil
Change in HDL
Change in SD
Calculated (n)
Brazil 12 20 20-40 (women)
Healthy, not taking medications that alter blood lipids on hypocaloric diet, walked 50 min/day.
14% kcal (30ml= 270kcal from 1,893 kcal/day mean diet)
3.2mg/dL Δ within CO group 9.7mg/dL Δ between groups (soybean vs. CO)
4.75 10
Texas 5 19 26 (men) Healthy, not taking medications that alter blood lipids.
21% kcal (test fats make up 60% of 35% of fat from total diet. 714kcal from 3,400 kcal/day mean diet)
1mg/dL Δ within CO group 6mg/dL Δ between groups (Beef fat, Safflower oil, CO)
2.0 8
New Zealand 6 41 19-72 (men and women)
Healthy, not taking medications that alter blood lipids.
18% kcal (39g =351kcal from 2,005kcal/day mean diet)
4.25mg/dL Δ within CO group 5.8 mg/dL Δ between groups (Butter, Safflower oil, CO)
4.7 24
ASU Fish Oil Study
8 42 18-40 (men and women)
Healthy, not taking medications that alter blood lipids. No change in diet or exercise.
2g= 1% kcal 4.74mg/dL Δ within CO group 3.76mg/dL Δ between groups (Fish oil and CO)
8.0 146
AVERAGE 8 31 18-40 (men and women)
Healthy, not taking medications that alter blood lipids.
13% kcal 3.30mg/dL Δ within CO group 6.32mg/dL Δ between groups
Average: 4.9
47

80
APPENDIX D
SUPPLEMENT LABEL
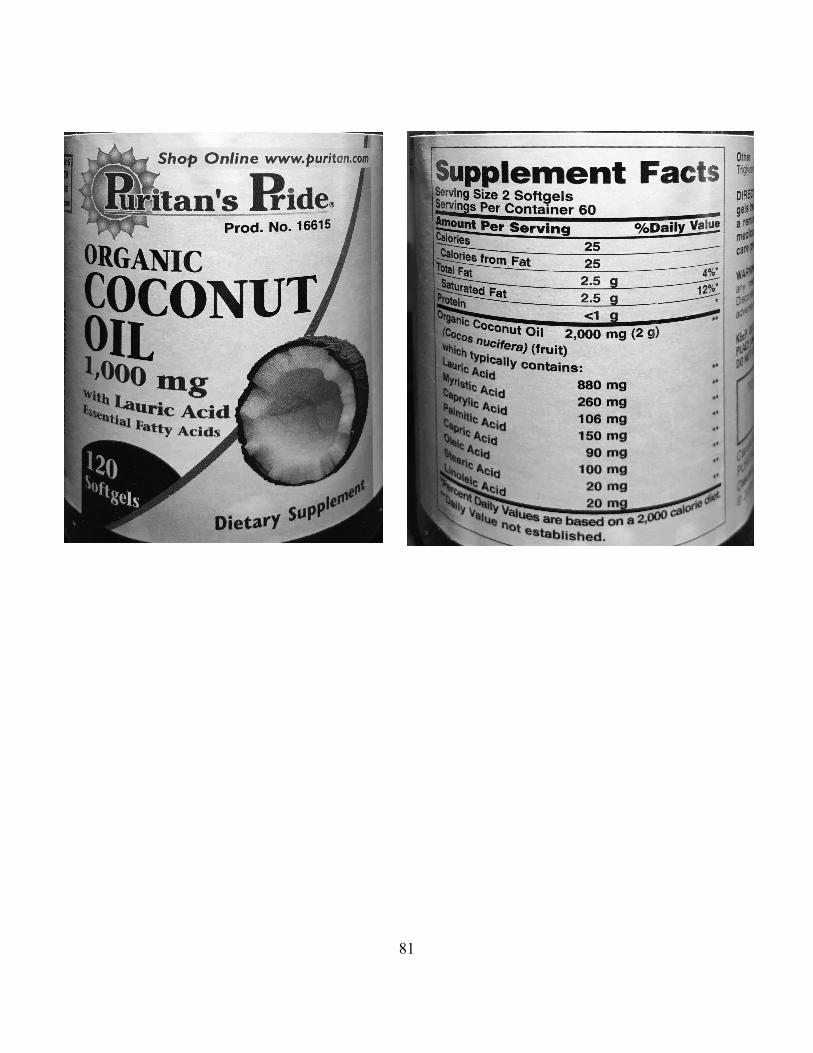
81

82
APPENDIX E
CONSORT DIAGRAM
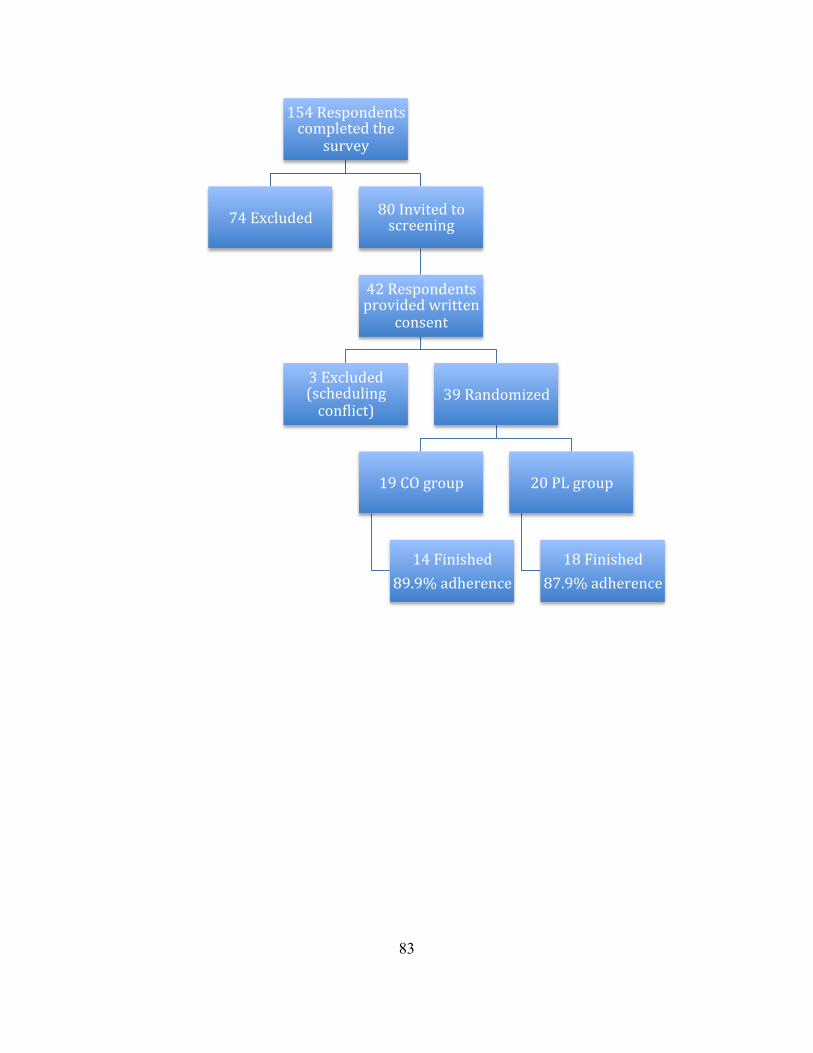
83
154 Respondents completed the
survey
74 Excluded 80 Invited to screening
42 Respondents provided written
consent
3 Excluded (scheduling conOlict)
39 Randomized
19 CO group
14 Finished 89.9% adherence
20 PL group
18 Finished 87.9% adherence

84
APPENDIX F
MEDICAL HISTORY QUESTIONNAIRE

85
HEALTH /HISTORY QUESTIONNAIRE ID#___________________
1. (To be completed by researchers): Height _________ Weight ________________
Percent body fat_____ BMI____________________
2. Gender: M F
3. Age: __________ 4. Have you lost or gained more than 5 lbs in the last 12 months? Yes No
If yes, how much lost or gained? _________ How long ago? ___________
5. Education (please circle) HS diploma Fresh. Soph. Jr. Sr. Grad. 6. Ethnicity: (please circle) Native American African-American Caucasian
Hispanic Asian Other
7. Do you smoke? No, never ________
Yes ________ # Cigarettes per day = ________
I used to, but I quit _______ months/years (circle) ago 7. Do you take any medications regularly? Yes No If yes, list type and frequency: Medication Dosage Start date and frequency of use ______________________________________________________________________________________________________________________________________________________________________________________________________________________________________________________________________________________________________ _____________________________________________________________________________________________________________________________________________________________________________________________________________________________________________________________________________________________________ 8. Do you currently take supplements (vitamins, minerals, herbs, etc.) ? Yes No If yes, list type and frequency: Supplement Dosage Start date and frequency of use ______________________________________________________________________________________________________________________________________________________________________________________________________________________________________________________________________________________________________
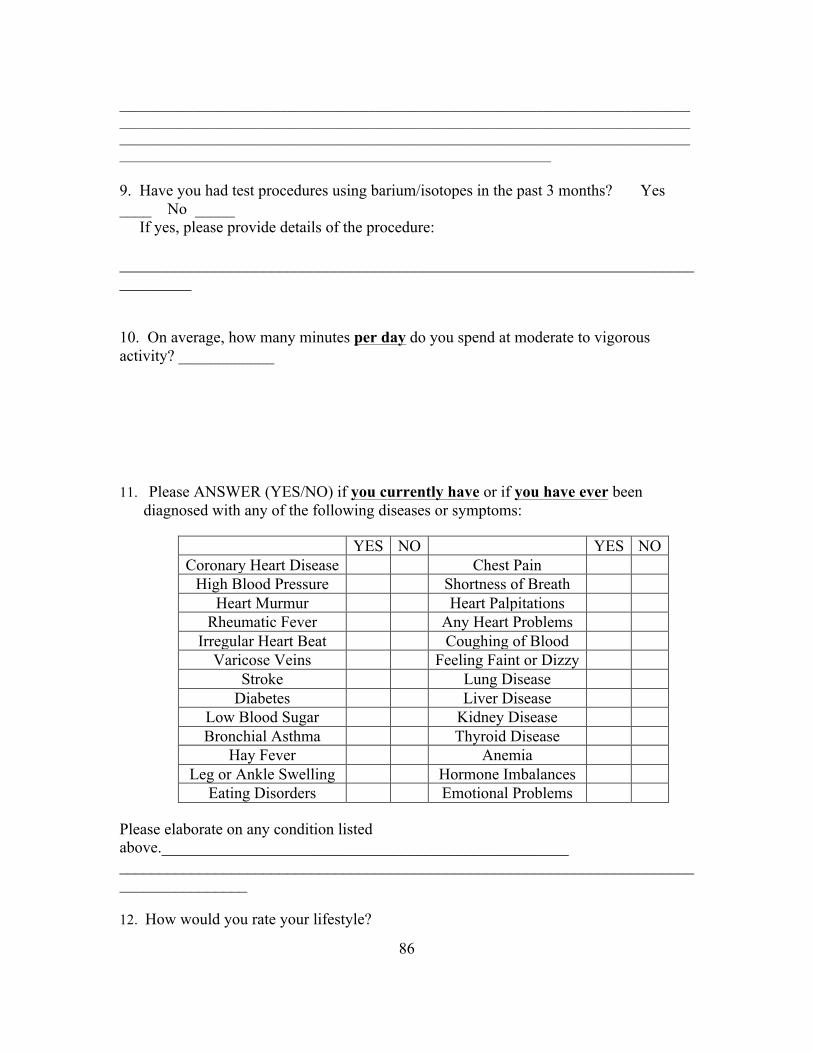
86
_____________________________________________________________________________________________________________________________________________________________________________________________________________________________________________________________________________________________________ 9. Have you had test procedures using barium/isotopes in the past 3 months? Yes ____ No _____ If yes, please provide details of the procedure: _________________________________________________________________________________ 10. On average, how many minutes per day do you spend at moderate to vigorous activity? ____________ 11. Please ANSWER (YES/NO) if you currently have or if you have ever been
diagnosed with any of the following diseases or symptoms:
YES NO YES NO Coronary Heart Disease Chest Pain
High Blood Pressure Shortness of Breath Heart Murmur Heart Palpitations
Rheumatic Fever Any Heart Problems Irregular Heart Beat Coughing of Blood
Varicose Veins Feeling Faint or Dizzy Stroke Lung Disease
Diabetes Liver Disease Low Blood Sugar Kidney Disease Bronchial Asthma Thyroid Disease
Hay Fever Anemia Leg or Ankle Swelling Hormone Imbalances
Eating Disorders Emotional Problems Please elaborate on any condition listed above.___________________________________________________ ________________________________________________________________________________________ 12. How would you rate your lifestyle?

87
Not active ___________ Active ___________ Somewhat active __________ Very Active ___________
13. Please circle the number of times you did the following kinds of exercises for more than 15 minutes last week.
Mild exercise (minimal effort): Easy walking, golf, gardening, bowling, yoga, fishing, horseshoes, archery, etc.
Times per week: 0 1 2 3 4 5 6 7 8 9 10 11 12 13 14+ Moderate exercise (not exhausting): Fast walking, easy bicycling, tennis, easy swimming, badminton, dancing, volleyball, baseball, etc. Times per week: 0 1 2 3 4 5 6 7 8 9 10 11 12 13 14+ Strenuous exercise activities (heart beats rapidly): Running, jogging, hockey, football, soccer, squash, basketball, cross country skiing, judo, roller skating, vigorous swimming, vigorous long distance bicycling, etc. Times per week: 0 1 2 3 4 5 6 7 8 9 10 11 12 13 14+
14. How much alcohol do you drink? (average drinks per day) ___________ 15. Do you have any food allergies? Yes No If yes, explain:________________________________________ 16. Are there any foods that you will not consume? Yes No If yes, please list ______________________________ __________________________________________________________________________________________________ 17. Do you follow a special diet? (weight gain/loss, vegetarian, low-fat, etc.) Yes No If yes, explain: __________________________________________________________________________________

88
APPENDIX G
PROFILE OF MOOD STATES QUESTIONNAIRE
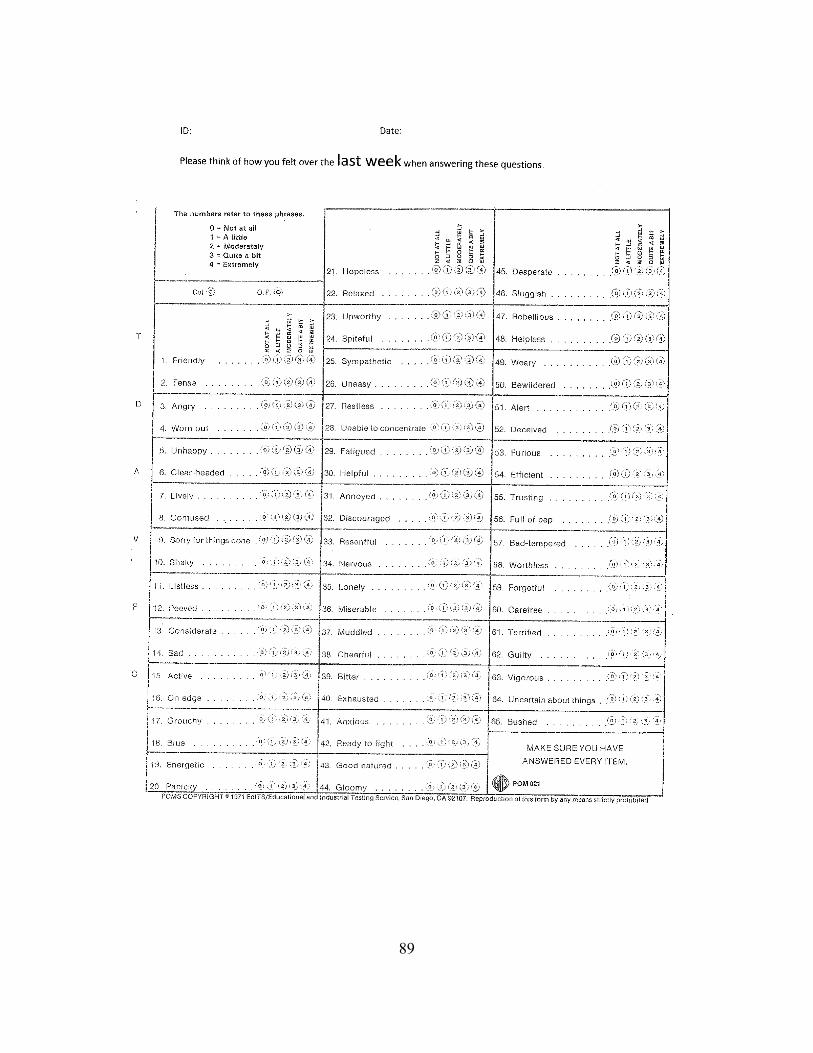
89

90
APPENDIX H
RECRUITMENT ONLINE SURVEY
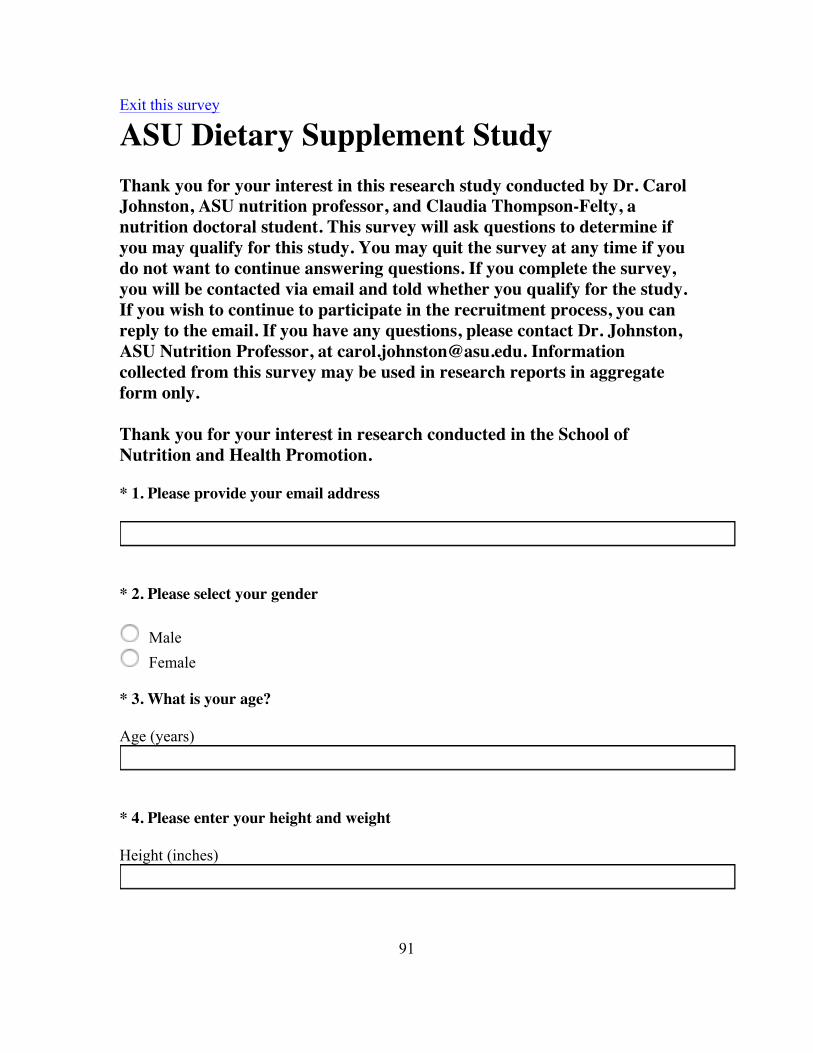
91
Exit this survey
ASU Dietary Supplement Study Thank you for your interest in this research study conducted by Dr. Carol Johnston, ASU nutrition professor, and Claudia Thompson-Felty, a nutrition doctoral student. This survey will ask questions to determine if you may qualify for this study. You may quit the survey at any time if you do not want to continue answering questions. If you complete the survey, you will be contacted via email and told whether you qualify for the study. If you wish to continue to participate in the recruitment process, you can reply to the email. If you have any questions, please contact Dr. Johnston, ASU Nutrition Professor, at [email protected]. Information collected from this survey may be used in research reports in aggregate form only. Thank you for your interest in research conducted in the School of Nutrition and Health Promotion.
* 1. Please provide your email address
* 2. Please select your gender
Male Female
* 3. What is your age?
Age (years)
* 4. Please enter your height and weight
Height (inches)
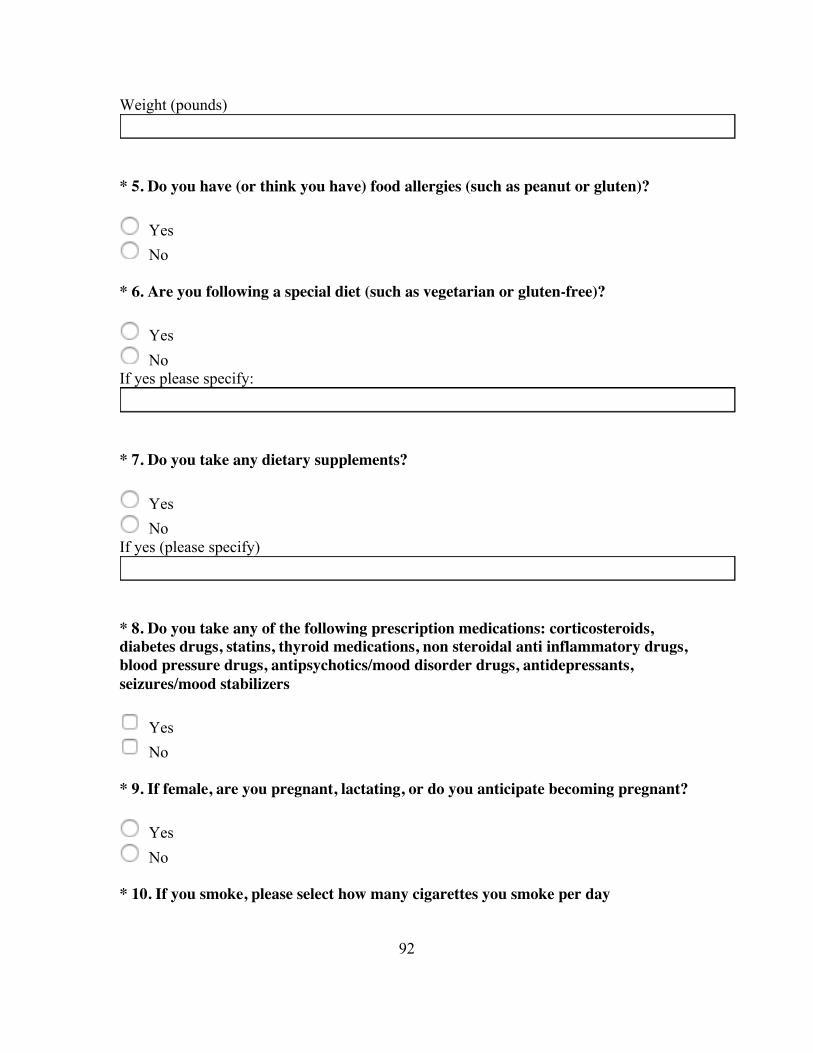
92
Weight (pounds)
* 5. Do you have (or think you have) food allergies (such as peanut or gluten)?
Yes No
* 6. Are you following a special diet (such as vegetarian or gluten-free)?
Yes No
If yes please specify:
* 7. Do you take any dietary supplements?
Yes No
If yes (please specify)
* 8. Do you take any of the following prescription medications: corticosteroids, diabetes drugs, statins, thyroid medications, non steroidal anti inflammatory drugs, blood pressure drugs, antipsychotics/mood disorder drugs, antidepressants, seizures/mood stabilizers
Yes No
* 9. If female, are you pregnant, lactating, or do you anticipate becoming pregnant?
Yes No
* 10. If you smoke, please select how many cigarettes you smoke per day

93
0 1-5 6-10 >10
* 11. How many minutes per week do you participate in moderate or highly intense exercise?
* 12. Will you be able to maintain your current diet and physical activity patterns for a consecutive 8 weeks?
Yes No
* 13. Are you willing and able to travel to the ASU Downtown Campus to meet with research investigators on three separate occasions?
Yes No
* 14. Are you willing to fast overnight and provide a morning blood sample on 2 occasions during this study?
Yes No
* 15. Are you willing to have two dexa scans (radiation level 1/10 that of a chest x-ray) to determine body fat composition?
Yes No
Done