Eetive Smmary Investment Strategy Overview
26
CHIEF INVESTMENT OFFICE Investment Strategy Overview Grinding Through the Wedge April 2021 We believe the “wedge” environment ultimately creates a market climate in which themes below the major indices, diversification, and factors such as dividend growth and “growth at a reasonable price” could become the most attractive characteristics of consistent returns. Christopher Hyzy Chief Investment Officer Merrill Lynch, Pierce, Fenner & Smith Incorporated (also referred to as “MLPF&S” or “Merrill”) makes available certain investment products sponsored, managed, distributed or provided by companies that are affiliates of Bank of America Corporation (“BofA Corp.”). MLPF&S is a registered broker-dealer, registered investment adviser, Member SIPC and a wholly owned subsidiary of BofA Corp. Investment products: Are Not FDIC Insured Are Not Bank Guaranteed May Lose Value Please see back page for important disclosure information. 3536197 4/2021 OVERVIEW ............................................................................................................................... 2 What’s the Chief Investment Office’s (CIO’s) general portfolio strategy as the markets “grind through the ‘wedge?’”........................................................................................................................................... 2 MACRO ENVIRONMENT........................................................................................................ 3 What is the CIO’s outlook for the global economy?.......................................................................................... 3 When does the CIO expect a return to full employment? ............................................................................. 6 What is the CIO’s outlook for the U.S. dollar over the balance of the year? ..................................... 7 Can the consumer be the next engine for growth? .......................................................................................... 7 Where do U.S.-China relations stand in early 2021, and what are the market implications?....... 8 EQUITIES .................................................................................................................................. 9 Are the ongoing rotations into economically sensitive areas sustainable?........................................ 9 How sustainable are the growth rates of disruptive technology companies? ............................... 10 With valuations seemingly high, can earnings and profit margins rise enough to support Equities? Also, what is the CIO’s outlook for cash deployment by U.S. companies?...... 11 What does the recent rise in interest rates mean for Equity returns going forward? ............. 12 Does the CIO position Equity portfolios for a rising inflation environment? ................................. 13 What is the CIO’s outlook for International Developed markets? .......................................................... 13 After 10 years of U.S. outperformance, how does the CIO see international fund managers positioning for potentially stronger outlooks for non-U.S. Equities?........................... 15 With the backup in U.S. yields, is the CIO still constructive on Emerging Market assets? What are some potential risks for Emerging Markets for the balance of the year? ................. 15 FIXED INCOME ...................................................................................................................... 16 What is the Federal Reserve’s perspective on the current environment, and how does that inform the CIO’s thinking on asset markets? .............................................................................. 16 What are the implications of the borrowing trends in Investment Grade and High Yield corporate bond markets? .................................................................................................................................. 18 What are the potential opportunities and risks in the bank loan market in a rising interest rate environment?............................................................................................................................................ 18 How does the American Rescue Plan Act of 2021 affect the municipal bond market? ................. 19 PORTFOLIO STRATEGIES .................................................................................................. 20 Could we be entering a new commodity “super cycle”? ............................................................................. 20 How has the global health crisis affected the landscape for sustainable investing? ................ 20 Is there a risk of “green-washing” as more funds claim a sustainable label? ................................ 21 Is caution warranted regarding the potential for higher taxes ahead? .............................................. 22 What taxes should investors be thinking about? ............................................................................................. 24
Transcript of Eetive Smmary Investment Strategy Overview
Investment Strategy Overview — Executive Summary
CHIEF INVESTMENT OFFICE
Investment Strategy Overview Grinding Through the Wedge April 2021
We believe the “wedge”
environment ultimately creates
a market climate in which
themes below the major
indices, diversification, and
factors such as dividend growth
and “growth at a reasonable
price” could become the most
attractive characteristics of
consistent returns.
Christopher Hyzy
Chief Investment Officer
Merrill Lynch, Pierce, Fenner & Smith Incorporated (also referred to as “MLPF&S” or “Merrill”) makes available certain investment products sponsored, managed, distributed or provided by companies that are affiliates of Bank of America Corporation (“BofA Corp.”). MLPF&S is a registered broker-dealer, registered investment adviser, Member SIPC and a wholly owned subsidiary of BofA Corp.
Investment products:
Are Not FDIC Insured Are Not Bank Guaranteed May Lose Value
Please see back page for important disclosure information.3536197 4/2021
OVERVIEW ............................................................................................................................... 2
What’s the Chief Investment Office’s (CIO’s) general portfolio strategy as the markets “grind through the ‘wedge?’” ...........................................................................................................................................2
MACRO ENVIRONMENT........................................................................................................ 3
What is the CIO’s outlook for the global economy? ..........................................................................................3When does the CIO expect a return to full employment? .............................................................................6What is the CIO’s outlook for the U.S. dollar over the balance of the year? .....................................7Can the consumer be the next engine for growth? ..........................................................................................7Where do U.S.-China relations stand in early 2021, and what are the market implications? .......8
EQUITIES .................................................................................................................................. 9
Are the ongoing rotations into economically sensitive areas sustainable? ........................................9How sustainable are the growth rates of disruptive technology companies? ...............................10With valuations seemingly high, can earnings and profit margins rise enough to support Equities? Also, what is the CIO’s outlook for cash deployment by U.S. companies? ...... 11What does the recent rise in interest rates mean for Equity returns going forward? .............12Does the CIO position Equity portfolios for a rising inflation environment? .................................13What is the CIO’s outlook for International Developed markets? ..........................................................13After 10 years of U.S. outperformance, how does the CIO see international fund managers positioning for potentially stronger outlooks for non-U.S. Equities? ...........................15With the backup in U.S. yields, is the CIO still constructive on Emerging Market assets? What are some potential risks for Emerging Markets for the balance of the year? .................15
FIXED INCOME ...................................................................................................................... 16
What is the Federal Reserve’s perspective on the current environment, and how does that inform the CIO’s thinking on asset markets? ..............................................................................16What are the implications of the borrowing trends in Investment Grade and High Yield corporate bond markets? ..................................................................................................................................18What are the potential opportunities and risks in the bank loan market in a rising interest rate environment? ............................................................................................................................................18How does the American Rescue Plan Act of 2021 affect the municipal bond market? ................. 19
PORTFOLIO STRATEGIES .................................................................................................. 20
Could we be entering a new commodity “super cycle”? .............................................................................20How has the global health crisis affected the landscape for sustainable investing? ................20Is there a risk of “green-washing” as more funds claim a sustainable label? ................................21Is caution warranted regarding the potential for higher taxes ahead? ..............................................22What taxes should investors be thinking about? .............................................................................................24

2 of 26 April 2021 – Investment Strategy Overview
Past performance is no guarantee of future results. RETURN TO TABLE OF CONTENTS
OVERVIEW
As we closed out the first quarter of 2021, there were defined characteristics that we feel drove the rotation across asset classes and an overall adjustment to investor expectations. The broader investment landscape includes a three-pronged “wedge” or “channel” in the markets. In the short term, we view the “wedge” as long-dated yields rising. We see the medium-term “wedge” as the normalized growth rate (growth after the sugar high) in the economy, and inflation as the long-term “wedge.”
A market “wedge,” in our view, is an episode that includes a sharp change to the macro economic outlook that tends to pressure capital market inputs and forces a rotation across and within asset classes. This rotation comes in rolling waves, creating a choppy investment environment with spurts of volatility, but the bull market uptrend remains intact.
In Equities, this rotation has been surrounding the removal of some of the significant exposure to mega Growth, particularly the highly valued, less profitable companies that were clear leaders through the pandemic, and the increase in positioning to the more cyclical, economically sensitive areas, reflationary assets and perceived inflation “hedges” (e.g., commodities). In addition, exposure has been increasing in the interest rate sensitive segments such as Financials, and components of the areas most harmed by the pandemic (e.g., travel, leisure, entertainment, dining and lodging). In our opinion, a “wedge” rotation with rolling waves like the current one may last longer than expected given the overexposure in mega Growth that has been built up over recent years combined with the significant underexposure to Value, economic, and weaker dollar beneficiaries—including non-U.S. investments. The Financial and Energy sectors are still some 29% and 86%, respectively, behind the S&P 500 performance of the last three years, with a sizable valuation discount to the market multiple.1
Moreover, we believe the “wedge” environment ultimately creates a market climate in which themes below the major indices, diversification, and factors such as dividend growth and “growth at a reasonable price” could become the most attractive characteristics of consistent returns.
Throughout the remainder of this year and perhaps the first few months of 2022, the capital markets will most likely continue to take their direction from all three “wedges,” but we expect the profit outlook and the stabilization in yields and inflation expectations to create another uptrend in the markets. We expect this potential second uptrend to obviously be much less sharp than the 75% V-shaped rebound off the lows from March 2020, but it should still be around low double-digit percentages, in our opinion. Long-term yields and inflation expectations stabilizing the core higher-quality growth areas dominated by the Technology sector mixed with a more foundational rerating upward in the cyclical and “epicenter” areas should ultimately underpin the second-leg advance. From our perspective the next pressure point in the markets comes later this year as concerns over higher taxes and adjustments to a tighter monetary policy gather momentum. This dynamic could set up a 2022 full market environment in which tax alpha is greater than investment alpha! We will cross that bridge when we get to it.
What’s the Chief Investment Office’s (CIO’s) general portfolio strategy as the markets “grind through the ‘wedge?’”
In the coming weeks, earnings season takes center stage and job growth is likely to be very robust. We expect some bumpiness as companies issue improved guidance and revisions are adjusted further upward, but also as institutional rebalancing begins between Equities and Fixed Income. In addition, some market agitation could develop if the potential for bouts of liquidation of individual equities that have sharply
1 Sector return data covers the period from December 29, 2017 through April 9, 2021.

3 of 26 April 2021 – Investment Strategy Overview
Past performance is no guarantee of future results. RETURN TO TABLE OF CONTENTS
underperformed rises in thin areas of the market. This could place some subtle pressure on the broader market, which we would use as an opportunity to rebalance portfolios and/or add to long-term Growth positions within Equities.
We continue to be overweight Equities relative to bonds. We prefer a diversified mix between Growth and Value with an overweight still to the U.S. overall. We also prefer to pick up our Value exposure via non-U.S. Equity exposure, including neutral-rated Emerging Markets (EMs), and from U.S. Small-caps. For those who are still underweight cyclical areas and interest rate sensitive parts of the Equity market, consider leveraging market weakness as a buying opportunity as well. Many consumers are flush with cash and have significant pent-up demand for experiences and services. Confidence continues to rise as coronavirus vaccine penetration climbs, and job growth is about to gather speed. As economic reopening picks up, we expect the travel, leisure and entertainment segment to grind higher. Combine this rerating with more positive operating leverage in corporate America overall (particularly Consumer Discretionary) plus the consistent above-average growth in Technology (now with a less frothy valuation), and we could experience a much higher profit outlook than the consensus believes for 2021. A higher profit number than expected for 2021 would represent a more attractive jumping off point for 2022, especially in the context of the effect that a potential increase in corporate taxes might have.
In Fixed Income we prefer shorter duration exposure with a focus on credit relative to government bonds—even though we expect municipal bonds to benefit significantly from the latest fiscal rescue plan. In terms of an overall strategy, a barbell approach in bonds is preferred. Fixed Income exposure, in general, should help balance out episodes of Equity volatility but could struggle to provide an attractive level of income and/or total return until 10-year Treasury yields approach 2.5% (a level that yields reached just prior to the Federal Reserve’s (Fed’s) initial pivot away from tightening in January of 2019), in our view.
Reflationary assets are likely to help diversify portfolios with inflation expectations on the rise, excessive monetary accommodation, a steeper yield curve, wider deficits, some bouts of pressure on the U.S. dollar and stronger economic growth than expected. These all provide tailwinds to reflationary assets (e.g., commodities, real estate—including farm land and timber and interest rate sensitives). However, given their limited supply of investable assets and their potential for a higher level of illiquidity, reflationary assets could be more volatile than expected in the next 12 to 18 months.
The second leg uptrend through the “wedge” is beginning, in our view, but we expect this to be a grind with rolling waves of rotation.
MACRO ENVIRONMENT
What is the CIO’s outlook for the global economy?
The global economy is on course for its strongest growth in decades, as pandemic concerns recede with widespread vaccinations around the world. Progress, of course, is uneven. The U.S. is leading the charge and is expected to be the fastest-growing major economy in 2021 thanks to unprecedented fiscal and monetary stimulus as well as a highly successful vaccination program. On the other hand, the latest setbacks are most pronounced in Europe, where the shutdown approach and trouble rolling out vaccinations are crimping otherwise positive prospects. Global vaccination data as of late March show the U.K. and U.S. vaccination rates about three times higher than those in major European economies and Canada, where squabbles over vaccine procurement and distribution problems have delayed progress in fighting the pandemic. Even in the U.S., there are widespread differences in reopening progress despite relatively similar health

4 of 26 April 2021 – Investment Strategy Overview
Past performance is no guarantee of future results. RETURN TO TABLE OF CONTENTS
statistics. States like Florida, which have followed a “protect the vulnerable, but stay open,” approach have returned to normal much faster than those like New York, which have followed a shutdown approach more similar to Europe. The bottom line, however, is overall progress is likely to continue steadily and growth is poised to accelerate sharply as a result.
The goods sector is already in record territory, with record-high global exports and industrial production, according to Cornerstone Macro research. February weather disruptions in the U.S. and March shutdowns in Europe along with the temporary obstruction of the Suez Canal curbed first-quarter U.S. and global growth. Another wave of stimulus checks in the U.S. has, however, set up a double-digit growth outlook for the spring as consumers flock to spend their latest bounty. Furthermore, the Biden administration has already moved on to the next massive stimulus involving a $3 trillion infrastructure plan.
Stepping back and assessing the stimulus to date, it’s clear that the output gap will be closed relatively soon, and economic overheating will become apparent by 2022, raising the specter of Fed rate hikes sooner than Fed Chair Powell is suggesting. A look at the evolution of consensus forecasts for U.S. gross domestic product (GDP) growth tells the story. Prior to the pandemic, the consensus was forecasting 2% U.S. real GDP growth for 2021 and 2% inflation. After the March 2020 first Coronavirus Aid, Relief, and Economic Security Act (“CARES Act”) ($2.2 trillion), the consensus forecast moved to 4% real GDP growth for 2021, which would have essentially made up the pandemic-related shortfall before 2022. After the second CARES Act ($0.9 trillion) in December 2020, the consensus added another point to growth, putting the U.S. on an even higher long-run trajectory. The American Rescue Plan Act of 2021 (American Rescue Plan) ($1.9 trillion in stimulus) has put the U.S. on track for over 6% real growth in 2021.
The highest quintile of forecasts for U.S. nominal GDP growth stood at 9.1% in early March this year. The consensus for 2022 nominal growth has moved up to 7.5%. These forecasts are catching up to the outlook predicted by past experiences with money-supply growth of similar rates to those seen since March 2020 (Exhibit 1). The three other times when money supply growth surpassed one standard deviation above trend were World War One (WWI), World War Two (WWII), and the 1970s. In each case, nominal GDP growth ran at, or above, 10% for a while before money growth was reined in. This helps explain why Professor Larry Summers—an American economist—recently said in an interview that the U.S. is facing “a pretty dramatic fiscal-monetary collision.”2 It should thus not be surprising that the consensus outlook for U.S. nominal GDP growth has rapidly moved up from the 4% secular stagnation pre-pandemic view toward a 10% view after the latest coronavirus-related stimulus bill.
The markets are now struggling with the inflation uncertainty created by a more than doubling of the U.S. GDP growth rate. In a 4% secular-stagnation world, zero interest rates were consistent with contained inflation. In a world of 10% nominal GDP growth, zero interest rates will stoke economic overheating and accelerating inflation. This helps explain the difference between the inflation aftermaths of WWI versus WWII. After WWI, inflation dropped quickly from two standard deviations above trend (over 10%) to two standard deviations below trend (severe deflation) as monetary policy adapted rapidly to a non-wartime setting. After WWII, the Fed continued to hold rates at very low, wartime settings until the Treasury-Federal Reserve Accord in March 1951. As a result, double-digit nominal growth and high inflation persisted until rates were allowed to rise more in line with nominal GDP after the Accord. This illustrates the eventual showdown that’s likely to develop, as Professor Summers has cautioned.
2 Larry Summers’ interview on Bloomberg TV, “Wall Street Week,” March 19, 2021.

5 of 26 April 2021 – Investment Strategy Overview
Past performance is no guarantee of future results. RETURN TO TABLE OF CONTENTS
Exhibit 1: Money-supply Growth Now Similar To World War II
-4
-3
-2
-1
0
1
2
3
4
Standard deviation from mean(z-score)
1902 1912 1922 1932 1942 1952 1962 1972 1982 1992 2002 2012
WWI WWII
1970s Inflation2020
+2 st. deviations
-2 st. deviations
Consumer price inflation (y/y % change, z-score**)M2* money supply (y/y %, z-score)
*M2=a calculation of the money supply that includes all elements of M1 (a narrow measure of the money supply that includes physical currency, demand deposits, traveler’s checks, and other checkable deposits) as well as “near money.” **A Z-score is a numerical measurement that describes a value’s relationship to the mean of a group of values. Z-score is measured in terms of standard deviations from the mean. Sources: Bureau of Labor Statistics; Federal Reserve Board/Haver Analytics. Data as of February 2, 2021.
For investors, this uncertainty over how long highly inflationary fiscal and monetary policy will be tolerated will remain a source of volatility for the next year. The economy is likely to keep surprising to the upside until the Fed curbs the floodgates of liquidity. Debates among Fed officials are likely over how much excess inflation to tolerate. Eventually, a debate over the 2% target is likely as Modern Monetary Theory (MMT) proponents argue for a higher target and greater tolerance for inflation much as the academic world did with the Phillips Curve theory in the 1960s that set the stage for the 1970s stagflation.
For now, the market seems to be accepting the Fed at its word. Breakeven inflation rates3 in the Treasury Inflation Protected Securities (TIPS) market have moved up above 2.5% for the next five years but are below that for longer maturities, in line with the view that the U.S. central bank will slow inflation after it runs moderately above the 2% target for a while. This is an encouraging sign that the market is currently not concerned that the Fed will tolerate a protracted period of excessive inflation and risk that inflation expectations come unanchored, as in the 1970s.
As Professor Summers is cautioning, however, with its complacency about inflation the market is likely to be surprised to the upside over the next year if past experience with comparable money growth and fiscal deficits is any indication. The Fed’s monetization of such large deficits runs the risk of igniting double-digit inflation unless it is curbed in time. Without the Fed monetizing the ballooning debt, the Treasury would need to raise taxes and slow spending while financing more debt in the private market, pressuring interest rates even higher.
The surge in the growth and inflation outlook over the past year has forced a rotation out of the defensive and high-growth beneficiaries of the old secular stagnation environment, when nominal GDP growth struggled to maintain its 4% average pace. In a 6% to 10% nominal GDP growth world, higher interest rates and faster near-term growth favor Small-cap, cyclical Value stocks, and perceived inflation “hedges,” such as commodity stocks.
3 The breakeven inflation rate is the difference between nominal Treasury and real TIPS yields of the same maturity. For example, if in the current market the 10-year breakeven is approximately 2.1%, that quantity would represent the difference between the 10-year Treasury yield of 1.1% and the -1.0% TIPS yield. If realized inflation is above 2.1%, TIPS will have yielded more than Treasurys. Below 2.1%, TIPS will have yielded less. When inflation is precisely 2.1%, an investor would be indifferent between owning TIPS or Treasurys—the yields of the two securities would be the same.

6 of 26 April 2021 – Investment Strategy Overview
Past performance is no guarantee of future results. RETURN TO TABLE OF CONTENTS
Also, if inflation rises and expectations drift higher, the dollar is likely to suffer over the longer term, much as it did in the 1970s. Inflation differences are what determine currency values over the long run. If the U.S. is beginning a protracted period of higher inflation than other countries, the dollar will suffer a secular decline. In the meantime, strong global growth led by the U.S. is driving a rotation to more cyclical Value stocks that disproportionately make up the international markets that have so badly lagged U.S. equities during the era of secular stagnation.
Another consequence of excessive stimulus is a shorter economic expansion as the Fed moves sooner to normalize rates and prevent inflation from rising persistently higher. The unusually long expansion cycles of the 1980s, 1990s and post Great Financial Crisis period reflected the “great moderation” in inflation and lack of overheating that causes protracted Fed tightness. The big fiscal deficits of the past year are much more stimulative and suggest a more stop-and-go environment going forward. For investors, this new world means a more proactive approach to tactical asset allocation is likely to be necessary.
When does the CIO expect a return to full employment?
The U.S. has recovered 13 million out of the 22 million jobs lost between February 2020 and the April 2020 pandemic shutdowns. With millions of other people having retired or not seeking work, the unemployment rate has quickly dropped from 15% to 6.2% as the economy reopened. According to the Bureau of Labor Statistics, there are still 4.2 million more people counted as unemployed than before the pandemic, when the unemployment rate was at 3.5%.
Encouragingly, with the economy currently on track for anticipated strong growth fueled by reopenings and government stimulus, leading indicators of employment suggest that three million to five million new jobs could be created this year, helping many of the 10 million currently unemployed and looking for a job. Surveys of job openings are at elevated levels, U.S. manufacturing and nonmanufacturing surveys point to strong employment growth ahead, temporary employment surveys have surged, and the global IHS Markit manufacturing survey is at a four-year high, pointing to strong manufacturing production and trade gains. All these suggest rapid declines in the unemployment rate through 2022. Not surprisingly, at this year’s mid-March rate-setting meeting the Fed substantially reduced its unemployment rate estimate for the end of 2021 from the 5% anticipated in December 2020 to 4.5%, with 3.9% now penciled in for the end of 2022. Both forecasts are now much closer to BofA Global Research estimates.
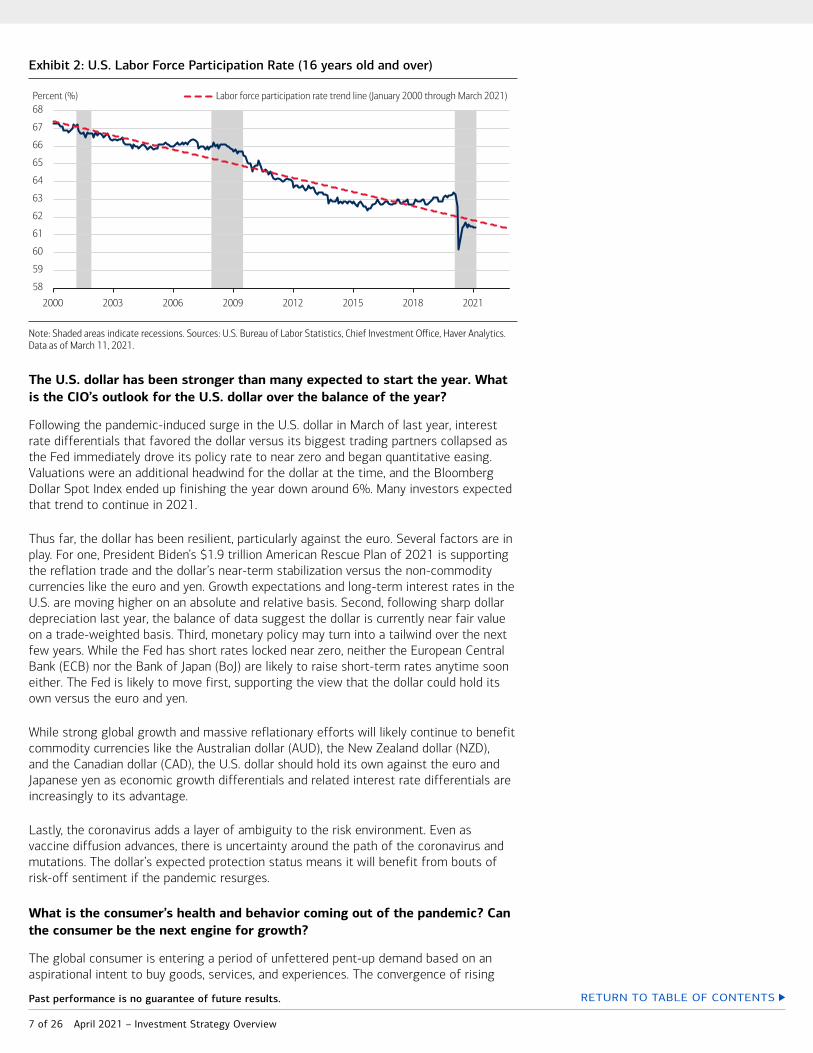
With surging employment and the labor force participation rate (LFPR) close to its downtrend (Exhibit 2), most of the labor market slack is likely to soon be eliminated. Notably, despite a record decline, the LFPR is only slightly below its otherwise steep downtrend, which began in 2000 because of demographic and other socioeconomic reasons. Thus, the LFPR has mainly reversed its countertrend 2016-2019 gains, when significant tax cuts and a strengthening economy fueled a surge in prime-age participation rates. The main risk is that disincentives to work caused by extraordinary government transfers currently reaching almost 19 million people (double the drop in payrolls since the pandemic) amplify the downward pressures on the participation rate, lowering the unemployment rate much faster than in previous economic cycles and limiting the duration of the expansion. The National Federation of Independent Business (NFIB) small business survey for February reports record difficulty filling job openings, supporting the view that labor slack is likely exaggerated.
7 of 26 April 2021 – Investment Strategy Overview
Past performance is no guarantee of future results. RETURN TO TABLE OF CONTENTS
Exhibit 2: U.S. Labor Force Participation Rate (16 years old and over)
58
59
60
61
62
63
64
65
66
67
68
2000 2003 2006 2009 2012 2015 2018 2021
Percent (%) Labor force participation rate trend line (January 2000 through March 2021)
Note: Shaded areas indicate recessions. Sources: U.S. Bureau of Labor Statistics, Chief Investment Office, Haver Analytics. Data as of March 11, 2021.
The U.S. dollar has been stronger than many expected to start the year. What is the CIO’s outlook for the U.S. dollar over the balance of the year?
Following the pandemic-induced surge in the U.S. dollar in March of last year, interest rate differentials that favored the dollar versus its biggest trading partners collapsed as the Fed immediately drove its policy rate to near zero and began quantitative easing. Valuations were an additional headwind for the dollar at the time, and the Bloomberg Dollar Spot Index ended up finishing the year down around 6%. Many investors expected that trend to continue in 2021.
Thus far, the dollar has been resilient, particularly against the euro. Several factors are in play. For one, President Biden’s $1.9 trillion American Rescue Plan of 2021 is supporting the reflation trade and the dollar’s near-term stabilization versus the non-commodity currencies like the euro and yen. Growth expectations and long-term interest rates in the U.S. are moving higher on an absolute and relative basis. Second, following sharp dollar depreciation last year, the balance of data suggest the dollar is currently near fair value on a trade-weighted basis. Third, monetary policy may turn into a tailwind over the next few years. While the Fed has short rates locked near zero, neither the European Central Bank (ECB) nor the Bank of Japan (BoJ) are likely to raise short-term rates anytime soon either. The Fed is likely to move first, supporting the view that the dollar could hold its own versus the euro and yen.
While strong global growth and massive reflationary efforts will likely continue to benefit commodity currencies like the Australian dollar (AUD), the New Zealand dollar (NZD), and the Canadian dollar (CAD), the U.S. dollar should hold its own against the euro and Japanese yen as economic growth differentials and related interest rate differentials are increasingly to its advantage.
Lastly, the coronavirus adds a layer of ambiguity to the risk environment. Even as vaccine diffusion advances, there is uncertainty around the path of the coronavirus and mutations. The dollar’s expected protection status means it will benefit from bouts of risk-off sentiment if the pandemic resurges.
What is the consumer’s health and behavior coming out of the pandemic? Can the consumer be the next engine for growth?
The global consumer is entering a period of unfettered pent-up demand based on an aspirational intent to buy goods, services, and experiences. The convergence of rising

8 of 26 April 2021 – Investment Strategy Overview
Past performance is no guarantee of future results. RETURN TO TABLE OF CONTENTS
wages, improving employment trends, successful coronavirus vaccines, a third significant stimulus payment, and the seasonal improvement in weather conditions all help to contribute to the imminent surge in consumer spending. All of these catalysts, coupled with recent housing formations, flexible work environments and the desire to “get back out there” could provide an extended period of visible and sustainable consumer spending growth. Furthermore, consumer balance sheets are generally healthy with elevated savings, boosted by fiscal stimulus checks and rising wages. Consumers are expected to embark on a wardrobe upgrade cycle for both leisure and back-to-work apparel while emerging from a social recession with increased eat-in restaurant trips, continued spending on nesting and cocooning in their homes, and adding experiences like in-person concerts and sporting events and drive-to “vacci-cations.” Confidence around the sustainability of these trends is rising and a function of additional upcoming catalysts, such as delayed tax refunds that will follow the stimulus benefits, sequentially improving employment trends, rising wages and the potential commensurate increase in real disposable incomes.
Where do U.S.-China relations stand in early 2021, and what are the market implications?
Economic and geopolitical frictions between the U.S. and China were a major concern in early 2020 at the onset of the coronavirus pandemic. And one year later as investors begin to look ahead to a post-pandemic recovery, U.S.-China tensions are once again beginning to resurface. This past March saw the first foreign policy meeting between cabinet members of the Biden administration and their Chinese counterparts. And though some areas of mutual cooperation were established, particularly on climate change, diplomatic antagonism on a range of areas such as human rights violations in Western China and territorial claims in the South China Sea overshadowed the talks. While we do expect the new U.S. administration to take a more strategic approach to its relations with China, we see limited moves to reverse the restrictions imposed under the previous administration in the near term. With the underlying sources of division between the two countries still intact, we see the bilateral rivalry of recent years continuing under the current U.S. leadership.
The hostilities of the past four years have most ostensibly been centered on trade and tariffs, but the fundamental conflict remains much broader. China continues to close the gap with the U.S. economically. The difference in GDP between the two nations fell by 15% last year alone, and on International Monetary Fund (IMF) projections, GDP in China is likely to overtake U.S. GDP by the end of the decade. Though China’s military budget is still only one-third the size of U.S. defense spending, this gap is also falling. And crucially, China continues to make gains in its technological capacity across domains such as advanced computer processing, artificial intelligence, electric vehicles and biotechnology (Exhibit 3). This comes on top of geopolitical and diplomatic disputes in areas from the status of Hong Kong and Taiwan to human rights and the South China Sea. We expect these differences to lead to further decoupling of the two economies in order to protect intellectual property and data security, as well as to reduce supply chain interdependence, particularly in the wake of the pandemic.

9 of 26 April 2021 – Investment Strategy Overview
Past performance is no guarantee of future results. RETURN TO TABLE OF CONTENTS
Exhibit 3: U.S.-China Frictions to Persist Under the New Administration
0
5
10
15
20
25
30
2000 2005 2010 2015 2020 2025
Nominal gross domestic product$ (trillion)
Biotechnology academic journalsNumber of research papers published
0
2000
4000
6000
8000
10000
12000
00 02 04 06 08 10 12 14 16 18 20
China U.S. China U.S.
IMFprojection
Sources: IMF, Scopus. Data as of March 2021.
We do, however, also expect the Biden administration to take a more multilateral approach to addressing its differences with China alongside allied countries in Europe and the Indo-Pacific (including closer collaboration with the other Quad nations of Japan, India and Australia), and to do more to compete with China rather than pursue protectionist policies. For investors, this implies that China policy should become less uncertain, with a lower drag on trade from the imposition of new tariffs. We also see greater potential for increased trade and investment flows to benefit U.S. partners in Asia, such as India, as economic and diplomatic ties are strengthened. And a greater emphasis on competition rather than containment in next-generation technology is likely to boost investment within the sector across both markets as they become more self-sufficient. Alongside the underlying expansion of digital economic activity, this should also support post-pandemic growth in the tech sector over the longer term.
EQUITIES
Are the ongoing rotations within the equity markets into economically sensitive areas sustainable?
Equity markets have fully recovered and then some since the March 2020 low on the backs of accommodative monetary and fiscal policy and breakthroughs on the public health front. Technology stocks and more Growth-oriented beneficiaries of pandemic-related conditions had been the big leaders, but recently participation has broadened with 94% of S&P 500 constituents above their 200-day moving average. Assets that typically lead during the early to middle part of an economic cycle like Value, Small-caps and more economically sensitive sectors have posted gains as growth and inflation expectations tick higher.
The outperformance of Value has gained steam in the last several months, coinciding with a move higher in interest rates. This shift comes on the heels of a strong year for Growth stocks driven in large part by the Technology sector that accounts for 45% of the Russell 1000 Growth index, which returned 84% from the market bottom to the close of 2020, trouncing the Russell 1000 Value Index, which gained 61%. But given the recent selloff in bonds triggered by rising expectations for inflation, in February Value returned its strongest outperformance relative to Growth since March 2001 (Exhibit 4).
Despite the recent pullback, Small-caps have maintained a strong lead relative to Large-caps, as the performance gap between the two size segments as measured by the Russell 2000 Index and the Russell 1000 Index has widened out by roughly 30

10 of 26 April 2021 – Investment Strategy Overview
Past performance is no guarantee of future results. RETURN TO TABLE OF CONTENTS
percentage points since September 2020. Small-caps faced greater headwinds at the start of the pandemic compared to Large-caps, which had more resources to remain open, larger cash positions and generally greater profitability. In December 2020, however, the number of unprofitable small-cap companies in the Russell 2000 Index peaked at 49%, which has historically corresponded with the end of a recession and the start to a more sustained cyclical upturn, according to Strategas Research Partners.
Cyclical sectors have similarly enjoyed the benefits of rising yields and expectations for higher growth and inflation. What were some of the most laggard sectors by the end of last year are now some of the top market outperformers. Energy and Financials are up 33% and 17% so far this year relative to just 6% for the S&P 500, with Industrials and Materials following closely behind, up 11% and 10%, respectively, while Technology is actually slightly down. These market movements are unsurprising given the recent move higher in real yields, or inflation-adjusted yields, as cyclical sectors are more positively correlated with real yields and the 10-year Treasury yield compared to defensive sectors, with Financials and Industrials benefiting the most, according to Evercore ISI research.
The impressive run for Value and Small-caps has further to go, in our opinion, based on certain catalysts: a continuing steepening of the yield curve alongside a Fed that has reemphasized its dovish stance; recently passed stimulus adding to already cash-flushed consumer balance sheets; and an acceleration in coronavirus vaccine rollouts helping support more economic reopening efforts. For now, the macroeconomic picture is supportive enough to sustain these rotations, but we continue to believe investors should consider a barbell approach, holding a mix of both high-quality cyclical Value and secular Growth areas that have exposure to trends accelerated by the pandemic.
Exhibit 4: Value outperformance hasn’t been this strong in 20 years
-15%
-10%
-5%
5%
10%
15%
20%
2000 2001 2002 2003 2004 2005 2006 2007 2008 2009 2010 2011 2012 2013 2014 2015 2016 2017 2018 2019 2020 2021
Percent Change in Value/Growth Ratio, Monthly Basis
0%
Note: Value is represented by the Russell 1000 Value Total Return Index. Growth is represented by the Russell 1000 Growth Total Return Index. Source: Bloomberg. Data as of February 26, 2021. Past performance is no guarantee of future results.
How sustainable are the growth rates of disruptive technology companies?
While disruptive technology companies posted extraordinarily high growth rates in 2020 due to increased adoption pulling forward future growth,4 the Food and Drug Administration’s (FDA’s) approval of coronavirus vaccines in December 2020 triggered the first wave of the rotation out of the “disruptive” stocks, with investors repositioning towards a reopening economy. This move was then exacerbated in late February and the beginning of March 2021 with the sharp rise in 10-year Treasury yields—suggesting that Fixed Income investors were potentially anticipating higher inflation and GDP growth—and the valuations for these ”longer duration” equity securities adjusting
4 Sources: Bloomberg, Factset. Data as of March 29, 2021.
11 of 26 April 2021 – Investment Strategy Overview
Past performance is no guarantee of future results. RETURN TO TABLE OF CONTENTS
downwards for potentially higher future interest rates. This correction was somewhat expected and welcomed by many investors as it broadened the market, therefore potentially lowering the probability of asset bubbles being formed in a few areas that had benefited disproportionately.
The coronavirus pandemic created an environment for the ”disruptors” posting outsized growth rates and outsized returns as a result, which many investors had never seen before. However, we believe the future will most likely be more volatile for this space driven by moves in U.S. Treasury yields, economic and labor data, the news around coronavirus cases or vaccinations and the economic reopening plans across the globe. In addition, growth rates there will likely ”normalize”—when compared to 2020 growth rates—in the absence of such an external event as coronavirus. Taking into account these uncertainties and the fact that companies in this space are still delivering on expectations—despite the overvaluation concerns by some investors—we still believe disruptive innovation offers great opportunities for long-term investors willing to tolerate higher risk.
With valuations seemingly high, can earnings and profit margins rise enough to support Equities? Also, what is the CIO’s outlook for cash deployment by U.S. companies?
The process of earnings recovery and balance sheet repair is well underway and primed to accelerate, as fundamentals rather than valuation begin to power market leadership. Consensus estimates for 2021 S&P 500 earnings have moved up more than 5% since the beginning of the year, to $176 per share or a 25% year-over-year advance. Upside momentum remains, with earnings estimate upgrades outnumbering downgrades by a ratio of 1.63 in the U.S. over the past three months, according to BofA Global Research. This improving outlook is especially pronounced within cyclical sectors, Small-caps, and Value. The fundamental boost in earnings has driven equity returns this year, even as valuations have compressed slightly as interest rates have risen (Exhibit 5).
Importantly, the momentum in earnings estimates has been driven both by increased expectations for top-line sales and profit margins. Margins had come under duress during the pandemic-induced economic shock; however, they are set to expand in 2021 and beyond. This is typical as profitability compresses in the initial stages of recession before companies emerge leaner and more efficient as the cyclical upturn takes hold. The speed and magnitude of the current instance may be more pronounced as S&P 500 net margins had compressed to 10.5% in 2020 but are now expected to bounce back to 12% this year, according to Bloomberg. This momentum is expected to carry forward, with next year’s margins projected at 13%, which would mark the highest level in decades. Much of this improvement would be owed to operational efficiencies gained during the pandemic coupled with the secular shift of business towards asset-light and technologically optimized business models.
The improving earnings backdrop is being met by an already robust cash buildup, owing to conservative balance sheet management during the pandemic. Almost $2.4 trillion in S&P 500 cash had been stockpiled coming into this year, which is an increase of about $600 billion from 2019. This cash is expected to be deployed, especially via increased capital expenditures and buybacks, the latter of which decreased by about 26% year-over-year and is even further off as a percentage of market cap from 0.92% to 0.36%. A normalization of cash deployment policy and a potential catch-up phase could provide a strong impulse to move Equities higher.

12 of 26 April 2021 – Investment Strategy Overview
Past performance is no guarantee of future results. RETURN TO TABLE OF CONTENTS
Exhibit 5: S&P 500 performance now being driven by fundamentals over multiple expansion
16.3%
-5.0%
21.3%
4.1%
7.8%
-3.7%
-10%
-5%
0%
5%
10%
15%
20%
25%
Price Return Forward EPS Change (%) Forward P/E Change
2020 2021 YTD
EPS = earnings per share. P/E = price-to-earnings ratio. Sources: Chief Investment Office, Cornerstone Macro. Data as of March 24, 2021. Past performance is no guarantee of future results. Short-term performance shown to illustrate more recent trend.
What does the recent rise in interest rates mean for Equity returns going forward?
Context matters when evaluating the effect of rising rates on Equities, and we believe that the current environment is still favorable. Fundamentally, equity performance is driven by corporate earnings, which are rapidly advancing; however, a slightly higher discount rate can put downward pressure on valuations. Higher yields could also dampen the relative attractiveness of stocks versus bonds but levels are likely still far from threatening.
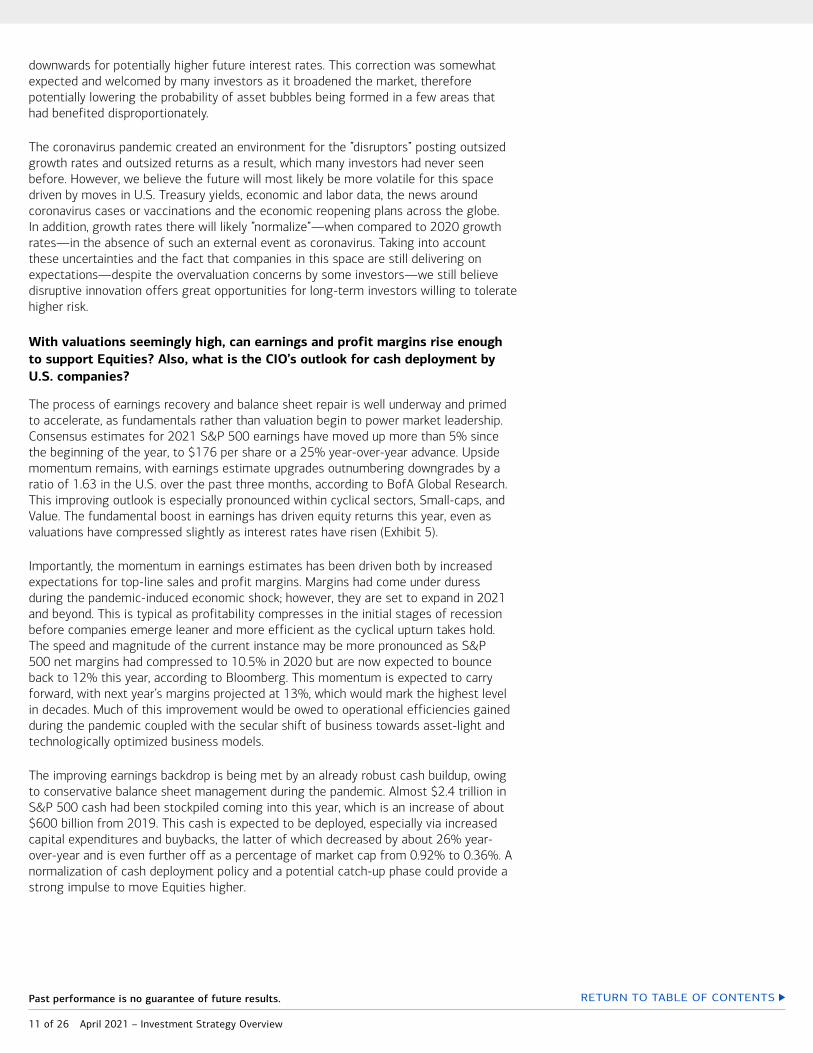
As the economic recovery builds, corporate profits are rising and credit spreads are very benign, both of which are major tailwinds for Equities (Exhibit 6). The improved backdrop for nominal growth may continue to be reflected in higher intermediate and longer-dated Treasury yields, but so long as they do not pressure consumption or increase credit risks, or represent a more substantial total return alternative, the backdrop for Equities should remain supportive.
Historically, the S&P 500 has posted positive returns during 74% of rising rate cycles, according to BofA Global Research.5 Analyzing these cycles through shorter time frames helps to illustrate the point that broader macroeconomic context is important for equity performance. For example, from 1950 to 1965, higher-trending rates coincided with a secular U.S. bull market for Equities. During that period credit conditions remained somewhat benign, while overall annualized growth averaged 4.3% and the S&P 500 enjoyed a price return of 405%. Alternatively, Equities performed poorly in the 1970s as inflation spiked along with yields and credit spreads. From 1973 to 1980, real growth trended down towards an annualized rate of 3.4% and Treasury yields surged past 10%. The S&P 500 subsequently posted a disappointing price return of -8.6%.
Relative valuations still favor Equities over bonds, and higher levels of nominal growth should help to power earnings above market expectations. Note that the earnings yield (EPS/Price) of the S&P 500 is 4.4% currently, above the 10-year Treasury yield of 1.6%, compared to the dotcom bubble top when bond yields were routinely 200 to 300 basis points (bps) above the S&P 500’s earnings yield. The rise in yields has not yet corresponded to additional risks to credit or growth, and financial conditions are
5 Return data covers the period from inception of the S&P 500’s predecessor index in 1926 (as calculated by the Standard Statistics Company, who would later merge with Poor’s Publishing) through March 2021.
13 of 26 April 2021 – Investment Strategy Overview
Past performance is no guarantee of future results. RETURN TO TABLE OF CONTENTS
expected to be accommodative for an extended period. While an orderly grind higher in yields could pressure growth-oriented Equities at the margins, we believe the broader context is positive.
Exhibit 6: S&P 500 valuations expand when credit risks are low
5x
10x
15x
20x
25x
30x
1% 2% 3% 4% 5% 6% 7%
Forw
ard
Pric
e/Ea
rnin
gs
Moody's Baa Corporate Bond Yield less 10-year Treasury Yield
Current range
Note: Data covers the period from December 31, 1997 through March 25, 2021. Sources: Chief Investment Office, Federal Reserve of St. Louis, Bloomberg. Data as of March 25, 2021.
Does the CIO position Equity portfolios for a rising inflation environment?
The recent rotations into the long underperforming Value areas of the equity market are reflecting the gradual reopening of the economy, record fiscal stimulus, loose monetary policy, the recent moves higher in interest rates and rising inflation indicators. The deflationary forces of technological innovation, growth in e-commerce, and overall digitalization of the economy helped drive underperformance of Value and commodity-related stocks in recent years. However, the pandemic and the very quick and unprecedented responses (stimulus plans) to help support consumers and the economy as a whole have set the table for inflation to return. Therefore, how does the CIO position portfolios for inflation potentially returning? By rebalancing large overweight positions in high-growth and momentum stocks that outperformed and led the equity market higher in recent years, and using the proceeds to add to high-quality cyclical and Value stocks. These include Financials, Materials, Energy and commodity-related industries. Some of the better asset classes to position portfolios against rising inflation include commodities and commodity-related equities: agriculture, specialty chemicals, base metals, precious metals, energy, construction materials and diversified miners. In general, equity portfolios have been underweight these industries for years, but recent flows reflect changing sentiment and are a sign of stronger economic growth and higher inflation expectations. Equities in general and high-quality industry leaders in particular can be attractive investments to position for rising inflation relative to other investments. When examining individual companies, investors may focus on those that have historically demonstrated pricing power and could be well-positioned to pass higher costs along to their customers. Positive pricing dynamics can help minimize risk margins and earnings in an inflationary environment.
What is the CIO’s outlook for International Developed markets?
In our base case, a global economic rebound argues for a gradual tactical shift from Growth to a greater balance with Value segments of the equity market. Should this scenario materialize, cyclical sectors that stand to benefit, such as Industrials and Financials, have a greater representation in international developed markets, such as Japan and Europe. Also with diversification in mind, the MSCI World (ex-U.S.) Index

14 of 26 April 2021 – Investment Strategy Overview
Past performance is no guarantee of future results. RETURN TO TABLE OF CONTENTS
trades at a nearly 35% discount to the USA Index in average price-to-book value going back to 1995. Among other positives, fiscal and monetary support across these markets should also continue to be a tailwind. On the other hand, sustained uncertainty as to the trajectory of the coronavirus pandemic for many of these regions gives us pause.
While we remain tactically neutral on international developed market Equities, we have a growing preference for Japan, where profits growth is more correlated with the trajectory of the global economy. Greater than half of revenues produced by the country’s companies are derived from abroad, according to Gavekal Research. Outperformance of Japanese Equities should continue to benefit from V-shaped economic recoveries in global trade, in China and in the U.S. (Exhibit 7). Domestically, coordinated stimulus rivals that of the U.S. The Bank of Japan remains committed to keeping stable near zero percent the country’s longer-dated 10-year yield, among other supportive monetary policies. Fiscal stimulus has totaled 54.1% of GDP, according to Cornerstone Macro research. With strong balance sheets and healthy cash levels, according to the latest national accounts data, the prospect for Japanese companies to expand or return cash to shareholders remains notable. Corporate governance reforms, started under the Shinzo Abe administration—former Prime Minister of Japan—are likely to continue under current Prime Minister Yoshihide Suga, which should promote more shareholder-friendly decision making.
Exhibit 7: Global trade has staged a V-shaped recovery, providing a potential tailwind for economies linked to it
-25
-20
-15
-10
-5
0
5
10
15
20
25Year-over-year growth, (%)
2001
2002
2003
2004
2005
2006
2007
2008
2009
2010
2011
2012
2013
2014
2015
2016
2017
2018
2019
2020
2021
World trade volumes (seasonally adjusted)
Sources: CPB Netherlands Bureau for Economic Policy Analysis, Chief Investment Office. Data as of February 2021.
Yet, recent news that Japan is planning to bar international spectators from this year’s Summer Olympics is a timely reminder of the continued negative effects of the coronavirus pandemic on its domestic economy and especially on tourism. This effect has also stung Europe. Suppressing economic activity, propagation of coronavirus variants has shifted large areas in Italy and France back into shutdown, among other developments. What’s more, policy moves have also raised concerns about the safety of vaccinations, which also risk prolonging the path towards economic normalization for the region. In contrast to the U.S. and China, Bloomberg’s 2021 real GDP consensus estimate for the Eurozone has steadily declined from 5.7% in August last year to 4.2% as of March 25.
Optimistically, this annual growth rate would still be the strongest since 1989, according to the World Bank. Tailwinds include an ongoing recovery in global trade, which may receive a further boost from the recently approved $1.9 trillion fiscal stimulus package in the U.S. On our radar is whether Europe’s inoculation program speeds up. The United Kingdom—where a faster vaccination campaign has bolstered confidence—may be a singing canary. In anticipation of a normalization of economic activity, IHS Markit’s
15 of 26 April 2021 – Investment Strategy Overview
Past performance is no guarantee of future results. RETURN TO TABLE OF CONTENTS
Composite Purchasing Managers’ Index for the country rose to a seven-month high in March, above analysts’ expectations. Moreover, market research firm GfK reported that consumer sentiment in March was the most buoyant since the pandemic began. For the region as a whole, we continue to monitor post-Brexit growing pains and tensions regarding vaccine procurement.
After over 10 years of U.S. outperformance, how does the CIO see international fund managers positioning for potentially stronger outlooks for non-U.S. Equities?
The small number of ”deep Value” managers in international peer groups have strongly led performance rankings since September 2020, benefiting from previously unloved areas of the markets such as banks and commodities. We don’t anticipate this leading to large-scale manager shifts into these areas of the market, however. Most fundamental managers continue to see weak growth for developed market banks, for example, preferring instead selective exposure to non-bank financials such as insurance, capital markets exchanges, or asset and wealth managers. Fundamental managers generally also minimize or avoid exposure to commodity stocks on the basis that they don’t believe they can predict the underlying commodity price. So for most managers in the peer groups, it’s about adjusting exposure to higher “quality” cyclicals or staying anchored in higher secular Growth stocks and riding out a period of underperformance as a result.
We do additionally see potential for international managers to increase exposure to EMs in portfolios over the medium-to-long term. Following U.S. Equities’ outperformance over International Developed and EM Equities since 2005,6 continued structural impediments to growth in Europe and Japan, a build-up of China research capabilities among active international managers, and secular themes supporting the long-term earnings of many EM companies, we think the conditions are there for potential increased EM exposure within international portfolios. Overlapping holdings between international and EM managers is something worth monitoring to help ensure aggregated portfolio exposures and risks remain consistent with objectives.
With the backup in U.S. yields, is the CIO still constructive on Emerging Market assets? What are some potential risks for Emerging Markets for the balance of the year?
For much of the past year, the pandemic has had an uneven impact across EMs. Emerging Asia has outperformed on its stronger economic fundamentals and capitalization bias toward growth sectors such as Information Technology and Communication Services. But the other emerging regions of Latin America and EMEA (Europe, Middle East and Africa) have lagged, given their lower levels of preparedness for the underlying health crisis and economic fallout, as well as their lack of market exposure to the growth sectors that have been the most resilient.
Over recent months however, the approvals and disbursements of coronavirus vaccines have led to a shift in market sentiment. Cyclical sectors have outperformed as investors anticipate a recovery in the economic segments that were hardest hit by the shutdowns, such as Transportation, Energy, Real Estate and Hospitality. And this has been a relative tailwind for the emerging regions that had trailed for much of 2020. We expect this latest rise in bond yields to further broaden the market recovery across EM regions, as it continues to benefit cyclical sectors such as Energy, Financials, Industrials and Materials, where Latin America and EMEA remain heavily weighted. Latin America for example has 63% of its exposure across these four sectors, and EMEA has 69%, both of which are well above the EM average of 34% (Exhibit 8). Despite its much lower exposure of 27%, we nonetheless also expect emerging Asia to continue its advance as it remains the fastest-growing global region in 2021 and as the structural broadening of the digital economy persists.
6 Source: DataTrek. Data as of April 2021.

16 of 26 April 2021 – Investment Strategy Overview
Past performance is no guarantee of future results. RETURN TO TABLE OF CONTENTS
Exhibit 8: Regional Emerging Market Equities’ Exposure to Key Cyclical Sectors
34.2%26.6%
62.7%68.8%
Cyclical sector weightings in EM regionsShare of market capitalization
0%
10%
20%
30%
40%
50%
60%
70%
80%
EMEA Latin America EM Asia Emerging Markets
Source: MSCI. Data as of February 2021. Sector exposures based on MSCI country indices. Cyclical sectors are Industrials, Financials, Energy and Materials. EMEA is Europe, Middle East and Africa.
We do nonetheless see specific risks at the country level. The rise in inflation expectations and interest rates is likely to pose the biggest challenge for markets that have large current account deficits such as Turkey and Colombia, as well as markets that have seen a significant deterioration in their budget balances over the past year such as Brazil and South Africa. In the case of Brazil and Turkey, both markets are also vulnerable in the current environment due to their high rates of current inflation, which have forced local policymakers to raise rates over recent months, well ahead of the rest of the world. We also see pockets of potential relative weakness in lower-income markets within Southeast Asia. The Philippines and Indonesia for example remain more dependent on tourism and remittances than the rest of Asia. While the 2021 growth recovery is expected to be led by domestic service activity within borders, the reopening of international travel and cross-border migration may take longer. And for lower-income markets across the emerging world, a slower pace of vaccine rollout is also likely to slow the pace of economic normalization.
We therefore expect a broader recovery across EM regions over the course of the year. Higher-income Asian markets remain well positioned to benefit from the rapid underlying pace of economic growth and continuing expansion of the digital economy. And we believe Latin America and EMEA should benefit overall from the relative improvement in cyclical sectors. But as inflation risks rise and individual sectors recover at different speeds, we expect returns to vary at the country level according to local market conditions.
FIXED INCOME
What is the Federal Reserve’s perspective on the current environment, and how does that inform the CIO’s thinking on asset markets?
The Fed’s operating framework for the foreseeable future is as clear and transparent as it has ever been. In August 2020, the Fed updated its long-term operating policy document, introducing a new “flexible average inflation targeting” framework. It highlighted that due to the low-rate environment “downward risks to employment and inflation” are higher from a long-term, secular perspective. The Fed later laid out three criteria to be met before it raises rates:
1. The labor market reaches “maximum employment”; and
17 of 26 April 2021 – Investment Strategy Overview
Past performance is no guarantee of future results. RETURN TO TABLE OF CONTENTS
2. Inflation has risen to 2%; and
3. Inflation is on track to moderately exceed 2% for some time.
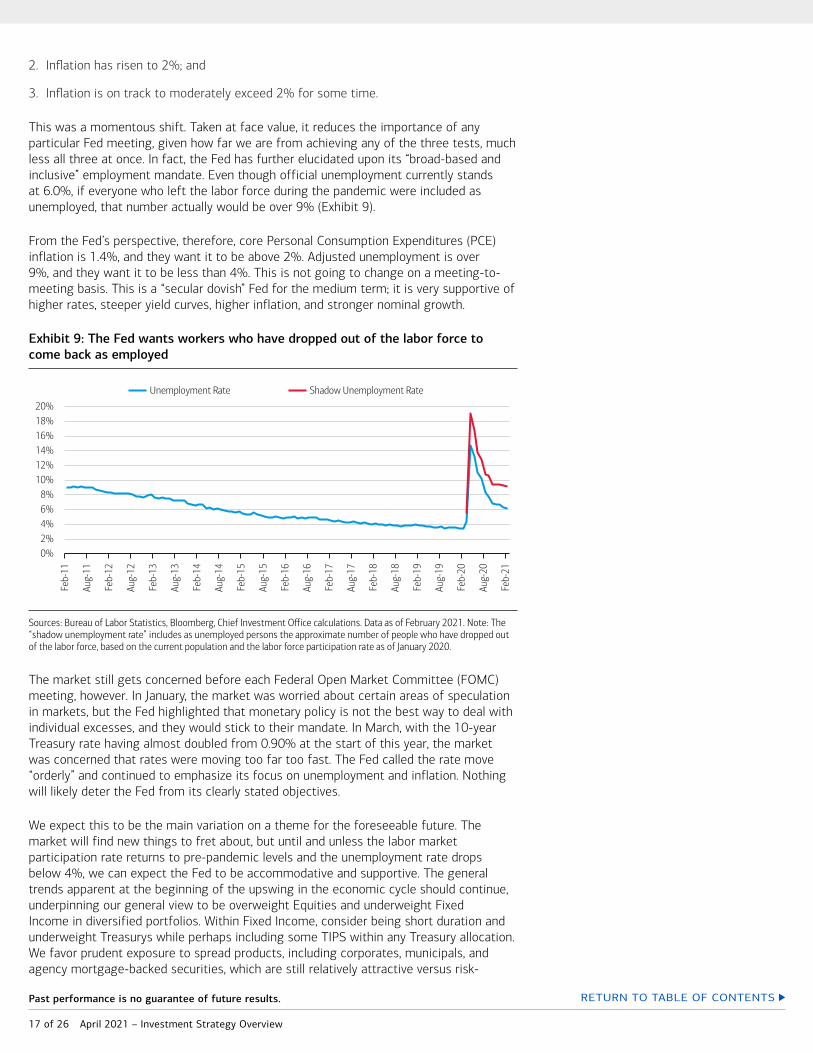
This was a momentous shift. Taken at face value, it reduces the importance of any particular Fed meeting, given how far we are from achieving any of the three tests, much less all three at once. In fact, the Fed has further elucidated upon its “broad-based and inclusive” employment mandate. Even though official unemployment currently stands at 6.0%, if everyone who left the labor force during the pandemic were included as unemployed, that number actually would be over 9% (Exhibit 9).
From the Fed’s perspective, therefore, core Personal Consumption Expenditures (PCE) inflation is 1.4%, and they want it to be above 2%. Adjusted unemployment is over 9%, and they want it to be less than 4%. This is not going to change on a meeting-to-meeting basis. This is a “secular dovish” Fed for the medium term; it is very supportive of higher rates, steeper yield curves, higher inflation, and stronger nominal growth.
Exhibit 9: The Fed wants workers who have dropped out of the labor force to come back as employed
0%2%4%6%8%
10%12%14%16%18%20%
Feb-
11
Aug-
11
Feb-
12
Aug-
12
Feb-
13
Aug-
13
Feb-
14
Aug-
14
Feb-
15
Aug-
15
Feb-
16
Aug-
16
Feb-
17
Aug-
17
Feb-
18
Aug-
18
Feb-
19
Aug-
19
Feb-
20
Aug-
20
Feb-
21
Unemployment Rate Shadow Unemployment Rate
Sources: Bureau of Labor Statistics, Bloomberg, Chief Investment Office calculations. Data as of February 2021. Note: The “shadow unemployment rate” includes as unemployed persons the approximate number of people who have dropped out of the labor force, based on the current population and the labor force participation rate as of January 2020.
The market still gets concerned before each Federal Open Market Committee (FOMC) meeting, however. In January, the market was worried about certain areas of speculation in markets, but the Fed highlighted that monetary policy is not the best way to deal with individual excesses, and they would stick to their mandate. In March, with the 10-year Treasury rate having almost doubled from 0.90% at the start of this year, the market was concerned that rates were moving too far too fast. The Fed called the rate move “orderly” and continued to emphasize its focus on unemployment and inflation. Nothing will likely deter the Fed from its clearly stated objectives.
We expect this to be the main variation on a theme for the foreseeable future. The market will find new things to fret about, but until and unless the labor market participation rate returns to pre-pandemic levels and the unemployment rate drops below 4%, we can expect the Fed to be accommodative and supportive. The general trends apparent at the beginning of the upswing in the economic cycle should continue, underpinning our general view to be overweight Equities and underweight Fixed Income in diversified portfolios. Within Fixed Income, consider being short duration and underweight Treasurys while perhaps including some TIPS within any Treasury allocation. We favor prudent exposure to spread products, including corporates, municipals, and agency mortgage-backed securities, which are still relatively attractive versus risk-

18 of 26 April 2021 – Investment Strategy Overview
Past performance is no guarantee of future results. RETURN TO TABLE OF CONTENTS
free rates. We find High Yield (HY) to be less compelling than Equities, supporting an underweight position there; however, within HY, we prefer leveraged loan exposure for its more defensive characteristics and lower interest-rate risk.
What are the implications of the borrowing trends in Investment Grade and High Yield corporate bond markets?
Investment Grade (IG) corporate bond issuance increased in 2020 to $1.758 trillion from $1.099 trillion in 2019 and continued to rise in 2021 with issuance of $104 billion in February, which was the heaviest since 2015. IG issuance quality has deteriorated, with BBB issuance averaging 21% of the total in that month, up from 12% in 2018 and 15% in 2015. There has been a material increase in duration given companies electing to refinance at lower rates and extend maturities. IG corporate bonds had a duration of 6.5 years at the end of 2010, 7.0 years at the end of 2015 and 8.8 years at the end of 2020, resulting in materially higher interest rate risk in the IG market.7
HY new issuance volume also hit recent highs in 2020, with an accompanying material increase in leverage and therefore a higher level of credit risk in the high yield market.8 Meantime, the convertible bond market experienced a resurgence in 2020 as issuance hit a record $113.6 billion, leading to net supply of $67.6 billion, well above the $4.7 billion net supply average over the prior six years. Sector and issuer composition has broadened as converts became a source of rescue financing (airlines, cruise lines) and the chosen funding source for prominent Growth Tech and Consumer Discretionary firms.
While the CIO favors IG corporate debt relative to HY or Treasurys, investors should be aware that the combination of refinancing at lower rates, extending maturities and increased issuance of BBB-rated bonds presents significantly higher interest rate and credit risk in the IG credit market.
What are the potential opportunities and risks in the bank loan market in a rising interest rate environment?
Bank loans have an adjustable coupon structure that translates to virtually no interest-rate duration (price sensitivity to interest rate changes), which is why loans have been one of the only asset classes spared amid the recent bond market volatility. New issuance in the loan market has diminished and after three years of record retail outflows, technicals have improved with several months of positive flow trends for loan funds. Another positive aspect of the floating-rate senior loan asset class is positioning high within a company’s capital structure, providing greater security for the underlying loans.
Despite their position on the capital structure, bank loans still present considerable credit risk as they are issued by below IG companies. Additional risks with loans are liquidity risk, long settlement periods and the lack of call protection (i.e., loan refinancing and the lower coupons that come with that is possible at any time). These risks are putting downside pressure on yields, but only on the margin. Liquidity comes and goes and prices go up and down, but the main, permanent risk is always credit. Currently the outlook is bright (with a forecast9 of a 2% to 3% default rate for the coming year) but this could quickly change based on credit availability and the strength of the recovery in more cyclical industries.10
The potential opportunity in loans is to earn one of the highest spreads and yields in Fixed Income today, in an asset class with rebounding fundamentals and underlying
7 Sources: Dealogic, J.P. Morgan. Data as of March 29, 2021.8 Sources: Capital IQ, J.P. Morgan. Data as of March 29, 2021.9 Forecasts are subject to change. 10 Sources: Capital IQ, Chief Investment Office. Data as of March 29, 2021.

19 of 26 April 2021 – Investment Strategy Overview
Past performance is no guarantee of future results. RETURN TO TABLE OF CONTENTS
policy support, with an improved investor demand picture (because of the first two factors). All of the above are keeping prices high and the market stable (about $98 and no discernible appreciation from here). However, bank loan flows have proven to be especially volatile as retail investors tend to move out of the asset class once rates stabilize and/or credit conditions deteriorate.
How does the American Rescue Plan Act of 2021 affect the municipal bond market?
The $1.9 trillion American Rescue Plan Act of 2021 (“American Rescue Plan”) will likely prove to be a seminal event for the U.S. municipal bond market over the next few years. The American Rescue Plan provides approximately $350 billion of direct aid to states and local governments, and another $200 billion to other types of municipal bond issuers—school districts, colleges and universities, transit authorities, airports, and hospitals. We believe the aid to states and local governments is especially generous, since according to the U.S. Census Bureau, total 2020 state and local government tax collections actually grew, by $58 billion (3.7%), despite fears to the contrary when the coronavirus crisis first hit the U.S. in March 2020.
We view the American Rescue Plan as positive for municipal credit, as do the rating agencies. In March 2021, Moody’s revised its outlook from negative to stable on various municipal sectors, including states, local governments, higher education and airports, citing federal support from the American Rescue Plan, as well as recent and expected improvements in financial performance. S&P has stable outlooks on states, local governments, airports, school districts, charter schools, mass transit and toll roads.
The market has gained confidence in municipal credit as well. The BBB to AAA general obligation (GO) credit spread has now recovered 84% from its peak widening last spring, while the single-A to AAA GO spread is just 3 bps above its level from the end of February 2020 (Exhibit 10). The difference in yield-to-worst (YTW) between the Bloomberg Barclays High Yield Municipal Index and Investment Grade Municipal Index has also tightened significantly since its peak in 2Q 2020 (Exhibit 11).
Given federal support through the American Rescue Plan and improving credit fundamentals, we expect further credit spread tightening, likely through pre-pandemic levels, over the coming months. Therefore, we believe prudently selected lower-quality munis could potentially provide better return opportunities than higher-quality munis in 2021.
Exhibit 10: Muni Credit Spreads
0
25
50
75
100
125
150
2/28
/20
3/13
/20
3/27
/20
4/10
/20
4/24
/20
5/8/
20
5/22
/20
6/5/
20
6/19
/20
7/3/
20
7/17
/20
7/31
/20
8/14
/20
8/28
/20
9/11
/20
9/25
/20
10/9
/20
10/2
3/20
11/6
/20
11/2
0/20
12/4
/20
12/1
8/20
1/1/
21
1/15
/21
1/29
/21
2/12
/21
2/26
/21
3/12
/21
3/26
/21
Basis Points BBB GO - AAA GO 10 yr A GO - AAA GO 10 yr
GO = general obligation. Source: Municipal Market Monitor (TM3). Data as of March 26, 2021.

20 of 26 April 2021 – Investment Strategy Overview
Past performance is no guarantee of future results. RETURN TO TABLE OF CONTENTS
Exhibit 11: High Yield vs. Investment Grade Muni Index
1/1/2020
2/1/2020
3/1/2020
4/1/2020
5/1/2020
6/1/2020
7/1/2020
8/1/2020
9/1/2020
10/1/2020
11/1/2020
12/1/2020
1/1/2021
2/1/2021
3/1/2021
Yield to Worst (%)
0.00
1.00
2.00
3.00
4.00
5.00
6.00
7.00
IG Muni Index HY Muni Index Difference
Source: Bloomberg. Data as of March 26, 2021. Past performance is no guarantee of future results. Short-term performance shown to illustrate more recent trend.
PORTFOLIO STRATEGIES
Could we be entering a new commodity “super cycle”?
The commodity “super cycle” of 2002 to 2011 followed declines in real prices from the preceding decade. Prices for the Bloomberg Commodity Index, encompassing 23 commodities spanning energy, agriculture, metals and other materials, climbed sharply and steadily. Investor focus turned to coking coal, iron ore, gypsum wallboard and other commodities that were nearly invisible in the glare of the tech bubble that preceded the cycle. While the cycle abruptly reversed in 2008 during the Great Financial Crisis, it actually resumed until finally sliding back in mid-2011 (with several commodity prices exceeded the 2008 highs).11 The great destroyer of these cycles is usually not a short-lived fall-off in demand but a surge in investment channeled into increased capacity.
As the world continues to recover from the pandemic, we see several reasons to expect an upcycle for most commodity prices, even if we are not yet ready to declare it a “super-cycle.” For example, despite the inevitability of electric vehicles, supply and demand for crude oil has tightened from a year ago when West Texas Intermediate (WTI) spot prices briefly traded negative. Drilling in the U.S. is still down over 50% from pre-pandemic levels, while demand is recovering.
How has the global health crisis affected the landscape for sustainable investing and the integration of environmental, social and governance (ESG) data into investments?
The global health crisis has accelerated a “Great Shift” toward stakeholder capitalism;12 highlighting the fundamental interconnectedness among companies and livelihoods of their employees and customers, as well as the communities where they operate.13 As companies navigate uncharted operating environments, first serving a stay-at-home economy and now planning for a reopening, there are economic and policy tailwinds for this shift toward a focus on stakeholders. Companies that emerge from the global health crisis with a sharper focus on the safety and well-being of their workforces and a more nimble ability to innovate in a new normal will likely have a competitive edge versus their peers. Further, renewed calls for racial equality and addressing the unequal impact the
11 Source: Bloomberg. Data as of March 26, 2021.12 Source: “The Great Shift: Shareholder to Stakeholder Capitalism,” Chief Investment Office, September 2020.13 Source: “The Great Shift: Shareholder to Stakeholder Capitalism,” Chief Investment Office, September 2020.

21 of 26 April 2021 – Investment Strategy Overview
Past performance is no guarantee of future results. RETURN TO TABLE OF CONTENTS
pandemic has had on the female workforce, in particular, will push the private sector to do its part along with policymakers to address long-term systemic imbalances as we enter this new frontier. So what does this all mean for investors?
We are entering an age of transparency, with businesses measuring, managing, and reporting on financially material ESG factors in an increasingly sophisticated manner. In the aftermath of the pandemic, consumers may evaluate how companies have responded, and we expect there will be a greater focus on health, renewable energy, clean water and sanitation, and other industries supporting a more sustainable future. A continued focus on the “social” in ESG for companies and countries is expected in a world post coronavirus. This trend will also spur more companies to make commitments around inclusive workforces, the health and well-being of employees, supply chain resilience, and climate change-related goals like net zero emissions by 2050. In our view, this increased transparency trend may allow investors to ascertain differences and hold companies to account on making progress. More comparable information on a range of issues that were previously seen as non-financial but are now appreciated as having real financial impact, should mean that both companies and investors will likely have more information to make capital allocation and investment decisions.
Along with the global health crisis, there is also an increasing recognition that climate change and more frequent incidents of extreme weather are both financial risks and business opportunities. We believe companies that embrace more climate-friendly business models and operations, as well as consumer products and services, are likely to enjoy sustained growth opportunities over the long term. Key investment opportunities pivot around renewable energy (solar and wind), electric vehicles, next-generation batteries, clean technology, energy-efficient electronics and building systems and water/waste management, among other areas. Infrastructure appears to be at the intersection of health and social equality (digital access, financial access and education access as well as good jobs).
ESG factors provide investors with an additional dimension to help identify market risks and potential opportunities, and we believe portfolio strategies in the coming years could allocate more capital to assets backed or underpinned by high-sustainability initiatives.14
Are trends such as product growth expected to continue as we look ahead through 2021, and is there a risk of “green-washing” as more funds claim a sustainable label?
Sustainable investment funds available to U.S. investors grew to a total of 392 this past year, with 71 fund launches. Further, sustainable funds, on average, outperformed conventional funds and indexes in 2020.15 And while the dominant share of ESG investments remains in actively-managed funds, new product launches and inflows, both globally and domestically, are leaning toward passive vehicles—similar to the broader investment industry.16
As ESG continues to go mainstream, there have been some concerns voiced by both regulators and investors over the idea of “green-washing,” meaning funds being repurposed with a sustainable or ESG label or title but without rigorous integration of ESG data into the investment process or evidence of environmental or social impact. We view these questions as a natural development for a maturing market and see them as a support to the trend of converging reporting frameworks and taxonomies.
14 Source: Sustainable Investing Under the New Administration: The ‘S’ in ESG, Chief Investment Office, March 2021.15 Source: Sustainable Funds U.S. Landscape Report: More Funds, More Flows, and Impressive Returns in 2020, Morningstar,
February 10, 2021.16 See glossary for definitions.

22 of 26 April 2021 – Investment Strategy Overview
Past performance is no guarantee of future results. RETURN TO TABLE OF CONTENTS
We are watching global regulatory standards for sustainable funds, notably progress underway in the European Union, and anticipate increasing alignment—which would serve as an important step towards standardization for the overall sustainable fund landscape.
Is caution warranted regarding the potential for higher taxes ahead?
With the passage on March 11 of the $1.9 trillion American Rescue Plan Act of 2021 (the third major stimulus bill and eighth overall with regard to the pandemic), Congress will pivot from addressing pandemic issues to addressing President Biden’s Build Back Better agenda focused on infrastructure measures.
There is bipartisan agreement that we are long overdue for spending on critical infrastructure improvements. There is far less agreement on how to pay for infrastructure spending or even its definition. Democrats are targeting upper income taxpayers and corporations as a means to not only raise substantial taxes to pay for infrastructure, but also as a means for addressing wealth and income inequality. According to Representative Richard E. Neal, Chair of the House Ways and Means Committee, the tax code is the means to “investing in the modern and sustainable infrastructure system we need…” Republicans, on the other hand, are resistant to most tax changes. When it comes to defining infrastructure, the Democrats have a broad agenda that will be marketed under the “infrastructure” label. For instance, President Biden’s advisors are characterizing paid leave, child care subsidies, and other social spending as “human infrastructure.” Republicans have a more traditional and narrow definition. This leaves little room for overlap and a narrow path to a bipartisan bill.
Recently, President Biden formally released part one of his two-part infrastructure spending initiative. Part one, known as the American Jobs Plan of 2021, outlines $2.7 trillion in infrastructure spending over a period of eight years and $1.6 trillion in permanent corporate tax increases. Part two, which is expected in short order, will focus on nontraditional or human infrastructure such as education, childcare and social spending, along with individual income tax increases. The two-part plan is expected to propose spending in the range of $4 trillion after considering certain tax incentives. While we await spending and individual tax provision in part two, we do know the American Jobs Plan includes the following major categories of infrastructure spending:
Exhibit 12: Biden Budget Draft
Clean energy and power
(such as electric vehicle, power infrastructure and certain tax credits) $674 B
Traditional infrastructure
(such as non-electric vehicle, safe-drinking water and broadband) $658 B
Research & Development / manufacturing / workforce $610 B
Safety net spending $400 B
Non-Traditional infrastructure
(such as new homes, schools, child care centers, etc.) $368 B
$2.710 trillion
Source: Macro (data as of April 5, 2021) and White House Fact Sheet (data as of March 31, 2021).
President Biden’s American Jobs Plan of 2021 will be financed, in part, through corporate and individual tax increases. The president has proposed and consistently restated his desire to increase taxes on corporations and upper-income taxpayers. For individuals, those changes are broad in nature, from changes in income tax rates, to Social Security taxes, to estate taxes. For corporations, those changes are outlined in the American Jobs Plan of 2021 and are even broader than those previously proposed during then-candidate Biden’s presidential campaign. The corporate tax changes focus on not only increasing the tax rate to 28%, but also on reinstating a 15% minimum “book income” tax and tightening international tax rules and anti-inversion rules.
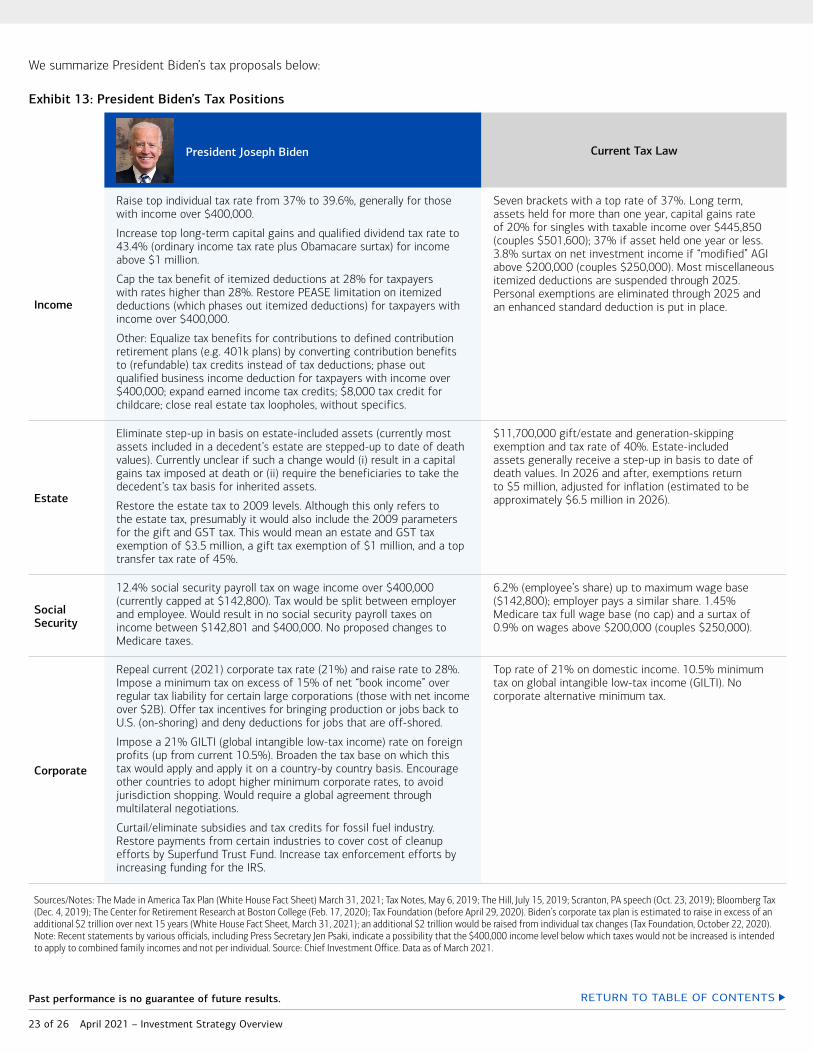
23 of 26 April 2021 – Investment Strategy Overview
Past performance is no guarantee of future results. RETURN TO TABLE OF CONTENTS
We summarize President Biden’s tax proposals below:
Exhibit 13: President Biden’s Tax Positions
President Joseph Biden Current Tax Law
Income
Raise top individual tax rate from 37% to 39.6%, generally for those with income over $400,000.
Increase top long-term capital gains and qualified dividend tax rate to 43.4% (ordinary income tax rate plus Obamacare surtax) for income above $1 million.
Cap the tax benefit of itemized deductions at 28% for taxpayers with rates higher than 28%. Restore PEASE limitation on itemized deductions (which phases out itemized deductions) for taxpayers with income over $400,000.
Other: Equalize tax benefits for contributions to defined contribution retirement plans (e.g. 401k plans) by converting contribution benefits to (refundable) tax credits instead of tax deductions; phase out qualified business income deduction for taxpayers with income over $400,000; expand earned income tax credits; $8,000 tax credit for childcare; close real estate tax loopholes, without specifics.
Seven brackets with a top rate of 37%. Long term, assets held for more than one year, capital gains rate of 20% for singles with taxable income over $445,850 (couples $501,600); 37% if asset held one year or less. 3.8% surtax on net investment income if “modified” AGI above $200,000 (couples $250,000). Most miscellaneous itemized deductions are suspended through 2025. Personal exemptions are eliminated through 2025 and an enhanced standard deduction is put in place.
Estate
Eliminate step-up in basis on estate-included assets (currently most assets included in a decedent’s estate are stepped-up to date of death values). Currently unclear if such a change would (i) result in a capital gains tax imposed at death or (ii) require the beneficiaries to take the decedent’s tax basis for inherited assets.
Restore the estate tax to 2009 levels. Although this only refers to the estate tax, presumably it would also include the 2009 parameters for the gift and GST tax. This would mean an estate and GST tax exemption of $3.5 million, a gift tax exemption of $1 million, and a top transfer tax rate of 45%.
$11,700,000 gift/estate and generation-skipping exemption and tax rate of 40%. Estate-included assets generally receive a step-up in basis to date of death values. In 2026 and after, exemptions return to $5 million, adjusted for inflation (estimated to be approximately $6.5 million in 2026).
Social Security
12.4% social security payroll tax on wage income over $400,000 (currently capped at $142,800). Tax would be split between employer and employee. Would result in no social security payroll taxes on income between $142,801 and $400,000. No proposed changes to Medicare taxes.
6.2% (employee’s share) up to maximum wage base ($142,800); employer pays a similar share. 1.45% Medicare tax full wage base (no cap) and a surtax of 0.9% on wages above $200,000 (couples $250,000).
Corporate
Repeal current (2021) corporate tax rate (21%) and raise rate to 28%. Impose a minimum tax on excess of 15% of net “book income” over regular tax liability for certain large corporations (those with net income over $2B). Offer tax incentives for bringing production or jobs back to U.S. (on-shoring) and deny deductions for jobs that are off-shored.
Impose a 21% GILTI (global intangible low-tax income) rate on foreign profits (up from current 10.5%). Broaden the tax base on which this tax would apply and apply it on a country-by country basis. Encourage other countries to adopt higher minimum corporate rates, to avoid jurisdiction shopping. Would require a global agreement through multilateral negotiations.
Curtail/eliminate subsidies and tax credits for fossil fuel industry. Restore payments from certain industries to cover cost of cleanup efforts by Superfund Trust Fund. Increase tax enforcement efforts by increasing funding for the IRS.
Top rate of 21% on domestic income. 10.5% minimum tax on global intangible low-tax income (GILTI). No corporate alternative minimum tax.
Sources/Notes: The Made in America Tax Plan (White House Fact Sheet) March 31, 2021; Tax Notes, May 6, 2019; The Hill, July 15, 2019; Scranton, PA speech (Oct. 23, 2019); Bloomberg Tax (Dec. 4, 2019); The Center for Retirement Research at Boston College (Feb. 17, 2020); Tax Foundation (before April 29, 2020). Biden’s corporate tax plan is estimated to raise in excess of an additional $2 trillion over next 15 years (White House Fact Sheet, March 31, 2021); an additional $2 trillion would be raised from individual tax changes (Tax Foundation, October 22, 2020). Note: Recent statements by various officials, including Press Secretary Jen Psaki, indicate a possibility that the $400,000 income level below which taxes would not be increased is intended to apply to combined family incomes and not per individual. Source: Chief Investment Office. Data as of March 2021.
24 of 26 April 2021 – Investment Strategy Overview
Past performance is no guarantee of future results. RETURN TO TABLE OF CONTENTS
Because of the wide gap between Democratic and Republican views on spending and financing an infrastructure bill, the likely route would be to move the American Jobs Act through a special parliamentary process (budget reconciliation) that would require only Democratic votes, as was done with the recent stimulus package. After first attempting to go down a bipartisan path—which has a nearly certain chance of failure—Congress will likely work on a budget resolution during early summer. The text of legislation will then follow and passage of tax changes could occur this fall. Sentiments shared by Treasury Secretary Yellen and other senior appointees of President Biden indicate a preference to refrain from a retroactive change. This would mean tax changes could take effect January 1, 2022 (though an earlier date is possible, as noted below).
What taxes should investors be thinking about?
Capital Gains and Capital Transactions—Tax changes bring tax and investment planning to the top of investors’ minds. Among the decisions most asked about are the implications of an increase in the federal capital gain tax. Should I consider selling now while rates are low? Or, should I consider keeping more of my investments working and sell later when capital gain rates may be much higher? There likely would be a strong effort to eliminate the current preferential tax rates for qualified dividends and long-term capital gains (a current top rate of 20%), at least for taxpayers with over $1 million in gross income. This is a Biden proposal and has been a long-standing priority among some Democrats, including the current chair of the Senate Finance Committee. Such a change not only raises revenue but also addresses income and wealth inequality issues. Biden’s proposed rate for capital gains and dividends of 39.6%, could be a step too far for some legislators. This could result in a compromise and a more moderate rate increase to perhaps 28%. While timing and sentiment could result in a prospective date for many tax changes, capital gain rate changes could be more nuanced than regular tax rate changes and therefore it is unclear when any change would be effective. There is a history of not imposing capital gain tax rate increases on a retroactive basis. Past changes were generally effective at the beginning of a subsequent tax year or on the date of introduction or enactment of a proposed tax bill. However, it appears unlikely a retroactive increase in capital gain rates will occur.
Estate Taxes and Estate Planning—Another common planning question centers on potential reductions in the federal estate tax exemption and whether or not to use the current exemption before a potential reduction takes effect. There will be a concerted effort to reduce the estate, gift and generation-skipping tax (GST) exemptions (currently set at $11.7 million per person) and perhaps to increase the estate, gift and GST tax rates (currently set at 40%). Democrats have previously sought to return transfer taxes to 2009 parameters, with an estate exemption of $3.5 million, a gift exemption of $1 million and a top estate tax rate of 45%.
That effort is already underway with the recent introduction of two estate tax bills: the ‘‘Sensible Taxation and Equity Promotion Act of 2021” and the “For the 99.5 Percent Act,” both of which propose dramatic changes to estates tax, even beyond President Biden’s proposals.
A prospective effective date—for instance, January 1, 2022—is possible for changes in estate/gift tax exemptions and rates. There is an inherent unfairness in changing the tax rules retroactively for gifts, which could actually have a punitive effect on those who have already undertaken planning. However, because no one can predict exactly what Congress will do, taxpayers are encouraged to explore their options now, consider flexible planning and take action if estate planning is consistent with their near- and long-term financial outlook.
The Chief Investment Office does not provide tax advice.
25 of 26 April 2021 – Investment Strategy Overview
GlossaryActive Management is a portfolio management strategy where the investment manager makes specific investments with the goal of outperforming an investment benchmark index or target return.
Alpha is a measure of investment returns beyond those of the overall stock market. It is intended to capture the outperformance of a security.
Modern Monetary Theory (MMT) is an approach to macroeconomics based on the novel idea that deficits and debt aren’t necessarily detrimental to a country that controls its own currency.
Passive management is a style of management associated with mutual and exchange-traded funds where a fund’s portfolio is intended to mirror the performance of a market index.
The Phillips curve is an economic concept stating that inflation and unemployment have a stable and inverse relationship.
Index DefinitionsSecurities indexes assume reinvestment of all distributions and interest payments. Indexes are unmanaged and do not take into account fees or expenses. It is not possible to invest directly in an index.
Indexes are all based in dollars.
The Bloomberg Barclays Municipal Yield Index is market value-weighted and designed to measure the performance of U.S. dollar-denominated high-yield municipal bonds issued by U.S. states, the District of Columbia, U.S. territories and local governments or agencies.
The Bloomberg Commodity Index reflects commodity futures price movements, and is calculated on an excess return basis. The index rebalances annually weighted 2/3 by trading volume and 1/3 by world production. Weight-caps are applied at the commodity, sector and group level for diversification.
The Bloomberg Dollar Spot Index tracks the performance of a basket of 10 leading global currencies against the U.S. Dollar.
The MSCI USA Index measures the performance of the large and mid-cap segments of the U.S. stock market. The index covers approximately 85% of the free float-adjusted market capitalization in the US.
The MSCI World ex-US Index captures the capitalization of large- and mid-sized companies across 22 of 23 developed market countries.
Personal consumption expenditures (PCEs) are imputed household expenditures defined for a period of time. Personal consumption expenditures support the reporting of the PCE Price Index, which measures price changes in consumer goods and services exchanged in the U.S. economy.
The Russell 1000 Index is a stock market index that is used as a benchmark by investors. It is a subset of the larger Russell 3000 Index and represents the 1000 top companies by market capitalization in the United States.
The Russell 2000 Index is comprised of 2,000 small-capitalization companies. The index is frequently used as a benchmark for measuring the performance of small-cap stocks.
The Russell 1000 Growth Index refers to a composite that includes large and mid-cap companies located in the United States that also exhibit Growth stock characteristics.
The Russell 1000 Value Index seeks to track the investment results of an index composed of large- and mid-capitalization U.S. equities that exhibit Value stock characteristics.
The S&P 500 includes a representative sample of 500 leading companies in leading industries of the U.S. economy. Although the index focuses on the large-cap segment of the market, with approximately 75% coverage of U.S. equities, it is also a proxy for the total U.S. stock market.
26 of 26 April 2021 – Investment Strategy Overview
Important DisclosuresOpinions and market data are current as of April 12, 2020 unless otherwise specified.
This material does not take into account a client’s particular investment objectives, financial situations or needs and is not intended as a recommendation, offer or solicitation for the purchase or sale of any security or investment strategy. Merrill offers a broad range of brokerage, investment advisory (including financial planning) and other services. There are important differences between brokerage and investment advisory services, including the type of advice and assistance provided, the fees charged, and the rights and obligations of the parties. It is important to understand the differences, particularly when determining which service or services to select. For more information about these services and their differences, speak with your Merrill financial advisor.
Investing involves risk, including the possible loss of principal. Past performance is no guarantee of future results.
Bank of America, Merrill, their affiliates, and advisors do not provide legal, tax, or accounting advice. Clients should consult their legal and/or tax advisors before making any financial decisions.
The Chief Investment Office (CIO) provides thought leadership on wealth management, investment strategy and global markets; portfolio management solutions; due diligence; and solutions oversight and data analytics. CIO viewpoints are developed for Bank of America Private Bank, a division of Bank of America, N.A., (“Bank of America”) and Merrill Lynch, Pierce, Fenner & Smith Incorporated (“MLPF&S” or “Merrill”), a registered broker-dealer, registered investment adviser and a wholly owned subsidiary of Bank of America Corporation (“BofA Corp.”). This information should not be construed as investment advice and is subject to change. It is provided for informational purposes only and is not intended to be either a specific offer by Bank of America, Merrill or any affiliate to sell or provide, or a specific invitation for a consumer to apply for, any particular retail financial product or service that may be available.
The Global Wealth & Investment Management Investment Strategy Committee (GWIM ISC) is responsible for developing and coordinating recommendations for short-term and long-term investment strategy and market views encompassing markets, economic indicators, asset classes and other market-related projections affecting GWIM.
BofA Global Research is research produced by BofA Securities, Inc. (“BofAS”) and/or one or more of its affiliates. BofAS is a registered broker-dealer, Member SIPC, and wholly owned subsidiary of Bank of America Corporation.
All recommendations must be considered in the context of an individual investor’s goals, time horizon, liquidity needs and risk tolerance. Not all recommendations will be in the best interest of all investors.
Asset allocation, diversification and rebalancing do not ensure a profit or protect against loss in declining markets.
Investments have varying degrees of risk. Some of the risks involved with equity securities include the possibility that the value of the stocks may fluctuate in response to events specific to the companies or markets, as well as economic, political or social events in the U.S. or abroad. Small cap and mid cap companies pose special risks, including possible illiquidity and greater price volatility than funds consisting of larger, more established companies. Bonds are subject to interest rate, inflation and credit risks. Municipal securities can be significantly affected by political changes as well as uncertainties in the municipal market related to taxation, legislative changes, or the rights of municipal security holders. Income from investing in municipal bonds is generally exempt from federal and state taxes for residents of the issuing state. While the interest income is tax-exempt, any capital gains distributed are taxable to the investor. Income for some investors may be subject to the Federal Alternative Minimum Tax. Investments in high-yield bonds (sometimes referred to as “junk bonds”) offer the potential for high current income and attractive total return, but involves certain risks. Changes in economic conditions or other circumstances may adversely affect a junk bond issuer’s ability to make principal and interest payments. Treasury bills are less volatile than longer-term fixed income securities and are guaranteed as to timely payment of principal and interest by the U.S. government. Mortgage-backed securities are subject to credit risk and the risk that the mortgages will be prepaid, so that portfolio management may be faced with replenishing the portfolio in a possibly disadvantageous interest rate environment. Investments in foreign securities (including ADRs) involve special risks, including foreign currency risk and the possibility of substantial volatility due to adverse political, economic or other developments. These risks are magnified for investments made in emerging markets. Investments in a certain industry or sector may pose additional risk due to lack of diversification and sector concentration. Investments in real estate securities can be subject to fluctuations in the value of the underlying properties, the effect of economic conditions on real estate values, changes in interest rates, and risk related to renting properties, such as rental defaults. There are special risks associated with an investment in commodities, including market price fluctuations, regulatory changes, interest rate changes, credit risk, economic changes and the impact of adverse political or financial factors.
Impact investing and/or Environmental, Social and Governance (ESG) managers may take into consideration factors beyond traditional financial information to select securities, which could result in relative investment performance deviating from other strategies or broad market benchmarks, depending on whether such sectors or investments are in or out of favor in the market. Further, ESG strategies may rely on certain values based criteria to eliminate exposures found in similar strategies or broad market benchmarks, which could also result in relative investment performance deviating.
Nonfinancial assets, such as closely-held businesses, real estate, oil, gas and mineral properties, and timber, farm and ranch land, are complex in nature and involve risks including total loss of value. Special risk considerations include natural events (for example, earthquakes or fires), complex tax considerations, and lack of liquidity. Nonfinancial assets are not appropriate for all investors. Always consult with your independent attorney, tax advisor, investment manager, and insurance agent for final recommendations and before changing or implementing any financial, tax, or estate planning strategy.
© 2021 Bank of America Corporation. All rights reserved.