EERCThe Bhoj Wetland located in the heart of the city of Bhopal is one of the 16 wetlands of...
227
EERC Economic Valuation of Bhoj Wetlands for Sustainable Use Madhu Verma Indian Institute of Forest Management, Bhopal Theme: Wetlands and Biodiversity EERC Working Paper Series: WB-9 MOEF IGIDR WORLD BANK
Transcript of EERCThe Bhoj Wetland located in the heart of the city of Bhopal is one of the 16 wetlands of...

EERC
Economic Valuation of Bhoj Wetlands for Sustainable Use
Madhu Verma
Indian Institute of Forest Management, Bhopal
Theme: Wetlands and BiodiversityEERC Working Paper Series: WB-9
MOEF IGIDR WORLD BANK

ECONOMIC VALUATION OF BHOJ WETLAND FOR SUSTAINABLE USE
MADHU VERMA
With the research support of
NISHITA BAKSHI RAMESH P.K. NAIR
Under
World Bank Aided India: Environmental Management Capacity Building Technical Assistance Project
Co-ordinated by EERC Implementation Cell at Indira Gandhi Institute for Development
Research, Mumbai
INDIAN INSTITUTE OF FOREST MANAGEMENT BHOPAL
March, 2001

Project Team Dr. Madhu Verma, the Principal Investigator, is an Associate Professor in the faculty
area of Forest Resource Economics & Management, Indian Institute of Forest
Management, (IIFM), Bhopal. She may be contacted at:
Indian Institute of Forest Management
Post Box: 357, Nehru Nagar
Bhopal- 462 003, India
Tel: 91 755 775716
Fax: 91 755 772878
Email: [email protected]
Ms. Nishita Bakshi worked as Senior Research Fellow (Environmental Economics) in
the project. She is currently doing her Ph.D. in Agriculture and Applied Economics at
the Virginia Polytechnic Institute and State University. She may be contacted at:
Dept. of Agricultural & Applied Economics
321 Hutcheson Hall
Virginia Tech
Blacksburg, VA 24061-0401
Email: [email protected]
Mr. Ramesh Nair worked as Senior Research Fellow (Limnology) in the project. He
is currently doing his Ph.D. at the Department of Limnology, Barkatullah University,
Bhopal. He may be contacted at:
Dept. Of Limnology
Barkatullah University
Bhopal- 462 026
Email: [email protected]
Cover Page- Bhoj Wetland in a cloudy Day with Takia Island in backdrop. Back Page – Upper Lake at sunset Courtesy Central Colour Lab, Bhopal.

Black & White Photo- The magnificent Upper Lake with the then amazing Yacht Club – Captured in Camera in 1961 Courtesy Mr. Prem Verma, Bhopal

i
PREFACE
Wetlands are the resources that interface between land & water systems. They are
amongst the most productive & biologically rich ecosystems and are also amongst
the most endangered. Wetlands include lakes, ponds, mangroves, swamps,
marshes and coral reefs. Wetlands are complex ecosystems that are responsible for
providing a wide array of unmeasured goods and services that benefit people. The
livelihoods of millions of people in India are also dependent on these ecosystems.
Despite all these benefits from the wetlands they have been mismanaged and are
often neglected. Many decision-makers and even so called stakeholders think of
wetlands as ‘wastelands’. These so-called wastelands are continued to be drained,
depleted at an alarming rate through conversion to what some would term as ‘better’
alternate use like agriculture, industrial activity and residential housing development.
At many a places they have been converted into a cesspool as they are considered
as ‘most accessible sink’ for throwing various wastes.
Wetlands, like many other common property resources are openly accessible to all.
Every one claims a stake in their use, but few are willing to pay for the extractive
use. In India many wetlands are in urban areas such as in Bhopal, Hyderabad,
Srinagar, Udaipur, Nainital, Ooty, Thane. These urban wetlands are constantly
degrading on account of various anthropogenic activities like urban development,
encroachment, flow of domestic sewage, pesticides, fertilizers and industrial
effluents, over fishing, boating, infestation with aquatic weeds and eutrophication,
disturbances from excessive recreational activities and tourism, diversion of water
from irrigation, domestic use or industrial uses.
In many cities like Bhopal wetlands originated as manmade lakes primarily to supply
drinking water to the city’s population and over the years they attained features of
wetland and started providing multiple functions like commercial fishing, recreation
etc. It has so happened that multiple benefits are extracted but little attention has
been paid on the maintenance of these wetlands. In this context it becomes imperative to generate quantitative information on the economic benefits from wetlands, which could serve as a powerful tool to influence decision-making.

ii
There is need to develop a comprehensive framework to implement a long-term
programme for wetland valuation and policy responses.
The Bhoj Wetland located in the heart of the city of Bhopal is one of the 16 wetlands
of National Importance in the country. It is unique in its own way since it is an ancient
man-made reservoir and provides drinking water to nearly 45 per cent of the city’s
population of 15,00,000. It also provides a number of other direct and indirect
benefits to the population living in the city. The growing population pressures and
human interference have led to degradation of this Wetland. There are numerous
threats, which face this fragile urban ecosystem and threaten its very existence in
fact.
The current research project ‘”Economic Valuation of Bhoj Wetland for Sustainable
Use” attempts to analyse the factors causing Bhoj Wetland degradation; nature and
extent of injury to the wetland; How does this degradation impact on the uses that
citizens of Bhopal extract out of it ? What cost is borne by the users on account of
degradation in terms of productivity losses and health impacts? How feedback can
be taken from these impacts to revise or develop management policies and to seek
participation of stakeholders to check wetland degradation or losses? What is the
willingness of the people to pay to conserve this wetland?
It was realised that economic valuation need to be attempted to make people aware
of the worth of various benefits as well as losses from the wetland and valuation
results so obtain could be used to counter wetland degradation. It is high time that
necessary steps should be taken both in terms of physical interventions (prevention
and restoration activities) and economic instruments such that stream of benefits
from Bhoj wetland continue to be available in future as well.
Though the urban wetlands are mandated under the Indian Constitution to be
maintain by the Municipality but there is an urgent need to involve various
stakeholders and resort to ‘collaborative or integrated management’ and ‘sustainable
and equitable use’.

iii
Plan of Study
The report is divided into two parts. The first two chapters of Part I provide an
account of the functions & values of wetlands (Chapter I); techniques of valuing
natural resources and wetlands in particular (Chapter II). Part II begins with
highlighting the importance of water resources and introduces the study area i.e. the
Bhoj Wetalnd, its features, user & threats and elaborates the objectives (Chapter III);
the report then discusses the project methodology and particularly valuation
techniques applicable to wetland valuation (Chapter IV); ecosystem modelling of
Bhoj Wetland using water quality parameters to project future scenarios and
matching policy interventions (Chapter V); use values generated through direct and
indirect valuation approaches (Chapter VI); and recommends strategies for
sustainable management. The annexures at the end of the report contains ward
wise population of Bhopal city (Annexure I); questionnaire used for conduction of
CVM & Hedonic Pricing surveys (Annexure II); details of stakeholders workshop
seeking their perceptions on management issues of Bhoj Wetland (Annexure III).

iv
Acknowledgements
This study was made possible by the financial assistance from the Environmental
Economics Research Assistance Cell (EERC) of the World Bank Aided India:
Environmental Management Capacity Building Technical Assistance Project
implemented by the Ministry of Environment of Forest, Govt. of India through the
Indira Gandhi Institute for Development and Research, Mumbai.
I wish to also thank EERC for continuously providing us with the comments of
various experts and timely availability of financial assistance to smoothly carryout our
research work. My deep appreciation to all those authors whose writings are quoted
in the report which made my team understand wetlands problems and valuation
techniques.
I have been specially influenced by the work of Dr. Gopal K. Kadekodi & Dr. S. C
Gulati on “Root Causes of Biodiversity Losses in Chilika Lake: Reflections on Socio
Economic Magnitudes” which greatly helped us in analysing wetland management
issues and developing our System’s Dynamics model for the Bhoj wetland. I am
specially indebted to Dr. Gopal K. Kadekodi (Research professor, CMDR, Dharwad)
who was retained as a consultant in the project & who immensely helped us in the
developing the ecological model using STELLA software. I am also thankful to him
for allowing my team to make use of DEFINITE software at CMDR, Dharwad for
Multri Criteria Analysis for property valuation. I am also thankful to Ms. Aparna
Nayampalli (Research Associate, CMDR, Dharwad) for helping us throughout in
model calibration and validation. I wish to extend my heart felt thanks to Dr.
A.J.James, (Environmental Consultant,New Delhi) for extending great help to us in
learning and administering CVM in our survey and his valuable input in stakeholders
workshop and supplying great deal of literature. I am grateful to Dr. David Simpson
(Natural Resource Economist, Resources for Future, Washington, USA) for giving
his valuable time to come down to Bhopal and for his input for helping us to make
use of Hedonic Pricing technique of valuation. I also express my gratitude to Dr.
Kanchan Chopra (Prof. IEG, Delhi) for her guidance and comments throughout the
project. Dr. T. R. Manoharan (Research Associate, RIS. New Delhi) deserves thanks
for extending literature support and comments. I am thankful to Dr. C.L.Trisal

v
(Regional Coordinator, Wetlands International, New Delhi) for literature support and
his comments on designing methodology. Experts at Wetlands Division, WWF
Nature India, New Delhi helped us with literature and views. Dr. C.K.Vashney (Prof.
JNU, Delhi) deserves thanks for giving his valuable comments. I am thankful to all of
them for sparing valuable time for this study.
Understanding about the Bhoj Wetland’s complex issues could be possible only with
the help of Bhoj Wetland Project Office at Bhopal. I wish to thank successive Project
Directors of BWL Project Mr. A.K.Mukherjee and Mr. Raj Kamal who have been
immensely supportive. Dr. Sanjeev Sachdeva, Dr.P.K. Nandi and Dr.S.M.Mishra
(Senior Rersearch Officers, BWL Project Office and EPCO Laboratory) for their time
to time discussions and providing us with details of BWL restoration works and
information on various parameters. I also express my gratitude to Mr. Anthony Disa
(Commissioner, M.P.Housing Board), Mr. Santosh Mishra (Land Settlement Officer)
and Mr. Inderdeep Guliyani (Property Dealer) for their input and comments regarding
property pricing structure in Bhopal city.
Two workshops were conducted during the project with the stakeholders,
Corporators and concerned line department officials to seek their perception on the
management issues of the Bhoj Wetland. I wish to acknowledge the support of Smt.
Vibha Patel (Mayor-in-Council, Bhopal City), Dr. Satyanand Mishra (Principal
Secretary, Housing and Environment, Govt. of M.P.), Dr. D.P.Tiwari (Commissioner,
BMC), Dr. G.K.Vyas (Health Officer), Shri Majid Khan( City Engineer, PHED),
Corporators of various wards of Bhopal Municipal Corporation, representatives from
washermen, fishermen communities, experts from Limnology Department,
Barkatullah University, Shri Abdul Jabbar (Gas Peedit Mahila Morcha, Bhopal), Shri
Satisnath Sarangi (Sadbhawna Trust, Bhopal) and other representatives from
various NGOs for actively participating in the workshop and helping us to extract
major threats and the management issues. I am thankful to media persons for giving
coverage to the workshop deliberations as well as about our overall project in news
papers, television and radio.
A ‘Group Focal Meeting’ was organised in Delhi to invite comments of experts on
valuation techniques proposed to be used in the project for which I am thankful to Dr.
Kanchan Chopra (Professor IEG, Delhi), Dr. M.N.Murthy (Professor,IEG, Delhi),

vi
Dr.M.Golder (Professor, IEG, Delhi), Dr. A.J.James ( Environmental Consultant,
New Delhi), Dr. Smita Mishra (Consultant, World Bank) and Dr. Pushpam Kumar
(Reader, IEG, Delhi) for their participation, critical evaluation of valuation techniques
& suggestions thereof.
During the length of the project the team at IIFM had the opportunity to interact a
large number of experts during the midterm review workshop of the first phase
EERC projects in Bangalore (December,1999). This workshop provided very useful
inputs to shape up our study in more focused manner. While carrying out the project
work, I got an opportunity to attend the “International Symposium on Transdiciplinary
Approaches” to Ecosystem Health organised by International Society for Ecosystem
Health at Brisbane, Australia (July, 2000) and to make a presentation regarding our
project work. I received comments of many international experts which greatly
helped in making effective use of the information collected during the project. I am
deeply indebted to Mr.Delmar Blasco (the Secretary General) & Mr. Dewight Peck,
(Executive Assistant for Communication) of the Ramsar Bureau, Glad, Switzerland
for sponsoring my within Australia trip to attend this conference and also putting a
news item pertaining to the presentation on the Ramsar website (August 2000 News
Bulletin). While completing this project I also had on opportunity to attend the “Beijer
Research Seminar on Environmental Economics” at Dhulikhel, Nepal sponsored &
organised by the Beijer Institute, Stockholm, Sweden and to present our paper on
“Total Economic Valuation of Bhoj Wetland for Sustainable Use”. I wish to
acknowledge the valuable comments of Dr. Karl-Goran Mailer (Beijer Institute,
Stockholm, Sweden), Dr. Partha Das Gupta (Cambridge University, Cambridge,
U.K.), Dr. Jeffery Vincent (Harvard Institute of International Development, Boston,
USA), Dr. Sara Aniyer (Beijer Institute, Stockholm, Sweden), Dr. Priya Shyam
Sunder( World Bank, Washington, USA) and members from academic institutions
of India, Pakistan, Bangladesh, Nepal & Srilanka who attended the seminar. We
benefited immensely from the above mentioned workshops and the notions of
value, analysis and interpretation that entered into this work stand testimony to this
interaction.
Work of this proportion & diversity is not possible without constant support of
committed researchers. I wish to put on record the untiring work and committed

vii
efforts of Ms. Nishita Bakshi (Senior Research Fellow, Environmental Economics)
and Mr. Ramesh P.K. Nair (Senior Research Fellow, Limnology) during the entire
length of the project. They have been very enthusiastic in carrying out the whole
project and giving enormous ideas through exhaustive discussions. In particular, I
marvel on their efforts made in the field to collect primary information, sometimes in
the face of heavy odds. They proved to be an asset to me.
The primary survey of the project team was augmented by young researchers hired
specially for the CVM and Hedonic pricing survey. I am grateful to Ms. Sonali
Mistery, Mr. Manish Zadgaonkar, Ms. A. Preeti, Ms. Shikha Madnani, Mr. Pankaj
Singh, Mr. Dinesh Dongre, Ms. Urvashi Singh, Ms. Anubhuti Sharma, Mr. Girish
Arora and Mr. Loveson Samuel for their efforts in carrying out the survey and
compiling the collected data. The team at IIFM also interacted with many
International Experts through email and sought their views on methodology. In this
regard I would like to express my deep gratitude to Dr. John Loomis, Colorado State
University, Dr. Richard C. Bishop, Wisconsin, Madison, Dr. Alan Randall, Ohio State
University, Dr. Jason F. Shogren, Wyoming University and Dr. Richard Carson,
University of California, San Diego for taking out their valuable time to read our
project details and questionnaire for survey & giving comments.
I am especially grateful to Dr. Charles Perrings, Professor, University of York, U.K.
for helping us constantly through his comments and constructive suggestions to
come out with more practical approach for wetland valuation. I want to thank my
colleagues and professional acquaintances who knowingly and unknowingly, have
inspired me and provided their valuable inputs in conducting this study. I would also
like to acknowledge Central Colour Lab, Bhopal in providing as with some very good
professionally taken pictures of the Bhoj Wetland for their use in the report. My
successive stenographers Shri. Sheikh Aslam and Shri T.K.Patro deserve thank for
their willingness to help.
I also take this opportunity to express my sincere thanks to the project committee
members present during the Final Review Workshop on January 05, 2001 at IGIDR,
Mumbai. Dr. Jyoti Parikh, Dr. Kirit Parikh, Dr. Kanchan Chopra, Dr. Robin Mukerji,
Dr. M.S.Murthy, Dr. Sudarshan Iyengar for their valuable comments & follow up
comments of the peer reviewer which have been duly incorporated in the final report.

viii
I was greatly benefited from discussion and interaction with other Principal
Investigators present during the workshop.
The project could not have been possible without the active interest of Dr. Ram
Prasad, Director, IIFM. He has been immensely supportive both academically and
administratively. I appreciate his unstinting co-operation during the course of this
study. Finally I extend my deep gratitude to Dr. Jyoti Parikh, Chairperson, EERC and
Senior Professor, Indira Gandhi Institute of Development Research for extending all
possible help for smoothly carrying out this work.
March 21, 2001 Madhu Verma

ix
CONTENTS Page Preface i Chapter I Wetlands: Functions and Values 1 Chapter II Economic Valuation of Natural Resources and Wetlands 33
in Particular Chapter III Introduction and Objectives of the Study 96 Chapter IV Methodology for Economic Valuation of Benefits from 112
the Bhoj Wetland Chapter V Ecosystem Modelling of Bhoj Wetland Using Water 122
Quality Parameters Chapter VI Use Value of Bhoj Wetland: Production Function, 132
CVM and Hedonic Pricing Approach Chapter VII Conclusions and Recommendations for Sustainable 169
Management Strategies Glossary 180 Bibliography 183 Annexures Annexure I Ward wise Population Details of Bhopal City Annexure II Questionnaire for Conduction of CVM and
Hedonic Pricing Survey Annexure III Details of One Day Workshop for Seeking
Stakeholder’s Perception on Management Issues of the Bhoj Wetland
Annexure IV Maintenance of Works (Annual Cost) Annexure V(a)(b) Structure & functions of Bhoj Wetland Management
Society
PART: I STATUS PAPER ON WETLANDS: FUNCTIONS, VALUES AND VALUATION
PART II: ECONOMIC VALUATION OF BHOJ WETLAND
x
LIST OF TABLES
Table 1.1 - Potential Wetland Benefits: Existence Indicators Table1.2 - Selected Impacts of Development in River basins in Asia and the
Pacific Table 1.3 - Area of Wetlands in India Table 1.4 - Lakes under NLCP for intensive conservation and management Table 2.1 - Classification of Total Economic Value for Wetlands
Table 2.2 - Typology of Potential Response Effect Biases in CV Studies Table 2.3 - Review of Valuation Studies Table.3.1 - Changes in population of Bhopal Table 3.2 – Salient Features of Upper and Lower Lakes of Bhopal Table 3.3 – Area of Wetland under Weeds Table 5.1 - Primary Water Quality Criteria
Table 5.2 - Compound Growth Rates of Selected Parameters in 1992 using1985 as base year (for the Upper Lake)
Table 5.3- Compound Growth Rates of Selected Parameters in 1999 using1993 as base year (for the Upper Lake)
Table 5.4 -Compound Growth Rates of Selected Parameters in 1999 using1993 as base year (for the Lower Lake)
Table 5.5- Seasonal data of limnological parameters at various sampling stations of Bhoj wetland in 1999
Table 5.6- Elasticity Matrices of Ecological Parameters of Pre-Restoration stage (Upper Lake)
Table 5.7-Elasticity Matrix of limnological parameters of ongoing restoration stage (Upper Lake)
Table 5.8- Elasticity Matrix of limnological parameters of ongoing restoration stage (Lower Lake)
Table 5.9 - Simulation run results of pre restoration condition of Upper Lake Table 5.10- Simulation run results of ongoing restoration condition of Upper
Lake Table 5.11-Simulation run results of ongoing restoration condition of Lower
Lake Table 6.1- Tourist inflow to the Upper Lake and revenue figures for the
MPTDC for the year April 1999 to May 2000 Table 6.2- Reported Cases of Water Borne Diseases in the Bhopal City Table 6.3- Costs incurred in household water purification techniques Table 6.4- Bidding Format of the CVM questionnaire Table 6.5 - Value of variables in the Equations Table 6.6 - Mean Willingness to pay voluntarily and in the form of tax Table 6.7 - WTP as per income Table 6.8 - WTP as per the length of residence Table 6.9- WTP as per the frequency of visits
Table 6.10 - WTP as per concern of the people about pollution as a problem Table 6.11- WTP as per the education level of the people Table 6.12 -WTP as per the occupation of the people

xi
Table. 6.13- WTP according to distance from the lakes Table 6.14 - Estimated WTP for entire city Table 6.15 - Ranking of problems facing the country Table 6.16- Ranking of various environmental problems Table 6.17- Ranking of various services obtained from the Bhoj Wetland Table 6.18- Ranking of various threats to the Bhoj Wetland Table 6.19- Ranking of various factors considered while buying property Table 6.20- Estimation results of hedonic pricing Table 6.21- Estimation of Economic Values of Bhoj Wetland
(Annual for 1999-2000)
LIST OF FIGURES
Fig 2.1- Categories of Economic Values Attributed to Environmental Assets (With Examples from a Tropical Forest)
Fig 2.2 - Valuation Methods Fig: 2.3 - Physical linkage methods. Fig .2.4 - Framework for Assignment of Value to Objects Fig..3.1- Map showing the location of Bhoj Wetland
Fig.3.2- Maps of the Bhopal City since the formation of the Upper Lake one thousand years back
Fig 5.1 - Conceptual Model of the Causes, Impact & Feedback Control Strategy –Bhoj Wetland
Fig.5.2- Ecosystem Model For Bhoj Wetland Using Water Quality Parameters Fig.5.3 - Map of Bhoj Wetland showing sampling stations Fig. 6.1- General Principles for Cost of Water
LIST OF PLATES:
Plate.1.1- Panoramic view of Upper Lake of Bhoj Wetland Plate.3.1- Pumping Station at Kamala Park (Upper Lake) Plate3.2.- Fishing activities in Upper Lake Plate.3.3.-Yacht club at Upper Lake Plate3.4. -A siltation point at Upper Lake Plate 3.5 -Trapa Cultivation at Upper Lake
Plate3.6.- Encroachment in the lake area, Upper Lake Plate3.7. -Weed infestation in Upper lake
Plate.5.1 -Deepening and widening of spill channel Plate5.2. -Plantation site under Afforestation Program Plate 5.3.-Gabien structure near Lower Lake Plate5.4 - Solid waste collection bins at Gandhi Medical College

xii
LIST OF GRAPHS
Graph.5.1- Graph showing changes of various Limnological parameters of
pre restoration condition of Bhoj Wetland. Graph 5.2- Graph showing changes of various Limnological parameters of
pre restoration condition of Bhoj wetland. Graph 5.3- Graph showing changes of various Limnological parameters of
Pre-restoration condition of Upper Lake. Graph5.4- Graph showing changes of various Limnological parameters of
ongoing restoration condition of Upper Lake Graph5.5- Graph showing changes of various Limnological parameters of
ongoing restoration condition of Upper Lake Graph5.6- Graph showing changes of various Limnological parameters in
comparison with population changes of ongoing restoration condition of Upper Lake
Graph.5.7- Graph showing changes of various Limnological parameters of ongoing restoration condition of Lower Lake
Graph.5.8- Graph showing changes of various Limnological parameters ofongoing restoration condition of Lower Lake
Graph 6.1- Graph showing Willingness to Pay As Per Income Graph 6.2- Graph showing Willingness to Pay As per the Length of Residence Graph 6.3 -Graph showing WTP as per Frequency of Visit Graph 6.4- Graph showing WTP as per the Education Level Graph 6.5- Graph showing WTP as per Occupation
Graph 6.6- Graph showing WTP according to Distance Graph 6.7- Graph showing Drinking Water Sources in Bhopal City Graph 6.8- Graph showing Water purification Techniques followed in Bhopal city Graph 6.9- Graph showing Frequency of Visits to the Upper and Lower Lakes

The Magnificent Upper Lake with the then Amazing Yacht Club – Captured in Camera in 1961

NNNaaatttuuurrreee nnneeevvveeerrr gggiiivvveeesss aaannnyyyttthhhiiinnnggg tttooo aaannnyyyooonnneee;;; eeevvveeerrryyyttthhhiiinnnggg iiisss sssooolllddd... IIIttt iiisss ooonnnlllyyy iiinnn ttthhheee aaabbbssstttrrraaaccctttiiiooonnn ooofff iiidddeeeaaalllsss ttthhhaaattt ccchhhoooiiiccceee cccooommmeeesss wwwiiittthhhooouuuttt cccooonnnssseeeqqquuueeennnccceee...
--- RRaallpphh WWaallddoo EEmmeerrssoonn

1
CHAPTER I : WETLANDS: FUNCTIONS AND VALUES 1.1 Definition
Wetlands are ubiquitous and can be found in all regions and climates. The term
‘Wetland’ came into use in 1970s and was soon generally accepted. Wetlands may
be defined as habitats were the water table is situated at or near the ground surface,
bearing vegetation adapted to more or less continuous water logging. Wetlands form
a buffer between waterways and commercial, residential and agricultural lands. They
are complex natural processes and contribute to overall order and stability of the
ecosystem.
The Ramsar Convention defines wetlands as: “Areas of marsh, fen, peatland, or water whether natural or artificial, permanent or temporary, with water that is static or flowing, fresh, brackish or salt, including areas of marine water, depth of which at low tide does not exceed six meters” and may include “riparian and
coastal zones adjacent to the wetlands or islands or bodies of marine water deeper
than six meters at low tide lying within”. (IUCN1971)
Wetlands occupy an estimated 6 per cent of the world’s land surface (Mitch and
Gosselink,1993). Tropical wetlands, in particular are on the whole poorly understood
and yet collectively they represent some of the most important areas of the World’s
wetlands. Coupling of sound management policy to the scientific understanding of
how wetlands work and what goods they provide and services they perform is
essential if rapidly diminishing ecosystems are to be maintained for the future.
Wetlands are very important ecosystems, providing human societies with essential
and highly valuable life supporting functions (Odum, 1989). Monetary valuation of
wetlands have usually concentrated on specific environmental services such as
water supply, flood prevention, pollution reduction, fish and wild life production, the
provision of recreation and aesthetics [Hammack & Brown 1974; Lynn et al.,1981;
Faber,1987] Less frequently, attempts have been made to estimate the life support
value of entire wetland ecosystems which are generally required to sustain each
environmental service.[Odum1984; Costanza et al.,1989]

2
1.2 Wetland Classification
Wetlands vary according to their origin, geographical location, water regime,
chemistry, dominant plants and soil or sediment characteristics. Tidal salt-marshes
are typical of temperate shorelines. Freshwater marshes, dominated by grasses and
sedges, account for over 90 per cent of the wetland area in the United States.
The most commonly accepted classification of wetlands is the one proposed by
IUCN, in 1990. This classification is as follows:
1.0 Salt water
1.1 Marine
I. Subtidal (i) permanent unvegetated shallow waters less than 6m depth at low
tide. Includes sea bays, straits
(ii) subtidal aquatic vegetation, including kelp beds, sea grasses, tropical
marine meadows
(iii) coral reefs
II. Intertidal (i) rocky marine shores, including cliffs and rocky shores
(ii) shores of mobile stones and shingle
(iii) intertidal mobile unvegetated mud, sand or saltflat
(iv) intertidal vegetated sediments, including salt marshes and mangroves
on sheltered
coasts
1.2 Estuarine
I. Subtidal
(i) estuarine waters: permanent waters of estuaries and estuarine
systems of deltas.
II. Intertidal
(i) intertidal mud, sand or salt flat, with limited vegetation
(ii) intertidal marshes, including salt marshes, salt meadows, saltings,
raised

3
salt marshes, tidal brackish and freshwater marshes
(iii) intertidal forested wetlands, including mangrove swamp, nipa swamp,
tidal fresh water swamp forest
1.3 Lagoonar
(i) brackish to saline lagoons with one or more relatively narrow
connections with the sea
1.4 Salt lake
(i) permanent and seasonal, brackish, saline or alkaline lakes, flats
and marshes.
2.0 Fresh water 2.1 Riverine
I. Perennial
(i) permanent rivers and streams, including water falls
(ii) inland deltas
II. Temporary
(i) seasonal and irregular rivers and streams
(ii) riverine floodplains, including river flats, flooded river basins seasonally
flooded grasslands
2.2 Lacustrine
I. Permanent
(i) permanent fresh water lakes (>8 ha), including shores subject to
seasonal or irregular inundation
(ii) permanent fresh water ponds(>8 ha)
II. Seasonal
(i) seasonal fresh water lakes (>8 ha), including flood plain lakes
2.3 Palustrine
4
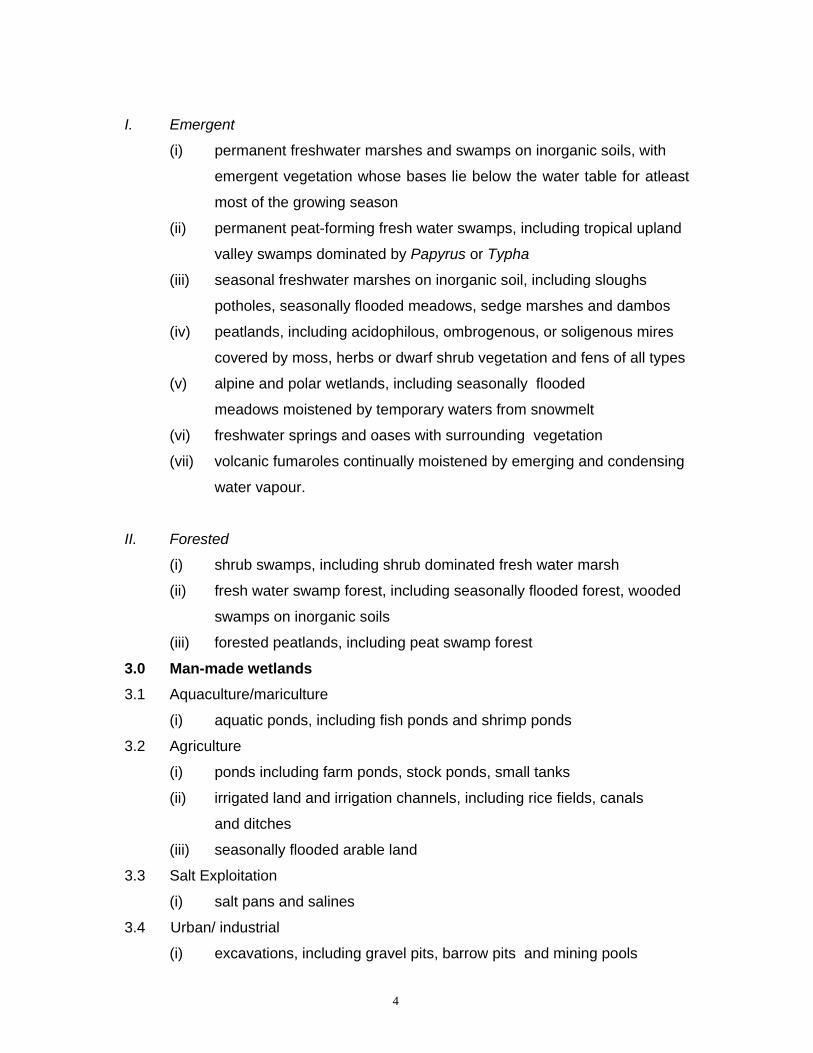
I. Emergent
(i) permanent freshwater marshes and swamps on inorganic soils, with
emergent vegetation whose bases lie below the water table for atleast
most of the growing season
(ii) permanent peat-forming fresh water swamps, including tropical upland
valley swamps dominated by Papyrus or Typha
(iii) seasonal freshwater marshes on inorganic soil, including sloughs
potholes, seasonally flooded meadows, sedge marshes and dambos
(iv) peatlands, including acidophilous, ombrogenous, or soligenous mires
covered by moss, herbs or dwarf shrub vegetation and fens of all types
(v) alpine and polar wetlands, including seasonally flooded
meadows moistened by temporary waters from snowmelt
(vi) freshwater springs and oases with surrounding vegetation
(vii) volcanic fumaroles continually moistened by emerging and condensing
water vapour.
II. Forested
(i) shrub swamps, including shrub dominated fresh water marsh
(ii) fresh water swamp forest, including seasonally flooded forest, wooded
swamps on inorganic soils
(iii) forested peatlands, including peat swamp forest
3.0 Man-made wetlands 3.1 Aquaculture/mariculture
(i) aquatic ponds, including fish ponds and shrimp ponds
3.2 Agriculture
(i) ponds including farm ponds, stock ponds, small tanks
(ii) irrigated land and irrigation channels, including rice fields, canals
and ditches
(iii) seasonally flooded arable land
3.3 Salt Exploitation
(i) salt pans and salines
3.4 Urban/ industrial
(i) excavations, including gravel pits, barrow pits and mining pools

5
Plate 1.1: Panoramic View of Upper Lakeof Bhoj Wet Land
(ii) waste water treatment areas, including sewage farms, settling ponds
and
oxidation basins
3.5 Water Storage Areas
(i) reservoirs holding water for irrigation and /or human consumption with
a pattern of gradual, seasonal, draw down of water level
(ii) hydro dams with regular fluctuation in water levels on a weekly or
monthly basis
Source: Dugan (1990 a). (c) IUCN
1.3 Wetland Benefits
Wetlands are generally highly productive ecosystems, providing many
important benefits. These benefits
some times described as ‘goods and
services’, may be wetland functions
(e.g. ground water recharge, flood
control), uses of wetland or its
products (e.g. site for wood collection
or research site) or attributes of the
wetland (aesthetic component of the
landscape, religious significance). In
order to utilise the benefits provided
by wetlands successfully it is important to identify and assess the benefits that
a particular wetland provides.

6
Table 1.1 Potential Wetland Benefits- Existence Indicators:
Benefit
Existence indicators
I. RESOURCES Forestry, agriculture, forage production
Wetland • has suitable plant species • has high rate of plant primary productivity • shows evidence of use
Wild life or fish production
Wetland • contains habitat suitable for wild life and fish
species • has a variety of water conditions and vegetation
structures • has a large population of fish, bird and mammals
Aquaculture Wetland • has a relatively stable water table • has a relatively stable water quality • has high plant productivity • has nutrient rich waters • shows evidence of this use
Natural products Wetland • has suitable, accessible mineral deposits • has extractable plant material that can be used by
human beings (food, fertilizer etc.) Water supply Wetland
• is permanent or at least seasonally flooded • has water of an acceptable quality for human or
agriculture or industrial use • is the only supply of readily obtainable water of
quality and quantity acceptable to the potential users
Energy production Wetland • has resources such as peat or fuel wood or
suitable plants • has a large through flow and a constricted outlet
Transport Wetland • is permanently flooded or has permanent
channels • is flooded or has flooded channels when local
products needed to be transported Recreation/ tourism Wetland
• has a high landscape or species diversity • provides habitats to rare species
Research or education site
Wetland • has high species diversity • has a range of vegetation structure

7
Benefit
Existence indicators
II. ATTRIBUTES
Biological diversity
Wetland • has a high species diversity • has a diversity of water conditions and vegetation
structures • is relatively undamaged/ undisturbed • is not facing uncontrollable external threats • contain rare, threatened or endangered species • is sufficiently large to support genetically viable
populations of significant species • has a significant topographic, edaphic and
hydrological variation Cultural or historic value Wetland
• is included in local oral or written cultural materials • has been occupied and used over a long period • has significant cultural or historical features
Aesthetic value Wetland • has significant natural features • has a range of landscape types • has a range of habitats • has a large number of visible or attractive species
Wilderness value Wetland • is in a remote area • is relatively uninfluenced by human activities • is not subject to significant levels of visitation
III. FUNCTIONS Nutrient retention
Wetland • has a high capacity for sediment retention • has a constricted flow • has an out flow less than its inflow • has erect, persistent vegetation • has winding channels • has low flow velocity • has relatively long duration and large extent of
seasonal flooding • has a high ratio of seasonally flooded area to
permanently flooded area • has the effect of slowing the velocity of through
flowing water • intercepts over land run – off • is regularly flooded by a river • is shallow and vegetative • is permanently flooded or saturated, or tidally
flooded

8
Benefit
Existence indicators
• has a high sediment organic content • has high plant species diversity with no dead
forested area
Nutrient Export Wetland • has a high rate of primary productivity • has a permanent outlet • is potentially eutrophic • has significant area of erect or submerged
vegetation that dies seasonally Ground Water Recharge Wetland
• has a constricted outflow • has an outflow less than its inflow • has a water table which slopes away from it • has a permanent inlet but no permanent outlet • has a permeable substrate • is located at or below the crest of a major
mountain or range • has a water balance in which infiltration rate plus
inflow exceeds evapo-transpiration rate plus outflow
Ground Water Discharge Wetland
• has a constricted inflow • has an outflow less than its inflow • has neither an outlet nor an inlet • does not have permanent standing water • has a permeable substrate • has a slope less than that of nearby water courses
Erosion Control Wetland • has a high capacity of flood mitigation • is densely vegetated • has a high capacity for sediment retention
Salinity Control Wetland • is seasonally flooded • has plant communities that are able to remove
salts Water Treatment (Toxicant Removal)
Wetland • has a high capacity for sediment retention • has a constricted outflow • has erect persistent vegetation • has winding channels • has no flow or low flow velocity • has relatively long duration and large extent of
seasonal flooding

9
Benefit
Existence indicators
• has a high ratio of seasonally flooded area to permanently flooded area
• intercepts over land run-off • is shallow and vegetated
Climate Stabilisation Wetland • has a high evapo-transpiration potential • has large vegetated area that provide shadow and
reduce velocity of air movements • condense accumulated peat
Role in the Life Cycle of Species
Wetland • has a high plant species diversity • has a range of different vegetation structures • has a diversity of water conditions • is relatively rich in habitats, water and feed when
conditions are unfavourable to fish, bird and mammal species elsewhere
• is relatively undisturbed Maintenance of the Stability of the Ecosystem
Wetland • has a high capacity for nutrient retention • has a high rate of primary productivity • has a relatively undisturbed trophic change • is rather stable in terms of plants and wildlife
populations Maintenance of the Integrity of Other Ecosystems
Wetland • regulates flows and mitigates floods • regulates water salinity • removes toxicants • regulates sediments exports • exports nutrients • provides seasonally/temporary habitats to
migratory species • shows evidence of continuing ecologically,
geomorphological and geological processes Source: Roggeri (Undated)
1.4 Wetland Management
Despite the importance and potential of wetlands, the history of water management
has been characterised by activities that have often negatively impacted wetlands
and their ability to provide important benefits. Over the last few decades, as the
scale of human interventions within river basins has increased so have the
magnitudes of their effects upon wetlands. Many wetlands have been lost completely

10
whilst the ability of many of those that remain to provide valuable benefits has been
reduced significantly. For example, Thailand has lost 51% of its mangrove whilst 20-
30 million ha peat swamp forest in Indonesia has been lost through logging. (Trishal,
1997)
Fifty four percent of the wetland area of the coterminous United States present in
colonial times had been lost by mid 1970s. Regional losses detailed in the
benchmark survey, carried out as part of the US Fish and Wildlife’s National Wetland
Inventory vary from 32 per cent in Wisconsin to 99 per cent in Iowa’s natural
marshes. The pattern is repeated throughout the developed world, although there
has been no comprehensive survey of the details, Forty per cent of the coastal
wetlands of Brittany, France, have disappeared in the last 20 years and two-thirds of
the remainder are seriously affected by drainage and other activities (Mermet cited
by Baldock, 1984). In Ireland 80,000 ha of bog have been drained since 1946. A
1983 European parliament report warned that the unique ecosystems of the Irish
bogs will vanish completely in the next five years unless effective preventative
measures are taken very soon (Baldock, 1984). But already before the present
century much of Europe’s lowland wetlands had been drained in the course of
agricultural development and disease eradication.
Large scale wetland losses have been a more recent phenomenon in the tropics and
third world countries. Many reasons can be cited why, historically, wetland
destruction and alteration has dominated over an alternative view of maintaining
them and developing management strategies for their enhanced utilization. They
include:
(a) Prevalence of the ‘wasteland’ concept - the view that drainage and conversion to
other uses is a ‘public-spirited endeavor’ (Baldock 1984), resulting in increased
productivity, value or access to land. Agricultural conversion has accounted for
87 per cent of wetland losses in the United States.
(b) Association of wetlands with disease particularly malaria and schistomiasis and
physical danger in traversing such areas. This was one of the motives for
draining the 6000 ha Hula Papyrus swamp in northern Israel in 1950s.

11
(c) The obvious flooding hazard associated with occupation or use of such land -
periodic extreme events exerts pressures for protection thereby reducing the
natural flooding regions. Progressive drainage of the English Fens was
encouraged by public and political response to successive major flood events.
(d) Lack of government interest. Politicians are rarely taken up by the subject of
wetlands and they rarely admit to responsibility beyond their own administrative
or national boundaries which wetland issues demand. Control over wetlands also
exposes in democratic communities tantalizing questions of rural land use,
ownership restrictions, state control and inevitable conflicts of interest on the part
of government.
(e) Lack of financial support for wetland protection and management. This is
particularly acute in Third World Countries.
(f) Lack of any individual scientific identity or a cohesive form of academic study
centered on wetland per se. This has delayed the dissemination of fundamental
and management information pertaining to wetland.
Sustainable use of wetlands is being threatened around the globe, both in the North
and in the South. Humanity depends on all sizes and kind of wetlands - natural or
artificial, ephemeral or permanent - for drinking water, food supply, power
production, navigation, ecological services, and economic development. Moreover,
wetlands are integrators of the many complex chemical, physical and biological
processes occurring throughout entire watersheds. They serve as indicators of
adverse environmental change.
It is clear that an economic analysis of beneficial uses associated with wetlands
should be comprehensive, dynamic and include all potential uses and users since
they affect each other. A special feature is the dynamic aspect of wetland ecosystem
degradation. The capacity of different types of wetlands to sustain levels of pollution
varies and is limited. In many cases, the damage to wetland ecosystems, especially
the biological communities, is irreversible. This means that benefits to local
populations that depend on wetlands are foregone. The poor may lose their source
of nutrition, and others may lose their source of employment and may migrate.
Furthermore, investments may be wasted. Many wetlands in the world are
12
approaching limits or thresholds where their sustainability and beneficial uses will be
severely diminished or lost. Corrective actions or costly remedies may be necessary
if mismanagement and misuse of wetlands and watersheds continue unchecked.
(Ariel et.al, 1995)
1.5 Quantification of Wetland Benefits
It is necessary to quantify the benefits provided by wetlands as far as possible if
effective choices are to be made between development and management options.
Planners, decision makers and politicians are greatly influenced by economic issues.
Demonstrating the economic value of the benefits provided by wetlands there for
provides one of the most important mechanism for showing that they should be
formally incorporated into wetland management. It is important that the emphasis of
such economic analysis is not placed solely on those values that are more easily
quantified on economic grounds. In order to represent the true value of a wetland
attempts must be made to evaluate all benefits that they provide
1.6 Threats to Wetlands
Over the last 50 years, the world population has almost tripled. Most of this increase
has occurred in developing countries. The use of water during the same period has
more than tripled. The exploitation of lands, bodies of water, and forests resulting
from development has increased dramatically. This has led to a number of
pronounced problems in wetlands. Changes in the natural landscape from resource
extraction, introduction of new and more intensive types of agricultural practices,
urbanisation, altered water balances, and hydrological regimes have all influenced
the state of wetlands around the world.
Wetlands have a more complex and fragile ecosystem than rivers. They do not have
a “self cleaning” ability, and therefore they readily accumulate pollution. Because of
their importance their beauty, their religious and cultural significance, and their
relative vulnerability to degradation, wetlands require more concerted attention than
is applied generally to river and stream basins. Although pollution of other waterways
is also a pressing issue, the unique features and situation of wetlands makes it
important to deal with them first.

13
Various ecological problems occur in wetlands such as eutrophication, toxic
contamination accelerated sedimentation, acidification from atmospheric deposition
excessive water diversion, fish depletion, introduction of exotic species, and habitat
alteration. A brief description of some of these ecological problems is provided below
to demonstrate their variety, complexity and geographical breadth.
a) Eutrophication
One of the most visible and common problems of wetland ecosystems is
accelerated enrichment or eutrophication. Eutrophication of a water body is a
natural process. The original state of a wetland and the rate at which at which
eutrophication takes place depends on the location of the water body, its
hydraulic character, and the attributes of its watershed including soils, slopes
of terrain, and extent of vegetative cover. Wetlands can be rather
unproductive (oligotrophic), or highly enriched (hypereutrophic), or various
degrees in between. Most wetlands are eutrophic.
The effects of accelerated eutrophication can include intensified algal blooms,
which can create unsightly water conditions, unpleasant tastes and odours,
and water discoloration. Some of the algae (the blue-greens) can produce
toxins that are lethal to domestic animals and in temperate regions, and may
be linked to certain summer illness in humans (USEPA 1988). Eutrophic
conditions also contribute to the potential presence of toxic and harmful
materials such as chlorinated organic hydrocarbons (e.g. trihalomethanes) in
drinking water, which may persist even after water treatment. When algae die
and decompose, dissolved oxygen concentrations in the bottom water can be
depleted to the point of causing severe stress on fish. If the situation
continues or intensifies, the result could be changes in species composition,
growth reductions, and under certain conditions, extensive fish death.
Macrophyte (rooted and floating aquatic plants) abundance, while partly
related to sediment type or composition, and to nutrient factors, is most often
determined by light availability. It is a common misconception that nutrient
enrichment causes nuisance macrophyte growth. In fact, high nutrient
concentrations in the water column trigger algal blooms decreasing light
14
penetration, and limiting macrophyte growth (Cooke et. al. 1993). Clear
wetlands with nutrient- rich littoral areas can display excessive macrophyte
growth, which is very noticeable in Lake Chad and is apparent in Lake Victoria
with abundant growth of water hyacinths. Macrophyte beds are important
features of lakes. They are essential as spawning areas for fish and shellfish,
and provide refuge against predator species for some fish. They can provide
important societal benefits as well, as in the case of Lake Titicaca, where
certain species of macrophytes are used for nutrition and provide materials for
construction.
Macrophyte beds become a problem when they cover large areas of a
wetland surface. Excessive growth can impede boat traffic, create dangerous
areas to fisherman and swimmers, and can increase the cost of water
treatment if plants break off and are transported to treatment facilities (where
they can clog water intakes). The danger of introduced plants species (mostly
unintentionally) is also a threat to wetland sustainability. The invasion of North
American waterweeds (Elodea spp.) into other parts of the world is a well-
known example. The distribution of E. canadensis is now almost world-wide
and E. nuttallii seems to follow a similar track, invading Europe and Japan.
Some lake ecosystems, for example those on oceanic islands, consist of a
limited variety of flora and fauna and are less resistant to invader species.
b) Toxic substances
In 1982, over 275 million tons of hazardous waste were produced by industry
in 13 of the 23 Organisation for Economic Co-operation and Development
(OECD) countries that reported on waste disposal (Rogers et. al. 1988). It is
also estimated that 1.3 million metric tons of pesticides were used in the world
in 1985. Although the amount of these substances that reach lakes and
reservoirs is unclear, the sheer size of the number indicates the potential for
lake and reservoir pollution is very large. There is strong indication that a
growth in hazardous waste production can be expected with increased
industrialisation and with production and use of synthetic organic compounds.
Much of this expansion is to be expected in developing countries and more
lakes and reservoirs will become contaminated. This potential growth in the

15
production of hazardous waste was confirmed by the World Bank in 1969.
Thailand had only 500 factories producing hazardous waste, by 1992 that
number grew to more than 26,000 factories, and it could triple in one more
decade (World Bank 1992).
Toxic substances can enter water bodies directly as land runoff from urban
streets, mining areas or as agricultural runoff including forestry drainage
frequently including a range of toxic pesticides and herbicides, or by the
discharge of insufficiently treated sewage and industrial effluents, and as
deposition of airborne pollutants. Airborne transport is particularly
troublesome since sources can be at great distances as indicated for the
Great Lakes. In the case of Lake Michigan the atmosphere is the main source
of lead, zinc, copper, and cadmium. Toxins can also be created in drinking
water to form cancer-causing compounds such as trihalomethanes (THMs).
c) Sedimentation
Sedimentation of wetlands is a normal occurrence. In general, it takes place
very slowly. However, activities in a wetland’s watershed that disturb the soil
can greatly accelerate this process. Most of these activities are human and
include farming on fragile soil and on steep slopes, surface mining, forestry,
construction activities, and urban drainage from streets and pavements.
Suspended sediment and sedimentation have many degrading effects on
wetland and shoreline ecosystems. Marginal wetlands can be completely
covered by silt, eliminating their value as nutrient sinks, wave absorber,
nursery areas, and habitat. As silt settles in a lake, spawning areas are
covered and lake volume is reduced. A complete change in fishery production
can occur. As a result of lost storage capacity, both the volume and extent of
flooding can increase. In the case of hydro-electric facilities, loss of generating
capacity is possible. The increase in shallow areas as a result of
sedimentation can encourage increased macrophyte growth, and can interfere
with recreational activities such as boating and fishing. Soil loss and
suspended silt also contributes to eutrophication and lake contamination since
the silt generally includes attached nutrients, herbicides, pesticides and other

16
chemicals. This increases water treatment and maintenance problems in
water treatment plants.
Sediment removal might be the only practical way to improve a lake or
reservoir that has been badly silted. Dredging is one of the most frequently
prescribed techniques to correct this problem. It has been successfully used
in Lake Trummen, a small lake in southern Sweden, and in Lake Vancouver in
the United States. Dredging, however, is costly (for example, Hitzhusen et al.,
(1995) estimated the dredging cost in Lake Madison in Ohio to be $1.65 per
ton of sediments dredged) and works best if the sources of sediment delivery
are first controlled, eliminating the need for re-dredging. Because dredging
requires the disturbance of the lake bottom, any entrapped toxic materials in
the bottom sediment can be re-suspended and made available to the
biological community in the lake.
d) Fish depletion
Fish provide a large percent of animal protein consumed by the world
population. In tropical developing countries, 60 percent of the people depend
on fish for 40 percent or more of their protein (WRI, 1994). The majority of the
world’s landed fish catch (87 percent) comes from marine areas. Of this, the
annual freshwater catch grew 85 per cent between the late 1970s and the late
1980s, while the annual marine catch may have reached a limit near 100
million metric tons and more pressure on freshwater fisheries may result. This
could mean that lakes and reservoirs, as sources of fish protein will become
more important.
In eutrophic conditions, either natural or induced by heavy inflows of
sewerage or agricultural run-off, a high biomass is likely to be found. A
positive correlation between fish yields and total production of algae has been
reported in some cases, and in other cases there is a positive correlation
between fish production and bottom dwelling invertebrates (Hecky et al.,
1981). The same increase in nutrients may promote intense algal blooms,
however, leading to increased biological oxygen demand, oxygen depletion in
bottom water and a change in the fishery.

17
When non-native exotic fish have been increased, intentionally or by accident,
changes in biomass, species composition, and production may occur.
Although total fish production might remain the same or even increase, the
change in species composition might disrupt the livelihood of local human
populations, and can affect the biodiversity in the wetland. An example of
effects of this kind is the introduction of the species perjury into Lake Titicaca,
where this very hardy pollution-tolerant fish appears to be thriving as the lake
waters are becoming more eutrophic and polluted with human wastes and
pathogens. Indigenous people, with little choice, are exposed to great health
risks from eating the contaminated fish.
e) Excessive Water Diversion
Water diversion or its disruption probably has the greatest effect on the overall
quality and ecological health of a lake or reservoir ecosystem. Diversion of
water out of a lake system, frequently tied to non-sustainable economic
development schemes, are used for supplying irrigation water, drinking water,
or industrial process water to other regions that lack water. Dramatic
examples of the adverse effect of diversion include the Aral Sea. Mono Lake,
and in the Lake Chad basin. In the case of the Aral Sea, more than 60 percent
of the incoming flow to the lake was diverted for irrigating cotton and other
agricultural crops (Precoda, 1991). Consequently, the surface area of the lake
was reduced by 5 percent to 37,000 square kilometres (Km2), its volume was
reduced from 1090 Km3 to 340 Km3, and its salinity has almost tripled.(World
Bank,1992and Micklin,1992)
Diversion has other consequences. Raising and lowering of lake levels
destroys marginal habitat and wetland areas, that are necessary for nursery
grounds for terrestrial and aquatic species, buffer zones to erosive wave
action, water recharge, and nutrient sinks. Lake lowering increases difficulty in
water access, disrupts water intakes, erodes embankments and disturbs
recreational use.
Across the world, transboundary water pollution and inappropriate water
management practices interfere with society’s use of wetland water. While

18
almost 300 treaties exist for transboundary water management, most of them
deal with the quality aspect of water use by sectors and do not concern them
selves with pollution or ecosystem issues. The large African lakes, the Great
Lakes of North America, small lakes in the deltas of international river basins
of Africa, and lakes like Titicaca, Baikal, Constance, and Geneva all have
drainage basins covering more than one nation.
In some cases, countries have taken action to reduce pollutant loading. Lake
Vanern, Constance, Geneva, and the five North American Great Lakes are
good examples of this. Pollution from man made toxic chemicals is particularly
difficult to address not only because the source of pollution must be reduced,
but accumulation of persistent toxins in the environment must be investigated
and expensive remedial actions undertaken. Many areas of the great lakes
have highly contaminated bottom sediments. This is true particularly in
harbours and bays containing industrial sites, and in river deltas where
upstream industry has discharged wastes containing toxins. The great lakes
experience offers an example of international co-operation by two nations
involving all stakeholders in the process of identifying the extent of the
problem, understanding the health threats to the ecological system and the
people of the basin, defining appropriate mitigation, including the institutional
and technological requirements. Sediments from deforestation in Malawi,
Tanzania and Mozambique inhibit fish production in Lake Malawi. In Lake
Titicaca, eutrophication stimulates algae, which shade out aquatic plants that
are essential to the ecosystem and to indigenous peoples. In Lake Victoria,
the combined effects of overfishing, introduction of nonindigenous fish and
aquatic weeds, and sewage pollution causes very complex degradation of the
lake and problems for residents of the three riparian countries. In the case of
lakes connected to oceans, accidental introduction of nonindigenous species
in ballast water from ships causes extreme damage. The lake Erie aquatic
ecosystem, which provides $200,000,000 in fishing benefits each year may
soon collapse because of the Zebra mussels introduced via ballast water of
ships from Europe. Billions of dollars need to be spent to prevent fouling of
intake and discharge pipes clogged by the mussels.

19
Poor water management in terms of upstream diversion or changes in flow
regimes downstream of reservoirs also degrades wetland ecosystems,
causing economic damage, and human suffering. In case of delta wetlands in
international river systems that are essential for fish propagation, upstream
withdrawals of water cause salinity to increase and ruin the functioning of the
wetlands. Impoundments for hydropower also prevent annual floods that are
essential for floodplain wetlands, flood recession agriculture, and recharge of
ground water supplies. This destroys the fishery of African rivers, displace
floodplain peoples, and dries up their ground water supplies. Proper water
management practices are needed to ensure that there is sufficient water left
in international rivers to recharge delta wetlands and that reservoir releases
include the provision of an annual downstream flood to enable flood plain lake
ecosystem and flood plain agricultural communities to survive. Disruption of
sediment flow to coastal zones by dam construction can cause coastal
erosion, and in West Africa entire coastal towns have been washed away.
Two international issues also raise problems of wetlands. One involves a
dynamic link between wetlands and ground water supplies and the other
involves atmospheric deposition of wetlands. Lake Chad represents a good
case of links between wetlands and underlying groundwater drinking supplies.
As more water has been diverted for irrigation from the lake basin (and as
climate became drier) the lake has shrunk, wetlands that sustained the lake
fishery have dried up, and groundwater levels have declined. The
international groundwater around this wetland is connected to the lake and
depends on lake inflow to sustain its level. Too much diversion for agriculture
also means that groundwater sources in this dry climate may not be
sustained. (World Bank Technical Paper No. 289)
The South Asian region has a wealth of wetland habitats of immense importance in
terms of ecology and economics. They exhibit enormous diversity based on their
origin, geography, hydrological regime and substrate. The wetlands of South Asia
have always provided human beings with basic necessities, from water for drinking
to fertile soils for growing crops and other products for their sustenance. The people

20
have developed unique techniques for harnessing these resources without altering
the ecological balance of the wetlands. However, with the advent of science and
technology, which have led to the rapid utilisation of natural resources and favoured
land based development, wetlands have been drained, filled and reclaimed for
higher economic gains, particularly to grow more food for the increasing population.
This has led to a considerable alteration of wetland habitats and reduction in their
potential to provide ecological and economic security for the people dependent on
their resources.
In South Asia wetlands have traditionally been utilized sustainably by a large
population dependent on these resources for their sustenance. However with the
increased pressures of human population and unplanned development in the region,
wetlands are being destroyed at a rapid rate, resulting in a shrinkage in area and
decline in productivity, and thus in their ability to meet the needs of the local people.
This is particularly pronounced in the coastal areas, where indiscriminate use of
resources and conversion for aquaculture and other development activities have
resulted in the degradation of mangroves, seagrass beds and coral reefs. Similarly,
the combined effect of degradation of inland wetlands have led to problems of
siltation, loss of biodiversity and the prolific growth of exotic aquatic weeds such as
water hyacinth (Trisal, 1997).
The weedy and marshy wetlands of low lying cities in South and Southeast Asia
have variety of uses - as dumping ground of industrial effluents and urban refuge
through default option, as highly attractive money making proposition to convert
them into busy industrial complexes and /or civilised- looking housing
conglomerates, or as financially less lucrative albeit environmentally sustainable
option of converting them into smiling “nature parks”. (Datta & Sinha,1996)
The low lying cities of Calcutta, Dhaka, Mumbai, Jakarta, Bangkok, etc. are well
known for the traditional practice of dumping industrial effluent and urban refuge on
their weedy and marshy wetlands for converting such wetlands into busy industrial
and housing complexes under pressure of population growth and development.

21
Table 1.2: Selected Impacts of Development in River basins in Asia and the Pacific Activity Wetland Impacted Example Impacts Forestry management
Food plains of the Komering River, Indonesia
Increased erosion leading to increased sediment loading, silting up of wetland channels. Modification to extent, depth and duration of food plain inundation. Abandonment of rice fields.
Agriculture
Aral sea, Central Asia Diversion of inflowing rivers for large-scale irrigation. Falling water level and declining sea extent. Rising salinity. Contamination of inflowing rivers with agricultural chemicals. Loss of deltaic wetlands. Disappearance of many fish species. Numerous health problems.
Urbanisation Riverine wetlands of Klang Basin, Malaysia. Bhoj wetland, India
Channelisation of natural river channels. Pollution of rivers and streams. Increased soil erosion and higher sediment loads. City sewage, encroachment, eutrophication
Water resources development
Ganges flood plain wetlands, Bangladesh
Construction of Farakka Barrage across the Ganges in India. Diversion of water supplies and declining inundation of wetlands. Enhanced saline intrusion. Negative impacts to floodplain agriculture and fisheries
Hydro-electric power development
Mekong river Several dams already constructed; many more planned. Modification to the natural flow regime of the river. Declining inundation of wetlands. Reduced freshwater inflow to coastal wetlands and disruption of salinity patterns and water levels within the delta
Land use planning
Floodplain wetlands of Bangladesh
Sectorally focussed planning for flood control and irrigation leading to extensive flood control, drainage and irrigation infrastructure. Major modification to floodplain functioning. Pollution of wetlands with agrochemicals.
Development activity within Wetlands Wetland drainage
Peat swamp forests of the Lower BaritoBasin, Indonesia
Drainage of extensive areas for large-scale rice cultivation. acidification of soils leading to crop failures.
Aquaculture Mangrove wetlands throughout SE Asia
Removal of tree cover and conversion to extensive single use ponds. Acidification of acid sulphate soils leading to higher salinity. Pollution of surrounding uncovered mangroves with highly saline water and other pollutants associated with aquaculture.
Wetland forestry
Peat swamp forests, Sarawak, East Malaysia
Extensive logging. Oxidation and erosion of peat. Cutting of canals through wetlands leading to reduced ground water levels and dry season base flows
Control structures: Dikes and embankments
Deltaic wetlands of Ganges, Meghna and Brahmaputra, Bangladesh
Removal of floodwater supply to wetlands. Increased downstream erosion. Water logging behind embankments. Disruption to fish migrations
Source: UNEP- Wetland International-Asia Pacific, “Wetlands and Integrated River Basin Management.”

22
1.7 Biodiversity
Wetlands and deep fresh water habitats are extremely rich in their bio-diversity,
particularly as they occupy a very small area of the earth’s surface. Wetland
functions and values are now well known but their bio-diversity has neither been
properly inventoried nor its role duly recognised. Wetlands in South Asia exhibit
great diversity in flora and fauna due to their climatic and topographical variation.
The Himalayas in the north have acted as a two- way high way linking West Africa to
Southeast Asia. At the eastern end through the "Assam gate" come the Chinese and
Malayan elements and from the west come the palaearctic and European elements.
In the Peninsula there may also have been a cross-over point between the South
Western Ghats and the Eastern hills in the Indian subcontinent. In conjunction with
other parts of Asia, the region is the global center of diversity for a number of
ecosystems or species groups. The wetland flora is represented by all taxonomic
groups from unicellular algae, bryophytes, mosses and ferns to woody angiosperms.
Gopal (1995) reported the occurrence of 450 species of macrophytes in the Indian
subcontinent, many of which are endangered and some of which have become
extinct. Many of these species are endemic. There are several reports of declines in
vegetation but little attention seems to have been focused on conservation of
retreating population of macrophytes.
The mangrove vegetation shows considerable variation in different pats of the
region. Only 8 mangrove species have been recorded in the Indus delta of Pakistan
compared to about 60 species in the Sunderbans of the Ganges delta. High species
diversity (65) has been reported in the Bhitarkanika area of Orissa
The faunal wealth in South Asian wetlands is equally diverse. The Sunderbans are
the home of the threatened Bengal tiger Panthera tigris, the jungle cat Felis chaus,
the leopard cat Felis bengalensis, and the fishing cat Felis prinaclurus vevetina. The
wetlands of eastern Himalayas, extending to Bangladesh, are internationally
important for a number of threatened bird species, notably Imperial Heron Ardea
imperialis, Greater Adjutant Leptoptilos dubius, Jerdon's Bush-chat Saxicola jerdoni,
Painted bush-quail Perdicula manipurensis, etc. The one horned Rhinoceros
Rhinoceros unicornis has become confined to the remaining swamps of Assam.
Loktak lake in Manipur state is the last refuge for Brow- antlered deer Cervus eldi

23
eldi. The wetlands of Bhutan harbour about 30-40%of the world population of black -
necked Crane Grus nigricolis. The famous Keoladeo National Park wetland in India
harbours about 370 species of birds including the highly endangered Siberian Crane
Grus leugeranus in a wetland of just 76 km. Adjacent to this wetland, the riverine
habitats of Chambal provide vital refuges for several species of wild life including
Gharial Gavialis gangeticus.
Mountain streams in Himalayan range support many rare and interesting species
such as the Relict Himalayan Dragonfly Epiphlebia laidlevi, a rare and poorly known
species with very restricted range. In the Ladakh region of India, breeding colonies of
Bar-headed Goose Anser indicus are found. Gahirmata in the eastern coast of India
forms the largest turtle rookery in the world, where millions of Olive Ridley turtles
visits for a brief period during January.(Trisal 1997)
1.8 Wise Use
Wise use of wetlands essentially involves conservation of the ecosystem while
ensuring the sustainability of the benefits derived by mankind. The essential
elements for achieving wise use are:
1. developing national wetland policy supported by legislative measures for
regulation;
2. inventory,
3. improving institutional, organisational arrangements and overall capacity
building;
4. increasing knowledge and awareness of wetlands and their values;
5. conservation of wetland sites
The planing, formulation and implementation of wise use of wetlands should involve
local communities as they are the repository of knowledge on wetlands and have
played a significant role in their conservation over thousands of years. It would be
worth while to share their experiences in this regard. NGOs, too, are crucial for
creating awareness and ensuring public participation(Trisal1997). Mudiali
Fishermen's society located on the wetlands of south west Calcutta which has
evolved a non-traditional system of wetland management. Using urban refuge and

24
polluted water of the city, the society has developed a completely indigenous bio-
engineering system to perform three important functions:
1) improving the waste water quality before releasing it into the river Ganges,
2) using the waste water as input to grow fish, and
3) developing an ecologically balanced system to convert the entire area into
a “Nature Park”.
The above- mentioned functions have opened up further opportunities for an ever-
increasing variety of business activities of the society, besides producing low-cost
sanitation, employment, environmental safety and aesthetic values to the city
dwellers. The evolution of Mudiali society over time can be looked upon as a tutorial
system to provide lessons not only on economics and environment but also on how
the fate of economics and environment can be dictated by exogenously given social
and political factors. (Datta & Sinha,1996)
1.9 Wetlands of India
Most wetlands of India are directly or indirectly associated with the river systems.
There are 14 major river systems, beside a large number of smaller rivers, which
flow in all directions before discharging into the Arabian Sea or Bay of Bengal (Rao,
1975, Gopal and Krishnamurthy, 1993). The rivers Indus, Ganga and Brahmaputra
and their major tributaries originate from the glaciers in the Himalaya and are
perennial, owing their flow to both precipitation and snow melt. They form extensive
floodplain and deltas. A few rivers originate from the Vindhyan Ranges in central
India and flow northwards to meet the river Yamuna, the largest tributary of river
Ganga (Gopal & Shah, 1993). The rivers originating in the peninsular region, mostly
in the Western Ghats, depend entirely on the rainfall but are still perennial because
of the very short dry period during the year. These rivers do not form large
floodplains except that the rivers Krishna, Cavery, Godavari, and Mahanadi flowing
eastwards form significant deltas along the eastern seaboard of India. River
Narmada and River Tapti, originate in central India and flow westward along Satpura
ranges. A number of small rivers, also originate in southern part of Western Ghats
and flow westward in to the Arabian Sea. Natural lakes are relatively few and
generally confined to the Himalayan belt (Fernando 1984, Gopal and

25
Krishnamurthy1993). All other natural fresh water bodies, often referred to as lakes,
are floodplain lakes which are generally shallow (<3m deep) and exhibit large water
level fluctuations depending upon the annual precipitation. (ILEC Report 1996)
Wetlands in India occupy some four million hectares of land. A survey by the
Ministry of Environment and Forest in 1990 estimated that about 1.5 million hectares
are under natural wetlands and man-made wetlands like tanks and reservoirs occupy
2.6 million ha. Mangroves according to the forest survey of India now cover an
additional 453,300 ha. Some 80 % of the total mangrove area is found in the
Andaman and Nicobar Islands. However according to the Directory of Asian
Wetlands, wetlands in India occupy some 58.2 millions ha. and some 93 wetlands
meet the criteria under Ramsar Convention.
Table - 1.3: Area of Wetlands in India (in million hectors)
Area under wet paddy cultivation Area suitable for fish culture Area under capture fisheries Mangroves Estuaries Backwaters Impoundments
40.9 3.6 2.9 0.4 3.9 3.5 3.0
Total 58.2 Source: Sustainable Wetlands, Environmental Governance-2, IGIDR, 1999 1.9.1 Distribution
The natural lakes or wetlands of India may be considered separately for the
three major geomorphic regions, the Himalayan region, the Ganga -
Brahmaputra floodplain, and peninsular India.
(i) Himalayan wetlands
Most of the natural wetlands in India lie in the Himalayan belt. They
occur from the valleys up to an altitude of about 5000m although lakes
in Tibet plateau occur at still higher elevation (Loffler, 1969). The
Himalayan lakes have usually been grouped, according to the altitude,
into three categories: Valley lakes, Forest lakes and High altitude

26
Wetlands. (Kaul 1977, Zutshi &Khan 1978). Zutshi et al. (1980)
recognised the Sivalik lakes separately.
High altitude lakes are those lying above the timberline (3000m
altitude), mostly along the Pir Panjal ranges and in Ladakh. They have
generally been formed by glacial or tectonic activity. Forest wetlands
are those lying amidst the pine forests in the Upper Karewas (outer
fringes of Pir Panjal ranges in western Himalaya) at an altitude of 2000
to 2500m, e.g. Lake Nilnag.
The wetlands in the Kashmir valley at 1580-1600 m altitude, distributed
in the floodplain of River Jhelum have been designated as Valley lakes.
They are either Oxbow lakes or are still connected with the river. All of
them are shallow with a mean depth of less than one meter to about
three metres. Lake Manasbal is the deepest with maximum depth of
only 12m.
The wetlands occurring at low altitude (600 m) in the Jammu region in
the lower Sivalik Himalayan ranges, have been referred to as Sivalik
lakes. These wetlands were probably formed by damming of the river
some 10-15 thousand years ago. Among them better known are Lake
Mansar and lake Surinsar.
Further eastward in the Himalaya, there are many small wetlands in
Himanchal Pradesh between 600 and 4250m altitude. Of these,
Renuka (620m), Rewalsar (1660m), Sukhsar, Dashalsar and
Prashalsar (2300m) are better known. In the eastern Himalaya, there
are only few small shallow lakes in Sikkim (for example, Yamdok Cho
and Chamtodong) and in the north eastern hill regions ( Lake Mikir in
Darjeeling). These have not been fully documented.
(ii) Wetlands of Ganga- Brahmaputra Floodplain
These are numerous shallow water bodies in the floodplains of Ganga
and Brahmaputra rivers. These are locally known as Tals, Jheel or
Pokhar in Hindi speaking areas. And Bheel (or beel) in Bengal and

27
Assam, Pat (or Phat) in Manipur. These are generally Oxbow lakes
nearly always associated with the rivers - often connected with them
during the high flood periods. Among them the most significant are
Kabar Tal or Lake Kabar in Bihar, Suraha Tal in eastern U.P., Deepor
and Sareshwar beels in Assam, and Logtak lake, Waithou lake, Ikop
phat, Khoidum phat, Phumlen phat and other phats in Manipur.
(iii) Wetlands of Peninsular India
In peninsular India, Lake Kolleru (Andhra Pradesh) is the largest
freshwater lake along the eastern coast lying between the floodplains
of River Godavari and River Krishna. Lake Kondakarla is another
shallow freshwater lake in Andhra Pradesh. Elsewhere there are only
few small shallow ponds.
(iv) Salt Lakes
In the arid and semi-arid region of Rajasthan there are a number of
saline lakes of which Lakes Sambhar, Deedwana and Pachpadra and
better known. Most of them are temporary, and dry up completely
during the dry summer period. Their origin is not yet clear. It is likely
that Lake Sambhar was once a freshwater lake. Presently they are
closed basins receiving runoff from their sandy catchment, which is
almost wholly denuded.
(v) Coastal Lagoons
Among the lagoons, the most important are Lake Chilika in Orissa
(Ram et. al. 1994) and lake Pulicat in Tamil Nadu (Jhingram, 1992) on
the east coast of India. Similarly there are several lagoons and
backwaters in Kerala on the west coast (Jhingram, 1992). These
lagoons, whose connection with the sea has usually been regulated
with a weir, are generally referred to as lakes. The larger of these are
Veli lake, lake Vemband and lake Sasthamkotta).

28
(vi) Urban wetlands
Perhaps the oldest among the large urban wetlands is the Upper Lake
of Bhopal which was constructed in the early 11th century. Its large
spread made it so famous that all other lake were considered to be
simply ‘ponds’ in its comparison. The lower lake of Bhopal was created
much later as the city started sprawling on that side. Other old and
well known urban wetlands are those in Udaipur (Fatehsagar, Pichhola,
Udaisagar and five other smaller lakes). Hyderabad (Hussain Sagar,
Osmansagar), Ajmer (Anna Sagar and Foy Sagar), Jaipur (Mansagar
and Jamwa Ramgarh), Jodhpur (Sardar Samand), and Alwar (Lake
Silisher). Similar lakes are common near many urban centers in
Madhya Pradesh (e.g. Sagar, Rewa), Karnataka and Gujarat. The
recent man-made urban wetland, Sukhana Lake near Chandigarh and
has attracted considerable attention due to the awful shrinkage rate
and pollution. Some of the natural wetlands such as Dal Lake and
Nainital lake are also truly urban lakes. (Gopal, 1996.ILEC Report)
1.9.2. Major problems regarding wetland management in India The major problems confronting wetlands in India are:
(i) Siltation
About 3 million tonnes of silt is annually deposited in Chilka lake. The
inflow of silt through rivers in ox-bow lakes has resulted in heavy
sedimentation resulting in formation of large littorals colonised by
dense macrophytic growth and shrinkage of lake area like Dal lake,
Wular lake, Kabar lake etc. The problem of sedimentation is more
pronounced in reservoirs resulting in the reduction of their water
holding capacity and decrease in lake area.

29
(ii) Eutrophication
The process of water quality degradation caused by excessive
nutrients is a serious problem confronting all wetlands in India
excepting high altitude trans-Himalayan glacial lakes.
(iii) Pollution
These problems are particularly pronounced in urban wetlands like
Hussain Sagar (Hyserabad, Andra Pradesh), Lower Lake (Bhopal,
Madhya Pradesh), Dal Lake(Srinagar, Kashmir), etc. The impacts of
pollution are quite evident by the toxic contamination of water like DDT,
PCB, mercury, many other heavy metals and pesticides.
(iv) Prolific Growth of Aquatic Plants
The increase in levels of nutrients and heavy sedimentation have led to
the prolific growth of aquatic plants. Some of the species which have
reached nuisance proportions are: Potamogeton pectnatus, Hydrilla
verticillata, Myriophyllum sp. The infestation of aquatic plants have
resulted in reduction of open water area and their potential for water
supply, navigation, fishing and recreational values.
(v) Invasion of Exotic Species
Severe problems encountered in Wetlands due to the invasion of exotic
species like Eichornea crassipes, Salvinia molesta, S. natans, and
Azolla sp. These species have profusely grown in the lakes posing
threat to endemic species. The prolific growth of the weeds has led to
the problems of anoxic (with out oxygen) conditions and changes in the
flora and fauna. Similarly, introduction of exotic fish species has
affected the genetic variability of endemic fish species.
(vi) Aquaculture
Large areas of wetlands particularly in coastal region have been
converted for aquaculture leading to problems of salinisation,

30
eutrophication, and decrease in biodiversity. In some lakes like Kolleru,
fish ponds have been constructed to maximise the fish production. The
addition of fish feed, manures, antibiotics etc. have resulted in
formation of algal blooms and drastic reduction in oxygen
concentration. All these changes have seriously affected water quality
in these wetlands.
(vii) Encroachment
Since wetlands are multiple value systems, areas have been converted
for agriculture and other development activities. These intrusions have
led to the shrinkage of the wetland area leading to adverse impacts on
the ecosystems. The problem of encroachment is particularly
pronounced in urban wetlands where conversion for settlements,
industrial activities, and tourism has been going on without any check.
The impact of human activities in the catchment area, particularly by
diversion of river waters, can be seen in the way of changes in the
hydrological regimes consequently affecting the water levels and
causing fluctuations.(Kaul & Trisal 1996,ILEC Report)
A combination of all the above threats has resulted in shrinkage of the wetland area
and decline in biodiversity and resource base and their potential to meet needs of
the people dependent on these resources . Further these polluted aquatic systems
are breeding ground for mosquitoes, snails, leeches and other vectors of many fatal
diseases of mankind and livestock. These factors are not only more pronounced in
tropical regions, but have also greater socio-economic important for the developing
countries. Thus there is an urgent need for a systematic survey and inventorisation
of all natural and man made fresh water aquatic ecosystems of India from ecological
point of view to understand its structure and function in detail. (Naik, 1998)
1.9.3 Conservation and Management of Wetlands
Considering the importance and the pressures of human activities on the wetlands,
the Government of India launched a programme for conservation and management
of wetlands in 1986. A number of wetlands viz. Wular lake (J&K), Harike lake

31
(Punjab), Sukuna (Chandigarh), Renuka (Himachal Pradesh), Sambar lake and
Pichola-Fathesagar (Rajasthan), Lower and Upper lakes of Bhopal (Madhya
Pradesh), Loktak lake (Manipur), Ujni (Maharastra), Chilika (Orissa), Kolleru (Andhra
Pradesh), Salt Lake (West Bengal), and Ashtamudi and Sasthamkota (Kerala), were
selected for intensive conservation and management purposes. Management action
plans were prepared by the concerned State Governments and financial support was
provided by the Central Government for implementation of these plans based on the
specific problems encountered in these wetlands.
Table 1.4: Lakes under NLCP for intensive conservation and management
Name of lake State Dal Bhoj Sagar Hussain Sagar Nainital Kodaikanal Ooty Powai Udaipur Lakes system Sukhana Rabindra Sagar
Jammu and Kashmir Madhya Pradesh Madhya Pradesh Andhra Pradesh Uttar Pradesh Tamil Nadu Tamil Nadu Maharastra Rajasthan Chandigarh West Bengal
Source: ILEC Report 1996
The Ministry of Environment and Forests, Government of India had launched the
Ganga Action Plan in 1985, to check pollution in this river system and increase its
assimilative and self-purifying capacity. The experience has been extremely useful to
initiate activities for improving the water quality in other 13 major rivers in the
country. Since lakes located in urban areas are subject to heavy loads of pollution
and other anthropogenic pressures, the National Lake Conservation Plan (NLCP)
aims to check pollution and improvement of water quality in the selected lake
ecosystems.The main objectives of the National Lakes Conservation Plan include
the following:

32
(a). Prevention of pollution from point and non-point sources through
interception, diversion and treatment of sewage, construction of low
cost sanitation facilities, provision of bathing and washing ghats, etc.
(b) Catchment area conservation through afforestation and construction of
micro-water sheds.
(c) Desilting and weed control through conventional methods of dredging
and manual labour.
(d) R&D studies on floral and faunal activities and related ecological
aspects.
(e) Other activities depending on the lake specific conditions such as
integrated development approach including interface with human
population.
34
CHAPTER II : ECONOMIC VALUATION OF NATURAL RESOURCES
AND WETLANDS IN PARTICULAR
Nature has given a lot to mankind. Human beings survive on this planet by fulfilling all
their needs through natural resources. Be it food, water or air, natural resources are
essential for the survival of man. Unfortunately, the use of natural resources has not
always been optimal. It rotates between gross overuse to misuse mainly because these
resources have no price or a very nominal one attached to them. Efficient use of natural
and environmental resources requires knowledge of the value of these resources in
various uses (Prato, 1998). Market prices do not always reflect the full social cost of
resource use. Many uses cannot be thus valued in the market place because of
incomplete or non-existent markets.
2.1 Economic Value
Economic value can be defined as an attempt to assign quantitative values to the goods
and services that are provided by environmental resources, whether or not market
prices are available for them. The economic value of any good or service is generally
measured in terms of what we are willing to pay for the commodity less what it costs to
supply it (Barbier, Acreman and Knowler, 1997). The question that arises at this point is
why value environmental resources at all. The answer to this question has been
answered by many environmental scientists in the following way: The ever increasing
population load is creating a number of problems for the natural resources stocks that
we have. Pollution and unsustainable use have led to degradation and depletion of a
number of these resources. We many a time are aware that a particular resource is
important but in spite of that, we are unable to decide upon a wise use plan for the
same. Many environmental resources are complex and multifunctional and we may not
yet be aware of all the goods and services provided by these resources. The decision
of using a resource and to what extent, or to conserve it for future use are very tricky
and in fact cannot be planned properly without knowledge of all the values that are
gained and lost under each of the resource use option possible, and careful
consideration of the same. Preservation, sustainable use or total development, are the

35
usual options according to which a resource may be utilised or conserved. Thus
valuation may serve to improve the management of environmental resources in a way
that is suitable not only for the current generation but also for future generations. The
economic efficiency of the various competing uses of the resource is thus the main
criteria for deciding its pattern of consumption in the future. Economic valuation is
actually concerned with the proper allocation of environmental resources in order to
improve human welfare. It thus serves as a very important tool in the hands of the
decision / policy maker.
2.2 Total Economic Value
The marketable and non-marketable benefits together constitute the total economic
value of any resource. These can be of many types; mainly:
Use values: Use values involve some human interaction with the resource as is evident
from the name itself. These may be of two types again - direct use values and indirect
use values. The former is as the name suggests tangible in nature while the latter may
be indirect in the form of an intangible benefit. The value obtained from the
microclimatic stabilisation effects of a forest ecosystem, for example, for which the
people do not pay anything, is an indirect use value. Since the indirect use values are
actually unmarketed they become difficult to quantify and till now have been generally
ignored in spite of being so important.
Option values: An environmental resource has option value if the future benefits it
might yield are uncertain and depletion of the resource is effectively irreversible (Prato,
1998) - which is the case with most natural resources. In this case one may be willing
to preserve the option, in the chance that it might prove valuable in the future. In this
context quasi option value is defined as the expected value of the information derived
from delaying exploitation and conversion of the resource today.
Existence values: Sometimes a resource may be having an intrinsic value known as
existence value. It is a form of non-use value where the individual’s moral concerns
about environmental degradation, empathy for other species and the satisfaction that he

36
/ she derives from the mere existence of a certain resource which the person is not in
direct contact with. Bequest value is a type of existence value where one would desire
to leave an unspoiled planet for one’s descendants.
Thus the total economic value of an environmental resource has also been expressed
as:
TEV = DUV + IUV + OV + EV
Where, TEV = Total Economic Value
DUV = Direct Use Value
IUV = Indirect Use Value
OV = Option Value
and EV = Existence Value
An example of the concept of TEV is being shown through the Fig 2.1 which takes into
account all values emerging from an environmental resource, say a forest.
But again the pure additive form of the total economic value has not been accepted by
all natural resource economists. Some writers regard intrinsic value as part of existence
value rather than as its equivalent (Randall and Stoll,1983). On the other hand, others
regard intrinsic value as being inclusive of option value (Fisher and Raucher, 1983).
These variations in definitions most probably arise from what exactly is meant by ‘use’.
The concept of existence value and bequest value need further investigation since in
some cases double accounting may easily take place in case the equation mentioned
above is taken as it is. Therefore the uses have to be carefully defined in order to avoid
problems that may arise in trying to separate various values.

37
Fig 2.1: Categories of Economic Values Attributed to Environmental Assets (With Examples from a Tropical Forest)
2.3 Valuation Methods
A variety of economic techniques and models have been developed for assigning
monetary values to gains or losses associated with changes in the availability (quantity)
or character (quality) of environmental amenities. The aim of these techniques is to
obtain an estimate of the value of an environmental amenity that would be revealed if
there were a competitive market for the amenity or stated in a survey. The values could
be obtained either through direct valuation or through indirect valuation and thus could
be expressed in monetary terms. But in some cases it is difficult to ascertain their
TOTAL ECONOMIC
USE VALUE NON-USE
DIRECT USE VALUE
INDIRECT USE VALUE
OPTION VALUE
EXISTENCE VALUE
OTHER NON-USE VALUES
Output that can be consumed
Functional Benefits Future
Direct and Indirect Use
Value from knowledge of continued
• Food • Biomass • Recreation • Health
• Ecological functions
• Flood Control
• Biodiversity
• Conserve • Habitats • Endangere
d Species
Decreasing “tangibility” of value to individuals
Source: Munasinghe and McNeely,

38
monetary values as only qualitative information like preferences, ordering, priorities or
their presence or absence are available. In such cases non-monetary valuation
techniques are used to capture the value of the resource. Valuation methods have been
classified mainly into two categories (Fig: 2.2)
A. Monetary Techniques
Monetary valuation is a method of valuing goods and services at their market prices
which are available directly or indirectly. In other words when the change in the
environmental quality affects actual market-related production, it is captured through
market prices. Such market may be conventional or existing or surrogate or implicit or
constructed or simulated market based on actual or potential behaviour of the
consumer.
Fig 2.2: Valuation Method Source: ESCAP, 1997( A and B are added to the original structure to express the broad categories of valuation methods)
VALUATION METHODS
Physical Linkage (Scientific)
Abatement Cost (Technical)
Behavioural Linkage (Economic)
Revealed Preference Methods
Stated Preference Methods
A. Monetary Techniques (Cardinal Approach)
B. Non Monetary Technique (Ordinal
Multi criteria analysis
39
2.3.1 Physical Linkage Methods
Dixon and others (1994) termed these methods as objective but they are now known as
scientific, because they depend on a cause and effect relationship between
environmental change and other objects such as products, processes or persons. In the
physical linkage approach, environmental values are estimated by establishing
relationships between the physical effects of some environmental change on some
other factors such as human health, productivity or earnings. Assessing the impact of
pollution on ecosystems, on productivity of a fishery, or depreciation of a physical asset
may also be necessary. The next step is to quantify these impacts and then value them
to arrive at the value of the environmental changes. The physical linkage approach is
also known as the damage cost or dose – response approach. Changes in net benefits
as revealed in physical terms or market prices caused by environmental damage are
actually to be measured. Alternatively, benefits can be measured as the increased
productivity due to improved environmental quality. The physical linkage method can
also be used to establish the loss in visibility and its impact on traffic accidents and
delayed flights as expressed in figure 2.3.
The cost of illness (COI) measures the cost of environmental damage in terms of direct
outlays for the treatment of illness (hospital care, cost of medicines, cost of the services
of physicians and other medical personnel) plus indirect losses in output due to illness
measured by social cost of lost earnings (Rezeler, 1993). The COI approach however,
does not take into account the expenditure incurred by the individual to avoid illness,
e.g. vaccines, the value of personal pain, suffering and inconvenience associated with
the illness. This kind of expenditure or cost to avoid the illness or diseases is captured
through the preventive cost approach in the revealed preference technique discussed
separately in the defensive cost approach. The problems with COI technique are that a
great number of people affected by diseases do not approach hospitals due to lack of
awareness, accessibility and affordability. Moreover, the entire health care system is

40
heavily subsidised and hence an estimate based on actual expenditure will be far lower
than the true expenditure and associated opportunity cost.
Figure: 2.3 Physical linkage methods. Some methods that follow the physical linkages as described above are: 2.3.1.1 Cost of Illness
2.3.1.2. Human Capital Approach
The Human Capital (HK) approach for valuing morbidity assumes that the value of an
individual is the potential of production the person possesses. Once the damage
function is obtained, the essential factor is the unit economical value of the physical
damage (mortality / morbidity). A product of the numerical values of both the number of
people affected or dead and the unit cost of treatment or death will provide the
monetary value of health damages (OECD, 1989). The HK method also fails to account
for intangibles like pain and suffering. Yet, the adjusted HK method is considered to be
the most appropriate method for evaluating environmental policies that involve risk to
human life.
Health
Cost of Illness Human Capital Adjusted HK Financial Non-labour DALY Loss of IQ Mortality Agriculture Loss in Yield Livestock Loss in Forests Visibility Delayed Flights Traffic Accidents & Delays Property Depreciation Restoration
Source: ESCAP, 1997

41
2.3.1.3. Statistical Value of Life
An alternative approach to the delicate question of valuing human life is to analyse the
behaviour of people in paying for reduction in risk to their life or accepting compensation
for undertaking risky jobs. There are a number of assumptions that have to be taken up
for this method to be applicable, which are not always true for the Indian conditions.
Thus there are also objections raised against use of this method.
2.3.1.4 Production Function Approach
Besides using market prices, productivity approach/production function approach can
also be used to measure changes in the quality of resource. This approach tries to
estimate the present value of loss in production / output now and in future. In case of
measuring changes in productivity of soil, the approach could be to estimate the value
of changes in soil quality based on loss in productivity and the possibility of restoring
soil quality through ameliorative measures (Parikh K., 1990). While measuring quality
by yield input relationship, yield is taken to be a product of a function (f) of inputs &
another function (g) of soil quality parameter. The function f is called the input response
function and function g the soil quality multiplier function.
Yield = f (inputs) g (soil quality parameters)
The first objective is to obtain an estimate of soil quality multiplier in terms of easily
observable and measurable parameters. The amount of potential yield or profits forgone
due to a lower value of soil quality multiplier is a measure of the cost of depreciation of
soil (ESCAP, 1997). The soil quality multiplier is determined by a set of inherent
physical and chemical properties of soil. In such a case the percentage change in
present value of annual property from land (V) shall be same as the percentage change
in the value of soil quality function of (Q). This could be expressed as :
V* (Q0) = V* (Q1) = g (Q0) – g(Q1)
V* (Q0) g (Q0)

42
Percentage change in = Percentage change in value of
Value of land soil quality function.
Thus in a competitive set up
Cost of land = Min [(Avoidence cost ) , (Restoration Cost),
Degradation (Loss in productive asset value)]
In the same manner the cost of degradation of wetlend could be measured where we
could use water quality parameters. Changes in water quality parameters like total
colliform organisms, pH value, Dissolved Oxygen Demand and Biochemical Oxygen
Demand could be assessed to find out how the quality of water has changed from A
class that is drinking water without conventional treatment to other classes may be B
(outdoor bathing) or C (drinking water source after conventional treatment and disinfect
ion), or D (propagation of wildlife and fisheries) or E( irrigation and industrial cooling,
controlled waste disposal).
Further if the wetland is also used as a productive asset in case of fisheries, the
changes / deterioration in water quality shall also affect the fish production. Thus loss in
earning due to fall in fish production could also be as an indicator of falling wetland
productivity.
2.3.2. The Abatement Cost Methods
The abatement costs methods looks at valuation from the supply angle as opposed to
the other two methods, which approach it from the point of view of demand for
environmental amenity. These are known as technical methods or the maintenance cost
method as this cost would maintain the environmental quality at a constant level. For
example, installation of electrostatic suspended precipitators tso remove suspended
particulate matter (SPM) from a boiler or furnace, etc. The value of damage due to a

43
tonne of SPM can thus be calculated as the cost of removing one tonne of SPM. This is
the capital cost of the abatement equipment annualised over the life- time of the
equipment with the annual variable cost added to it.
In developed countries, the marginal abatement cost is likely to be nearly equal to the
marginal social cost. Therefore abatement costs can be used as proxy social cost. But
in developing countries, this does not always happen. The marginal social cost may
exceed the abatement costs but yet, nothing may be done. Thus, the abatement cost
approach should be followed only if the abatement costs have actually been incurred.
Otherwise the damages experienced by society – in the absence of abatement
measures – should be worked out.
2.3.3. Behaviour Linkage Methods
Valuation techniques assume that the value of an environmental resource is equal to
the people’s willingness to pay (WTP) to secure better environmental quality or to
escape environmental deterioration. Classification of these techniques that seek to
estimate behavioural parameters are based on whether the results are revealed in the
market place or stated in a survey. These are also of two types:
2.3.3.1 Revealed Preference Methods
In the revealed preference methods the value of an environmental amenity is estimated
indirectly from the purchase price of a commodity whose market value at least partly
depends upon the quality of the environmental amenity in question. The value of an
unpriced amenity like environmental quality or scenic beauty is inferred by using
statistical analysis to examine how a change in amenity affects the observed purchase
price offer related private good. These methods are based on actual information
revealed in the marketplace.
Cost of avoidance or Preventive Cost
Cost of avoidance (COA) or Preventive Cost approach takes into account the
expenditure incurred by individual to avoid illness. For example to avoid the incidence of

44
water borne diseases people resort to water treatment devises like filters, aquaguard,
zero B or boil water or go for vaccination of Hepatitis B or A to prevent themselves from
water borne diseases. Similarly people use mosquito coils, nets or spray’s at home to
avoid malaria or wear helmets to avoid fatal head injuries in case of accidents. Many a
times it is observed that the cost of averting illness is much less than the expenses
incurred on curing illness and thus this expenditure is preferred by consumers over the
cost of curing the illness.
Travel Cost Method
Travel cost method is a market - based approach for estimating nonmarket values. It is
mainly used to measure the benefits associated with recreational resources, such as
parks, rivers, or beaches (Goodstein, 1995). The idea behind this method is to measure
the amount of money that people spend in order to utilise a particular resource. Demand
is estimated by relating the number of visits to the cost per visit. This method recognises
that the visitors who reside farther away from the site incur a higher travel cost than
visitors who reside near the site. Thus, this method actually uses the variation in the
cost of traveling to a particular site (travel cost) as a proxy for variation in the cost per
visit.
The basic travel cost method was first discussed by Hotelling. The theoretical basis for
this method lies in the household production function theory developed by Becker,
Lancaster, Hori and Bockstael and Mc Connell.
The travel cost method has certain limitations and ambiguities, some of which have
been remedied over the years. These usually include exclusion of non use values such
as option, existence and bequest values, selection of the variable for measuring use
rates (number of visits or visitor days), downward bias in estimates of consumer surplus
from omitting time cost and the price of substitute sites from the demand function,
valuing the opportunity cost of travel time and on-site time, accounting for multiple
characteristics of a site and multiple reasons for visiting a site, and choice of the
mathematical form of the travel cost demand function ( Prato, 1998).

45
Hedonic Pricing
The word hedonic means pertaining to pleasure; the hedonic pricing method estimates
the pleasure or utility associated to with an improved environment. The value of a piece
of land is related to the streams of benefits to be derived from the land. Agricultural
output and shelter are the most obvious of such benefits, but access to the workplace,
to commercial amenities and to environmental facilities such as parks, and the
environmental quality of the neighbourhood in which the land is located are also
important benefits which accrue to the person who has the right to use a particular piece
of land (Pearce and Turner, 1990).
The hedonic pricing method is based on the premise that the observed market price of a
marketed good is a function of the prices of the numerous attributes of that good. For
example, the incremental value of owning a house with a scenic view is the price of a
house with a scenic view minus the price of a house without a scenic view, provided all
other attributes of the two houses are similar. It is well known that differences in
residential property values can arise from any sources, such as the amount and quality
of accommodation available, the accessibility of the central business district, the level
and quality of taxes that have to be paid on the property, and the environmental
characteristics of the neighbourhood, as measured by the levels of air pollution, traffic
and aircraft noise, and access to parks and water facilities. In order to pick up the
effects of any of these variables on the value of a property, they all have to be included
in the analysis. Hence such studies usually involve a number of property variables, a
number of neighbourhood variables, a number of accessibility variable and finally the
environmental variables of interest. If any variable that is relevant is excluded from the
analysis then the estimated effects on property value of the included variables could be
biased. Whether the bias is upward or downward, depends on how the included and the
excluded variables relate to each other and to the value of the property. On the other
hand, if a variable that is irrelevant is included in the analysis then no such systematic
bias results, although the estimates of the effects of the included variables are
somewhat less reliable. Typically, many of the variables of interest are themselves very
closely correlated. So, for example, accessibility to the town centre is often closely

46
related to some measures of air pollution, and one measure of air pollution such as total
suspended particulate matter, is very closely correlated to other measures such as
sulphur dioxide. To overcome this, many studies use only one ‘representative’ measure
of pollution (Pearce & Turner, 1990)
The first stage in the hedonic price approach, then, is to estimate an equation of the
form:
Property price = f(property variables, neighbourhood variables, accessibility variables,
environmental variables)
Or, symbolically,
PP = f(PROP, NHOOD, ACCESS, ENV)
Where, f(…) simply means ‘is a function of’(depends upon). This equation can be
further expressed as:
lnPP = alnPROP + blnNHOOD + clnACCESS + dlnENV
where, ‘ln’ simply refers to logarithm. By feeding in the observed values for property
prices, the property variables, the neighbourhood, accessibility and environmental
variables, a simple computer program will generate the values of a, b, c and d. In this
case, the value of d will tell us how much property prices vary if we alter the value of the
environmental variable (Pearce & Turner, 1990). Alternatively property prices can be
examined to detect any premium paid for location with the desired amenity (Streeting,
1990). The premium can be taken to reflect the value of the amenity.
The hedonic price function is typically estimated using regression analysis. Several
drawbacks of the method exist. Marginal prices are not accurate unless all the attributes
are included in the hedonic price function. Data for estimating the hedonic price function
are often difficult to acquire, especially for goods that have slow turnover rates. Further
households may not be aware of differences in the attributes being valued.
47
2.3.3.2 Stated Preference Methods
This methods differ from the methods presented above as they are employed when little
or no actual market information exists as a proxy value. These methods assume that
people respond to hypothetical market situations as if they were actual markets. The
methods rely upon what people say they would buy, if the market existed. In this event,
a representative sample survey of human population is conducted to collect specialized
data on their willingness to pay (WTP) to secure a benefit or their willingness to accept
(WTA) a compensation to bear a loss or damage. Based on these responses the value
of good or a service for each person questioned can be determined and then
extrapolated to estimate the aggregate effect on the target population. Some of these
important methods are discussed below.
Contingent Valuation Method
The contingent valuation method first came into use in the early 1960s when economist
Robert K.Davis used questionnaires to estimate the benefits of outdoor recreation in a
Maine backwoods area. According to Davis, 1963, this method would put the
interviewer in the position of a seller who elicits the highest possible bid from the user
for the services being offered. The ultimate aim of a contingent valuation survey is to
typically obtain an accurate estimate of the benefits (and sometimes the costs) of a
change in level of provision of some public good, which can thus be used in a benefit-
cost analysis.
The CVM uses survey questions to elicit people’s preferences for public goods by
finding out what they would be willing to pay for specified improvements in them. The
method is thus aimed at eliciting their willingness - to - pay (WTP) in monetary terms
(Mitchell and Carson, 1989). The idea is to compensate for the absence of markets for
the goods and services being valued by presenting the consumers with hypothetical
markets in which they can buy the good in question. Because the elicited WTP values
are contingent upon the particular hypothetical market described to the respondent, this
approach came to be called the contingent valuation method (Brookshire and Eubanks,
1978; Brookshire and Randall, 1978; Schulze and d’Arge, 1978).

48
The CVM is thus actually a public survey in which the respondents are presented with
material, in the form of a personal interview usually, which consists of three parts
(Mitchell and Carson, 1989):
1. A detailed description of the good(s) being valued and the hypothetical
circumstance under which it is made available to the respondent.
2. Questions which elicit the respondent’s willingness to pay for the good(s) being
valued.
3. Questions about respondent’s characteristics (for example, age, income), their
preferences relevant to the good(s) being valued, and their use of the good(s).
In case of a well designed and carefully pretested study, the respondents’ answers to
the valuation questions should represent valid WTP responses. From these a benefit
estimate is developed. The results are then generalised with a known margin of error to
the population from which the respondents were sampled. It has been found by many
people that the respondent’s value statements are highly dependent on the information
contained in a CVM questionnaire (Fischoff and Furby, 1988).
The CVM is based on two major principles of neo-classical economics (Hoevenagel,
1994). These are:
i) Value of any good depends on its utility to individuals, and
ii) Individuals behave rationally, that is they will maximise their utility.
Private Goods Market Model
In a private goods market model, a scenario is usually described to the respondent
where the opportunity to obtain the benefits of amenities is offered at a range of prices.
This model is best suited to quasi-private goods such as access to beaches, fishing
rights or any other amenity, where a permit to access (to the exclusion of others) is
feasible. Application of this model to public environmental amenities, such as clean air,

49
tend to be less successful as the procedure usually requires the respondents to imagine
that they can own and use the amenity to the exclusion of other persons.
The elicitation method often used in the private goods model is a bidding game
technique designed to resemble an auction. The interviewer raises or lowers the bid
until the respondent decided to make a purchase, thereby revealing his maximum
willingness to pay. In an open-ended question, the opening bid or the final valuation can
be stated by the respondent without any prompting. In a close-ended format,
respondents are asked to answer ‘yes’ or ‘no’ to a proposed payment.
The Referendum Method
In the referendum method, respondents are asked whether they would be willing to pay
or sacrifice a specific amount of money in order to preserve the environmental amenity
in question. A referendum can also be held about a specific action, where there is a
discrete choice, and the answer can only be yes or no. A range of amounts are put to a
number of subsamples. The referendum model can be used to elicit respondents’ votes
on a tax level or the tax rate for the provision of a public amenity. It has been
extensively used in the developing countries. For example, in Austria, a nuclear power
plant already built at Zwentendorf was mothballed following a referendum. The value of
foregone benefits and additional expenses for alternative electricity could be considered
as the cost of avoiding risks of nuclear power.
B. Non – Monetary Techniques
Non-Monetary or ordinal valuation techniques value good and services to reflect utility
and preferences of the consumers in the absence of markets. It is based on qualitative
information like preferences, ordering or priorities for goods and services as expressed
by wide spectrum of the society. It is based on the premise that the higher the
preference or dependence on a resource, higher will be the value assigned to it by the
people. The relative value of a resource can be measured by a score and rank obtained
from ordering assigned to uses. A technique known as ‘Multi Criteria Analysis’ (MCA)

50
can be used to convert such ordinal or relative information into quantitative weights for
different resource uses to elicit its use and non use values.
2.4 Factors Affecting Values
Factors that affect a person’s assignment of value to an object (e.g. a good, situation or
possible outcome) can be grouped into those factors that the person brings to the
valuation situation and those that characterise the valuation situation itself. Factors that
the person brings to the valuation include:
1. a collection of held values (Brown, 1984; Rokeach, 1973), beliefs, and dispositions
2. a physical and emotional state; and
3. an endowment of current and expected assets (figure 2.4)
Various factors characterising the context of the valuation include response mode,
relative magnitudes, order effects, stimulus mixture, informational cues, constituency,
iterations of valuation, and social setting.

51
Fig. 2.4 : Framework for Assignment of Value to Objects
Source: Brown and Slovic, 1988
2.5 Valuation of Wetlands
Wetland resources today are fast depleting and a major reason for this and the
conversion of wetlands to other forms of land systems is that most of the benefits from
the wetlands are non-marketable and hence not valued at all. This holds true mainly for
the environmental and recreational benefits obtained from wetlands. Development of
wetlands often leads to loss of environmental benefits but these losses are naturally
understated since they have never been valued due to the lack of a suitable market for
them. Valuation is thus an important step towards improving the management of these
wetlands.
But a major difficulty that faces economic valuation of wetlands is the lack of information
regarding the complex environmental system and the ecological and hydrological
processes that result in the values. Because of this the valuation attempted may turn
out to be grossly understated at times.
Held Values, Beliefs, Dispositions; Physical and Emotional State; Endowment
Object(s)
VALUATION CONTEXT
Relevant Beliefs…..
Perception
Utility Assigned Value

52
Total Economic Value for wetlands has been shown for wetlands to exist as the
following mainly:
Table 2.1: Classification of Total Economic Value for Wetlands
USE VALUES NON-USE Direct Use Value Indirect Use Value Option and Quasi-
Option Value Existence Value
- Fish - Agriculture - Fuelwood - Recrecation - Transport - Wildlife
harvesting - Peat/energy
- Nutrient retention
- Flood control - Storm
protection - Ground water
recharge - External
ecosystem support
- Micro climatic stabilization
- Shoreline stabilization, etc.
- Potential future uses (as per direct and indirect use)
- Future value of information
- Biodiversity - Culture,
heritage - Bequest values
Source: Barbier, Acreman & Knowler, 1997
Most of the ecological services, biological resources and amenity values provided by
wetlands are in the form of what are known as public goods. Since these kinds of goods
are not marketed and are obtained for free, these benefits and values are considered to
have the same virtue, that is they are believed to be free goods. As per the principles of
the Ramsar Convention, wetlands are believed to have great value. Conservation of
these fast depleting wetlands would be possible if these wetlands can be shown to have
immense value and in cases, more value than the alternative uses of the wetland site or

53
the water feeding it. Hence, valuation can result in the saving of the wetland from death,
in the form of conversion to other uses.
2.6 Contingent Valuation Method in Detail
Contingent Valuation Method being the method to be used in the study, some important
concepts and issues are being described here in details along with a section on
literature review.
2.6.1. Validity of CV Studies
Validity refers to the extent to which an instrument measures the theoretical construct
under investigation, (Mitchell and Carson, 1989). In other words, it can be expressed as
the amount of money that the respondent would actually pay up, if a market for the good
really existed (Hoevenagel, 1994). The validity of CV is very difficult to determine
because the true values of any commodity, even those bought and sold in the market, is
unknown (Smith, 1991). The main way of inferring validity for CV studies has been to
compare values derived from a contingent valuation survey with values for the same
good derived from other valuation methods but again the validity of these methods too
is under question. There have been a number of such comparative studies, which prove
that similarities between values thus obtained do exist. Thus it can be said that CV can
provide reasonable estimates of the value of environmental goods. Statistical methods
like regression can be used to test the internal validity of this survey technique.
2.6.2. Reliability of CV Studies
Reliability refers to the extent to which the variance in the elicited WTP values results
from random sources (Hoevenagel, 1994). Thus efforts have to be made to increase the
reliability of the results of a CV survey, because the more random the respondent’s
WTP amounts, the greater the chance that a study’s mean WTP amount could be very
different from the true amount for the good. Some variance is inevitable in contingent
valuation estimates, of course. But CV studies using relatively small samples or having
scenarios that respondents find unclear or unrealistic could obtain estimates, which
differ from a true mean by large amounts. As a basis for making benefit-cost

54
determinations, their findings can easily be meaningless (Mitchell and Carson, 1989).
The variance in the WTP amounts may be due to two sources: i) the variance
introduced by the sample and ii) the variance introduced by the instrument. Techniques
are available to measure the variance due to both. Unfortunately, these procedures are
expensive to carry out properly, and for that reason they are not performed routinely in
sample surveys.
For the former type of variance, a large sample size should be used. While for the
instrument reliability, a first requirement is to create a realistic, plausible and meaningful
CV scenario. This is because a more realistic scenario will generate similarly realistic
values rather than mere guesses. But care has to be taken in order to avoid biases that
may creep in during the effort to create a more real situation. A general way of
examining the reliability of such surveys is through assessing the consistency of the
stated WTP values over time (Hoevenagel, 1994).
2.6.3. Biases in CVM
The CVM arises out of the basic assumption that intentions reflected actual behaviour,
that is stated WTP reflects actual WTP (Bateman). Attitudes are supposed to affect
behaviour but cannot be taken to be exactly identical to the same. Moreover
behavioural feed-backs can affect future attitudes. A biased survey is that in which the
respondent may consciously or unconsciously modify stated WTP to differ from actual
WTP. There exist many kinds of biases. A description of these biases is provided in the
table below in order to obtain a proper view of the same.

55
Table 2.2 Typology of Potential Response Effect Biases in CV Studies
1. Incentives to Misrepresent Responses Biases in this class occur when a respondent misrepresents his or her true WTP
A. Strategic Biases: Where a respondent gives a WTP amount that differs from his or her true WTP
amount (conditional on the perceived information) in an attempt to influence
provision of the good and / or the respondent's level of payment for the good.
B. Compliance Bias: 1. Sponsor Bias: Where a respondent gives a WTP amount in an
attempt to comply with the presumed expectations of the sponsor
(or assumed sponsor).
2. Interviewer Bias: Where a respondent gives a WTP amount that
differs from his or her true WTP amount in an attempt to either
please or gain status in the eyes of a particular interviewer.
2. Implied Value Cues
These biases occur when elements of the contingent market are treated by
respondents as providing information about the "correct" value for the good.
A. Starting Point Bias: Where the elicitation method or payment vehicle directly or indirectly introduces a
potential WTP amount given by a respondent. This bias may be accentuated by a
tendency to yea-saying.
B. Range Bias: Where the elicitation method presents a range of potential WTP amounts that
influences a respondent's WTP amount. C. Relational Bias:
Where the description of the good presents information about its relationship to
other public or private commodities that influence a respondent's WTP amount.

56
D. Importance Bias: Where the act of being interviewed or some feature of the instrument suggests to
the respondent that one or more levels of the amenity has value.
E. Position Bias: Where the position or order in which valuation questions for different levels of a
good (or different goods) suggest to respondents how those levels should be
valued.
Scenario Misspecification
Biases in this category occur when a respondent does not respond to the correct
contingent scenario. Except in A, in the outline that follows it is presumed that the
intended scenario is correct and that the errors occur because the respondent
does not understand the scenario as the researcher intends it to be understood.
A. Theoretical Misspecification Bias: Where the scenario specified by the researcher is incorrect in terms of economic
theory or the major policy elements.
B. Amenity Misspecification Bias: 1. Symbolic: Where a respondent values a symbolic entity than the
researcher's intended good.
2. Part - Whole: Where a respondent values a larger or smaller
entity than the researcher's intended good.
a. Geographical Part-Whole: Where a respondent
values a good whose spatial attributes are larger or
smaller than the spatial attributes of the researcher's
intended good.
b. Benefit Part - Whole: Where a respondent includes
a broader or a narrower range of benefits in valuing
a good than intended by the researcher.
c. Policy-package Part - Whole: Where a respondent
values a broader or a narrower policy package than
the one intended by the by the researcher.
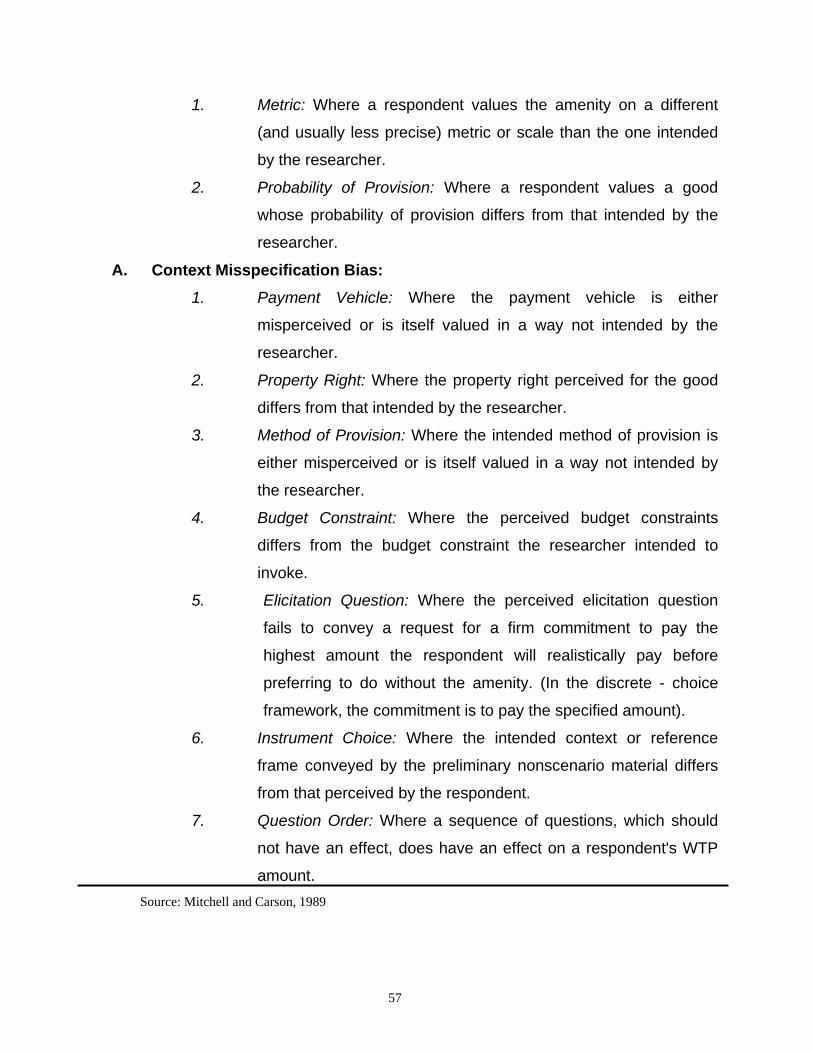
57
1. Metric: Where a respondent values the amenity on a different
(and usually less precise) metric or scale than the one intended
by the researcher.
2. Probability of Provision: Where a respondent values a good
whose probability of provision differs from that intended by the
researcher.
A. Context Misspecification Bias: 1. Payment Vehicle: Where the payment vehicle is either
misperceived or is itself valued in a way not intended by the
researcher.
2. Property Right: Where the property right perceived for the good
differs from that intended by the researcher.
3. Method of Provision: Where the intended method of provision is
either misperceived or is itself valued in a way not intended by
the researcher.
4. Budget Constraint: Where the perceived budget constraints
differs from the budget constraint the researcher intended to
invoke.
5. Elicitation Question: Where the perceived elicitation question
fails to convey a request for a firm commitment to pay the
highest amount the respondent will realistically pay before
preferring to do without the amenity. (In the discrete - choice
framework, the commitment is to pay the specified amount).
6. Instrument Choice: Where the intended context or reference
frame conveyed by the preliminary nonscenario material differs
from that perceived by the respondent.
7. Question Order: Where a sequence of questions, which should
not have an effect, does have an effect on a respondent's WTP
amount. Source: Mitchell and Carson, 1989

58
The summarisation of problems regarding methodological issues in CVM identified by
the National Oceanic and Atmospheric Administration Panel (Arrow et al., 1993) can be
described as follows:
1. The difficulty of external validation of contingent valuation results.
2. Results that are inconsistent with the tenets of rational choice.
3. Results that seem implausible large in view of the many environmental goods
which may need to be paid for.
4. The few contingent valuation applications that remind respondent's of budget
constraints and substitute goods.
5. Difficulties in communicating complex scenarios to respondents so that they
understand and answer the question intended by the researcher.
6. Issues of what population value estimates should be aggregated over.
7. The 'warm glow' effect where respondents are expressing WTP for the good
feeling from giving rather than payment for the good in question.
Guidelines for the same have also been formulated by the same panel for carrying out
contingent valuation.
1. Sample type and size: Probability sampling is essential. The choice of sample –
specific design and size is a difficult, technical question that requires the
guidance of a professional sampling statistician.
2. Minimise non-responses: High non-response rates would make CV survey
results unreliable.
3. Personal Interview: It is unlikely that the reliable estimates of values can be
elicited with mail surveys. Face-to-face interviews are usually preferable,
although telephone interviews have some advantages in terms of cost and
centralised supervision.

59
4. Pretesting for interviewer effects: An important respect in which CV surveys differ
from actual referenda is the presence of an interviewer (except in the case of
mail surveys). It is possible that interviewers contribute to ‘social desirability’ bias,
since preserving the environment is widely viewed as something positive. In
order to test this possibility, major CV studies should incorporate experiments
that assess interviewer effects.
5. Reporting: Every report of a CV study should make clear the definition of the
population sampled, the sampling frame used, the sample size, the overall
sample non-response rate and its components (such as refusals), and item non-
response on all important questions. The report should also reproduce the exact
wording and sequence of the questionnaire and of other communications to
respondents (such as advance letters). All data from the study should be
archived and made available to interested parties.
6. Careful pretesting of a CV questionnaire: Respondents in a CV survey are
ordinarily presented with a good deal of new and often technical information, well
beyond what is typical in most surveys. This requires very careful pilot work and
pretesting, plus evidence from the final survey that respondents understood and
accepted the description of a good or service offered and the questioning
reasonably well.
7. Conservative design: When aspects of a survey design and the analysis of the
responses are ambiguous, the option that tends to underestimate willingness to
pay is generally preferred. A conservative design increases the reliability of the
estimate by eliminating extreme responses that can enlarge estimated values
wildly and implausibly.
8. Elicitation format: The willingness to pay format should be used instead of
compensation required because the former is the conservative choice.
9. Referendum format: The valuation question generally should be posed as a vote
on a referendum.

60
10. Accurate description of the programme or policy: Adequate information must be
provided to respondents about the environmental programme that is offered.
11. Presting of photographs: The effects of photographs on subjects must be
carefully explored.
12. Reminder of substitute commodities: Respondents must be reminded of
substitute commodities. This reminder should be introduced forcefully and
directly prior to the main valuation to ensure that the respondents have the
alternatives clearly in mind.
13. Temporal overaging: Time dependent measurement noise should be reduced by
averaging across independently drawn samples taken at different points in time.
A clear and substantial time trend in the responses would cast doubt on the
‘reliability’ of the value information obtained for a CV survey.
14. ‘No-answer’ option: A ‘no answer’ option should be explicitly allowed in addition
to the ‘yes’ and ‘no’ vote options on the main valuation (referendum) question.
Respondents who choose the ‘no-answer’ option should be asked to explain their
choice.
15. Yes/No follow ups: ‘Yes’ and ‘no’ responses should be followed up by the open-
ended question : ‘Why did you vote yes/no?”
16. Cross-tabulations: The survey should include a variety of other questions that
help interpret the responses to the primary valuation question. The final report
should include summaries of willingness to pay broken down by these categories
(such as income, education, and attitudes toward the environment).
17. Checks on understanding and acceptance: The survey instrument should not be
so complex that it poses tasks that are beyond the ability or interest level of many
participants.

61
2.6.4. CVM Review
Till date, a number of valuation studies have been undertaken but mainly in the United
States of America. There have been a number of studies that have also been carried
out in developing countries and which have proved the validity of contingent valuation
studies as a scientific method.
Desvousges and Smith, 1987, in their study of option price estimates for water quality of
the Monogahela River, confirm that contingent valuation surveys seem capable of
providing order - of - magnitude estimates of the benefits realised from enhancing one
or more aspects of environmental quality. Furthermore these benefit estimates need not
be confined to user-related values. Individuals can understand and incorporate values
derived from uncertain future use into their bids for environmental improvement.
Besides, question format may be important to the estimates of option price.
Nandini Hadker, Sudhir Sharma, Ashish David, T.R. Muraleedharan, 1997, in their study
of the Borivli National Park conducted a survey of the residents of Bombay city to elicit
their willingness-to-pay for the maintenance and preservation of Borivli National Park
(BNP) using the CVM. They have paid special attention to several types of biases
including hypothetical bias, starting point bias, embedding effects and part-whole
biases. In order to mitigate the effect of these they have used special survey and
statistical techniques. For a developing country like India their results show that in spite
of medium to low income levels, people are willing to pay exclusively for the BNP on an
average Rs 7.5 per month, for the next five years. Extrapolating this to the city of
Bombay, this amounts to Rs 20 million each month for the next five years, or a present
discounted value, in excess of Rs 1 billion.
Sandra Goodman, Shabbar Jaffry and Bill Seabrook, present the results of a study
focussing on non-use values for the British coast. Considering that the British public
uses the coast extensively and for a number of varied reasons, this study attempts to
capture the total economic value of the coastal resources. A study of the relationship
between conservation and non-use values has also been attempted in an exploratory
manner. They also state that at times the public and the scientist’s viewpoint regarding

62
acceptable and ecologically preferable management strategies may considerably differ
though there may be a reasonable degree of congruence between scientific and public
perceptions of conservation value. It is stressed in this paper that rational policy
decisions affecting environmental resources should always include elements of
scientific analysis and public values.
Steven Schultz, Jorge Pinazzo and Miguel Cifuentes, 1998, in their study determining
National Park Entrance Fees in Costa Rica, try to determine foreign and resident
willingness to pay (WTP) for return visits to two different Cost Rica National Parks, in
1995. Results of this study indicate that the mean WTP for entrance fees differed
among the National Parks and were considerably higher than the current fees. This
study proves that even in a developing country scenario a contingent valuation study
can be used to obtain the entrance fee structure of national parks. The authors
recommend further research in the field of cultural-strategic biases in developing
countries regarding this mode of surveys.
Richard T. Carson, 1998, in his paper on valuation of Tropical Rainforests focuses on
theoretical aspects that explore the possibility of using a large scale multi-country
contingent valuation study for making decisions concerning global resources in the
specific context of valuing a large set of tropical rainforests. The paper addresses both
philosophical and practical issues related to the use of CV including the role of passive
use motives such as altruism and the role of information. Mainly the practical difficulties
likely to be encountered in actually implementing a large contingent valuation study in
multiple countries with a common set of tropical rainforests are presented.
Kristin Magnussen and Olvar Bergland, 1997, have tried to value the environmentally
hazardous substances in water. : This paper is part of a project that aimed to gather
information regarding the people’s valuation of reduced problems due to
environmentally hazardous substances in water (EHSW). The survey was conducted in
an area in the southern part of Norway - the Grenlandsfjords area. The change in
pollution level caused by EHSW was explained and illustrated as changes in areas of
the fjord with restrictions on consumption and sale of fish and shellfish.

63
John Loomis and Armando Gonzales – Caban, 1994, in their paper on estimating value
of reducing fire hazards to old growth forests deal with the results of a mail survey that
was carried out in Oregon regarding the WTP of various households for a fire
prevention and control programme on northern spotted owl critical habitat units in
Oregon. The voter referendum format was used in this study and according to the
authors, the CVM may provide a promising avenue for incorporating society’s
broadening concern about bio-diversity and natural values into public land management
agencies fire management decisions.
John Loomis and Armando Gonzales – Caban, 1998, in another paper which is a study
on the same lines as the previous one try to calculate the WTP function for protecting
acres of spotted owl habitat from fire. Here a CV survey was used to estimate the
economic value to California and New England residents of implementing a fire
management plan to reduce acres of old growth forests that burn in California and
Oregon. According to the authors the acreage of habitat protected can be used as a
function by managers to evaluate the incremental benefits of different fire management
plans that reduce additional acres burned. These benefits can serve as justification for
funding of prescribed fire and fuel reduction programmes to protect critical habitat of the
Northern and California Spotted Owl.
Earl R. Ekstrand and John Loomis, 1998, in their paper on estimating WTP for
protecting the critical habitat for threatened and endangered fish try to incorporate
respondent uncertainty. A comparison of the standard dichotomous choice CV model to
alternative modifications that explicitly incorporate respondent uncertainty is performed
to estimate economic benefits of protecting critical habitat for nine threatened and
endangered fish species living in Colorado, Green and Rio Grande River Basins.
Dominic Moran, 1994, in his study of the Kenyan Protected Areas has attempted to
quantify the benefits associated with the non-consumptive use of Kenyan parks and
reserves. The figures generated by this study show the magnitude of benefits provision
by Kenyan conservation and the proportion of revenue foregone at current pricing rates.

64
The author insists upon instilling a perception of wildlife as a public resource capable of
generating returns to all that who live with it, and not just for private gains.
Charles C. Griffins, et al., 1995, in their paper on connections to new water systems in
Kerala, seek to measure the WTP of families in Kerala for household connections to a
piped water supply system. Two surveys in 1988 and 1991 were carried out to explore
the validity of findings of the first study. In this study major emphasis has been laid on
the existing policies and their relevance to the behaviour modelling system.
G.D. Garrods and K.G. Willis, 1997, have tried to capture the recreational value of
tropical forests in Malaysia. According to them Forest Recreation Areas (FRAs) in
Malaysia are a step towards ensuring sustainable use of the remaining areas of tropical
forest. These are provided free of charge to the public. Here the recreational value of
these forests has been estimated using CVM. From the results it emerges that the
economic benefits of any new FRAs will depend upon value per visit and number of
visitors; which will in turn depend upon the substitute sites. However FRAs are seen as
having a limited role to play in the conservation of forests since they cover only a small
area and their existence is highly dependent upon other economic motives.
Eija Moisseinen, 1989, in the paper on the Siamaa Seal states that attitude causes
behaviour, which is actually responsible for the revealed WTP which is the main
objective of all CV surveys. But these are usually ignored for they are believed to be
outside the scope of economic analysis. This paper studies the effects of the attitudinal
responses on a mail survey to assess the WTP of the local population to help conserve
the Saimaa Seal which is one of the most endangered seals in the world.
Rosamund Naylor and Mark Drew, 1998, in their paper analyse the use and value of
mangroves in Kosrae, Micronesia, where the population is largely dependent on the
swamps for fuelwood and other ecosystem services, such as erosion control, storm
protection, and nutrient flows to shoreline fisheries. The results indicate that the
population places some premium on the existence and indirect ecosystem services of
mangroves, over and above the direct use values. The respondents were found to
favour a tax system designed to manage and preserve the mangrove’s direct and

65
indirect services over a permit system focussed only the allocation of direct use over
time.
Robert Costanza, Stephen C. Farber and Judith Maxwell, 1989, have valued wetland
ecosystems and their study involved WTP as well as energy analysis based
methodologies. Fundamental theoretical and practical problems underlying natural
resource valuation summarise the methods and findings for the study and elaboration
on some major problems that arise in applied natural resource valuation. Stress has
been laid on the discount rate, which is considered to make the most difference in the
final result than any other factor.
Jennifer Pate and John Loomis, 1997, in their paper on wetlands and salmon in
California state that most studies do not include variables like distance and the overall
area over which the WTP should be aggregated. This study seeks to determine if
distance affects `WTP for public goods with large non- use values. The results show
without conclusive evidence that there is an indication that WTP does decline as
distance increases. For certain goods distance does play a role while not for others. The
issue of difficulty of using knowledge in the same model as distance as the level of
correlation between the two should be extremely high has also been highlighted. The
effect of substitutes on respondents’ WTP was also uncovered. The study ultimately
came out with the result that restricting benefits to just the political jurisdiction in which
the site is located largely underestimates the benefits.
2.6.5 CVM in a Developing Country
Ten years ago only a handful of very rudimentary contingent valuation studies had been
conducted in developing countries: at the time the conventional wisdom was that it
simply could not be done. The problems associated with posing hypothetical questions
to low - income, perhaps illiterate respondents were assumed to be so overwhelming
that one should not even try. Today we have come full circle: it is now assumed by
many environmental and resource economists and policy analysts working in
developing countries that CV surveys are straightforward and easy to do (Whittington,
1998).

66
Table 2.3 ECONOMIC VALUATION STUDIES – A BIRD’S EYEVIEW Resource Type
(by the classification)
Resource Kind
Case Site Function valued Value Unit Method
1 River River W.H.Desvousges V.K.Smith and Ann Fisher 1987
Monongahela river
Option price(recreation)
Contingent valuation
2 National Park PA N. Hadker et al 1997
Borivli National park
Recreation Forest,indirect benefits
Rs 20 million/month
WTP,CVM
3 Coastal area Estuary S.Goodman et al British coast
Conservation and Non use
CVM
4 National Park Park S.Shultz et al 1998
Poas & Manual Antonio parks, Costa Rica
Biodicersity &National heritage protection
WTP Entrance fees. CVM
5 Tropical Forest R.T.Carson CVM 6 Drinking Water Surface
Water K.Magnussen & O.Bergland
Grenlandsfjords area Norway
Hazardous substances in drinking water
CVM
7 Forest Forest J.Loomis & A.G.Caban 1994
Pacific North west Forests
Fire prevention & protection of critical habitats
$77 CVM
8 Forest Forest J.Loomis & A.G.Caban 1998
California &New England
Fire prevention & protection of critical habitats
$ 56 WTP
9 River Basin River E.R.Ekstrand & J.Loomis 1998
Colorado, Green And Rio Grande river basins
Protecting critical habitats for endangered fish species
$268 WTP
10 Forest P.A K.Chopra 1998 Keoladeo National Park India
Biodiversity protection
427.04 432
Rs/visit by Indian Rs./visit foreigner
TCM
11 Forest P.A D.Moran 1994 Kenya Recreation&biodiversity
16-157 USD/Ha
CVM
12 Water systems Piped water systems
C.C.Griffin etal. 1998
Kerala, India
drinking water supply
700
Rs/connection
CVM
13 Forest Tropical Forest
G.D.Carrod & K.G.Willis 1997
Malasia Recreation 1.46 RM/Adult
CVM&TCM
14 Lake Lake Eija Moisseinen 1993
Saimaa Lake Finland
Endangered species protection
200-250million
FIM CVM
15 Forest Forest P. M. Fearnside 1996
Rural Amazonia Forest
Biodiversity,water, `carbon
22 1508 21
USD/family/year
16 Wetland Wetland F.W.Bell 1996 South eastern US
Recreational fisheries &asset value
6,471 981
USD.Eflorida USD.W Fld.
WTP

67
Resource Type (by the classification)
Resource Kind
Case Site Function valued Value Unit Method
17 Forest Forest M.Lockwood J.Loomis T.D.Lacy 1993
South eastern Australia
Logging of native forest
11 /household/year
CVM
18 Forest Forest J.Echeverria M.Hanrahan R.Solorzano
Monteverde Cloud forest Costa Rica
Biological resources
2380262 USD/Year
CVM
19 National Park National park
S.Navrud &E.D.Mungatana 1994
Lake Nakuru National Park Kenya
Recreation 7.5-15 million
USD/Year
CVM
20 Wetland River wetland
Thibodeu & Ostro 1981.
Charles River wetlands
Recreation 187.74 PV-3,130
USD/Year
WTP
21 Wetland Swamp Ghosh & Santra 1995
Wetlands of West Bengal ,India
CommercialAquatic Herbs
600- 1,200
USD/Year
Market value
22 Wetland Mangrove swamp
Naylor & Drew 1998
Kosrae, Micronesia
Mangrove protection and use
a. 0.66-1 b.1 -1.26 (million)
USD/Year
a.MarketValue b. WTP
23 Wetland Coastal wetland
Costanza et al. 1989
Coastal Lousiana
Recreation ,fishing, fur trapping
2429 -6400
USD/Acre Disc.rate-8%
WTP, Energy Analysis
24 Wetalnd Coastal wetland
Bergstrom et al. 1990
Coastal Lousiana, US
Recreational 118 27
USD/year
Aggri.Expenditure Consu. surpluse
What Makes a Good CVM Study
1. Only apply CVM to goods with which respondents have at least some familiarity
(direct or indirect).
2. Estimates of use value are likely to be more accurate than those for non-use
value.
3. The scenario should be understandable and not have a high degree of
uncertainty.
4. WTA scenarios should be avoided.
5. The payment vehicle should be realistic and appropriate.
6. The survey should question intentions to behave rather than attitude towards
behavior.

68
7. The scenario should make provision of the good dependent upon behaviour
rather than automatic.
8. Adequate, rather than excessive, unbiased information should be provided with
the impact of that information assessed via a control group who receive no
information.
9. Specific questions should be included to minimise part-whole (mental account)
problems.
10. Use both open - ended and dichotomous - choice formats to provide lower and
upper valuation boundary estimates.
11. Sample size must be statistically significant.
12. Avoid starting points, bidding games and payment cards.
13. Avoid any direct or implied value cues either via information, questionnaire or
interviewer.
14. Choose carefully between face to face to remote (mail, etc.) approaches and
ensure you are sampling the correct population.
15. CVM will work best where respondents have some experience of valuing the
good in question.
16. In dichotomous choice formats the upper bid level should be such that almost
100% rejection is achieved while the lower bid level should achieve almost 100%
acceptance.
17. Analysts should consider carefully the removal of outliers and use of trimmed
means.
18. Telling respondents that payments by others will be compulsory may reduce non-
response but may increase free-riding and strategic bidding.

69
19. Great care is required in aggregation process.
20. Theoretical validity tests (bid function estimation) should be carried out.
21. Where possible assess reliability via retesting at a later date.
22. Fully report all results including all sample statistics, details of information given
and the full questionnaire reprinted.
There are some contingent valuation researchers that believe that it is easier to
administer high-quality contingent valuation surveys in many developing countries than
it is in industrialised countries. Response rates are typically very high in developing
countries, and respondents are often quite receptive to listening and considering the
questions posed. Moreover, interviewers are inexpensive relative to prices in
industrialised countries. For a given sample size, the survey costs of an in-person CV
survey in developing countries are thus typically an order of magnitude lower than in
industrialised countries. This allows CV researchers to use larger sample sizes and
conduct more elaborate experimental designs.
2.7 Conclusion
The importance of the valuation context has two obvious implications for CVM. First, the
hypothetical nature of CVM may be more of a problem than is generally recognized. As
mentioned earlier, where people’s values and attitudes are not at a high level of
resolution, their responses tend to be more heavily influenced by contextual cues. CVM
is used because such goods are not privately purchased. Although the appropriate
context is the market, the goods involved are not traded. Because people are not
familiar with paying for goods they cannot privately own, they are likely to be particularly
susceptible to unintended contextual cues, such as the social acceptability of paying a
lot (to create a favourable impression), labels, order effects, and implied constituencies.
Moreover, since real life experiences of paying for public rarely exist (not even taxes are
paid for specific environmental goods, and taxes are involuntary in any case), people do

70
not have a well-established context to which to relate, and may therefore be heavily
influenced by the artificial context of the evaluation process,
A related problem for CVM flows from the difficulty of accurately specifying the good,
Because the type of goods typically evaluated using CVM are not specially valued in
monetary terms in real life situations, it is apparently difficult for people to consider
these goods in a payment context. As a result, the specific good at times is mistaken for
a whole class of goods. An example of this is mentioned by Kahneman (1986) in
people’s willingness to pay to maintain fishing by cleaning up lakes in Canada.
Willingness to pay to clean up the lakes in one region was nearly as large as willingness
to pay to clean up the lakes in a whole province containing numerous such regions. It
was thus clear that the respondents were apparently providing evidence of their general
attitudes about cleaning up lakes for fish,
The other implication for CVM deals with the context of payment. Specifying a payment
vehicle may significantly affect bids. For example, people may object to paying outright
for something that they value highly, but they consider to be rightfully theirs. They may
think that the government should pay for it which suggests that their willingness to pay
in taxes would be higher than their willingness to pay outright. (However, they may have
biases against taxes). They may also think that industry (for example, in the case of
industrial air pollution) should pay, rather than themselves. Furthermore, for nonrival
goods in particular, the perceived fairness of the payment vehicle may affect people’s
willingness to pay. Thus the “payment vehicle ” also becomes very important in
devising a proper contingent valuation study (Brown and Slovic, 1988).

71
BIBLIOGRAPHY
A Case study of Wetlands from Pearce, D.W. and R. Kerry Turner, “Economics of
Natural Resources and the Environment”, pp. 320 - 341.
Agarker,M.S., Goswami, H.K., Koushik, S., Mishra, .M., Bajpai, A.K.& Sharma, U. S.
(1994) Biology, conservation and management of Bhoj wetland. Upper lake
ecosystem in Bhopal. Bionature 14(2): 1- 119
Alden D., “Recreational User Management of Parks: an Ecological Economic
Framework”, Ecological Economics, 23 (1997), pp. 225 – 236.
Aldred, J., “Existence Value, moral commitments and in-kind valuation” from Smith, V.
Kerry and Edward Elgar, (1996), Estimating Economic Values for Nature -
Methods for non-market valuation. pp. 155 –169.
Alfred, J.R.B., A.K. Ghosh and N.V. Subba Rao, "Bio-diversity : Fauna in Floodplain
Wetlands".
Ambasht, R.S. and N.K. Srivastava, “Restoration Strategies for the Degrading Rihand
River Ecosystems in India”, from Mitsh, W.J., (editor), Global Wetlands: Old
World and New, Elseiver Science B.V., 1994.
An explanation of Contingent Valuation Methodology. - 'Internet'
Ariel,D.,Peter,S.,Harvey,O.,Vanja,J.,Alfred,D.,Robert,J.,(1995) Restoring and Protecting
the world’s Lakes and Reservoirs. World Bank Technical Paper No. 289.
Arrow, K., Solow, R., Portney, P., Leimer, E., Radner,R. and Schuman,H., 1993, Report
to the national Oceanic and Admisnistration Panel on Contingent Valuation,
Washington, D.C., NOAA

72
Baldock, D. (1984) Wetland drainage in Europe. IIED/IEEP, London
Banerjee, L.K., "Wetland Plant Resources in India", Botanical Survey of India.
Barbier, E.B. and Michael Rauscher,(1994). "Trade, tropical deforestation and policy
interventions," Environmental and Resource Economics 4, pp.75 - 90.
Barbier, Edward B., Mike Acreman and Duncan Knowler. 1997. Economic Valuation of
Wetlands - A Guide for Policy Makers and Planners, Ramsar Convention Bureau,
Gland Switzerland.
Barret, S. (1994). "The Biodiversity supergame", Environmental and Resource
Economics 4, pp. 111-122.
Bateman, Ian. “Contingent Valuation Methods and their role in Natural Resource
Management”, Manuscript, University of East Anglia.
Bell, F.W., “The economic valuation of saltwater marsh supporting marine recreational
fishing in the South Eastern United States”, Ecological Economics 21 (1997), pp.
243 – 254.
Belsare, D.K., “Inventory and Status of Vanishing Wetland Wildlife of South Asia and a
Operational Management Plan for their Conservation”, from Mitsh, W.J., (editor),
Global Wetlands: Old World and New, Elseiver Science B.V., 1994.
Bergstrom, John C., John r. Stoll, John P. Titre and Vernon L. Wright,(1990). “Economic
Value of wetlands-based recreation”, Ecological Economics,2, pp. 129 – 147.

73
Bhatnagar, G.P., M.J. Nandan and S.D. Nawange, “Studies on Bhoj Wetland with
special reference to macrophytes and water supply of Bhopal”, from Kotwal, P.C.
and S. Banerjee, "Biodiversity Conservation", pp 143-150
Bhattacahrya, S. “East Calcutta Wetlands: A relict riparian system thriving waste
recycling practices”.
Bodini, Antonio and Giovanni Giavelli, "Multi criteria Analysis as a tool to investigate
Compatibility between Conservation and Development on Salina Island, Aeolian
Archipelago, Italy, Environmental Management, Vol. 16. No. 5, pp. 633 - 652.
Booth, Douglas E., “Ethics and the limits of environmental economics”, “Ecological
Economics 9, (1994), pp. 241 – 252.
Brookshire, David S., and Alan Randall. 1978. “Public Policy Alternatives, public Goods,
and Contingent Valuation Mechanisms”, Paper presented at the Western
Economic Association Meeting, Honolulu, Hawaii.
Brookshire, David S., and Larry S. Eubanks. 1978. “Contingent Valuation and Revealing
Actual Demand for Public Environmental Commodities”, Manuscript, University of
Wyoming.
Brookshire, David S., Larry S. Eubanks and Alan Randall, “ Estimating Option Prices
and Existence Values for Wildlife Resources”, Land economics, Vol. 59, No. 1,
February 1983.
Brown, Katrina, (1994), “Approaches to valuing plant medicines: the economics of
culture or the culture of economics”, Biodiversity and Conservation 3, pp. 734 –
750.

74
Brown, Thomas C, 1984, The Concept of Value in Resource Allocation, Land
Economics, 60, pp. 231 – 246.
Brown, Thomas C and Paul Slovic, "Effects of Context on Economic Measures of
Value", from G. Peterson, B. Driver and R. Gregory (Eds.), Amenity Resource
Valuation: Integrating economics with other disciplines, 1988.
Brown, Thomas C. and Robin Gregory, “Why the WTA – WTP Disparity Matters”,
Ecological Economics 28, (1999), pp. 323 – 335.
Burger, J., and Michael Gochfield(1988). "Effects of ecotourists on bird behaviour at
Loxahatchee Natural Wildlife Refuge, Florida", Environmental Conservation 25
(1), pp. 13-21.
Cangleosi, A. “Economic Valuation of Environmental Benefits.” - 'Internet'.
Carson, Richard T. 1998. “Valuation of Rainforests: Philosophical and Practical Issues
In The Use of Contingent Valuation”, Ecological Economics, 24, pp. 15 - 29.
Chatfield, C. and A.J. Collins, “Introduction to Multivariate Analysis”, Chapman and
Hall, London.
Common, M.S. and T.W. Norton. “Bio-diversity, Natural Resource Accounting and
Ecological Monitoring”, Environmental and Resource Economics 4, pp. 29 – 53.
Conservation and Management of Lakes/Reservoirs of India. ILEC Report, March,1996
Conservation Value: Estimation and methodological Inference from Jacobson, Kristin
M., Dragun, Andrew K., (1996)“Contingent Valuation and Endangered Species:
Methodological Issues and applications.” Series New Horizons in Environmental
Economics. Pp. 201 – 220.

75
Conservation & Management of Bhoj Wetland, Advertorial published in the Bhopal Plus,
Supplementary provided with the Times of India, in Bhopal, Week of 31st May,
1999.
Cooke, Dennis G., Eugene B. Welch, Spencer A., Peterson, and Peter R Newroth.
(1993) Restoration and management of Lakes and Reservoirs(2nd Ed). Boca
Raton, Florida, Lewis Publishers
“Cost Benefit rules, national income accounts and sustainable development”, Valuation
and the Environment, pp. 91 – 112.
Costanza, Robert, Stephen C. Farber and Judith Maxwell. 1989. “Valuation and
Management of Wetland Ecosystems”, Ecological Economics, 1, pp. 335 - 361.
Crowards, Tom M., "Analysis Safe Minimum Standards: Costs and Opportunities",
Ecological Economics 25 (1998), 303 - 314.
D.James, “Flood Control in the Kahawainui Watershed, Island of Oahu, Hawaii”, The
Application of Economic Techniques in Environmental Impact Assessment, pp.
247-274.
D. James (1994) "Economic Valuation Techniques", , The Application of Economic
Techniques in Environmental Impact Assessment, pp. 63 - 95.
Datta, Samar K. And Kingsuk Sinha, 1996, "Sustainable Wetland Management through
Co-operative Route - Lessons from the Mudiali Tutorial System".
Daugherty, W., “The Economic Value of Wetlands and Open Spaces: Is it ignorance or
greed that allows the destruction of these valuable assets?” - 'Internet'
Davies, J., and C.F. Claridge, (Eds.) (1993)."Wetland benefits, the potential for wetlands
to support and Maintain Development. Asian Wetland Bureau Publication No: 87,
IWRB Special Publication No:27, Wetlands for the Americas publication No:11,
pp. 7 -10 and 35 - 45.

76
Davis, Robert K. 1963. “Recreation Planning As An Economic Problem”, Natural
Resources Journal, Vol 3, No. 2, pp. 239 - 249.
Desarda, H.M., “Water Resources Development – A Note on Alternative Perspective”.
Deshmukh, Sanjay, "Information Services for Mangrove Ecosystems and their Use in
Organising Data Bases for Sustainable Utilisation of Marine Natural Resources
with Specific Reference to Exclusive Economic Zone of India".
Desvouges, William H. et al., “Evaluating CV Performance: Separating the Light from
the Heat” from Bjornstad, David J. and James K. Kahn (eds.), The Contingent
Valuation of Environmental Resources: Methodological Issues and Research
Needs, Edward Elgar, Chettenham UK and Brookfield, US, 19996, pp. 117 –
144.
Desvousges. W.H., V. Kerry Smith and Ann Fisher, “Option price estimates for Water
Quality Improvement: A Contingent Valuation study for the Mononghaela River,
from Smith, V. Kerry (1996). “Estimating economic values for nature: Methods for
non-market valuation”, pp. 248 – 267.
Diosi,A. “Optimum Use of Lakes” from Salanki, J. And S.Herodek, (eds). Conservation
and Management of Lakes – Proceedings of the Third International Conference
on the Conservation and Management of Lakes, “Balaton 88”, held in Keszthely,
Hungary, 11-17th September, 1988.
Dixon, J., Paul B. Sherman, Louis Fallon, Richard A. Carpenter, 1994, Economic
Analysis of Environmental Impacts (London, Earthscan)

77
Dugan, P.J., “Wetlands in the 21st Century: the challenge to conservation science”,
Keynote address to the IVth International Wetlands Conference, Columbus, OH,
USA, 14 – 17 September, 1992, from Mitsh, W.J., (editor), Global Wetlands: Old
World and New, Elseiver Science B.V., 1994.
Dugan, Patrick, J., Wetland Conservation: A Review of Current Issues and Required
Action", IUCN, pp. 14-29.
Dupont, Diane P., “The Importance of Question Sequence in Recreation Valuation”.
Internet.
Echeverria, Jaimie, Michael Hanrahan and Raul Solorzano,(1995). “Valuation of non-
priced amenities provided by the biological resources within the Monteverde
Cloud Forest Preserve, Costa Rica, Ecological Economics, 13, pp. 43-52.
Economic Benefits of Wetlands - EPA from: Hickman, C.A., (1977), "Forested Wetland
Trends in the U.S.: An Economic Perspective", Forest Ecology and Management
33 (34), June I. - 'Internet'
Economic Incentives for watershed protection : A report on an ongoing study of Arenal,
Costa Rica, CREED Working Paper Series No: 3.
Economic valuation of Mangrove ecosystem: Potential and Limitations, CREED
Working Paper Series No: 14
Ekstrand, Earl R. and John Loomis. 1998. “Incorporating Respondent Uncertainty When
Estimating Willingness to pay for Protecting Critical Habitat for Threatened and
Endangered Fish”, Water Resources Research, Vol 34, No. 11, pp. 3149-3155,
November.
Ellis, Gregory M. and Anthony C. Fisher, "Valuing the Environment as Input", Journal of
Environmental Management, (1987), 25, 149 - 156.

78
Environmental Accounting and Valuation – Vol I, a Primer for Developing Countries,
Economic and Social Commission for Asia and the Pacific, United Nations, New
York, 1997
Farber, S.(1987) Value of coastal wetlands for protection of property against hurricane
wind damage, Journal of Environmental Economics and Management.14: 143-
151
Fearnside, P.M., “Environmental Services as a strategy for sustainable development in
rural Amazonia”, Ecological Economics 20 (1997), pp. 53 – 70.
Fernando, C.H., (1984). Reservoirs and lakes of Southeast Asia(Oriental region). In :
Taub, F.(Ed.)Ecosystems of the world. 23. Lakes and reservoirs. Elsvier,
Amsterdam.
Ferrara, Ida and Paul C. Missios, "Non-use values and the management of
transboundary renewable resources", Ecological Economics 25, (1998), pp. 281 -
289.
Filion, F.L., “The Economic Valuation of Wetland Benefits” - Internet
Fischhoff, B. and L. Furby. 1988. “Measuring Values: A Conceptual Framework For
Interpreting Transactions with Special Reference to Contingent Valuation of
Visibility”, Journal of Risk and Uncertainty, Vol. 1, pp. 147 - 184.
Fisher A. and R. Raucher, 1983, “Intrinsic Benefits of Improved Water Quality:
Conceptual and Empirical Perspectives”, US Environmental Protection Agency.
Fisher, Anthony C., “The Conceptual Underpinnings of the Contingent valuation
Method”, from Bjornstad, David J. and James K. Kahn (eds.), The Contingent

79
Valuation of Environmental Resources: Methodological Issues and Research
Needs, Edward Elgar, Chettenham UK and Brookfield, US, 19996, pp. 19 – 60,
Frolova Alla, "Ecologoical Reasoning", Ecological Economics, 24 (1998), pp. 169 - 182.
Garrod, G.D. and K.G. Willis, "Valuing biodiversity and nature conservation at a local
level", Biodiversity and conservation 3, pp. 555 -565, (1994).
Garrod, G.D. and K.G. Willis. 1997. “The Recreational Value of Tropical Forests in
Malaysia”, Journal of World Forest Resources Management, Vol. 8, pp. 183 -
201.
Ghosh, A.K., Floodplain Wetlands- Overview.
Ghosh, S.K. and S.C. Santra, Ecological Benefits of wetland vegetation for rural
population in West Bengal, India.
Glooschenko, W.A., C. Tarnocai, S. Zoltai and V. Glooschenko, “ Wetlands of Canada
and Greenland from Whigham, D.F., et al. (eds.), Wetlands of the World I, Kluwer
Academic Publishers, Netherlands, 1993, pp. 415 – 514.
Goodman Sandra, Shabbar Jaffry and Bill Seabrooke, “Assessing Public Preferences
For The Conservation Quality of The British Coast”, Valuation and the
Environment.
Goodstein, E.S., 1995, Economics and The Environment, Prentice Hall, Inc., New
Jersey
Gopal, B. and Krishnamurthy, K.,(1993) Wetlands of South Asia. In: Whingam, D.F.,
Hejny, S., and Dykyjova, D.(Eds) Wetlands of the world. Vol.1. Kluwer
Acad.Publ., Dordrecht.

80
Gopal, B. and Shah, M.(1993) Conservation and management of Rivers in India: A case
study of River Yamuna. Environmental Conservation.
Gopal, B.,(1996) “Overview of lakes and wetlands of India”. Conservation and
Management of Lakes/reservoirs in India, International Lake Environment
Committee Foundation report submitted to the Environment Agency, Government
of Japan
Gopal, B., "Wetlands and bio-diversity: How to kill two birds with one stone? From
Geisen W. (Ed.)(1997), "Wetlands, Biodiversity and Development", Proceedings
of Workshop 2 of the International Conference on Wetlands and Development
held in Kuala Lumpur, Malaysia, 9 - 13th October, (1995), Wetlands International,
Kuala Lumpur, pp. 18 - 27.
Gorman, Raymond F., "Valuation and Reporting" from Sustainability Perspective for
Resources and Business.
Gren, Ing – Marie, et al. “Primary and secondary values of wetland ecosystems”,
Environmental and Resource Economics 4, (1994), pp. 55 – 74.
Griffin, Charles C., John Briscoe, Bhanwar Singh, Radhika Ramasubban and Ramesh
Bhatia. 1995. “Contingent Valuation and Actual Behaviour: Predicting
Connections to New Water Systems in the State of Kerala, India”, The World
Bank Economic Review, Vol 9, No. 3, pp. 373 - 395.
Gupta, T.R., and John H. Foster (1975). "Economic criteria for fresh water wetland
policy in Massachusetts", American Journal of Agricultural Economics, Vol 57,
No 1, Feb 1975.
Hadker, Nandini, Suhir Sharma, Ashish David and T. R. Muraleedharan. 1997.
“Willingness-to-Pay for Borivli National Park: Evidence From a Contingent
Valuation”, Ecological Economics 21, pp. 105 - 122.

81
Hair J.F., R.Anderson., R.L.Tatham., “Multivariable Data Analysis ”Macmillan
Intl.Editions,NY. Pp.235-236
Hammack,J.,and G.M.Brown.(1974) Water fowl and wetlands: Toward Bio economic
Analysis, Johns Hopkins University press, Baltimore.
Hecky, R.E.,E.J.Free, H.J.Kling, and J.W.M.Rudd. (1981)Relationship between primary
production and fish depletion in lake Tanganyaka. Trasaction of the American
Fisheries Society. 110, 64-71
Herfindahl, Orris C. and Allen V. Kneese, " Measuring Social and Economic Change:
Benefits and Costs of Environmental Pollution", from Allen V. Kneese, Natural
Resource Economics: Selected Papers of Allen V. Kneese, Edward Elgar,
Aldershot, U.K. and Brookefield, US, 1995.
Hitzhusen Fred, Somskaow Bejranonda, Timothy Lehman, and Robert Macgregor
(1995) Economic and political Analysis of dredging Ohio’s State Park Lakes In:
Ariel Dinar and edna Loehman, (Eds) Water quantity/ quality management and
conflict resolution. West port, Conn. Praeger.
Hoevenagel, Rudolf. 1994. The Contingent Valuation Method: Scope and Validity, Vrije
Universiteit, Amsterdam.
Hollis, G.E., "The Functions of Floodplain Wetlands within Integrated River
Management:
International Perspectives", Workshop on the Conservation and sustainable use of
Floodplain Wetlands, 4th - 6th Dec.'93, The Oberoi Grand, Calcutta.

82
Indira Gandhi Institute of Development Research, 1999, Environmental Governance
Series No.2, Sustainable Wetlands
IIED, Gatekeeper Series – Edward B. Barbier.
IPT - Asian Wetland Bureau (1993) Tasek Bera - The wetland Benefits of the Lake
system and recommendations for Management, Asian Wetland Bureau
Publication 90 pp. 9 - 19.
Jacobson, Kristin M., Dragun, Andrew K., (1996) “The Contingent Valuation Method”
from Contingent Valuation and Endangered Species: Methodological Issues and
applications.” Series New Horizons in Environmental Economics, pp. 77 - 96.
Jha, B.C., "Floodplain Fishery of Gandak Basin, Bihar".
Jhingran, V.(1992)Fish and Fisheries of India. 3rd Edition., Hindustan Publ. Corp.,
N.Delhi
Joubert, A.R., et al., “Fynbos (Fine Bush) vegetation and the supply of water: a cost –
benefit analysis”, Ecological Economics 22 (1997), pp. 123 – 140.
Kahneman, D., 1986, Comments by Professor Daniel Kahneman in R.G. Curnnings,
D.S. Brookshire and W.D. Schultze (eds.) Valuing Environmental Goods: An
assessment of the Contingent Valuation Method, pp.185 – 194, Totowa, N.J.,
Rowman and Allanheld.
Kaul,S., and C.L.Trisal., (1996), “Management of Lakes in India” Conservation and
Management of Lakes/reservoirs in India, International Lake Environment
Committee Foundation report submitted to the Environment Agency, Government
of Japan

83
Kaul, V.(1977) Limnological Survey of Kashmir Lakes with reference to trophic status
and conservation. International Journal of Ecology and Environmental Science.
3:29-44
Kelly, M.G., (1988), "Use of community based indices to monitor eutrophication in
European rivers", Environmental Conservation 25 (1), pp. 22 -29.
Kent,D.J., Kenneth D. Jenkins and James F. Hobson, “Wetlands Functions and Values”,
from Kant, Donald M.,(Ed), Applied wetlands Science and Technology,
Khan, A.A., Anita Bhatnagar and Rashmi Saxena, “An Introduction to Bhopal Lakes”,
from Kulshreshta, S.K., Upkar N. Adholia, O.P. Jain, Amita Bhatnagar, (Eds)
“Past, Present and Future of Bhopal Lakes – Proceedings of the national
symposium, July, 6-8, 1987, Motilal Vigyan Adarsh Mahavidalaya, Bhopal, pp 7-
10.
King K., "Incremental costs of Conserving Wetland Bio - Diversity" from Geisen W.
(Ed.)(1997), "Wetlands, Biodiversity and Development", Proceedings of
Workshop 2 of the International Conference on Wetlands and Development held
in Kuala Lumpur, Malaysia, 9 - 13th October, (1995), Wetlands International,
Kuala Lumpur, pp. 44 - 55.
Kline, Jeffrey and Dennis Wichelns, "Measuring Heterogeneous preferences for
preserving farmland and open space", Ecological Economics 26(1998), 211 -
224.
Kneese, Allen V., "Environmental Policy", from Allen V. Kneese, Natural Resource
Economics: Selected Papers of Allen V. Kneese, Edward Elgar, Aldershot, U.K.
and Brookefield, US, 1995.
84
Kulshrestha Praveen, “New dimensions of Tourism and Lake Management in Upper
Lake, Bhopal”, from Kulshreshta, S.K., Upkar N. Adholia, O.P. Jain, Amita
Bhatnagar, (Eds) “ Past, Present and Future of Bhopal Lakes – Proceedings of
the national symposium, July, 6-8, 1987, Motilal Vigyan Adarsh Mahavidalaya,
Bhopal, pp 41-44.
Kulshrestha, S.K., “Preliminary Studies on the Impact of Certain Religious Activities on
Water Quality of Upper Lake, Bhopal”, from Kulshreshta, S.K., Upkar N. Adholia,
O.P. Jain, Amita Bhatnagar, (Eds) “ Past, Present and Future of Bhopal Lakes –
Proceedings of the national symposium, July, 6-8, 1987, Motilal Vigyan Adarsh
Mahavidalaya, Bhopal, pp 253-257.
Kulshrestha, S.K., “Review of Studies on Bhopal Lakes”, from Kulshreshta, S.K., Upkar
N. Adholia, O.P. Jain, Amita Bhatnagar, (Eds) “Past, Present and Future of
Bhopal Lakes – Proceedings of the national symposium, July, 6-8, 1987, Motilal
Vigyan Adarsh Mahavidalaya, Bhopal, pp 11 – 22.
Lockwood M., “Integrated Value Theory for natural areas”, Ecological Economics 20
(1997), pp. 83 – 93.
Lockwood, Michael, John Loomis, Terry de Lacy,(1994). “The relative unimportance of a
nonmarket willingness to pay for timber harvesting”, Ecological economics, pp.
145 – 152.
Loffler, H.(1969) High altitude lakes in Mt. Everest region.
Verh.int.Verein.Limnol.17:373-385
Loomis John and Armando Gonzales - Caban. 1994. Estimating the Value of Reducing
Fire Hazards to Old Growth Forests in the Pacific Northwest: A Contingent
Valuation Approach, International Journal of Wildland Fire, Vol. 4, No. 4, pp. 209
- 216.

85
Loomis John and Armando Gonzales - Caban. 1998. “A Willingness-to-pay Function for
Protecting Areas of Spotted Owl Habitat from Fire”, Ecological Economics, 25,
pp. 315 - 322.
Luks, Fred, "METHODS The rhetorics of Ecological Economics", Ecological Economics
26, (1998), pp. 139-149.
Lynn,G.D.,P.O.Conroy.,and F.J. Prochaska.,(1981) Economic valuation of marsh areas
for marine production process (Florida) Journal of Environmental Economics and
Management.8: 175-186.
Magnussen Kristin and Olvar Bergland. 1997. “Valuation of Environmentally Hazardous
Substances in Water”, Paper prepared for the EAERE Conference in Tilburg, The
Netherlands, June.
Mahajan, K.K. "Wetlands of India - a survey report and suggestions for their optimum
utilisation.
Maitre, David le, et al., (1997) “Communicating the value of fynbos: results of a survey
of stakeholders”, Ecological Economics 22, pp. 105 – 121.
Mandal, R.B., "The Value of Wetlands in North - East India" from Wetlands, pp. 30-46.
Mantymaa, E., “Willingness to pay and willingness to accept: A Contingent Valuation
Method field study of Environmental Commodities”, Valuation and the
Environment, pp. 147 – 163.
Mendelssohn, G., “The relevance of economic valuation for Species Conservation
Policy:The Case of the African Elephant”,. pp. 123 – 145.

86
Micklin, Philip P., 1992 “The Aral Sea Crisis: Indroduction to the Special Issue.” Post
Soviet Geography 33(5): 269-70.
Mitch, W.J., and J.G. Gosselink,. Wetlands. 2nd edition. Van Nostrand, New York. 539p
Mitsch, J. and James G. Gosselink (1986) "Values and Valuation of Wetlands", from,
Wetlands, , pp. 393 - 414.
Mitchell, Robert Cameron and Richard T. Carson. 1989. Using Surveys to Value Public
goods: The Contingent Valuation Method, Resources for the Future.
Munashinghe, M. and Jeffrey McNeely, 1994, Protected Area Economics and Policy:
Linking Conservation and Sustainable Development, World Bank, Washington
D.C.
Moisseinen, Eija, "On Behavioural Intentions in the Case of the Siamaa Seal.
Comparing the Contingent Valuation Approach and Attitude - Behaviour
Research".
Moran Dominic. 1994. “Contingent Valuation and Bio-diversity: Measuring the User
Surplus of Kenyan Protected Areas”, Biodiversity and Conservation, 3, pp. 663 -
684.
Msangi, J.P. and G.A. Ellenbroek,"Should there be man-made lakes in Africa?" from
Whingman, D.F. et al. (eds.), Wetland Ecology and Management: Case Studies,
1990, pp. 103-108.
Naik, B.N., "Ecology and Management of Indian Fresh Water Ecosystems at Industrial
Areas", from Kulshreshta, S.K., Upkar N. Adholia, O.P. Jain, Amita Bhatnagar,
(Eds) “ Past, Present and Future of Bhopal Lakes – Proceedings of the national
symposium, July, 6-8, 1987, Motilal Vigyan Adarsh Mahavidalaya, Bhopal, pp 77
- 81.

87
Navrud, Stale and E.D. Mungatana, (1994). “Environmental valuation in developing
countries: The recreational value of wildlife viewing”, Ecological Economics 11,
pp. 135 – 151.
Naylor, Rosamund and Mark Drew. 1998. Valuing Mangrove Resources in Kosrae,
Micronesia Environmental and Developmental Economics, Vol 3., pp. 471 - 490.
Odum,E.P.,(1989) Ecology and our Endangered Life-support Systems, Sinauer,
Stamford, C.T.
Odum.H.T.,(1984) Summary: Cypress swamps and their regional role ,in Cypress
Swamps, University press Florida. Gaines ville pp.416- 443
OECD, 1989, Organisation for Economic Co-operation and Development,
Environmental Policy Benefits, Monetary Valuation, Paris, OECD
“On behaviouaral intentions in the case of the Saimaa Seal. Comparing the
Contingent Valuation approach and Attitude – Behaviour
Research, pp. 183 – 204.
Othman, J. “The economics of wetland Conservation: Conceptual basis of valuation
techniques”, pp. 112 – 118.
Pate, Jennifer and John Loomis. 1997.The Effect of Distance on Willingness to Pay
Values: A Case Study of Wetlands and Salmon in California, Ecological
Economics, Vol 20, pp. 199 - 207.
Pearce, David, "Economic Values and the Natural Environment", Discussion Paper No.
87-08.
Pearce, D.W. and R.K. Turner, 1990, Economics of Natural resource and Environment,
Harvester Wheatsheaf, Hartfordshire.

88
Peng, Wanglu, "Synthetic Analysis for Extracting Information on Soil Salinity using
Remote Sensing and GIS: A case study of Yanggao Basin in China",
Environmental Management, Vol.22, No. 1, pp. 153-159.
Perrings, C., and David Pearce,(1994). "Threshold effects and incentives for the
conservation of bio-diversity," Environmental and Resource Economics 4, pp. 13-
28.
Pezzey John, "Sustainability: An Interdisciplinary Guide"
Phukan, S.N., " Flood plains of the Assam Valley – its utilization.
Prato, Tony, 1998, Natural Resource and Environmental Economics, Iowa State
University Press.
Precoda, Norman. (1991) Requiem for the Aral Sea. Ambio 20 (3-4): 109-14
Ram, R.N., Rama Rao. K.v. and Ghosh, A. (1994) Chilka lake. WWF-India, N.Delhi.
Randall, A and J.R. Stoll, “Existence Value in a Total Valuation Framework”, in R. Rowe
and L. Shestnut (eds) 1983, Managing Air Quality and Scenic Resources at
National Parks and Wilderness areas, Westview Press, Boulder, Colorado
Rao, K.L.(1975) India’s water wealth: Its assessment, uses and projections. Orient
Longman, N.Delhi. 225pp
Rathore, P.S., “Upper Lake and Bhopal Water Supply”, from Kulshreshta, S.K., Upkar
N. Adholia, O.P. Jain, Amita Bhatnagar, (Eds) “ Past, Present and Future of
Bhopal Lakes – Proceedings of the national symposium, July, 6-8, 1987, Motilal
Vigyan Adarsh Mahavidalaya, Bhopal, pp 1-6.

89
Report of the Expert Committee on Bio – Diversity, Mitsch, William, J. And James G.
Gosselink, “Values and Valuation of Wetlands”pp. 393-414.
Rezeler, J., 1993, Economic Costs of Environmental Degradation in Bombay
Metropolitan Region, presented at the Workshop on Economic Valuation of
Environmental Degradation, Mumbai. Organised by IGIDR, Mumbai
Robin Attfield. “Existence value and intrinsic value”, Ecological Economics
,24(1998)163-168.
Rogers, P.W., D.R.Klomars and P.L.Freedman.(1988). In N.W.Schmidtke,(ed.) Toxic
contamination of large lakes, Vol. III. Chelsea, Michigan: Lewis Publ.
Roggeri H., "Functions and Values of Wetlands", Tropical Fresh Water Wetlands - A
Guide to Current Knowledge and Sustainable Management, pp. 27-50.
Roggeri H., Tropical Fresh Water Wetlands - A Guide to Current Knowledge and
Sustainable Management - Appendix D.1. - Example of Wetlands Classification
pp. – 227 - 228.
Roggeri H., Tropical Fresh Water Wetlands - A Guide to Current Knowledge and
Sustainable Management - Appendix D.5 - Potential Wetland Benefits: Existence
Indicators.
Roggeri H., Tropical Fresh Water Wetlands - A Guide to Current Knowledge and
Sustainable Management - Appendix D.6 - Assessment of Benefits: Examples.
Rokeach, M., 1973, The Nature of Human Values, New York, Free Trust

90
Ruijgrok, E., P.Vellinga and H.Goosen, "Analysis, Dealing with Nature", Ecological
Economics, 28 (1999), pp. 347 - 362.
Said, I.M., Mohd. Shahwahid, O and Nather Khan (1992)." The Socio - economic Value
of Wetland Plant Species and recommendations to important Wetland
Conservation in peninsular Malaysia. Asian Wetland Bureau Publication No: 80.
pp. 17 - 38.
Sankaramurthy, S, “Capacity Building and Empowerment of Stakleholders for
Sustainable Management of Mangrove Wetlands in India”.
Schluze, William et al., “Sources of Bias in Contingent Valuation”, from Bjornstad, David
J. and James K. Kahn (eds.), The Contingent Valuation of Environmental
Resources: Methodological Issues and Research Needs, Edward Elgar,
Chettenham UK and Brookfield, US, 19996, pp. – 97 – 116.
Schulze, William D., and Ralph C. d’Arge. 1978.On the Valuation of Recreational
Damages, Paper presented to the Association of Environmental and Resource
Economists, New York, December.
Schuman, Howard, “The Sensitivity of CV Outcomes to CV Survey Methods”, from
Bjornstad, David J. and James K. Kahn (eds.), The Contingent Valuation of
Environmental Resources: Methodological Issues and Research Needs, Edward
Elgar, Chettenham UK and Brookfield, US, 19996, pp. 75 – 96.
Sharma, A.M., "Kabar Bird Sanctuary (at a glance)"
Shultz, Steven, Jorge Pinnazo and Miguel Cifuentes. 1998. “Opportunities and
Limitations of Contingent Valuation Surveys to Determine National Park Entrance
Fees: Evidence from Costa Rica”, Environment and Development Economics 3,
pp. 131- 149.

91
Singh, M., "Sustainable Eco-tourism in Gir".
Sinha, B., "Problems and Perspectives of wetlands in Northern Bihar.
Skonhoft, Anders Resource Utilisation, property rights and welfare- Wildlife and the
local people, Ecological Economics 26 (1998), pp. 67 - 80.
Smith, V. Kerry, William H. Desvousges and Ann Fisher, "A Comparison of Direct and
Indirect Methods for estimating Environmental Benefits", American Journal of
Agricultural Economics, Vol. 68, No. 2, May 1986.
Smith, V.Kerry, “Averting Behaviour: Does it exist?” Economic Letters 20 (1986), pp.
291 – 296.
Smith, V.Kerry, Jin Long Liu and Raymond B. Palmquist "Marine pollution and sport
fishing quality - Using Poisson models as household production functions",
Economic Letters 42 (1993), pp. 11 - 116.
Smith, V.Kerry," House hold production functions and environmental benefit estimation"
. (eds.) J.B.Braden & C.D. Kolstad, "Measuring the Demand for environmental
quality " Elsevier Science Publishers,1991. Pp 388-425
Smith, V.Kerry, (1996). “Indirect Revelation of the demand for public goods: An
overview and critique”, from “Estimating economic values for nature: Methods for
non-market valuation”, pp. 381 – 425.
Somdutt, Shailendra and Vandana Khare, “ Fishes in Management of Bhopal Lakes”,
from Kulshreshta, S.K., Upkar N. Adholia, O.P. Jain, Amita Bhatnagar, (Eds) “
Past, Present and Future of Bhopal Lakes – Proceedings of the national
symposium, July, 6-8, 1987, Motilal Vigyan Adarsh Mahavidalaya, Bhopal, pp 33-
35.

92
Spash Clive, “ Environmental Management without environmental valuation”, from
Smith, V. Kerry and Edward Elgar, (1996), Estimating Economic Values for
Nature - Methods for non-market valuation pp. 170 –185.
Srivastav, A., and R.L. Meena, "Stakeholders in Gir", Workshop on Ecodevelopment,
Sasan Gir, 5th November, '96.
Stern, David, I., (1995), “The contribution of the mining sector to sustainability in
developing countries”, Ecological Economics 13, pp. 53 – 63.
Stirling, Andrew, Multi–criteria Mapping –Mitigating the problems of environmental
valuation?, from Smith, V. Kerry and Edward Elgar, (1996), Estimating Economic
Values for Nature - Methods for non-market valuation Pp. 186 – 210.
Streeting, M.C., “A Survey of Hedonic Price Technique”, Research Paper No. 1
(Australia, Resource Assessment Commission). 1990.
“Structuring a research agenda to estimate environmental values.” From Bjornstad,
David J. and James R. Kahn.(Eds), "Contingent Valuation of Environmental
Resources: Methodological issues and research needs."
Tacconi Luca, "Scientific Method for Ecological Economics", Ecological Economics 27,
(1998), pp. 91 - 105.
The economic importance of wild resources in the Hadejia Nguru Wetlands, Nigeria,
CREED Working Paper Series No: 13.
The use of environmental functions to evaluate management strategies for the Pagbilao
Mangrove forest, CREED Working Paper Series No: 15.
Trishal, C.L.,(1997), “Overview of the Wise Use of Wetlands in South Asia”,
Proceedings of the seminar on wise use of wetlands, 21st -22nd April, 1997.

93
Turner, R.Kerry , J.B.Opschoor and D. W. Pearce (eds), “Valuation of wetland
ecosystems”, Persistant Pollutants”, pp. 55 – 63.
Turner, Kerry, “Ecological – Economic Analysis of Wetlands: Science and Social
Science Integration”. - 'Internet'
UNEP- Wetland International-Asia Pacific, “Wetlands and Integrated River Basin
Management.”
USEPA(United States Environmental Protection Agency)(1988) The Lake and Reservoir
Restoration Guidance Manual., EPA440/ 5-88-002, Washington, DC.
Government Printing Office.
Valuation and Evaluation of Management Alternatives for the Pagbilao Mangrove
Forests, CREED Working Paper Series No: 9
Valuing Public goods : Practical Methodologies from Smith, V. Kerry (1996). “Estimating
economic values for nature: Methods for non-market valuation”, pp. 46 – 65.
“Value of Environmentally sensitive land.” - 'Internet'
Valuing Wetlands - 'Internet'
Varshneya, C.K., "Wetlands of India: Economic and scientific importance", Wetland and
waterfowl conservation in Asia, Asian Wetland Bureau, IWRB, Kuala Lumpur,
1989.
W. Van Vuuren and P.Roy, " Private and Social returns from wetland preservation
versus those from wetland conversion to agriculture", Ecological Economics 8
(1993), pp. 298 - 305.
Walkey, M., "Socio - economic reflections on the field visits and workshop on wetlands
bio-diversity" Indo - British Workshop on Bio-diversity, from Frame B., Joe Victor
and
94
Yatavendra Joshi, "Bio-diversity Conservation- Forests, Wetlands and Deserts - TERI
and British High Commission", Feb. 1993.
Wetlands and Integrated River Basin management - Experiences in Asia and the
Pacific.
Wetlands provide Tremendous Economic Benefits for People. - 'Internet'
Whittington, Dale. 1998. “Administering Contingent Valuation Surveys in Developing
Countries”, World Development, Vol. 26, No. 1, pp. 21-30.
Williams, Clive Howard and Keith Thompson, "The Conservation and Management of
African Wetlands", from Denny Patrick(ed.), The Ecology and Management of
African Wetland Vegetation, 1985, pp. 203 - 230.
World Bank (1993)World Development Report 1992. Washington, D.C
World Bank.1994., “Aral Sea Program-Phase 1” Briefing paper for the proposed donors
meeting on June 23-24, Paris ,1994 .Aral Sea Program Unit , World Bank,
Washington, D.C
WRI (World Resources Institute) (1994) World Resources 1992-93. Washington, D.C
Xu Zhi et al. "measuring Forest ecosystem Sustainability: A Resource Accounting
Approach.", Environmental Management, Vol 19, No. 5, pp. 685 - 692.
Yadava, Y.S., "Central and Sustainable use of Floodplain Wetlands - A Case Study of
Dheer Beel, Assam, India.
Zutshi, D.P & Khan, M.A. (1978)On lake typology of Kashmir. Enviro. Physiol. Ecol.
Plants: 465- 472

95
Zutshi, D.P.(1985) The Himalayan lake ecosystems. In: Singh,J.S.(Ed) Environmental
regeneration in Himalaya: Concepts and Strategies: 325-338. The Central
Himalayan Environment Association, and Gyanodaya Prakasan, Nainital
Zutshi, D.P., Subla. B.A., Khan M.A. and Wanganeo, A.(1980) Comparative Limnology
of nine lakes of Jammu and Kashmir Himalayas, Hydrobiologia 80: 101-112

96
CHAPTER III : INTRODUCTION AND OBJECTIVES OF THE STUDY
3.1 Introduction
Water is likely to be the major bone of contention between various nations in the 21st
Century. Its alarming depletion and increasing consumption at the global, national and
regional levels are soon going to make it one of the most pressing resource issues.
Water pollution too adds to the existent problems of local and regional water scarcity by
making large amounts of water unfit for consumption. With increasing agricultural,
industrial and domestic needs, there is also a growing competition for clean water
supplies.
In India, about 200 million people do not have access to safe drinking water. Most of our
water sources are polluted with untreated / partially treated wastes from industry,
domestic sewage and fertiliser / pesticide run-off from agricultural fields. According to
the Ministry of Rural Development, about 1.5 million children die each year due to water
related diseases, and the country also loses over 200 million person days of work a
year because of these diseases. According to the Ministry of Water Resources, water
shortages in India will become even more pervasive by 2025 and stress human and
economic development. Appropriate management of water resources is thus crucial for
future economic development and protection of human health and life itself (IGIDR,
1999).
The Bhoj Wetland is an important drinking water resource for the citizens of the city of
Bhopal. Over the years, because of indiscriminate and unsustainable use, the quality of
water in this Wetland has been degraded largely. Moreover with the increasing
population of the city and its high growth rate, demand for water for domestic need has
also increased manifold. Soon Bhopal City would be in the grip of a major drinking water
crisis. Keeping this in view, the objectives of this project gain importance:
1. To value fully the wetland benefits / resources for appropriate allocation of
wetland use

97
2. Help the planners and policy makers, to develop a socially acceptable,
environmentally sound and economically feasible strategy for wetland
management.
3.2 Study Area
3.2.1 Location
The Study Area though dealing with the Bhoj Wetland, which consists of the Upper and
the Lower Lakes of the City, also concentrates on all the municipal wards falling within
the confines of the City of Bhopal. Bhopal is the State Capital of the largest Indian State
of Madhya Pradesh lying in the central region of the country. It was declared as the
Capital in 1956 and since then it has shown enormous growth not just in area and size
but also in the population. The City occupies an area of some 286 sq. km and is divided
into 66 administrative wards.
Fig.3.1 Map showing the location of Bhoj Wetland
BHOPAL District
Bhoj Wetland
MADHYAPRADESH
INDIA

98
3.2.2 Physiography
The City lies in a hilly terrain that shows a slope towards north and southeast. Hillocks
of different altitudes are situated along the south – west and north – west portion of the
city. These hillocks form a continuous belt from Singarcholi to the Vindhyachal range.
The maximum height in this region is that of the Singarcholi peak which is 625 m above
sea level. The general elevation of the ground level is nearly 460 m along the
southeastern and north-eastern portion of the city
Geology wise, the sub-surface in the City area is not rich in minerals. Bhopal stands on
red sand stone strata of the Malwa Plateau. The top portions of the various hillocks in
the city mainly have hard red soil mixed with boulders. Black cotton soil is however also
to be found ranging in depths of 1 to 2.5 m on the north-eastern and south-eastern side
of the city.
3.2.3 Drainage
The natural drainage of the city is provided by three main streams, which are joined by
a number of small nallahs and rivulets. On the north-eastern side drainage is provided
by the river Halali and on the southeastern side by the Kaliasote river. Both these rivers
drain into the River Betwa. On the southeastern side the drainage is provided by various
small nallahs that drain into the River Kolar, which ultimately joins the River Narmada.
3.2.4 Vegetation
Vegetation around the City is of the mixed forest type. Since the soil is shallow with a
sheet of hard red stone bedrock in most places, the growth is stunted. The common
trees to be found are Tamarindus indica, Ficus sp., Cassia fistula, Moringa olifera,
Cassia seamia, Eucalyptus sp., Peltoforum sp., Mangifera indica, Jambolina indica,
Grevillea robusta, Cassurina equatifolia, Madhuca indica, Pongamia sp., Acacia sp.,
Prosopis juliflora, Schlericha oleosa and many others.
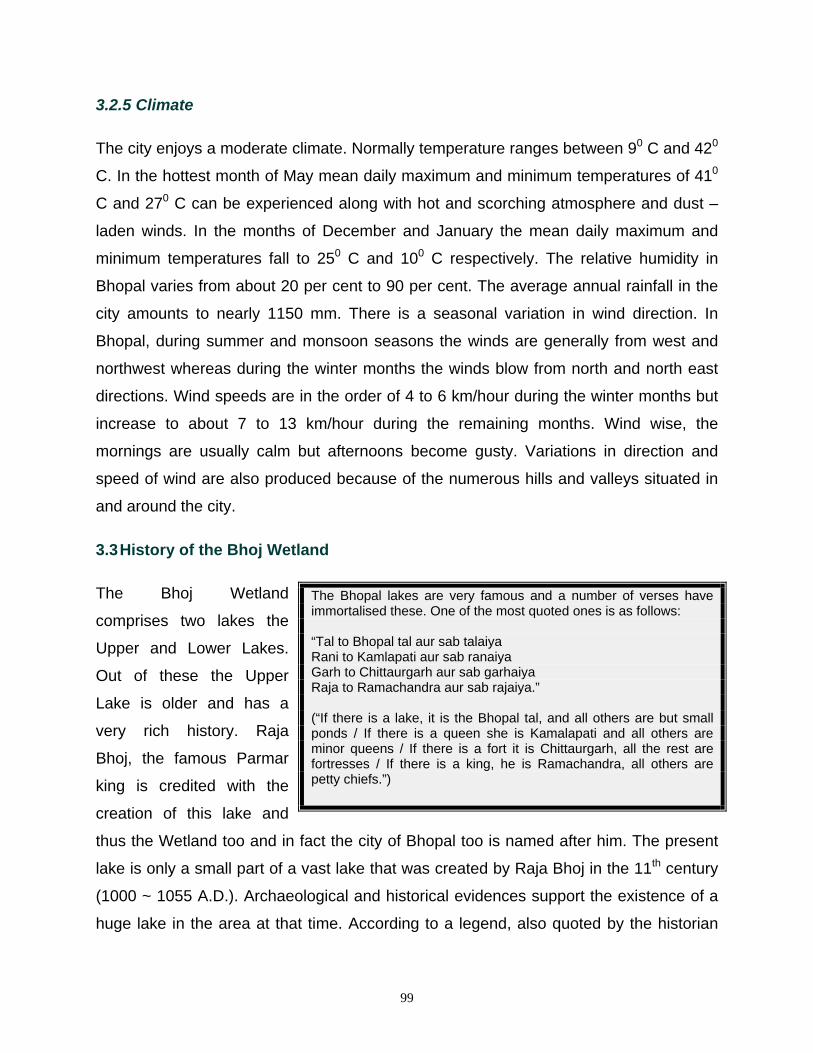
99
The Bhopal lakes are very famous and a number of verses have immortalised these. One of the most quoted ones is as follows: “Tal to Bhopal tal aur sab talaiya Rani to Kamlapati aur sab ranaiya Garh to Chittaurgarh aur sab garhaiya Raja to Ramachandra aur sab rajaiya.” (“If there is a lake, it is the Bhopal tal, and all others are but small ponds / If there is a queen she is Kamalapati and all others are minor queens / If there is a fort it is Chittaurgarh, all the rest are fortresses / If there is a king, he is Ramachandra, all others are petty chiefs.”)
3.2.5 Climate
The city enjoys a moderate climate. Normally temperature ranges between 90 C and 420
C. In the hottest month of May mean daily maximum and minimum temperatures of 410
C and 270 C can be experienced along with hot and scorching atmosphere and dust –
laden winds. In the months of December and January the mean daily maximum and
minimum temperatures fall to 250 C and 100 C respectively. The relative humidity in
Bhopal varies from about 20 per cent to 90 per cent. The average annual rainfall in the
city amounts to nearly 1150 mm. There is a seasonal variation in wind direction. In
Bhopal, during summer and monsoon seasons the winds are generally from west and
northwest whereas during the winter months the winds blow from north and north east
directions. Wind speeds are in the order of 4 to 6 km/hour during the winter months but
increase to about 7 to 13 km/hour during the remaining months. Wind wise, the
mornings are usually calm but afternoons become gusty. Variations in direction and
speed of wind are also produced because of the numerous hills and valleys situated in
and around the city.
3.3 History of the Bhoj Wetland
The Bhoj Wetland
comprises two lakes the
Upper and Lower Lakes.
Out of these the Upper
Lake is older and has a
very rich history. Raja
Bhoj, the famous Parmar
king is credited with the
creation of this lake and
thus the Wetland too and in fact the city of Bhopal too is named after him. The present
lake is only a small part of a vast lake that was created by Raja Bhoj in the 11th century
(1000 ~ 1055 A.D.). Archaeological and historical evidences support the existence of a
huge lake in the area at that time. According to a legend, also quoted by the historian

100
and archaeologist W Kincaid, Raja Bhoj was stricken with a severe skin disease akin to
leprosy, which his court physicians failed to cure. A holy recluse prophesied that the
king would die of the disease, unless he was able to construct a lake that would be the
largest in India, and fed by 365 streams.
Skilled engineers were then sent along the valleys of the Vindhyan range to explore the
region and report upon the feasibility of such a lake being constructed. A valley was
ultimately discovered and subsequently enclosed, which included the headwaters of the
river Betwa. But the engineers found, much to their disappointment, that only 356
springs and streams fed the valley. The difficulty was eventually overcome by Kalia, a
Gond chief, who pointed out a missing river which, with its tributaries, made up the
requisite number and was accordingly named Kaliasot or Kalia’s river, a name that it
carries to this day.
A study of the local topography and the remains of the civil works, in Kincaid’s analysis,
clearly proves that the engineers of those days skilfully turned the waters of another
river, which rises 32 km to the west, into the Betwa valley. This was accomplished by
creating a magnificent, cyclopean dam in Bhopal. From the storage lake thus obtained,
a river flowed at a right angle to its former course; it became a valuable feeder. The
Kaliasot River carried its surplus waters into the larger lake for three full months after
the rainy season had ended. This ancient lake covered an area of 65,000 ha. It must
have at that time formed the largest artificial lake in the Indian peninsula – one
unbroken sheet of water with islands adding to its beauty. It was in places, more than 30
metres deep, and was surrounded by high hills on all sides.
The waste weir cuts through the solid rock of one of the lower hills. It is situated at the
apex of a triangular valley, and is probably 3 km from the great dam in a direct line. Its
position, so far from the dam, according to Kincaid provides further proof of the practical
ability of the engineers of the time. Any error in levels would have quickly destroyed the
dam which, though stone-faced on both sides, was filled in by earth and could not have
withstood heavy overflows for long. The second bund was thrown across the only other

101
opening of the valley, which turned the Kaliasote off its course at right angles into the
Betwa.
This vast expanse of water was later destroyed by Hoshangshah of Malwa (1405 –
1435 A.D.) whose army cut across the lesser dam and thus emptied the lake. The
evidence of destruction of the embankment can still be seen at a place called Mendua,
not very far from the Shiva Temple at Bhojpur. According to the Gond folklore, it is said
that it took the army three months to cut through the dam and the lake took three
months to empty and the thick fertile black sediments left behind were not habitable for
the next thirty years. The dam across the Betwa was also destroyed by the armies of
Hoshang Shah. The embankment at Bhopal is till preserved at Kamla Park and so is the
lake known now as Upper Lake but in a much constricted size (Dying Wisdom, 1997).
After the decline of the Parmar power the town remained ruined for almost 600 years.
The area, however, was under the control of rulers of Malwa and later on under the
Emperor of Delhi. After Akbar’s rule, the area passed to the control of local tribal
chieftains and Gond kings who incessantly fought until Dost Mohammad, one of the
army chiefs of the Mughal army established his firm rule by the first decade of the 18th
century. In 1794, Nawab Chhoten Khan, the Minister of Nawab Hiyat Mohammad built a
300 yards long and 23 yards wide solid masonry dam across Banganga forming the
Lower Lake. (Dying Wisdom,CSE,1997)
Bhopal as a city has been growing rapidly especially in the last few decades. There has
been a lot of migration into the city from the other parts of the country to provide the
work force for the Bharat Heavy Electricals Limited, a large public sector unit situated
here. To provide for the needs of this work force other people moved in to begin several
businesses and all and since then the city has been constantly swelling in size. The
population change in the city in the last hundred years are as given below:

102
Table.3.1 Changes in Population of Bhopal Year Population Change in population % age growth
1901 77023 1911 56204 -22819 -27.04 1921 45094 -11110 -10.77 1931 61037 +15943 +35.35 1941 75228 +14191 +23.25 1951 102333 +27105 +36.04 1961 185374 +83041 +81.17 1971 298022 +112648 +60.77 1981 672329 +374307 +125.60 1991 1063662 +391333 +58.21 2001* 1500000 +436338 +41.02
* As projected Source: Census, 1991
As per the increasing population demands, there have also been significant changes in
the land use patterns of the city.
The city has been growing as represented by the following maps in the years as
specified.
3.4 Status of The Bhoj Wetland
The Ministry of Environment & Forests (MoEF) of the Government of India has declared
the Upper and the Lower Lake to be a Wetland of National Importance in the year 1988.
Bhoj Wetland is one of the sixteen wetlands in the country that have been so far
identified for conservation and management.
3.4.1 Upper Lake
The Upper Lake as mentioned above is the highly diminished remains of the large lake
constructed by Raja Bhoj, in the 11th century. The seasonal river Kolans, originating
from Sehore, some forty eight kilometres from Bhopal, and several small feeder streams
at the western side of the lake, form the source. The lake is dammed at two places: 1)
On its eastern end near Kamla Park where there is a permanent underflow outlet into
Lower Lake, 2) In the southern part at Bhadbhada, where there are eleven sluice gates
to let out the excess water from the lake into a channel, which then carries the excess

103
water into the Kaliasot river. The Upper Lake has a catchment area of 361 km 2 and a
waterspread area of 31 km2.
Fig.3.2 Maps of the Bhopal City (habitation area in blue, partial boundary of lake shown in black in the west of the city) since the formation of the Upper Lake one thousand years back 1010 - 1200 AD 1201-1800 AD 1801-1850 AD 1891-1930 AD
1931-1950 AD
1973-1981 AD 1981-1991 AD
Source: Downloaded from Bhopalinfo.com

104
3.4.2 Lower Lake
The Lower Lake also known as the Chotta Talab or Small Lake, is situated towards the
east end of the Upper Lake and is almost fully surrounded by built-up areas. It has a
small catchment area of 9.60 km2 and a water spread area of 1.29 km2. Lower Lake
receives its inflow in the form of seepage from the Upper Lake in addition to the
drainage coming from 8 nallahs or drains. Water level is maintained constant by regular
outflow through a waste weir at Pul-Pukhta into Patra Nallah.
The salient features of the Upper and the Lower Lake of Bhopal are presented in Table
3.2
Table 3.2: Salient features of the Upper and Lower Lakes of Bhopal Sl. No.
Item Upper Lake Lower Lake
1 Constructed in 11th century Late 18th century
2. Type of Dam Earthen dam Earthen dam
3. Location: Longitude Latitude
77018’ ~ 77024’ 23013’~ 23016’
77024’ ~ 77026’ 23014’30” ~ 23015’30”
4. Catchment area km2 (sq. miles) 361 (141) 9.6
5. Submergence area at FTL / water spread area km2 (sq. miles)
30.72 (13.9) 0.90
6. Maximum water level RL m (ft) 508.65 (1666.80)
7. Dead storage level RL m (ft) 503.53 (1652.00) 499.88
8. Storage capacity 106 m3 (mft3) 101.6 (3588) 8 (282.5)
9. Deepest bed level RL m (ft) 499.26 (1638.00)
10. Maximum depth m (ft) 11.7 (38.4) 9.4
11. Mean depth m (ft) 6.0 (19.7)
12. Total length of weir m (ft) 102.1 (335)
13. Crest level of spillway RL m (ft) 504.38 (1654.80)
14. Designed flood discharge m3/sec 2208
15. Moderate flood discharge m3/sec 538.02
16. Sewage water inflow m3/day (MGD) 33080 (7.3) --
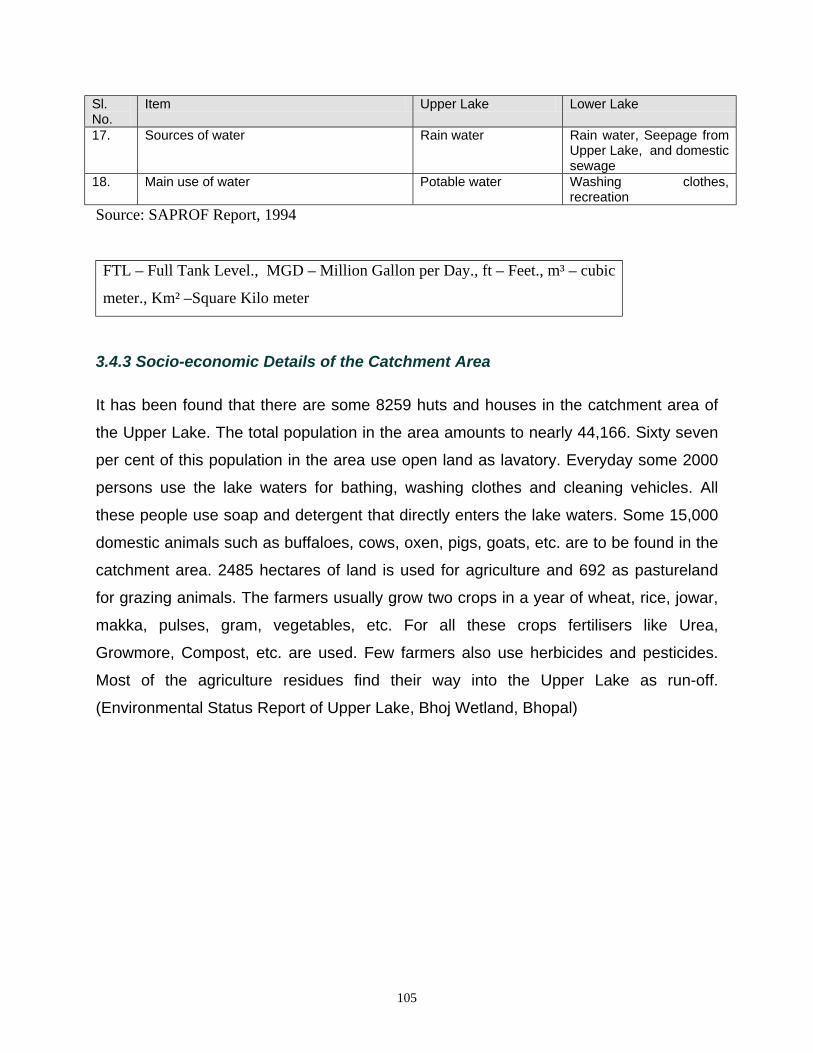
105
Sl. No.
Item Upper Lake Lower Lake
17. Sources of water Rain water Rain water, Seepage from Upper Lake, and domestic sewage
18. Main use of water Potable water Washing clothes, recreation
Source: SAPROF Report, 1994
FTL – Full Tank Level., MGD – Million Gallon per Day., ft – Feet., m³ – cubic
meter., Km² –Square Kilo meter
3.4.3 Socio-economic Details of the Catchment Area
It has been found that there are some 8259 huts and houses in the catchment area of
the Upper Lake. The total population in the area amounts to nearly 44,166. Sixty seven
per cent of this population in the area use open land as lavatory. Everyday some 2000
persons use the lake waters for bathing, washing clothes and cleaning vehicles. All
these people use soap and detergent that directly enters the lake waters. Some 15,000
domestic animals such as buffaloes, cows, oxen, pigs, goats, etc. are to be found in the
catchment area. 2485 hectares of land is used for agriculture and 692 as pastureland
for grazing animals. The farmers usually grow two crops in a year of wheat, rice, jowar,
makka, pulses, gram, vegetables, etc. For all these crops fertilisers like Urea,
Growmore, Compost, etc. are used. Few farmers also use herbicides and pesticides.
Most of the agriculture residues find their way into the Upper Lake as run-off.
(Environmental Status Report of Upper Lake, Bhoj Wetland, Bhopal)

106
Plate.3.1 Pumping Station at Kamala Park (U.L)
Plate 3.2 : Fishing activities in Upper lake
Plate 3.4 : Siltation Point at Upper Lake

107
Plate : 3.5 Trapa cultivation at Upper Lake
Plate 3.8 Weed infestation in the Upper lake
3.5 Uses of the Bhoj Wetland
i) Drinking Water – Nearly half of the city’s drinking water supply comes from the
Upper Lake and this is the most important use of the wetland as far as the
welfare of the citizens is concerned. Till 1947, the water was used without any
means of filtration, which means that the water quality was very good. But in the
recent years, the quality of water has greatly deteriorated. Altogether some 28
MGD of water is provided to the city of Bhopal from the Upper Lake.
ii) Employment - The Bhoj Wetland provides employment to various communities
like the fishermen, washermen, boatmen, vendors and so on. Approximately, 300
families arengaged in fishing and trapa cultivation while some 100 washermen
also make their living from the Wetland. There are some 50 boatmen whose
livelihood is dependent upon the Bhoj Wetland. Because of the many visitors to
the lake, a number of roadside vendors selling maize cobs, and other food items
and snacks, have their stalls next to the lakes and earn quite significant amounts.

108
iii) Microclimate stability - The microclimate of Bhopal is quite moderate as
compared to the surrounding areas. The city according to its geographical
location should actually have an extreme type of climate, but owing to the
proximity of the Wetland, moderating effects on temperature and again cool land
breeze during the evenings can be experienced which makes the evenings even
during the peak of summer very enjoyable. Off course the moderating effects are
also influenced by other factors such as the vegetative cover and all but the
effect can be largely attributed to the Wetland.
iv) Recreation: The Bhoj Wetland provides ample recreational opportunities to the
people of Bhopal. There are parks and fountains as well as boating consisting of
paddle and rowing boats. Some time back motor boats were also being run but
were stopped since they were adding to the pollution and disturbing the migratory
birds that arrive National Park, which is situated at the southwestern border of
the Upper Lake. This too houses many species of animals and is a major
attraction for families and children mainly.
The above are the major direct and indirect use values of the Bhoj Wetland. Other usual
wetland benefits like irrigation, ground water recharge and maintenance of biodiversity
are not all that important mainly because of the following – direct irrigation from the lake
is not allowed; there is no proof of ground water recharge as direct connections
between the aquifers has not been established; being a man made reservoir to be used
mainly as a drinking water source there are no endangered or unique species as such
to be found in the Wetland.
3.6 Threats to the Wetland
Being an urban wetland, the Bhoj Wetland is in fact more fragile as the level of human
interference is very high. The threats to the Wetland have mainly been identified as:
Siltation - This is a major threat to the wetland. The silting rate is estimated to be about
1 cm to 2.58 cm per year on an average. The estimated sedimentation rate from the
catchment area is in the tune of 3.67 ha.m/100 km2/ year (SAPROF Report, 1994).
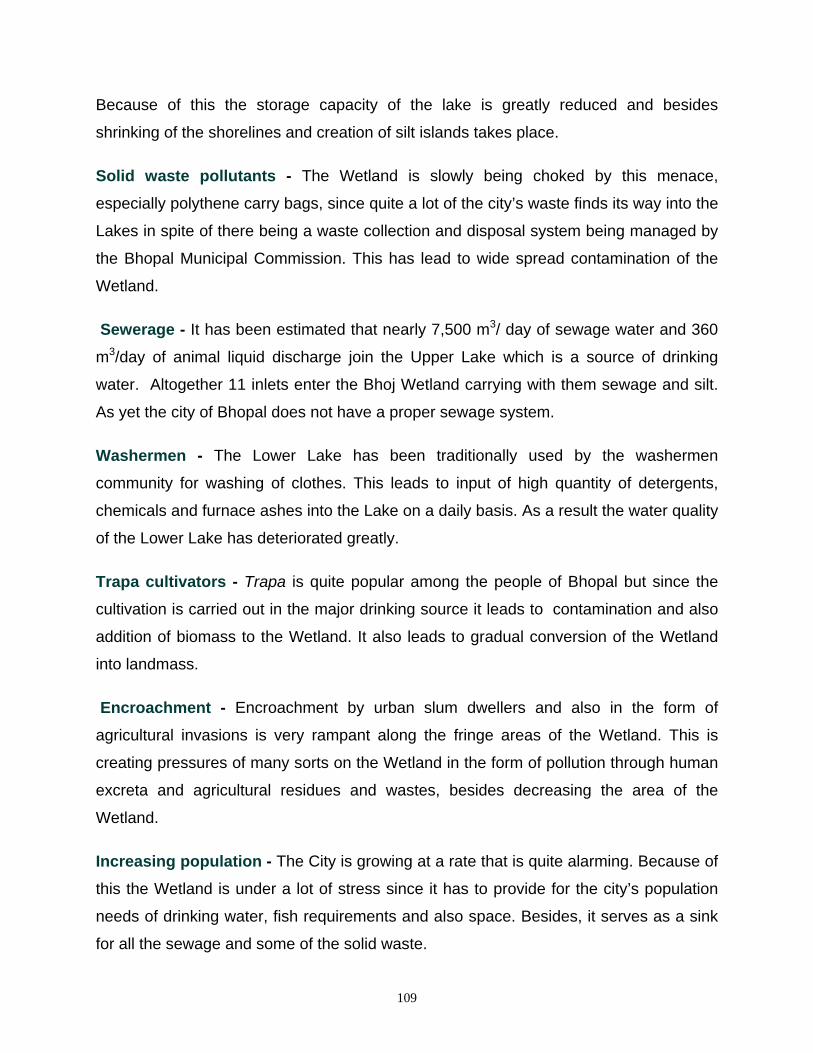
109
Because of this the storage capacity of the lake is greatly reduced and besides
shrinking of the shorelines and creation of silt islands takes place.
Solid waste pollutants - The Wetland is slowly being choked by this menace,
especially polythene carry bags, since quite a lot of the city’s waste finds its way into the
Lakes in spite of there being a waste collection and disposal system being managed by
the Bhopal Municipal Commission. This has lead to wide spread contamination of the
Wetland.
Sewerage - It has been estimated that nearly 7,500 m3/ day of sewage water and 360
m3/day of animal liquid discharge join the Upper Lake which is a source of drinking
water. Altogether 11 inlets enter the Bhoj Wetland carrying with them sewage and silt.
As yet the city of Bhopal does not have a proper sewage system.
Washermen - The Lower Lake has been traditionally used by the washermen
community for washing of clothes. This leads to input of high quantity of detergents,
chemicals and furnace ashes into the Lake on a daily basis. As a result the water quality
of the Lower Lake has deteriorated greatly.
Trapa cultivators - Trapa is quite popular among the people of Bhopal but since the
cultivation is carried out in the major drinking source it leads to contamination and also
addition of biomass to the Wetland. It also leads to gradual conversion of the Wetland
into landmass.
Encroachment - Encroachment by urban slum dwellers and also in the form of
agricultural invasions is very rampant along the fringe areas of the Wetland. This is
creating pressures of many sorts on the Wetland in the form of pollution through human
excreta and agricultural residues and wastes, besides decreasing the area of the
Wetland.
Increasing population - The City is growing at a rate that is quite alarming. Because of
this the Wetland is under a lot of stress since it has to provide for the city’s population
needs of drinking water, fish requirements and also space. Besides, it serves as a sink
for all the sewage and some of the solid waste.

110
Weeds and eutrophication - The Upper and the Lower Lakes are largely weed
infested and the spread of weeds is over a large area of infested fringe area) nearly.
The weeds to be found are mainly of three types: Shoreline (Rooted) – Trapa bispinosa,
Nelumbium sp.; Emergent – Ipomoea aquatica, Polygonum glabrum; Floating –
Eichhornia crassipes, Lemna minor; and Submerged – Potamogeton sp., Chara sp.
Hydrilla verticillata, etc. The weeds have been quantified as follows:
Table 3.3 Area of Wetland under weeds Shoreline (Rooted) Emergent Floating Submerged
Infested Area (sq. km) 5.219 4.728 0.35 23.483
SAPROF Report, 1994
Boating - Motor boats plying in the Lakes leads to pollution of several kinds like oil,
grease and smoke. Besides, they also disturb birds, which visit the Wetland during the
winter months. As a result motor boating has been stopped in the area. Paddle and row
boats of Tourist Department and private agents are functioning in the lake
Agricultural waste - A lot of agricultural land surrounds the Bhoj Wetland as the city of
Bhopal lies on the eastern side of the Wetland mainly. Also most of the catchment area
consists of agricultural land as well. Because of this all the fertilisers and pesticides and
agricultural residues used in the fields find their way as run off into the Lake waters
leading to major and dangerous contamination, both to flora, fauna and human life.
Idol and tadjia immersion - During the Hindu and Muslim religious festivals, lots of
idols and tadjias are immersed in water. This leads to siltation on quite a large scale
besides releasing heavy metals like cadmium, chromium, lead zinc and other extremely
harmful chemicals, and also harbouring bacteria in the biodegradable matter.
Hospital Waste - Some of the major hospitals of the city were disposing their waste
directly into the Lakes. This waste mainly consisted of infected and soiled bandages,
used medicines, syringes and injection bottles, This kind of contamination could easily
lead to the outbreak of epidemics in the city. Incinerators have now been established in
the medical college but other smaller hospitals and private nursing homes are still
carrying on with this system.

111
3.6 Concluding Remarks : What the Future Holds for Bhoj Wetland?
Despite multiple direct and indirect benefits from the Bhoj Wetland, the very existence
of the wetland is threatened due to excessive pressure in the form of threats from
various anthropogenic activities in and around the lake. To control such pressures a two
way strategy following both the defensive and preventive techniques needs to be
implemented on a war footing manner. People also need to be made aware of such
threats and need to be involved in the management and restoration activities. If such
things do not happen in near future it would be difficult to save this pristine wetland and
it shall have the same fate as many other urban lakes in India.

112
CHAPTER IV : METHODOLOGY FOR ECONOMIC VALUATION OF BENEFITS FROM THE BHOJ WETLAND AND THEIR SUSTAINABLE MANAGEMENT
4.1 Introduction
This chapter provides an overall assessment framework for the economic valuation
of Bhoj Wetland, which is later on used to illustrate the role of economic valuation in
the Bhoj Wetland management decisions. It contains the various efforts that were put
in to carrying out the exercise with the detailed methodology of valuation techniques
beginning with more straight forward use of market price data, together with
information about existing productivity stemming from the wetland. Health impacts
due to falling water quality are studied through cost of illness and preventive cost
approach. Contingent valuation, which involves the direct measurement of
willingness to pay values is also well represented. Hedonic pricing is adopted to see
the impact of the existence of Upper Lake on property prices. Then for suggesting
future management strategies sophisticated techniques, such as the integrated
Modelling of hydrological and economic system are presented through ecosystem
Modelling for the assessment of complex ecological functions and changes in the
land use due to anthropogenic pressures.
4.2 Project Methodology
The aim of the project as mentioned before is mainly to calculate the economic
values of the Bhoj Wetland, which is being treated as a natural resource here. For
this purpose, a number of activities had been undertaken during the course of the
project period. The project methodology that had been adopted is as follows:
1. Literature Review: This provides the backbone for any project and
accordingly it was given the required importance in this study too. Nearly six
months were spent on extensive literature review, which provided clarity not
just with regard to implementation of the valuation techniques but also in the
problems particular to the Bhoj Wetland, due to its urban status.

113
2. Site Visits: These were carried out to gather first hand knowledge and view
about the existing system and the activities which are being carried out near
the Wetland system. Identifying the stakeholders also became possible
because of this.
3. Focussed Group Discussions: After identifying the various stakeholder
groups, focussed group discussions were held with the concerned parties in
order to obtain their view regarding the status, use and threats to the fragile
ecosystem.
4. Secondary Data Collection: Secondary data regarding the pollution status,
meteorological and climatic data, revenue and expenditure was collected from
various sources like government offices, project authorities and so on.
5. Workshops: Workshops involving the various stakeholders and cutting
across ranks and positions were held to gain insight into the use and
management problems as well as conflicts arising at various levels (details in
Annexure - III). Besides, a meeting of experts was also held to discuss and
finalise the questionnaire to be used for the Contingent Valuation Method.
6. Survey: A household survey of some 1500 households was conducted to
arrive at the willingness-of-people to pay for improved recreational benefits
from the Wetland. The method used was the Contingent Valuation Method.
7. Consultations: Consultations were held with a number of international &
national experts regarding the methodology to be followed and the data
analysis in order to arrive at better results.
8. Data Analysis: Finally, the data collected in the course of the project duration
was analysed thoroughly using various economic and statistical tests and the
results were arrived at and compiled in the form of a project report.
4.3 Economic Valuation of Natural Resources
According to Kenneth E. Boulding, primitive men, and those of the early civilisations
imagined themselves to be living on a virtually illimitable plane. Gradually, however,
man has been accustoming himself to the notion of the spherical earth and a closed

114
sphere of human activity. It was only in the fifteenth and sixteenth centuries, that
through circumnavigation and geographical explorations, the fact that the earth was
a sphere became widely known and accepted. Economists though have found it
difficult to come to grips with the ultimate consequences of the transition from the
open to the closed earth. “The closed earth of the future requires economic
principles which are somewhat different from those of the open earth of the past. For
the sake of picturesqueness, I am tempted to call the open economy the “cowboy
economy,” the cowboy being symbolic of the illimitable plains and also associated
with recklessness, exploitative, romantic, and violent behaviour, which is
characteristics of open societies. The closed economy of the future might similarly be
called the “spaceman” economy, in which the earth has become a single spaceship,
without unlimited reservoirs of anything, either for extraction or for pollution, and in
which, therefore, man must find his place in a cyclical ecological system which is
capable of continuous reproduction of material form even though it cannot escape
having inputs of energy. The difference between the two types of economy becomes
most apparent in the attitude towards consumption. In the cowboy economy,
consumption is regarded as a good thing and production likewise; and the of the
economy is measured by the amount of the throughput from the “factors of
production,” a part of which, at any rate, is extracted from the reservoirs of raw
materials and noneconomic objects, and another part of which is output into the
reservoirs of pollution. If there are infinite reservoirs from which material can be
obtained and into which effluvia can be deposited, then the throughout is at least a
plausible measure of the success of the economy. By contrast, in the spaceman
economy, throughout is by no means a desideratum, and is indeed to be regarded
as something to be minimised rather than maximised. The essential measure of the
success of the economy is not production and consumption at all, but the nature,
extent, quality, and complexity of the total capital stock, including in this the state of
the human bodies and minds included in the system. In the spaceman economy,
what we are primarily concerned with is stock maintenance, and any technological
change which results in the maintenance of a given total stock with a lessened
throughput (that is, less production and consumption) is clearly a gain (Earthscan
Reader: The Coming Spaceship Earth).

115
Following this consideration of the earth as “Spaceship Earth”, natural resources are
thus classified into exhaustible and renewable resources. Exhaustible resources
such as petroleum, coal and metals are those, the stock for which is fixed. Use of
exhaustible resources depletes the current stock of the resource, reducing its future
availability. On the other hand renewable resources like soil, water, crops, fish,
wildlife, forests and solar energy are regenerated through natural growth though the
time and space of regeneration may greatly vary. Renewable resources typically
have multiple uses. Because of their dependence on complex physical, biological
and chemical processes, and the multiplicity of uses, renewable resources are
generally more difficult to manage than exhaustible resources (Prato, T., 1998). Thus
it becomes necessary to make a suitable action plan for the sustainable
management of these resources for future use keeping in mind the changing use
and demand patterns.
Sustainable development too, involves maximising the net benefits of economic
development, subject to maintaining the services and quality of economic
development, subject to maintaining the services and quality of natural resources
over time. Sustainable development is possible only when the following factors are
taken care of:
a) Utilise renewable resources at rates less than or equal to the natural rate at
which they can regenerate.
b) Optimise the efficiency with which non-renewable resources are used, subject to
substitutability between resources and technological progress. (Pearce and
Turner, 1990)
Natural resources such as forests and commercially exploitable fisheries and
environmental attributes such as air quality are valuable assets in that they yield
flows of services to people. Public policies and the actions of individuals and firms
can lead to changes in the flows of these services; thereby creating benefits and
costs. Because of externalities and the common property and public good status of
at least some of these services, market forces can be relied on neither to guide them
to their most highly valued uses nor to reveal prices that reflect their true social
values. It is the failure of the market system to allocate and price resource and

116
environmental services correctly that creates the need for economic measures of
values to guide policymaking.
The economic value of a resource –environmental system as an asset can be
defined as the sum of the discounted present values of the flows of all of the services
(Freeman, 1993). In other words, it means putting a money value on the benefits and
flows of services that are obtained from any system. This idea of monetising benefits
or damages to the environment is not easily acceptable to people. But the
justification for monetary valuation lies in the way in which money is used as a
measuring rod to indicate gains and losses in utility or welfare. The reason why
money is used as the measuring rod is that all of us express our preferences every
day in terms of these units – when buying goods we indicate our ‘willingness to pay’
(WTP) by exchanging money for the goods, and, in turn, our WTP must reflect our
preferences. Economic values have many uses: they help us to identify, or at least
approximate, the optimum. Another use is to demonstrate the importance of
environmental policy. The gains or benefits from environmental benefits tend to be
found more in the quality of life than in any increment to a nation’s economic output.
Thus since they are less ‘concrete’, more ‘soft’ than market-place benefits. As a
result they are downgraded in comparison (Pearce and Turner, 1990).
Total Economic Valuation is actually composed of a number of values that are
broken up mainly into use and non-use values. The use values are mainly direct and
indirect use values. Other than this option values and existence values also form part
of the total economic value studies. But this total economic value can still not be
considered to have captured all the values that are actually present in the system,
since only economic values are captured. Some intrinsic values still remain.
Secondly, many ecologists say that total economic value does not give the entire
economic picture either. There are a number of underlying functions of ecological
systems called as primary values upon which all the ecological functions are
contingent. Some of these functions are not covered by the concept of total
economic valuation (Pearce, 1995). Thus at times, a valuation exercise may not
reflect all the values of the system under consideration, but in the Indian context, it is
more important to stress on the concept of total economic valuation rather than

117
whether the value thus calculated is complete or not. The methodological issues can
be considered once there are some valuation exercises to serve as a basis.
4.4 Methodology
The major valuation techniques dealt with in this exercise are direct valuation
including production function and indirect valuation approaches like cost of illness
approach, cost of avoidance, contingent valuation and hedonic pricing. It is tried to
capture the major use values of the wetland ecosystem and it is believed that a
number of indirect uses are embedded in the system and thus have also been
captured simultaneously.
The methodology for valuation of the uses, that has been followed is as:
1. Direct Valuation – The lake produces many direct benefits like drinking
water, fish, trapa, recreational activities like boating. The monetary value of
the major benefits and the income generation these activities has been
calculated by taking into account the number of people who make their living
therein as well as the amount that they earn on an average in a year taking
seasonality into account. The various people thus covered are fishermen,
private boatmen, washermen or dhobis, Trapa or singhara cultivators,
vendors on the lake sides and so on. Besides these, value of supplying water
to the people and the water tax that is being charged from them is also taken
into account. Also the revenue generated by the Madhya Pradesh Tourism
Department through its boating activities and the cafeteria run by it are
considered. All this data was collected through secondary sources, focussed
group discussions with the various stakeholders as well as through primary
survey.
2. Cost of Illness Approach and Defensive or Preventive Costs – The water
quality in the Upper and the Lower Lakes has deteriorated largely and that too
mainly over the last couple of decades. The reasons for this can be attributed
to the growing sewage discharge into the lakes and other forms of
anthropogenic pressures that exist in the vicinity. As a result there are
numerous incidences of the outbreak of water borne diseases in the city. In
this exercise the figures of such cases in the last four years of a few water

118
borne diseases have been collected from the government hospitals. The
average expenditure that occurs in these cases have then been calculated
and thus the total costs spent on an average on these has been obtained. The
cost of man-days lost on account of these illnesses is also taken into account.
Moreover, people also resort to a number of preventive measures to protect
themselves against these diseases like installation of water purification
devices and vaccination against Hepatitis B. The expenditure that is made on
such measures has also been used to obtain the willingness of people to pay
for clean water and the kind of importance given by them to water quality.
3. Contingent Valuation Method (CVM) – When relevant market behaviour is
not observable, the contingent valuation method puts direct questions to
individuals to determine how much they might be willing to pay for an
environmental resource, or how much compensation they would be willing to
accept if they were deprived of the same resource. The contingent valuation
method is more effective when the respondents are familiar with the
environmental good or service (for example water quality) and have adequate
information on which to base their preferences (Munasinghe and McNeely,
1994). {Details about the CVM have been given in the Part I, of the report}
Sampling plan: Altogether 1500 households over the entire city were sampled under
this study. The sampling methodology adopted was as follows: The city of Bhopal –
the Universe for this study, comprises of 66 municipal wards. A population wise
representative sample from each ward was taken. To decide the sample size from
each ward the population of the ward divided by the 1991 population of the entire city
gave the fraction of people to be interviewed from the ward. This fraction formed the
percentage of interviews in a particular ward of the total sample. Eventually 1504
households were interviewed in this study. (details in Annexure I) From each ward
once more the various colonies or habitation areas were identified and the number of
samples to be interviewed from each of these areas was calculated on basis of the
number of houses there. Finally at the time of survey, the samples were identified on
a random basis keeping the households interviewed at appropriate distances so as
to cover the entire locality. Thus the sampling pattern that is used is a three stage
purposive sampling method. The first stage is the selection of all the wards. Next is

119
the selection of major population habitats in the area. The third is the random
selection of households from these colonies. Since the third stage is actually an
example of quota sampling, the whole sampling design can be called as a three
stage purposive sampling plan.
Questionnaire and Scenario build-up: CVM in this study has been used to capture
mainly the recreational benefits that the citizens of the city derive from the Upper and
the Lower Lake. After detailed discussions with experts and others, it was found that
capturing the recreational and aesthetic values would also have embedded within it
the existence and the bequest values. The CVM is used only for recreational and
aesthetic benefits since the other benefits do not extend to the entire city. Moreover,
there are no rare species to be found in the Wetland because of which biodiversity
conservation in this case no longer remains important. A detailed questionnaire was
used to elicit the Willingness to pay of the people for increased recreational and
aesthetic benefits from the lakes (attached in Annexure – II). A scenario explaining
the benefits of the lakes and the kind of possible recreational improvements that can
be made was presented before each householder through photographs, and
information shared with the people. The householders were then asked to state how
much they would be willing to pay in order to enjoy the increased benefits from the
lakes and also how much they would contribute as tax whereby the entire collections
made thereof would go towards the maintenance and provision of recreational
benefits. The median figures for these were then taken into account and extrapolated
for the entire city. For the scenario build-up to be presented before the people, a
detailed ecological modelling exercise was carried out to provide a basis for scenario
buildup. The details of these are given in Chapter – V.
Hedonic Pricing - Often, relevant market data to value environmental resources are
not available in a directly usable form. In such cases, analysis of indirect market data
using, for instance, statistical and econometric methods permits the valuation to be
carried out implicitly (Munasinghe and McNeely, 1994). In areas where relatively
competitive markets exist for land, it is possible to decompose real estate prices into
components attributable to different characteristics such as proximity to schools,
shops and parks, and so forth (Cropper and Oates, 1992). To value an
environmental amenity like proximity to the Lakes in this case, the method seeks to

120
determine that component of the property value attributable to the relevant
environmental variable. Thus the marginal willingness to pay for improved local
environmental quality is reflected in the increased price of housing in cleaner
neighbourhoods (Munasinghe and McNeely, 1994).
The method followed in this study considered the rates of property in various parts of
the city. These properties were then analysed on the basis of their locational and
neighbourhood advantages, proximity to markets, accessibility on basis of distances
from downtown and environmental factors like pollution levels and also whether the
lake was present in the vicinity or not. Regression equations were then run on these
to obtain the marginal willingness to pay of the people for housing in locations close
to the Lakes.
4.4.1 Ecosystem Modelling of Bhoj Wetland Using Water Quality Parameters
Economic value of any water body, whether used for potable water supply or
aquaculture depends upon its water quality. Better the quality better will be the
economic value. People pay more for better quality. Through this WTP survey the
aesthetic value of Bhoj wetland is estimated. The present situation of the lakes is
very complicated due to the various ongoing restoration activities. More over in the
survey it was necessary to present the overall picture of the water body with changes
occurred through years due to various anthropogenic activities. These changes on
the water quality and its impact were the main concern in the pre test of the WTP
questionnaire. People in the pre-test were unaware about the ongoing restoration
activities and doubtful on its end results because the changes in the water quality
due to the restoration activities are less observable in the limited period of time. And
the same time people were asked to pay for the restored and well-managed lake for
its recreational aspect. So it came necessary to project the scenario after the
restoration. The model can show the scenario of the wetland for the next 25 years .
The policy makers can utilise these results to adopt suitable management activities
in the restoration process.
The first pre- restoration model clearly shows the importance of restoration of the
wetland. in the second model ,i.e. model for ongoing restoration finds changes in
water quality. This was very useful to explain the situation after the restoration to the

121
people. People were always ready to pay more if the goal has achieved i.e, for better
aesthetic conditions of the wetland.
The model results are useful to explain the problem of pollution and management
strategies. The proposed lake management society can make pollution mitigation
policies according to this model results. People expressed their willingness to pay for
such society.
As mentioned earlier that the major function of the Bhoj Wetland specially the upper
lake is to provide drinking water to nearly 40% of cities population. There are other
competing uses like fishing, recreation (which can be permitted on limited basis) but
uses like washing, bathing and immersion of ideals; agricultural run off, sewage
disposal are severely deteriorating Bhoj Wetland’s water quality. The water quality of
the upper lake was in ‘A’ class till 1947 (the water quality standards are mentioned in
Chapter V on Ecosystem Modelling). Since then there has been considerable
deterioration in the water quality and now it is in category, ‘C’ class for designated
use and that of lower lake is in category ‘E’ for designated use. As there are
interventions now in the form of restoration activities by the State Government, in the
planning of the project the target level of water quality in the two lakes have been
established as per the tolerance limits and are set as class ‘A’ in the case of upper
lake and class ‘D’ in the case of lower lake.
Basic ecological parameters relating to water quality like Dissolved Oxygen,
Biochemical Oxygen Demand, pH, Total Hardness, Total Alkalinity, Phosphate,
Turbidity, Total Dissolved Solids and Bacterial count are taken into consideration and
their linkages and changing values due to increasing anthropogenic pressures have
been studied. Taking these parameters, a system’s model using STELLA software
has been developed to understand the dynamics of Bhoj Wetland Ecosystem. Over
time data pertaining to various parameters mentioned above is used to determine
the trend in the lakes ecology. Various scenario runs are performed to see the future
of the lake before and after the restoration activities. Through simulation runs the
policy interventions are suggested such that the actions can be prioritised and lake
could be maintained in a sustainable manner. Else it would have the same plight as
the other lakes in different cities of India.

122
CHAPTER V : ECOSYSTEM MODELLING OF BHOJ WETLAND USING WATER QUALITY PARAMETERS
5.1 Introduction
As mentioned in the methodology section, the main objective of Ecosystem Modelling of
Bhoj Wetland using water quality parameters is to first study the current status of the
lake, changes in the water quality parameters over the past years and then based on
the past data and the ongoing restoration activities to project the status of two lakes in
future. This shall help to provide an insight for sustainable management techniques
through prioritisation of various interventions and undertaking restoration activity. The
threats to BWL have been dealt in details in chapter III. This chapter begins with the
general introduction to Ecosystem Modelling and then discusses model for the Bhoj
Wetland using water quality parameters. Further it gives an account of ongoing
restoration activities taken up by the Bhoj Wetland restoration project executed by the
Environmental Planning and Co-ordination Organisation (EPCO). It then gives values of
the parameters at different points of time and their current status at seven Quality
Monitoring Stations at upper and Lower Lakes. Using the data pertaining to these
parameters an advanced ecological model is developed using software called as
STELLA. Based on 1985, 1991-92 and 1999 data pertaining to these parameters
compound growth rates are determined and elasticity between various variables are
worked out so as to establish the linkages between them. Having established significant
linkages, the model has been developed and simulation runs are performed first by
using 1985 and 1991-92 data to find out what could be the status of the lake if such
trends continued (without restoration and prevention activities, i.e. pre restoration and
management activities) and then they are compared with another set of simulation runs
using 1991-92 and 1991data (after the commencement of restoration activities). The
scenarios so obtained actually represent the health of the lakes ecosystem and stress
the needs to value the impact of changing health of the lake on economic system. They
further through light on prioritisation of future policy interventions which shall be required
if the lake is to be managed sustainably.

123
5.2 Ecosystem Modelling
Ecology literally means “the study of homes”. Haeckel coined the term in 1869 to mean
the study of organisms in their organic and inorganic environment. More recently,
Krebs (Krebs, 1978) has defined ecology as “the scientific study of the interactions that
determine the distribution and abundance of organisms”.
Ecological systems are definitely not ‘stand alone’ systems. Each component in these
systems cannot be treated as an individual component because of the many
interlinkages present. None of the components can in fact be dealt with in isolation
since the entire network of linkages has to be taken into account whenever the system
is being considered. For example, if one has to study the population dynamics of a
particular species, then an understanding of how this system interacts with other
species, the dynamics of all these species and so on are required.
Physical systems are definitely easier to model since initial conditions can be specified
and external influences largely eliminated here. But with ecological systems this is a
drawback since these may be influenced greatly by external factors such as climate,
which may introduce large variations in the system. Thus replicated designs may be
impossible to study in ecological systems (Robertson et al., 1991).
Ecosystem modelling involves the depiction of ecosystem functions by changes over
time or space (or both) in measurable quantities, thereby allowing some test of the set
of process hypotheses at the ecosystem level. Modelling becomes important because it
can construct a symbolic representation of the functioning of ecosystems. It can also
predict and simulate conditions that might be existent if present trends to continue or
new factors introduced into the system. It helps to identify the stress areas in a system
and help to develop management strategies to help deal with them. Generally,
modelling is used to make predictions about the responses of ecosystems, or
components of ecosystems to specify stresses or disturbances.

124
The first simulation models for ecosystems were developed in the mid-1940s by Gordon
Riley, for marine ecosystem primary and secondary production. These models were
developed before the advent of the digital computer and required laborious calculations.
Present day ecosystem simulation requires use of a digital computer and simulation is
now inseparable from the digital computer. (Gordon &Stephen, 1987).
5.2.1 Major Model Types
Models can be classified in many different ways, and it is frequently true that the
classification applies more appropriately to parts of models rather than to the model
itself and that some models can be put into more than one class.
5.2.1.1 Statistical Models:
These models are simply used to summarise large amounts of data in a mathematical
form. The choice of the mathematical form itself has little or no theoretical justification,
and the resulting parameter values, obtained by the statistical procedure, have little
biological meaning. A common example is the fitting of polynomial equations to growth
data, as in agricultural crops or forest stands.
5.2.1.2 Theoretical / Analytical Models:
These are developed from simple theoretical considerations, frequently with little or no
basis in observed sets of data. These models are used to explore abstract ecological
concepts, such as the coexistence of two competing species, or the relation between
complexity and stability in ecological systems. The models are frequently handled
analytically, and mathematical tractability is more important than ecological sense. Such
models therefore tend to make highly simplistic ecological assumptions (for example,
that there is a linear relationship between the amount of food eaten by a predator and
the amount of food available), and this makes many of the conclusions of very doubtful
value.

125
5.2.1.3 Numerical Simulation Models
Numerical simulation models involve the literative solution of a mathematically -
specified model. In a relatively few cases, such as the statistical simulation of sampling
problems, the iteration is over the set of individuals in a population. In the vast majority
of cases, the primary iterative loop is forward through a set of points in time. In these
cases, the model specifies the changes that take place over one time step, and the
model is solved by repeatedly working out changes in the system, then updating the
state of the system. (Robertson et al.,1991).
In more simple terms, models are likely to be either conceptual or numerical. Stochastic
models use mathematical representations of ecosystems, which take account of
probability, so that a given input may yield a number of possible results. Deterministic
models, on the other hand, rest on mathematical descriptions of ecosystems in which
relationships are fixed, so that any given input invariably yields the same result
(Allaby,1994).
Simulation models consist of a collection of hypotheses, in equation form, for how the
major elements of the model (state variables) change over time. These hypotheses are
usually categorised into several processes controlling the rates of change of the state
variables. The choice of processes to consider depends on the major variables in the
model and on the degree of detail desired to represent the changes in these variables.
These depend in turn on model objectives and on the ecosystem under study. The
process rates are combined into a system of different equations. These equations give
the rate of change of the state variables as a function of their own condition and of other
state variables and environmental conditions. (Gordon & Stephen, 1987).
Thus conceptual models assist in the understanding of complex, multivariable problems.
Management models should offer reliable predictions of the outcome of alternative
approaches to problems that assist the manager to decide the optimal course of action.
It is rare for one model to fulfil both purposes. The ability to make a mathematical
model which simulates a natural system or process is a measure of the modeller’s
understanding of that system.

126
5.3 Bhoj Wetland Restoration Project Executed through EPCO
The Environmental Planning and Co-ordination Organisation (EPCO) was established
by the Housing and Environment Department of Government of Madhya Pradesh in
1981. It prepared an action plan on behalf of the Government of Madhya Pradesh for
the conservation and management of both the lakes of Bhopal City. The Government of
Madhya Pradesh requested the Government of India for financial assistance to
implement this plan. The GOI in turn posed this project for bilateral assistance to
Government of Japan. The then Overseas Economic Co-operation Fund (OECF) of
Japan now called as the Japan Bank for International Co-operation (JBIC) has provided
Rs 209.97 crores as loan funds for the implementation of this project. The total project
cost is 247.02 crores in which the State Government Contribution is Rs 37.05 crores.
The objectives of the Bhoj Wetland Restoration Project are:
• To conserve and manage the Bhoj Wetland that consists of the Upper & Lower
Lakes of Bhopal which are now being subject to severe environmental
degradation due to pollution.
• To ensure availability of water from the Upper Lake which is one of the major
sources of water supply to the city of Bhopal in an increased quantity and
satisfactory quality.
Water quantity available for specific uses declines with the extent of pollution flowing
into the water body. When quality deteriorates, the economic value of water also gets
reduced. With increasing quality deterioration, water uses may successively shift from
drinking water to bathing water, water for livestock, agriculture and industrial uses etc.
same has been the case of Upper and Lower Lakes where the water quality levels
have reduced to Class ‘C’ and ‘E’ respectively. The ultimate goal of the restoration
project is to bring the water quality of Upper Lake to the designated Class ‘A’ and that
of Lower Lake to designated Class ‘D’ as per the following primary water quality
criteria.

127
Table 5.1 Primary Water Quality Criteria
Primary Water Quality Criteria Criterion Class A Class B Class C Class D Class E
Dissolved oxygen (mg/I)
minimum
6 5 4 4
BOD (mg/I) maximum 2 3 3
Total Coliform count
(MPN/100 ml.) maximum
50 500 5,000
PH 6.5-8.5 6.5-8.5 6-9 6.5-8.5 6.5-8.5
Free ammonia (mg/I)
maximum
1.2
Conductivity (micro
mho/cm) maximum
2,250
Sodium absorption ratio
maximum
26
Boron (mg/I) maximum 2
BOD : Biochemical oxygen demand; pH : measure of the acidity of alkalinity of water,
MPN : Most probable number, Mho : unit of conductivity.
Class A : Drinking water source without conventional treatment. Class B : Water for outdoor bathing, Class C : Drinking water with conventional treatment, Class D : Water for wildlife and fisheries, Class E : Water for recreation and aesthetics, irrigation and industrial cooling Source: Dying Wisdom, CSE Report 1997
This project involves several pollution control and environmental conservation
measures. Altogether there are 15 sub projects under this project. These are mainly:
1. Desilting and Dredging of Lakes – Silt deposition in the lakes over the many years
has led to numerous problems such as reduction in the storage capacity of the lake,
accumulation of nutrients that promote pollution of lake water and luxurious growth of
aquatic weeds, algae and other organisms. Because of this deposition, land formation

128
has also started. Thus the aim of this project is to remove the huge amounts of silt
present in the lake beds.
2. Deepening and Widening of the Bhadbhada Spill Channel – This subproject aims
to widen and deepen the spillway from the Upper Lake in order to accommodate a
discharge of 566 m3/sec so
that in case of flood threats
water can be released easily
from the spillway, thus
reducing stress on the earthen
dam at Kamla Park. The
deposition of silt in the spillway
obstructs the smooth flow of
water in the approach channel
to the spillway. Further the deposition of silt also leads to high silt pressure on the weir.
3. Restoration of Takia Island – The Takia Island on the Upper Lake has a mazhar of
the Shah Ali Shah Rahmatullah Allaih which has a religious significance. The objective
of the sub project is to restore the island’s shape and form by preventing further erosion
and prevent the accumulation of silt around it leading to the proliferation of weeds and
subsequent land formation and shifting of the land mass.
4. Afforestation & Creation of Buffer Zones – In order to prevent encroachments,
human settlements, movement of cattle
and cultivation etc., buffer zones have
been created particularly in the
Western, Southern and Northern fringe
area of the lake. This plantation is also
being carried out in the catchment area
of the Upper Lake to control and check
soil erosion. Under this sub-project,
more than 15 lakhs plants are being
Plate. 5.1 Deepening and widening of spill channel
Plate5.2. Plantation site under Afforestation Programme

129
planted in 872 hectares of land. The species planted are mostly biomass producing and
medicinal plants. The co-operation of the people is being solicited for this programme.
5. Construction Of Check Dams, Silt traps, Toe Walls and Cascading for Controlling Silt Entry – This
catchment area treatment is
being carried out to mitigate
inflow of silt, agricultural residues
and other wastes etc., into the
lakes through mechanical
obstructions created on the
nallahs discharging these into the
lakes. 78 structures on the
nallahs of the Upper Lake and 5 on
those of the Upper Lake are planned.
6. Construction of Garland Drains - This sub project is an ambitious one that
envisages the construction of a garland drain around the Lower Lake for catching all the
non point sources of pollution. The Lower Lake receives its inflow from 28 nallahs and
drains. It is being tried to control the inflow of sewage and sullage into the Lower Lake
by provision of surface drains/pipe drains connected to the sewerage system which
shall divert this water away from the lake and to prevent entry of silt into the lake coming
through different streams joining the lake.
7. Prevention of Sewage Pollution – The aim of this sub project is to provide an
improved sewage system in the areas which drain into the upper and Lower Lakes so
that sewage and waste water from these areas can be collected and diverted away for
treatment.
8. Retghat – Lalghati Link Road – The objective of the construction of the link road
between Retghat in the old city and Lalghati in the northern side of the Upper Lake is to
prevent human intervention in the fringe area of the lake by creating a physical barrier
Plate 5.3. Gabien structure near Lower Lake
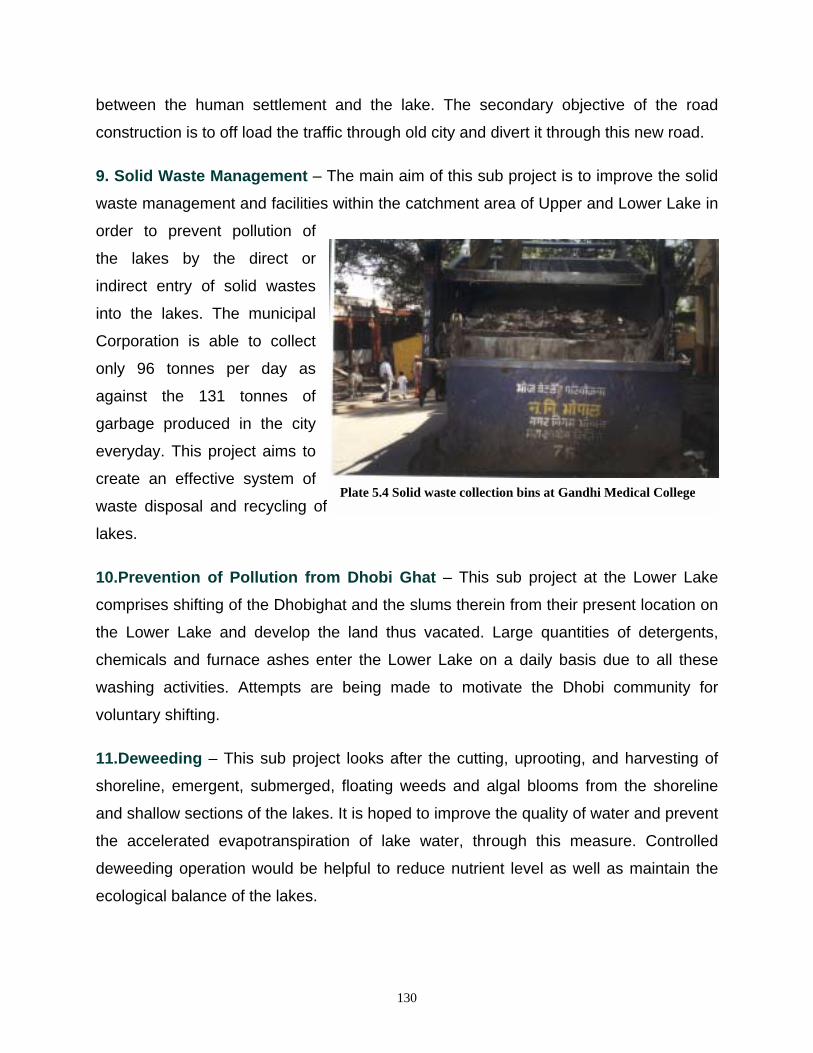
130
between the human settlement and the lake. The secondary objective of the road
construction is to off load the traffic through old city and divert it through this new road.
9. Solid Waste Management – The main aim of this sub project is to improve the solid
waste management and facilities within the catchment area of Upper and Lower Lake in
order to prevent pollution of
the lakes by the direct or
indirect entry of solid wastes
into the lakes. The municipal
Corporation is able to collect
only 96 tonnes per day as
against the 131 tonnes of
garbage produced in the city
everyday. This project aims to
create an effective system of
waste disposal and recycling of garbage and checking solid waste from entering the
lakes.
10.Prevention of Pollution from Dhobi Ghat – This sub project at the Lower Lake
comprises shifting of the Dhobighat and the slums therein from their present location on
the Lower Lake and develop the land thus vacated. Large quantities of detergents,
chemicals and furnace ashes enter the Lower Lake on a daily basis due to all these
washing activities. Attempts are being made to motivate the Dhobi community for
voluntary shifting.
11.Deweeding – This sub project looks after the cutting, uprooting, and harvesting of
shoreline, emergent, submerged, floating weeds and algal blooms from the shoreline
and shallow sections of the lakes. It is hoped to improve the quality of water and prevent
the accelerated evapotranspiration of lake water, through this measure. Controlled
deweeding operation would be helpful to reduce nutrient level as well as maintain the
ecological balance of the lakes.
Plate 5.4 Solid waste collection bins at Gandhi Medical College

131
12. Monitoring of Water Quality – Through regular monitoring by means of setting up
a highly sophisticated laboratory, physico-chemical and biological parameters and
heavy metals in the lake waters can be assessed. The effect of pollution from different
sources and their intensity and quantum can thus be calculated.
13. Installation of Floating Fountains – The objective of installing floating fountains in
the Lower Lake is to oxygenate the lake through aeration. The oxygenation is helpful to
the biotic component of the lake.
14. Biological Control through Aquaculture – It is also proposed to biologically
control aquatic weeds and plants with a view to improve the quality of lake Water using
aquaculture. For this programme co-operation of the local fishermen becomes very
important and it is hoped that this programme shall have a direct and positive impact on
the economy with the increase in supply of fish as a food and upliftment of the living
standards of fishermen.
15. Public Participation & Environmental Awareness – The participation of the local
people in this Project is essential for its success. To achieve this co-operation, it is
necessary to educate and train the public through a planned environmental awareness
programme with the help of NGOs and other educational institutes. The objectives of
this programme are to associate the residents of Bhopal with the various activities
regarding environmental conservation of the lakes of Bhopal; to mobilise different
segments of the society to ensure participation in various environmental protection and
conservation programmes; manpower development to ensure implementation of
development programmes without environmental degradation.
5.4 Ecosystem Model for Bhoj Wetland
Wetland models have been very much in focus during the last five to eight years due to
an increasing interest for these ecosystems as habitats for birds and amphibians.
Restoration of previous wetlands or erections of new wetlands seem furthermore to be
the most effective method of abatement of nutrient pollution from non-point sources

132
(agricultural pollution). This has obviously increased the demand for good management
models in the area.
Bhoj Wetland, the lifeline of Bhopal, being a man made reservoir within the city is facing
threats due to various anthropogenic activities inside and outside the lake area. The
primary use of the lake, as mentioned, is providing drinking water to nearly half the city’s
population. The drinking water quality has been deteriorating steadily over the years
owing to increased human activities in the region.
A detailed conceptual model with causes, impact and feed back control strategy
(restoration and pollution prevention activities) has been developed using Oakerson’s
Basic Interaction Model for Common property Resources Management (Fig.5.1). It
attempts to assess the impact of economic, ecological, social and technological factors
on the lake’ ecosystem and suggests the control strategies through the feedback
mechanism and thus follows a holistic approach for the sustainable management of
Bhoj Wetland. But due to lack of availability of data the model presented here has
considers only the basic water quality parameters. Though indirectly the pressure of
economic, social and technological factors does gets expressed in terms of changing
values of these parameters but not so explicitly.
Thus a detailed ecological model linking basic parameters and their impact on water
quality has been developed. Though it is clear that the linkages are very complex, to the
extent data and information are available, and to the extent the parametric
specifications stand the test of stable relationships, the model is put to explain the eco-
system dynamics. Therefore, one may not take this model to be a complete description
of the ecology of Bhoj Wetland. Here the model variables are selected drinking water
quality parameters.
5.4.1 Model variables
The goal of management is to balance the uses of lake with conservation measures to
sustain ecosystem services over time. Lake degradation is a syndrome with multiple
causes. Because lake degradation has multiple causes, lake restoration usually

133
requires multiple interventions. The basic ecological parameters brought under the
purview of the conceptual model for Bhoj Wetland are weeds and sewage. All are linked
with each other in one way or another. The water quality parameters like Dissolved
Oxygen (DO), Biochemical Oxygen Demand (BOD), pH, Total Hardness, Total
Alkalinity, phosphate, Turbidity, Total Dissolved Solids (TDS) and Bacterial Count are
linked with these variables and with each other (all these parameters and their
permissible range are described in Glossary) and their dynamics in the lake’s
ecosystem is explained below.
5.4.1.1 Bio Chemical Oxygen Demand (BOD),
BOD, an important water quality parameter, shows the level of biodegradable waste
pollution. The BOD value of the system is affected by sewage which releases nutrients
and biodegradable domestic waste (food wastes) in the lake waters. BOD is also
affected by total solids which itself is dependent upon household wastes coming
through the sewage. BOD shows a positive link with bacterial count and total dissolved
solids. Dissolved Oxygen (DO) content of the water body affects the BOD greatly. A
high DO value indicates good primary production and life supporting potential of the
system.
5.4.1.2 Bacterial Count
Bacterial Count can provide a better picture of drinking water quality. Total bacterial
count through Maximum Probable Number (MPN) technique shows the number of
bacterial pathogen(E.Coli) present in the sample of water. They are the causative
agents of many water borne human diseases. The bacterial count has increased in an
alarming way in the Bhoj Wetland over the last few years. In this model the bacterial
count is connected to sewage, pH, turbidity and BOD. The change in pH value affects
bacteria the most. Similarly, high BOD means more biodegradable material in water
which also provide nutrients to bacteria. Total solids are also linked with the increase of
bacterial count. But the main source of the bacteria is the waste (solid and sewage)
from the hospitals and houses.

122
Figure 5.1 CONCEPTUAL MODEL OF THE CAUSES, IMPACT & FEEDBACK CONTROL STRATEGY –BHOJ WETLAND
ECONOMIC FACTORS
• Urbanisation • Lack of ecotourism
SOCIAL FACTORS TECHNOLOGICAL
FACTORS • City sewage • Hospital Waste • Fertilisers • Pesticides • Detergents • Automobile washing ECOLOGICAL FACTORS
• Eutrophication • Siltation • Sedimentation
IMPACT ! Lake area
! Algal Vegetation
! Weed growth
! Avifauna
! Siltation and
sedimentation
! Temperature
! Free CO2
! Water supply
! Water sports
! Recreation
! Fish yield
! Trapa yield
CONTROL STRATEGY # Desilting and dredging of lakes # Deepening and widening of Bhadabada spill
channel # Restoration of Takia island # Afforestation and creation of Buffer Zones. # Construction of Check Dams, silt traps, toe walls
and cascading for controlling silt entry # Construction of garland drains # Prevention of Sewage pollution # Retghat – Lalghati Link road # Solid waste management # Prevention of pollution from Dhobi Ghats # Deweeding # Monitoring of water quality # Installation of floating fountains # Biological control through aquaculture # Public participation and environmental
awareness
Improvement
in quality and
quantity of
lake waters &
development
&
maintenance
of the wetland
LEGEND Long term changes Short term changes
Developed for Bhoj wetland using Oakerson’s Basic Interaction Model for Common Property Resources Management

127
5.4.1.3 Total Hardness
Total Hardness is the sum of hardness due to calcium and magnesium ions
present in the water. This is linked with the geological conditions of the
catchment area. Soil structure and land use practices of catchment area affects
its value. In this system it is linked with sewage and total dissolved solids. The
high hardness makes white precipitates in the boilers and consumes more soaps
and detergents while washing in such waters.
5.4.1.4 Dissolved Oxygen
Dissolved Oxygen is an important parameter of all ecosystems because it
controls life inside the water. Very low oxygen indicates high polluting levels of
oxygen demanding wastes and lack of primary production. Temperature,
turbidity, phytoplankton count and high BOD are the controlling factors of
Dissolved Oxygen.
5.4.1.5 Total Phosphate
Total Phosphate content in the lake water indicates the pollution from sewage
and agricultural run off. This is the limiting nutrients for primary production and
helps excessive growth of weeds and lower aquatic plants. Fertilisers and
detergents are the main sources of inorganic phosphate which plants can absorb
directly. Organic phosphates of living cells and dead cells also contribute
phosphate to the system. High value of phosphate is considered nutrient rich
condition of the water body, leading to eutrophication.
5.4.1.6 Turbidity
Turbidity of the lake is related the suspended and colloidal particles of the water.
It reflects or hinder the light penetration, thus impact on primary production and
dissolved oxygen value of water body. Turbidity can measured in Naphalo
Turbidity Units (NTU) and here mentioned Formazin Attenuation Unit (FAU)
which is equal to NTU.

128
5.4.1.7 Inter-linkages of Various Parameters
The inter linkages in the model may be illustrated by one parameter, say sewage
coming to the lake. Sewage from the city household waste contains mainly
water, food wastes and detergents with silt. It increases silt content of the lake
water and reduce the lake area. It leads to eutrophication by bringing more
nutrients that cause excess weed growth. This causes lake area reduction and
affects the BOD of the ambient water of the lake.
Weed growth has its ecological benefits and is a cause of problems to the
system too. It helps in biodiversity conservation by providing a nesting and
breeding ground to fish and provides food for a number aquatic and avian fauna.
It is also responsible for the bio treatment of sewage, i.e., nutrient retention, as
filter to the silt and as primary producer giving dissolved oxygen to the water. But
excessive growth of weeds reduces the water spread area, increases
evapotranspiration (increases water loss), creates problems in fishing and
navigation. The decayed parts of the weeds add more nutrients to the sediments
and increase BOD in the lake waters. It also produces bad odour and breeding
grounds for mosquitoes and other vectors. The drinking water quality gets
affected by this, and a high cost for treatment of such water has to be incurred.
Weed growth is affected mainly by sewage because it provides more nutrients
which encourages such growth. It itself then affects bacteria, BOD and Turbidity.
Thus weeds can adversely affect lake area and BOD but has positive link with
dissolved oxygen of the lake.
5.4.2 Linkages of Model Variables with Population
All these parameters are directly linked with the population change. Increase in
the population over the years has obviously led to an increase in the amount of
sewage inflow into the water body. Population increase has also led to increase
in development activities and encroachment in the catchment area resulting in
more siltation and solid waste entry into the lake.
129
Population growth in the adjacent areas of the lake is the most important factor of
pollution. Encroachment in this area is considered in the restoration activities and
useful measures like physical barriers (Link road) have been taken to check
further encroachment. Increase in population increases water consumption and
generate more waste water. Increase in sewage quantity affects the system
adversely. In this model population of the wards nearing the fringe area of lake
are taken for each lakes separately.
The Ecosystem Model for BWL using above parameters is depicted in Figure 5.2
5.4.3 Assessment of Impact of Ongoing Restoration Activities
The present scenario of the lake, undergoing restoration activities, is quite
different from the situation of a few years back. The major changes have been in
the quantity and quality of the sewage and weed infested area of the lake. After
desiltation and dredging the lake area and volume will also change. The total
impact of the restoration activities are yet to be quantified. The restoration of Bhoj
Wetland which include Upper Lake and Lower Lake gives priority to its drinking
water use in Upper Lake. The water quality in the Lower Lake is not in this
criteria so can be used for other purposes like fresh water aquaculture and
tourism activities.
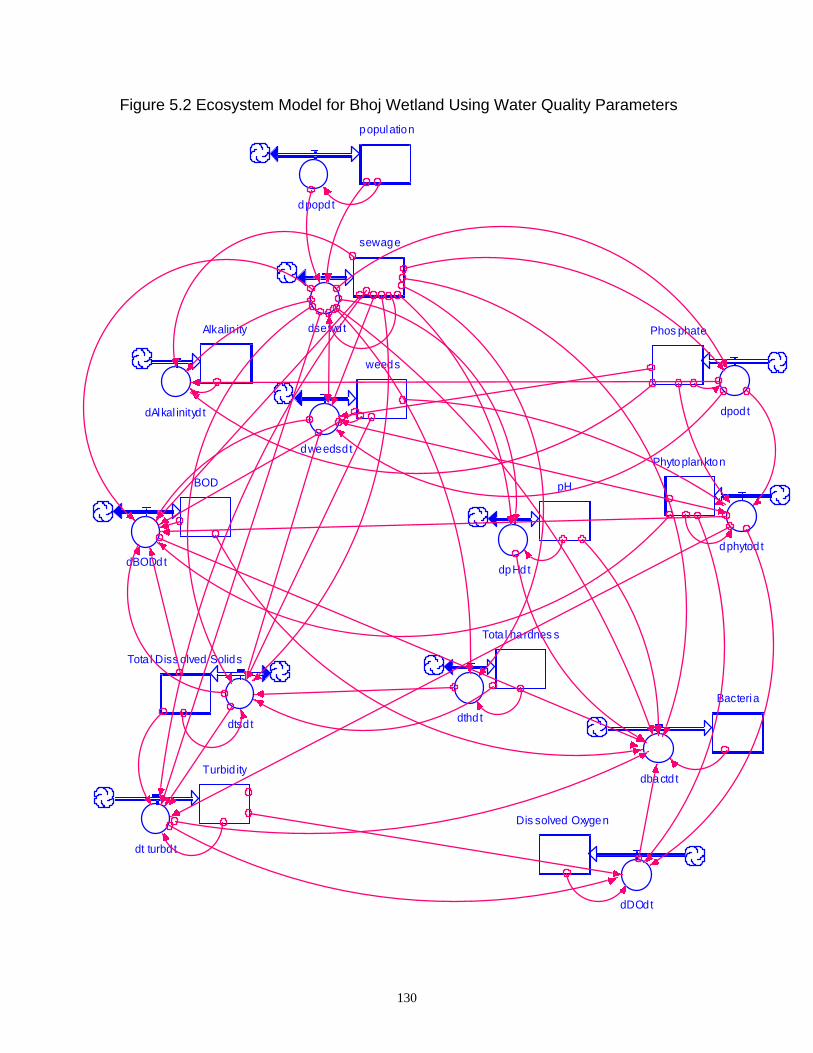
130
Figure 5.2 Ecosystem Model for Bhoj Wetland Using Water Quality Parameters
��������������������������������������������������
����
population
dpopdt
����������������������������������������������������������������������������
���������������������������������������������
������
sewage
dsewdt
�������������������������������������������������
���������������������������������������������������������������������
������
weeds
dweedsdt
������������������������������������������������������
����������������������������������������������
����
BOD
dBODdt
��������
���������������������������������������������������
����������������������������������������������������
��������
Bacteria
dbactd t
�������������������������������������������������������������������������������������
������������������������������������������������������������������������
������
pH
dpHdt
��������������������������������������
����
����
������������������������������������������������
���
Tota l Diss olved Solids
dtsdt
�����������������������������������������������
��
����������
��������������������������������������������������
����
Tota l hardnes s
dthdt
��������
��������������������������������������
����������������������������������������������
����
Alkalin ity
������������������������������������������������
������
Phytoplankton
dphytod t
�����������������������������������������������
dAlkal inityd t
����������������������������������������������������
�����
�����������������������������������������������������������������������
����
Turbid ity
dt turbdt
������������������������������������������������������������������������
����������������������������������������������
��������
Phos phate
dpodt
��������������������������������������������������������������������������
��������
����������������������������������������������������
��������
Dis solved Oxygen
dDOdt
�������������������������������������������������������������������������������������������������������������
�����
����
��������
��������
��������
��������
������������
��������
����
���������������������
�����
��������
�����
��������
��������
�����
��������
����
������
����
����
��������
�����
���
�����
��������
��������������
���
���������
��������
��������
��������
������������
��������
��������
�������� �����
�����
����
��������
����
�����
����������
����
����
���������������
��������
����������
��������
������������������
������������
��������
�����
������
��������
��������
����

131
To find out the impact of ongoing restoration activities, the basic model has been
simulated in two ways and the data of pre restoration stage and ongoing project
activities is used separately. The two models show the variance in their
stimulation out puts. Using the available data first model has been developed for
the pre restoration state for Upper Lake. In this model base year data of
year1985 is compared with the water quality data of year 1992.The post project
implementation model has been made separately for each lake. The basic
structure of the model for both the lakes is same with some variation in the
variables. The 1993 base year value of water quality data has taken here in the
case of Upper Lake and data of year 1991 is used for Lower Lake and both are
compared with 1999 data population data of the wards adjacent to each lake is
used taking 1991 census data and compared to the estimated population of year
2001. The ecology of lake may change after the completion of restoration
projects which are targeted to be completed by the year 2001.
The year 1999 data of ambient water for both lakes is calculated from the station
wise data collected from the monitoring sub project of Bhoj Wetland project. The
seasonal surface samples data of five sampling stations of Upper Lake and two
sampling stations of Lower Lake for four seasons is considered for calculating
the average value of water quality of year1999. As the Upper Lake is a large
water body having different catchment area land use shows variation in the
water quality in various stations. So it is necessary to take the maximum
diversified and distant stations to cover the total area of the lake. The stations
selected can give maximum variation of the water quality.
Lower Lake is small water body compared to the Upper Lake. Even though the
limnological conditions in the sampling stations selected are different. Two
sampling stations of distant locality and where maximum management activities
have been done are selected to calculate the average value for 1999.

132
CHAPTER VI : USE VALUES OF BHOJ WETLAND: PRODUCTION FUNCTION, CVM AND HEDONIC PRICING APPROACH
The Economic Valuation of the Bhoj Wetland encompasses all values that have been
currently extracted and have been calculated as part of this study. The values are
supposed to capture intrinsic values as well as the extrinsic ones. The various values
that have been calculated as per their methodology specified in the previous chapter,
are dealt herewith in details in this chapter. It is restated that the attempt has been only
to capture various actual / current use values through direct and indirect valuation
techniques and not to capture options and existence values. All actual use values so
calculated are not totalled to arrive at annual Total Economic Value (TEV) estimate as
there could be possibility of overlapping of such values specially in the case of the
stakeholder extracting multiple values from the wetland. Instead various use values as
well as the impacts are estimated stakeholder wise to reflect the economic importance
of the Bhoj Wetland.
There are several general principles involved in assessing the economic value of water
and the costs associated with its provision. First, an understanding of the costs involved
with the provision of water, both direct and indirect, is key. Second, from the use of
water, one can derive a value, which can be affected by the reliability of supply, and by
the quality of water. These costs and values may be determined either individually, or
by analysis of the whole system. Regardless, of the method of estimation, the ideal for
the sustainable use of water requires that the values and the costs should balance each
other; full cost must equal the sustainable value in use.

133
Fig 6. 1: General Principles for Cost of Water
Environmental Externalities
Full Cost = Sustainable Economic Externalities Full Value In Use
Economic Cost Opportunity Cost Capital Charges Full Supply
Cost O&M Cost
Source: Peter Rogers et al. (1997)
6.1 Valuing Direct Uses
Under this method it has been tried to value all the direct economic benefits of the lake
generated either by direct costing or market pricing or existing productivity stemming
out of the wetland. The various uses values and the techniques of valuation followed
are as under:
6.1.1. Valuation of drinking water supply
Full Supply Cost includes the costs associated with the supply of water to a consumer
and is composed of two separate items: Operation and Maintenance (O&M) Cost, and
Capital Charges, both of which should be evaluated at the full economic cost of inputs.
Since in this particular exercise only the cost of distribution of water in one particular
year is actually taken into consideration, the capital charges can be safely ignored.

134
There are altogether four agencies that obtain water from the Upper Lake for drinking
water. These are the Public Health and Engineering Department that provides water to
the people in the city, the Bharat Heavy Electricals Ltd. a large public sector concern,
the Military Engineering Services stationed at Bairagarh and Sultania Infantry Lines and
the Indian Railways. The latter three agencies pay annual charges to the Bhopal
Municipal Corporation for use of water from the Bhoj Wetland.
The annual rental and other recurring expenses of these agencies over water supply for
the year 1999-2000 are as follows:
I. Public Health & Engineering Department
Quantity of water drawn from the Lake 14.5 MGD Expenditure
i) Operation & Maintenance Costs Rs 27,00,000/- ii) Electricity charges Rs 3,31,00,000/- iii) Chemicals Rs 20,00,000/-
Total Expenditure Rs 5,89,00,000/- (Source: PHED Office)
II. Central Railways
Quantity of water drawn from the Lake 1.24 MGD Expenditure i) Chemicals Rs 7,07,940 ii) Water rate paid to BMC Rs 11,14,008 iii) Electricity charge Rs 25,31,064 iv) Operation & Maintenance Costs Rs 3,48,240 Total Expenditure Rs 43,53,012 (Source: AEN Office, Bhopal Division)
III. Bharat Heavy Electricals Ltd.
Quantity of water being used by BHEL 6.5 MGD Expenditure*
i) Chemicals for purification Rs 5,49,950 ii) Water rate paid to BMC Rs 1,00,00,000
iii) Electricity charges Rs 1,00,00,000 iv) Operation & Maintenance Costs Rs 16,75,000
Total Expenditure Rs 2,22,24,950 * Approximate figures

135
(Source: BHEL) IV. Military Cantonment Area
Quantity of water being used by the Cantonment 1.5 MGD i) Chemicals for purification Rs 20,00,000 ii) Water rate paid to BMC Rs 48,00,000 iii) Electricity charges Rs 24,00,000 iv) Operation & Maintenance Costs Rs 7,36,000
Total Expenditure Rs 99,36,000 (Source: CWE, MES, Bhopal)
Thus taking all these various agencies into account the total expenditure on drinking
water taken from the Upper Lake comes out to be Rs 9,54,13,962/- or US$ 2,120,310.
On the other hand the entire revenue that is collected from the city of Bhopal as water
tax charges are Rs 2,14,64,600/- or US$ 477,000 per annum. This tax includes the
amounts paid by all the commercial organisations and people of the city who might be
obtaining water from other sources. Thus, a large subsidy is being provided to the
people as far as drinking water is concerned. Now, as per the welfare measures that
every government fulfils as part of its administrative responsibilities, this is important to
a major extent. But when such a large gap exists between the actual expenditure and
the revenue generated, it makes sense to re-examine the priorities. The argument over
subsidies is never ending but when a subsidy leads to misuse, overuse and then
misuse of a system, it does become necessary to provide checks by the way of raising
tariffs if required. But the raising of tariffs should again be in lieu of the use systems
prevalent in the society. The tariffs for commercial organisations and establishments
and higher income groups can be raised substantially while that for the lower income
groups could be taxed at a comparatively lower rate. Introducing compulsory meter
connections might also raise the revenue being generated and also control use since
people would regulate the same if they were in fact paying for every drop that they use
as in the case of electricity.

136
6.1.2 Revenue generated by the MP Tourism Development Corporation (MPTDC) from recreational activities in the Upper and Lower lakes
A. Boating
As per the figures obtained for April 1999 to March 2000, 64,471 tourists came to the
lake and opted to boat using the boats of the MPTDC. A large number of tourists take
private boats and many more do not go boating but just enjoy themselves by the
lakeside. The figures for the various months are shown in Table No 6.1:
Table 6.1: Tourist Inflow to the Upper Lake and Revenue Generated by the MPTDC for the year April 1999 to May 2000.
Month Number of Tourists Revenue generated in
Rs April, 1999 NA 1,10,545* May, 1999 18,565* 1,98,480* September, 1999 2640 19,800
October, 1999 4224 31,680 January, 2000 5004 37,530
April, 2000 5528 41,460 May, 2000 8596# 64,470#
* Figures and revenue high because motor boats were running at that time.
# Figures high because of peak season again. Source: Boat club, MPTDC
The total revenue collected for the year April 1999 – March 2000, is thus Rs 6,74,635/-.
In comparison the expenditures are as follow:
i) Salaries Rs 3,84,000/- ii) Maintenance Rs 10,000/- iii) Electricity charges Rs 6,000/- Total Expenditure Rs 4,00,000/-
Thus the total profits are reduced to Rs. 3,10,635/- for the last year. The MPTDC owns
15 paddle boats which run in the upper lake.
137
On the other hand the Revenue collected from the Lower Lake is very nominal in
comparison. This is mainly because the lake is so dirty that people choose not to visit
there. Another major problem that is responsible for visitors not showing up is lack of
parking space at the park where boating activities are carried out. There are 4 paddle
boats and one motor boat operating under MPTDC there. The boating activities in this
Lake have begun only a few months back around April, 2000. The average revenue
being earned by them is around Rs 800/- in a week or approximately Rs 3,500/- in a
month. And this was only in the peak season. The collections can be expected to be
much lower during the off season. This revenue does not even meet the expenses of
the boat club but since it is being operated by the MPTDC, the losses are cheerfully
borne without much being done to improve things.
B. Cafetaria
The MPTDC also operates a cafeteria called the Winds & Waves on the Upper Lake
that has significant locational and aesthetic advantages. It also has an extension
counter right on the lake front near the boatclub. The annual expenditure and the
income for this enterprise of the MPTDC is as follows:
i) Annual income Rs 18,00,000/- ii) Salary Rs 4,20,000/- iii) Operational, Maintenance and Electricity Costs Rs 14,40,000/- iv) Bar License Rs 2,00,000/- Total Loss Rs 2,60,000/- (Source: Manager, Winds & Waves, MPTDC)
In spite of enjoying several benefits besides the locational and aesthetic advantages as
mentioned before like the presence of proper parking space, seating arrangements,
sunset view points, the establishment still runs in loss is a surprising fact and one that
needs to be taken with a pinch of salt. The place definitely has potential and with the
competition that it is facing from a new hotel that has come up - Hotel Ranjit Lake View,
it is in need of a thorough face-lift.

138
Thus the total revenue generated by the MPTDC from the Bhoj Wetland taking into
account the losses and non-performance of other sites, stands at Rs 76,695/-, a very
dismal sum indeed. A very high income generating source for the MPTDC especially
since it is the major attraction in the city is being simply wasted since proper utilisation
of its potential is not taking place. The MPTDC needs to either privatise its cafeteria and
introduce other attractions (see recommendations) in order to attract more customers
and thus get more profits.
6.1.3 Income Generation for Private Individuals
A number of people are existent upon the Bhoj Wetland for their daily livelihood. The
economic activities and cash transactions of these people have mainly been gathered
through talks with them. These can be listed as below:
A. Fishermen
There are some 450 odd fishermen families who earn their living through fishing in the
Upper Lake waters. These people usually employ gill nets to catch their fish and the
major fish species that are available are the major Indian carps like Catla catla, Labeo
rohita, Clarius sp, Cirrhimus mrigala, Ctenopharyngodon idella and Hypophthalmichthys
molitrix and so on. The catch though is extremely uncertain and on the average a
fisherman may get at least Rs 1500/- per month as his earnings from this activity.
Thus the annual total earnings of the entire fishermen community can be generalised as
Rs 81,00,000/-. The fishermen also pay an amount of Rs 1,00,000/- as annual lease
amount to the Bhopal Municipal Corporation. Thus the total earnings to the fishermen
can be put down as Rs 80,00,000/-.
B. Boatmen
There are a number of private boatmen who ply their boats in the Upper and the Lower
Lakes. Altogether there are 20 paddle and rowboats in the Upper Lake and 7 in the
Lower Lake. The average earnings from boating are as follow:

139
During season for Upper Lake Average income per boat during the week days Rs 500/- Average income per boat on Sunday Rs 1500/- Assuming the season to last from March to June, average income during the season for all the 20 boats Rs 14,40,000/- Off season for the Upper Lake Average income per boat on a week day Rs 150/- Average income per boat on Sunday Rs 500/- Assuming the off season to last from July to February, Average income during the season for all the 20 boats Rs 8,96,000/- During season for Lower Lake Average income for all 7 boats on a week day Rs 500/- Average income for all 7 boats on Sunday Rs 1500/- Assuming the season to last from March to June, average income during season Rs 72,000/- During Off season for the Lower Lake Average income for all boats on a week day Rs 200/- Average income for all boats on Sunday Rs 600/- Assuming off season to last from July to February, Average income for all the boats Rs 57,600/-
After paying of the boating license fee, we can assume that annual profits of Rs
1,01,880/- are being earned through boating activities in the Lower Lake.
Therefore adding the figures for the Upper Lake as well as the Lower Lake, boating
yields an annual income of Rs 24,37,880/- for private boatmen.
C. Trapa Cultivation
There are some 500 families involved in Trapa cultivation and according to the
cultivators each family gets around Rs 10,000/- on average per annum which comes as
a lump sum on the sale of the harvest usually in the month of September – October.

140
Therefore the total income generated through the cultivation and sale of trapa amounts
to Rs 50,00,000/-.
D. Washing of Clothes
According to a survey, there are estimated to be 314 Dhobi families settled along the
banks of the Lower Lake. Out of these 113 families are engaged in the profession
(SAPROF, 1994). As per the talks with various representatives of the Dhobi community,
it has been found that there are some 100 families at present, which carry out washing
of clothes in the Lower Lake. On an average these people earn some Rs 3000/- a
month. At this rate, the annual income generated from all washing activities in the Lower
Lake amounts to Rs 36,00,000/-.
E. Road side vendors
The average annual income of the various kinds of vendors is as follow:
a) Maize cob sellers
There are usually 10 vendors on weekdays and 20 on Sundays. The average income
on a weekday is around Rs 100/- per vendor and on Sunday it rises to around Rs300/-.
Taking these figures the total transactions on selling of maize cob for three months in a
year amounts to Rs 1,44,000/-.
b) Sugarcane juice
There are usually 8 vendors on weekdays and 15 on Sundays. The average income on
a weekday is around Rs 200/- per vendor and it rises Rs 500/- on Sunday. Assuming
these figures and that the sale of sugarcane juice occurs for four months in summer, the
total income generation amounts to Rs 2,73,600/-.
c) Snacks and cold drink stalls
There is usually 1 vendor during the off season time and 3 during the season on normal
weekdays and 3 during off-season on Sundays and 5 during the season. The average

141
income of these people is around Rs 100/- per weekday during the off season and Rs
250/- on Sundays and Rs 400/- per day during the season, and Rs 600/- on Sundays.
Since they are more or less permanent their annual income amounts to Rs 2,06,400/-.
d) Horse rides
There are altogether 10 horsemen who give horse and pony rides on the lake front.
Their incomes during the season range from Rs 300/- on a weekday to Rs 1000/- on
Sunday per horse and during the off season Rs 125/- on an average per weekday and
Rs 325/- on Sundays again on an average. With these figures, the horsemen earn an
amount of Rs 7,92,000/- per annum.
Thus the total income generation by private individuals through their economic activities
in the Upper and the Lower Lake amount to a total of Rs 2,04,53,880/-.
6.2 Cost of Illness Approach and Defensive Costs
With the increasingly deteriorating water quality, and the outbreak of various water
borne diseases in the city every year, the people are resorting to various defensive
measures such as use of purification devices such as Aquaguard and Zero B. On the
other hand if a person does fall ill on account of such a water borne disease, the
expense borne by him or her turns out to be a major cost. The number of days lost as
productive work days also adds to this cost of illness.
The number of cases of water borne diseases has been obtained from the Directorate
of Health Services, from the year 1995 to 1999. It can be observed from Table No. 6.2
that the cases of all the water borne diseases show a marked decline in recent times.
The reasons for this can be that this data is obtained only from government hospitals
and people all over are showing a trend of moving towards private practitioners in spite
of the fact that they might have to pay more, in order to get better services.

142
Table 6.2: Reported Cases of Water Borne Diseases in the Bhopal City YEAR GASTRO
ENTERITIS DIARRHOEA CHOLERA JAUNDICE TOTAL
1995 N.A*. N.A. N.A. 770 7391 1996 1068 9280 9 136 10493 1997 921 9461 5 168 10555 1998 986 7740 4 58 8788 1999 193 7170 3 58 7424
* Not Available Source: Directorate of Health Services It can be assumed based on a survey of local doctors that the estimated expenditure
on each of these diseases for a common person turns out to be something like:
1. Gastro-enteritis - Rs 250/- for a period of five days on average for a case of mild
intensity.
2. Rs 1500/- on average if the patient needs to be hospitalised.
3. Diarrhoea – Rs 250/- again and Rs 1500/- for hospitalisation
4. Cholera – Rs 3000/- for 3 to 4 days since it requires hospitalisation
5. Jaundice – For mild cases it requires medication for nearly 30 days. Causes
expenditure of nearly Rs 3000/-. If hospitalised for 6 – 8 days, the total
expenditure may go up to at least Rs 8000/-.
These figures only give a partial view since most people do not visit government
hospitals but private practitioners. Even the if we take the figures that have been
obtained and examine the cases reported only in 1999, it can be concluded that the
amount that people have spent only on medical care would amount to Rs 20,23,750/-
(Verma, Bakshi & Nair, 2000). Most of these patients would off course be kids but along
with them one of the parents would have to take time off from work. Assuming daily
wage rates of Bhopal city for one adult for each of the patients and multiplying with the
days off from work as 2 for gastro-enteritis and diarrhoea and 5 for cholera and 10 for
jaundice, the cost of man days lost in 1999 would amount to Rs 6,89,310/-. Now this
figure is only for the cases that are reported in government hospitals. The actual amount

143
would be much higher but this at least provides a starting figure. Thus the total losses
on account of water borne illness would amount to Rs 26,67,232/-.
This figure pertains to the entire city of Bhopal but if we make an approximate estimate
for such cases reported from 45% people dependent on water supply from upper lake,
the cost needs to be reduced to 45% of the total (though it is highly underestimated
figure) it would come to Rs. 12,00,254/- only as cost of treatment for water borne
diseases for people using lakes water.
As a result of the high risk of such diseases and the large number of cases of water
borne diseases every year (reported cases are definitely lesser than the actual number
of cases), many people use preventive measures such as home water filtration devices,
Hepatitis B vaccinations and so on. The total number of water purifiers purchased in the
last few years and the costs incurred in their installation are as given in Table No. 6.3:
Table 6.3: Costs incurred in household water purification techniques Year 1995 – 96 1996 - 97 1997-98 1998 - 99 1999 – 2000 Units of ‘Aquaguard’ Units of Zero B
807 10000
1495 13000
1511 12000
2050 20000
2592 30000
Total Cost in Rs
4591830 2800000
8506550 4355000
9201990 4740000
12484500 7900000
15785280 11850000
Adjusted costs
6428562 4099480
18714410 5796505
11042388 5735400
13732950 8690000
15785280 11850000
Total costs 10528042 24510915 16777788 22422950 27635280 Source: Eureka Forbes Ltd., Bhopal Office and Ion Exchange Office, Bhopal
The total purification costs incurred by the people from the year 1995 (April) to 2000
(April), therefore amount to a total of Rs 10,18,74,975 (US$ 2,263,888). Taking the
total number of households in Bhopal as 2,87,183, the cost of water purification per
household comes out to be Rs 355 (US$ 8) in the last five years.
Now, both the water borne diseases as well as the water purification measures costs
cannot be attributed to only the water coming from the Bhoj Wetland. Many of these
households may be getting water from other sources and not from the Bhoj Wetland.
Unfortunately, separate data is not available for this. This cost incurred by the people

144
actually reflects the social cost or what people would actually be willing to spend on
clean and pure drinking water. If the Bhoj Wetland or the other sources of water
provided water that was pure and fully safe for drinking this cost could have been
avoided. But since the people are dissatisfied with the water quality they spend so much
on improving the kind of water they get or on their health. Like the previous case if we
again take the 45% of the total purification cost incurred by the individuals to reflect for
the population dependent upon water supply from the upper lake, it would come to Rs.
1,24,35876/- which is the economic value of the Bhoj Wetland as a reflection of what
people would be willing to pay in order to obtain pure drinking water.
6.3 Contingent Valuation Method
The CVM has been discussed in great detail in the Status paper preceding this report
and the sampling design and all have been discussed in the methodology section. In
this section, the questionnaire and analysis of the CVM results obtained has been
presented.
6.3.1. The Questionnaire
The project team developed the questionnaire after exhaustive literature review. It was
then sent to various experts at different Universities in the United States and United
Kingdom, to obtain their comments, criticisms and review. Changes were made
accordingly in the questionnaire and then an Experts’ Meeting was called at Delhi
where persons who had previously worked in the field of contingent valuation were
called and their comments on the questionnaire contents were invited. Finally, the draft
questionnaire was finalised and a pre test for the same was carried out. On the basis of
the results of the pre test the draft was modified to obtain the final version of the
questionnaire. The format of the questionnaire was as follows:
Attitudinal Questions: The first section aimed at making the interviewee comfortable by
asking some questions regarding their view and opinion on various problems plaguing
the country. Then these questions were followed by a few, which were aimed at
obtaining information regarding the water supply to their homes. Next came questions

145
aimed at finding out whether the people were aware of the various problems that pose a
threat to the Lake.
Scenario Building: In the second section information was given to the people about the
proposed Bhoj Wetland Management Society, and their action plans and created the
scenario before the people, by telling them about the benefits that they would be getting
from the activities of this Society. They were told about the increased recreational
benefits and aesthetic beauty and this was to be the basis of their valuation of these
benefits. They were shown photographs of the lakes from different angles showing the
dirt in the lakes and the view from a distance where the Lakes seemed very beautiful
and clean. Besides, they were shown charts showing the structure of the Society and its
role (attached in Annexures V a &V b).
Valuation: After the pre-test, two types of payment vehicles were considered. One of
these was a voluntary payment to the body which would take up the management of the
Bhoj Wetland in the future and which has been called the Bhoj Wetland Maintenance
Society and the people making voluntary contributions would get privilege membership
of the society to enjoy various benefits from Bhoj wetland on nominal tickets. The
second payment vehicle was a compulsory tax imposed upon the people of the city and
the collections of which would go to this maintenance Society and people will not get
any privilege membership to the society. An open-ended bidding game was used and
the respondents were asked a follow-up question to their initial non-zero bid, which was
a close-ended question. This was followed by a question that mentioned the finite
income that they had and if they wanted to change the initial figure given by them. The
above question sequence was based on a study carried out by the Institute of Economic
Growth, on “Measuring Non-User Benefits from Cleaning Ganges. The logic that the
authors (James and Murthy, 1997) provide that although there is a debate currently in
the literature about the use of open-ended bidding or close-ended bidding process,
there seems to be insufficient cause for rejecting the former in favour of the latter. This
questionnaire format tried to avoid the range biases by adding two follow up questions
to the initial open-ended question, the first of which was a close-ended question based
on the answer to the initial open-ended question asked.

146
Table 6.4: Bidding Format of the CVM Questionnaire Initial Question Initial Follow-up Questions (Open-ended with (Non-Zero) Question 1 Question 2 a variant of the Response Range (Close-ended but (Open-ended) payment card) based on the initial response) “How much money Since you are probably would you and your doing such a valuation family pay voluntarily, exercise for the first time, every year, to enjoy the ……” improved recreational would you pay Rs and aesthetic benefits 300 of the Bhoj Wetland?” Rs 0 – Rs 250 750 Rs 251 – Rs 500 1500 Rs 501 – Rs 1000 3000 Rs 1001 – Rs 2000 5000 More than Rs 2000 per year on behalf of yourself
and your family, in order to enjoy an improved Bhoj Wetland?
“You have a limited income and in that case do you think that it will be possible for you to pay the amount that you have stated. If you want you can still adjust the amount”
Source: Adapted from James and Murthy, 1997 In the questionnaire a table detailing the amount to be asked in the first follow-up
question, based on the amount offered as the initial bid, was included as was done in
the James and Murthy study mentioned above. This was followed by a question that
gave the people a chance to adjust the figures quoted by them considering that their
income was finite and not unlimited. The bidding format used was as given in Table No.
6.4 above.
The fourth section dealt with the socio- economic details of the persons interviewed.
These variables were used in the regression estimation of the valuation function.
Information was collected on education level, occupation, number of adult members and
children in the house and gross annual income from all sources.

147
The next section was the respondent’s evaluation whereby a few questions were asked
to them regarding the evaluation of the respondent’s way of asking the questions and
the clarity and their conviction in the valuation technique. Questionnaires that reflected
low level of answering were screened out.
The last section was the enumerator’s evaluation and declaration. In this section, the
enumerator was supposed to answer two questions dealing with their opinion about the
respondent’s understanding and attitude while answering the questions. Questionnaires
where the enumerators mentioned lack of understanding or a non-serious attitude were
eliminated from the analysis. The declaration was included to instil responsibility in the
enumerators about carrying out the survey honestly and elicit accurate responses from
the respondents.
6.3.2 Estimation results
The total number of filled questionnaires obtained at the end of the survey numbered
1497. Then the questionnaires were screened to eliminate incompletely filled ones and
also the respondents evaluation of the enumerators was not good or where they
showed a lack of conviction in improvements that were mentioned as part of the
scenario and also where the enumerators mentioned lack of understanding or
seriousness on part of the respondents. Ultimately, the number of questionnaires was
reduced to 804. Nearly 46 per cent of the samples were dropped during the screening
process. This was done mainly to maintain the accuracy of the sample.
Econometric Model
Two regression equations were estimated for the model one for each of the two
payment vehicles used in the survey. In the first equation the dependent variable is thus
the Willingness-to-pay voluntarily FINVOL, for improved recreational and aesthetic
benefits from the Bhoj Wetland. In the second equation, the dependent variable is the
Willingness-to-pay in the form of a tax, FINTAX, for the same benefits. Both of these are
then regressed on a vector of socio-economic variables such as income and education
level, as well as a number of dummy variables.

148
General form of the equations:
1. FINVOL = f (CONSTANT, INCOME, EDULEVEL, DISTANCE, MINMEM, ADMEM, LNTRES, FREQVISIT, POLL) where, FINVOL = the voluntary WTP INCOME = the annual income of the entire family EDULEVEL = the education level of the person interviewed
DISTANCE = the distance at which the house of the person interviewed is situated from the lakes.
MINMEM = number of minor members in the family ADMEM = number of adult members in the family LNTRES = Length of residence FREQVISIT = frequency of visit to the lakes POLL = ranking of pollution as a threat to the country
2. TAXWTP = f (CONSTANT, INCOME, EDULEVEL, DISTANCE, MINMEM, ADMEM, LNTRES, FREQVISIT, POLL,)
The logarithm linear form of the equation LOGFINVOL = α + α1 LOGINCOME + β1DISTANCE + β2LNTRES + β3EDULEVEL + β4MINMEM + β5ADMEM + β6FREQVISIT + β7POLL The estimated results of these equations are as follows:
Table 6.5 Value of variables in the Equations Dependent Variable = LOGFINVOL Number of Observations = 803 R Squared = 0.116 Adjusted R squared = 0.106 F = 11.357 Statistical package used = SPSS 10.0 Variable Coefficient t-statistic
CONSTANT 0.116 0.403 LOGINCOME 0.483 9.104 DISTANCE -.01392 -1.003 LNTRES -0.009542 0.447 EDULEVEL -0.009542 -0.705 MINMEM 0.04461 1.497 ADMEM -0.02197 -0.774 FREQVISIT -0.02197 -0.1658 POLL 0.00825 0.376

149
Dependent Variable = LOGFINTAX Number of Observations = 803 R Squared = .112 Adjusted R squared = .085 F = 4.213 Statistical package used = SPSS 10.0 Variable Coefficient t-statistic
CONSTANT -0.01357 -0.031 LOGINCOME 0.454 5.285 DISTANCE -.01049 -0.188 LNTRES -0.03942 -0.483 EDULEVEL -0.08224 -1.199 MINMEM 0.08108 0.966 ADMEM 0.162 2.904 FREQVISIT 0.09281 1.706 POLL 0.04773 -0.031
Estimates of the Mean Willingness to Pay
As mentioned before the sample size for which the analysis was carried out is 804. The
sample median and mean are given in Table 6.6
Table 6.6 Mean Willingness to Pay Voluntarily and In the Form of Tax
FINVOL FINTAX Mean 537.85 219.17 Median 241.00 29.50
A large difference in the mean and median values is observed. The sample median is
usually used to provide a measure of central tendency in cases like these where the
sample is highly skewed to the left owing to extraordinarily high outliers.
The influence of various factors on the mean willingness to pay has been studied as per
the following heads:
Income:
Income has a significant correlation with both the voluntary WTP as well as the Taxation
WTP. It is found on observation that with rising incomes the average means also go on
increasing as is evident from Table 6.7 below:

150
0100200300400500600700800
2500
050
000
1000
00
2000
00
3000
00
5000
00
Income in RsW
TP in
Rs
Table 6.7 WTP As Per Income INCOME FINVOL FINTAX 25000 Mean 202.01 75.00 N 128 128 Median 100.00 .00 50000 Mean 370.91 143.11 N 217 217 Median 200.00 20.00 100000 Mean 529.15 229.66 N 215 215 Median 250.00 50.00 200000 Mean 792.55 325.76 N 165 165 Median 300.00 60.00 300000 Mean 941.54 351.35 N 52 52 Median 300.00 110.00 500000 Mean 1232.69 536.15 N 26 26 Median 675.00 150.00 Total Mean 537.85 219.17 N 803 803 Median 240 30
Graph 6.1 WTP As Per Income Length of Residence: Length of residence has been divided into the following categories –
Less than 1 year - 1 1-5 years - 2 5 – 10 years - 3 10 – 20 years - 4 more than 20 years - 5
The correlation for this factor with the voluntary WTP and the WTP as tax is not
significant. On the other hand the means are as in Table No. 6.7:

151
Table 6.8 WTP As Per the Length of Residence
LNTRES
FIN VOL
FINTAX
1 Mean 454.17 236.67 N 12 12 Median 195.00 145.00 2 Mean 433.94 175.53 N 47 47 Median 150.00 50.00 3 Mean 426.10 218.54 N 41 41 Median 250.00 50.00 4 Mean 708.52 277.10 N 105 105 Median 250.00 100.00 5 Mean 525.39 212.39 N 597 597 Median 240.00 20.00 Total Mean 537.85 219.17 N 803 803 Median 240.00 30.00
Graph 6.2 WTP As per the Length of Residence
From the above table it can be seen that the average mean shows a decrease in the
voluntary WTP with increase in the stay of residence in the city initially. The maximum
WTP is for people who have stayed in the city for 10 – 20 years. Then the mean begins
to fall again. It is least for people who have lived in the city for around 5 to 10 years. For
the WTP as tax, it is least for people who have lived in the city for between 1 year to 5
years. On the other it is maximum for people who have stayed in the city for 10 – 20
years.
Frequency of visits: This factor has also been divided into categories such as given here –
Every week - 1 Once in a fortnight - 2 Once in a month - 3 Once in two - six months - 4 Once in seven - twelve months - 5 Not at all - 0
0
50
100
150
200
250
300
1 2 3 4 5Length of Residence
WTP
in R
s.
VOLFINTAX

152
The correlation for this factor with the mean WTPs is once again not significant. The mean
figures for the various time intervals of visits are given in Table No. 6.9:
Table No. 6.9: WTP As Per the Frequency of Visits
FREQUENCY OF VISIT
FINVOL FINTAX
0 Mean 430.28 179.31 N 36 36 Median 100.00 10.00 1 Mean 731.76 295.40 N 176 176 Median 300.00 50.00 2 Mean 438.13 174.98 N 87 87 Median 250.00 10.00 3 Mean 487.70 178.30 N 171 171 Median 240.00 20.00 4 Mean 457.28 206.57 N 187 187 Median 200.00 50.00 5 Mean 561.31 231.36 N 143 143 Median 150.00 50.00 6 Mean 110.00 60.00 N 2 2 Median 110.00 60.00 Total Mean 538.39 219.44 N 802 802 Median 240.00 30
From the above table it is obvious that the maximum willingness to pay is shown for
people who visit the lakes most frequently. On the other hand the WTP for people who
have never visited the lakes for recreational purposes is till quite high. But it is the
lowest for people who rarely visit the lakes.
Concern of the people about pollution: The aim of this analysis is to find out whether people who show high concern for
pollution as a major problem faced by India today are willing to pay significantly higher
amounts or not. The results are very typical of the way people quote things and actually
behave. The categories for this particular were divided on a scale of 5 where 1 showed
the maximum concern for environment as a major problem for the country and 5 the
050
100150200250300350
0 1 2 3 4 5 6
Frequency of Visit
WTP
in R
s.
FINVOL FINTAX
Graph 6.3 WTP as per Frequency of Visit

153
least concern. The values of the mean WTPs for these concern levels are as in Table
No. 6.10:
Table No 6.10: WTP As Per Concern of the People about Pollution as a Problem Poll FINVOL FINTAX 1 Mean 599.35 222.87 N 412 412 Median 250.00 20.00 2 Mean 411.05 164.31 N 245 245 Median 200.00 50.00 3 Mean 553.14 315.86 N 105 105 Median 300.00 20.00 4 Mean 785.81 310.97 N 31 31 Median 300.00 120.00 5 Mean 181.00 111.00 N 10 10 Median 100.00 .00 Total Mean 537.85 219.17 N 803 803 Median 240.00 30.00
Strangely enough, people who rank environmental pollution as only somewhat
important for the country, are WTP the largest amount as voluntary payment. On the
other hand as expected, the mean WTP both as voluntary payments and tax is least for
people who do not consider environmental pollution of any importance for the country
today.
Education level: Education level of the people shows a significant enough correlation with both the WTP
amounts. In other words with increase in education standards people are willing to
spend more money on intangible benefits from the Lakes. The education level has been
clubbed into the following categories:
Illiterate - 0 Below Class XII - 1 Upto Class XII - 2

154
Undergraduate (B.A./ B.Com/B.Sc) - 3 Postgraduate (M.A. / M. Com / M.Sc.) - 4 Professional Qualifications ( B.E. / B. Tech. / M.B.A. / M.B.B.S.) - 5 Other - 6
The mean WTPs for the various education levels are as in Table No. 6.11:
Table No. 6.11: WTP As Per The Education Level Of The People EDUCATION LEVEL
FINVOL FINTAX
0 Mean 262.60 77.40 N 25 25 Median 200.00 .00 1 Mean 347.54 143.50 N 259 259 Median 120 .00 2 Mean 463.29 253.36 N 70 70 Median 240.00 100.00 3 Mean 560.67 187.74 N 198 198 Median 250 39.00 4 Mean 730.57 329.29 N 143 143 Median 300.00 60 5 Mean 912.56 356.52 N 82 82 Median 300.00 100.00 6 Mean 483.46 217.69 N 26 26 Median 250.00 100.00 Total Mean 537.85 219.17 N 803 803 Median 240.00 30
As can be seen from the Table the mean voluntary WTP increases with increase in
education levels and is maximum for people who have a post graduate degree. The
same is the case for the WTP as tax. This is to be expected as a higher education level
can be assumed to lead to better understanding and concern for the system and then
again a strong correlation between income and education also exists meaning that the
better educated a person the more will be his income as is to be expected.
050
100150200250300350
0 1 2 3 4 5 6Education level
WTP
in R
s.
FINVOL FINTAX
Graph 6.4 WTP as per the Education Level

155
Occupation: The various occupation categories have been divided as per the following:
Private Sector Employee - 1 Government Employee - 2 Self Employed - 3 Other - 4 The various mean WTPs for these categories of occupation are as shown in Table No.
6.12:
Table No 6.12: WTP As Per the Occupation of the People OCCUPATION
FINVOL FINTAX
1 Mean 492.46 255.86 N 124 124 Median 300.00 50.00 2 Mean 470.09 170.72 N 292 292 Median 125.00 10.00 3 Mean 596.06 232.91 N 339 339 Median 250.00 50.00 4 Mean 656.15 322.08 N 48 48 Median 150.00 60.00 Total Mean 537.85 219.17 N 803 803 Median 240.00 30.00
The highest WTP as both voluntary and tax are for category 4 where we have people
who are working as contractors or are still students and not employed. This means that
with high income as in the case of contractors, the WTP is high and students who are
still not independent are again WTP higher amounts than people with responsibilities
are. The people who are WTP least both voluntarily and as tax are not surprisingly
government employees! This says quite a lot for the attitude of these people who
already feel loaded with the tax structure existing in the state and their reluctance to
contribute because of these reasons.
Distance: The distance at which people stay from the lake has also been expressed in the
following manner:
0
50
100
150
200
250
300
350
Private Sector Government Self Other
Occupation
Paym
ent i
n R
s.
Voluntary Tax
Graph 6.5 WTP as per Occupation

156
Within a half mile radius - 1 Between 0.5 – 1 mile - 2 Between 1 – 1.5 mile - 3 Between 1.5 – 2 mile - 4 More than 2 miles - 5
The mean values of WTPs for these distance ranges are as shown in Table No. 6.13:
Table No. 6.13: WTP According To Distance from the Lakes DISTANCE FINVOL FINTAX 1 Mean 633.39 277.17 N 166 166 Median 250.00 15.00 2 Mean 467.35 190.51 N 164 164 Median 200.00 50.00 3 Mean 523.66 272.39 N 134 134 Median 300.00 80.00 4 Mean 655.98 261.11 N 119 119 Median 300.00 50.00 5 Mean 463.06 141.66 N 220 220 Median 140.00 10.00 Total Mean 537.85 219.17 N 803 803 Median 240.00 30.00
The mean WTP as voluntary payment is strangely highest for people who stay within a
1.5 to 2 mile radius of the Upper and the Lower Lakes but then again it is also
significantly high for the people who stay very near the Lakes giving credence to the
hypothesis that people staying near the lakes should have a higher regard for their
value as compared to people who stay some distance away.
These then were the various sub analyses done for the entire city based on the most
important socio-economic, attitudinal and geographical parameters.
0
50
100
150
200
250
300
350
1 2 3 4 5Distance
WTP
in R
s.
FINVOL FINTAX
Graph 6.6 WTP according to Distance

157
Extrapolating the mean WTP for the entire city: Since there is a large difference in the mean and median difference owing to the
skewness shown by the sample, for a better representation of the estimated WTP, the
median value for both voluntary WTP and the WTP as tax, is taken. Altogether there are
2,01,116 households in the city. Considering that the median voluntary WTP to be taken
is Rs 241/- and the median WTP to
be paid as tax is Rs 29.50/-, the estimated WTP for the city is calculated and presented
in Table No. 6.14:
Table No. 6.14: Estimated WTP for Entire City Median FINVOL per household per annum = Rs 241.00/-
Total Voluntary WTP per annum = Rs 4,84,68,956/-
Median FINTAX per household per annum = Rs 29.50/-
Total Number of households in City = 2,01,116
Total WTP as tax per annum = Rs 59,32,922/-
There were a number of other very important observations that were made during the
course of the survey. These are as follow:
People were asked to rank various problems facing the country as perceived by them.
Table No. 6.14 contains the results obtained for the same:

158
Table No. 6.15: Ranking of Problems Facing the Country Rank 1 Rank 2 Rank 3 Rank 4 Rank 5 Total Problems
No. % No. % No. % No. % No. %
Corruption 592 74 121 15.13 61 7.63 15 1.88 11 1.38 800
Foreign infiltration 375 46.76 220 27.43 133
16.58 54 6.73 20 2.40 802
Pollution / Environmental degradation
412 51.31 245 30.51 105
13.08 31 3.86 10 1.25 803
Lack of a stable government
342 42.59 204 25.41 156
19.43 62 7.69 39 4.86 803
Economic Issues 400 49.14 213 26.53 136
16.94 34 4.23 20 2.49 803
Thus it can be seen that most of the people give maximum weightage to corruption as a
national problem followed by environmental pollution and economic issues and so on.
On the other hand a very small percentage of the people interviewed claimed pollution
or environmental degradation as the least important problem.
Among all these environmental problems the various problems were ranked as given in
Table No. 6.16: Table No. 6.16: Ranking Of Various Environmental Problems
Rank 1 Rank 2 Rank 3 Rank 4 Rank 5 Total
No % No % No % No % No %
Deforestation
501 62.4 186 23.2 80 10.0 28 3.5 8 1.0 803
Urban waste
421 52.4 231 28.8 118 14.7 23 2.9 9 1.1 802
Noise Pollution
167 20.8 220 27.4 298 37.1 87 10.8 31 3.9 803
Vehicular Pollution
289 36.0 246 30.6 196 24.4 54 6.7 18 2.2 803
Industrial Pollution
244 30.4 238 29.6 174 21.7 115 14.3 32 4.0 803

159
80%
18%1%
1%
1 2
3 4
8 .4 7 %5 .6 0 %
2 0 .6 7 %
9 .5 9 %4 .6 1 %
5 0 .1 3 %
123456
As per the people of the city who were interviewed, the biggest environmental threat in
the country is deforestation followed by urban waste and vehicular pollution. Noise
pollution is not considered to be as important a problem by the major portion of the
population.
Most of the city’s population obtains its drinking water from the Municipal Supply. The
percentage of the sample obtaining its drinking water supply from various sources are
as shown in the graph here.
Graph 6.7 Drinking Water Sources in Bhopal City
The legends stand for the following:
1 – Municipal Supply
2 - Tube Wells
3 - Tankers
4 – Dug wells
Thus 80 per cent of the sample interviewed obtained their drinking water from the
municipal supply, 18 per cent from tube wells, and one per cent each from tankers and
dug wells.
The water purification techniques used by the people were also studied. The results of
this are presented in the Graph 8. The legends shown therein stand for the following:
Graph 6.8 Water purification Techniques followed in Bhopal City
1 – Aquaguard
2 – Zero B
3 – Ordinary Filter
4 – Chlorine / Alum
5 – Boiling
6 – None

160
17.66%
23.26%21.27%
10.95%
21.89%
4.60%
0.00%5.00%10.00%15.00%20.00%25.00%
1 2 3 4 5 6
Thus nearly 51 percent of the population does not use any water purification measures,
while nearly 21 percent use ordinary filters and only 8.5 per cent use Aquaguards and
5.6 per cent use Zero B.
The people were also asked to rank a few services that are obtained from the Bhoj
wetland as per their attitude. The results obtained were as given in Table No. 6.17:
Table No. 6.17: Ranking Of Various Services Obtained From The Bhoj Wetland Services Rank 1 (%) Rank 2 (%) Rank 3 (%) Rank 4 (%) Rank 5 (%)
Drinking Water
82.0 8.6 5.3 2.5 1.6
Stability of Microclimate
30.8 35.0 23.5 6.8 3.9
Employment 25.7 21.8 28.4 16.8 7.3
Recreation 37.6 26.7 23.3 8.6 3.9
From the Table it is evident that the maximum number of people consider drinking water
to be the most important service obtained from the Bhoj Wetland. The next highly rated
service was recreation, followed by stability of microclimate and employment was rated
last, showing that fewer people found it important as compared to the other services.
The percentage of people and the frequency with which they visit the lakes was also calculated. The observations are
shown in Graph 9: Graph 6.9
Frequency of Visits to the
Upper and Lower Lakes
X Axis: Frequency of visits 1 – Not at all
2 – Every week
3 – Once in a fortnight
4 – Once in a month
5 – Once in six months
6 – Once in a year Y-Axis: Percentage of people visiting the lakes

161
From Graph 9 it is evident that nearly 41 percent of the population visits the lakes quite
infrequently, from once in six months to once in a year. Quite a significant number visit it
every week even though they might be living at quite a distance from the lakes.
There are a number of problems that plague the Lakes and threaten its very existence.
The attitudes of the people and their opinions about the effects of these threats was
also studied. These are presented in Table No. 6.18:

162
Table No. 6.18: Ranking Of Various Threats To The Bhoj Wetland Threats Rank 1
(%) Rank 2 (%)
Rank 3 (%)
Rank 4 (%)
Rank 5 (%)
Siltation 40.8 24.6 20.4 7.8 6.3
Solid Waste 63.9 24.4 9.0 1.6 1.1
Sewage 77.9 14.4 5.2 1.9 .6
Washermen 35.6 29.4 20.5 8.8 5.7
Trapa cultivation 15.2 19.9 23.8 16.9 24.1
Encroachment 43.7 23.1 19.0 8.2 6.0
Increasing population 47.4 19.8 13.4 9.8 9.6
Weeds & Eutrophication
44.2 25.9 17.7 6.5 5.8
Boating 6.0 9.0 14.8 13.3 57.0
Agricultural Waste 13.8 17.4 22.5 17.3 28.9
Idol Immersion 44.7 22.9 13.1 8.0 11.4
Hospital Waste 82.6 9.2 4.2 1.9 2.1
From Table No. 6.18, it can be seen that according to the people, the most important
threats to the Lakes are from hospital waste, sewage and solid waste, while the least
threat perceptions are for boating activities, cultivation of trapa and agricultural wastes
that flow into the Wetland.
Most people in the valuation exercise quoted sums that can be considered to be
underpayments and as much has been admitted by the people themselves. This is
mainly because imagining such a scenario as created, for the people is tough. On the
other hand, most people were sceptical about the role of government when involved in
the management body. They were willing to pay more but only once the body came into
being and had proved itself capable of working efficiently and smoothly.

163
6.4. Hedonic Pricing
This is the last valuation exercise that has been carried out in this study through which it
has been attempted to calculate by what proportion closeness to the Upper Lake affects
property prices. This was studied in two steps. In the first step attitudes of the people
were studied as to what importance they give to particular factors while buying a piece
of property. In the second step some property prices in particular areas in the city were
obtained and then these areas were ranked against parameters of neighbourhood,
proximity to markets, ease of access, environment, housing density and presence and
absence of lake. A regression model was created for this equation and from that the
effect of presence of lake on property prices was gauged.
For the first step, the opinion of the people regarding the following 15 parameters was
calculated using Multi Criteria Analysis and the DEFINITE software. As mentioned
earlier that the Multi Criteria Analysis is a non-monetary evaluation method which tries
to capture value of goods and services or factors through ordinal ranking method in the
absence of market. Values attached to different factors of property by the buyers are
analysed using MCA to arrive at appraisal scores attributed to different aspects of value.
The various appraisal scores obtained thus are expressed in the Table No. 6.19:
The table shows that in the preference of various factors considered by the prospective
buyers while buying a new property, existence of lake receive low preference whereas
availability of drinking water, safety, existence of school for children, nature of property
itself are the major determining factors. The reason for low preference for location near
or in front of lake is due to the fact that not many new properties are under construction
as such due to lack of availability of vacant land. But the property prices of existing
houses fetch high premium when they are resold. This factor is duly explained in the
next step.

164
Table No. 6.19: Ranking Of Various Factors Considered while Buying Property
S. No: Factor Scores
1. Drinking Water 0.99 2. Safety 0.94
3. School Quality of Construction Hospital
0.88 0.87 0.87
6. Age of House 0.85 7. Park
Market Air Pollution
0.80 0.79 0.79
10. Work Place 0.77 11. Density
Noise Pollution 0.70 0.70
13. Lake 0.67 14. Household Help 0.56 15. Road 0.31

165
The second step involved the formation of a regression equation to express the various
factors affecting the price of property in the city. The various factors taken into
consideration for this purpose are:
1. Neighbourhood – All the sites taken into consideration in the study were ranked on
a scale of 1 to 5 for this parameter where 1 stood for the best neighbourhood and 5
for the worst. A good neighbourhood meant a higher-class posh locality with all civic
amenities while a bad neighbourhood signified an unsafe, area with poor facilities
available.
2. Market – This parameter was again ranked on a scale of 1 to 5 where rank 1 was
given when a site was very close to a good market and rank 5 was given when the
place was far away from a good market.
3. Access – This signified the ease of accessibility for each site. When the area was
close to the centre of the city it was given a rank 1 but when it was far away from the
heart of the city it was given a lower rank.
4. Lake – The Lakes were treated as a dummy variable. When a site had the lake in
close vicinity, it was given a rank of 1 and when the lake was no where near the lake
it was given a rank of 2.
5. Environment – This factor meant a congenial, pleasant atmosphere in the locality
where the site was situated taking into account the presence of sanitary conditions,
cleanliness, parks and ample open spaces. Sites where all of these were present
were ranked at 1 and the others were given lower rank as per the conditions present
there.
6. Housing Density – This factor referred to the number of houses in a particular
location and how crowded a particular area was. Very dense areas and similarly
extremely isolated areas were equally given low ranks while optimally populated
areas were ranked at 1.

166
The regression equation was formed taking all these factors into consideration. Thus
the equation formed for this was expressed as:
P = f (constant, neighbourhood, market, access, lake, environment, housing density)
where P = property price in Rs/sq ft and the other factors as described above.
The equation was thus of the form:
P = α + β1NEIGHBOURHOOD + β2MARKET + β3ACCESS + β4LAKE +
β5ENVIRONMENT +β6HOUSING DENSITY.
The estimation results came out as in Table 6.20:
Table No. 6.20: Estimation Results of Hedonic Pricing
Dependent Variable = Price in Rs/sq.ft Number of Observations = 27 R squared = 0.781 Package Used = SPSS 10.0 Variable Coefficient t - statistic
CONSTANT -607.596 -3.883
NEIGHBOURHOOD 282.739 4.591
MARKET -112.570 -1.661
ACCESS 101.902 1.575
LAKE 185.896 2.518
ENVIRONMENT 111.047 2.097
HOUSING DENSITY -67.203 -1.379
From the above table, it is found that all of the coefficients taken in the equation are
significant as per the tests run on them. For establishing the relationship between price
in Rs/sq.ft and presence of the lake a partial correlation test was run and the value of
this came out to be 0.495, adjusting for all the other parameters. Thus it can be said that
for a property site near the lakes the difference in property price would nearly be 50%.

167
That is a site similar in all other respects to a site away from the lakes would be
exceeding the latter property by nearly 50 per cent in price.
Concluding Remarks: Multiple Values from Bhoj Wetland to Multiple Stakeholders
Different kinds of values accrue from the Bhoj Wetland to different stakeholders living
around as well as away from the lake. The values so estimated using various valuation
techniques are summarised in Table 6.21.
It could be seen that supply cost which is mainly incurred by the authorities to provide
water to nearly half of the city’s population is considerably high. Whereas the charge
collected against it is low. Considerable income is also earned by individuals engaged in
various economic activities like harvest of fish, trapa, boating and others. The
environmental health of the Bhoj Wetland gets duly reflected in prevalence of water
borne diseases. Water purification cost incurred by individuals is a reflection of people’s
willingness to pay for obtaining pure water. Lake front property owners do get a benefit
of prevalent premium on their properties for this location. 50% of the price differential
exist due to this factor. So far as preference of people for buying new property is
concerned the factor of existence of lake ranks low as there is less scope for new
properties to come up in front of lake due to lack of availability of land in the area. Since
the entire lake is used for recreational purposes by the entire population, people
seemed to be willing to make voluntary payment for its conservation as the people think
that if the money so contributed to a society comprising of multiple stakeholders, the
funds shall be used for the rightful purpose. Less willingness was shown in terms of tax
payment because of uncertainty of use of that money when it goes in the hands of the
government. But the thing is that there is lot of concern of the people for proper
management of the Bhoj Wetland.
Thus the exercise presented above demonstrates substantial generation of values in
term of actual use values and shows high dependence of people for various uses of
Bhoj Wetland. The stakeholders show high awareness towards threats to the wetland
as well as need to eliminate these threats for sustainable management of the wetland.

168
The understanding for their high stake in the wetland could rightfully be used if various
sustainable management activities carried out in participatory manner. Table 6.21 Estimation of Economic Values of Bhoj Wetland (Annual for 1999-2000) Uses / Impacts Stakeholders Valuation Techniques Value (in Rs) A. Drinking Water Water supplying
agencies
Supply Cost 9,54,13,962
B. Fish Production Fishermen Market Price of
Existing Production
49,20,000
C. Boating Boatmen Income Estimation 24,37,880
D. Trapa cultivation Trapa (water chest nut) Cultivators
Market Price of
Existing Production
50,00,000
E Washing of clothes Washer men Income Estimation 36,00,000
F. Secondary Activities
i. Maize cob selling ii. Sugar cane juice
selling iii. Snacks &cold drink
stalls iv. Horse rides v. MPTDC a. Cafeteria b. Boating
i. Maize Cobb
sellers
ii. Sugarcane juice sellers
iii. Individual owners
iv. Individual owners
v. MPTDC
i. Income
Estimation ii. Income Estimation iii. Income Estimation iv. Income Estimation v. a. Revenue Generation b. Revenue Generation
i. 1,44,000
ii. 2,73,600 iii. 2,06,400 iv. 7,92,000 v. a. 18,00,000 b. 6,74,635
G. Water borne Diseases Population using
lake’s water
Cost of Illness 12,00,254
H. Quality water Population using
lake’s water
Purification costs 1,24,35,876
I. Recreation
Entire population of
the city
CVM (voluntary
Payment)
4,84,68,956
J. Increase in property
prices
Lake front property
owners
Hedonic pricing 50% difference in
property prices

169
CHAPTER VII : CONCLUSIONS AND RECOMMENDATIONS FOR FUTURE
MANAGEMENT STRATEGIES
7. 1 Conclusions from the Bhoj Wetland Valuation Exercise.
7.1.1. Values and Stakeholders in Bhoj Wetland
Sustainable use of wetland resources that too located in urban areas with high
population densities poses a number of challenges. The challenge becomes even more
difficult where there are multiple values and multiple stakeholders. Bhoj Wetland (BWL)
located in the heart of Bhopal city is a unique example of an urban wetland. It is rightly
considered as ‘the lifeline of the Bhopal city’. Constructed as a major source of drinking
water, now it also provides recreational and productivity benefits and at the same time
used as a ‘sink’ for the purpose of throwing wastes of various types. It has now become
a glaring example of misuse of ‘a common property resource’. The Bhopal Municipal
Corporation(BMC) is a major stakeholder in terms of the maintenance agency whereas
the ongoing water quality restoration activities and prevention of pollution are
undertaken by the Environmental Planning and Co-ordination Organisation (EPCO) of
the Housing and Environment Department of Govt. of M.P. In this sense the
government agencies are major stakeholder responsible for maintaining the ecological
health of the Bhoj Wetland such that economic and ecological benefits continue to
accrue. The stakeholders deriving the benefits are the general population of Bhopal city
for recreational benefits, lake front property owners on account of aesthetic value and
micro climatic effects of lake, various communities dependent for their livelihood like
fishermen, trapa cultivators, boatmen, washer men and sellers around the lake.
7.1.2 Threats to Bhoj Wetland
Being an urban wetland and having prolific colonisation around it, the environmental
health of Bhoj Wetland has been degrading over the years. The failing ecological
integrity is also impacting the economic activities. The threats are due to anthropogenic
activities and are identified as siltation, solid waste pollutants, sewage, washing

170
activities, trapa cultivation, encroachment, weeds and eutrophication, boating
(excessive) agricultural waste idol and tadjia immersion, hospital waste etc.
7.1.3 Estimation of Values Accruing from BWL
BWL provides many uses which lead to many economic benefits to meet the spectrum
of wants and needs of multiple stakeholders ranging from very tangible subsistence
uses like drinking water, fish production, trapa etc. to intangible psychological needs like
aesthetic beauty and recreation. It could be seen that some of these uses are direct
uses with significant extraction like water supply, fish production, trapa cultivation. There
are some direct uses but are non extractive like ecotourism, recreation and these could
also have vicarious uses for media such as magazines & films. The indirect uses also
exist for the entire population living around or close to lake as it benefits from the
complex ecological functions of the lake which supports economic activity and human
welfare. As mentioned above that besides providing drinking water & livelihood to many
people through provision of various resources, the BWL also acts as ‘sink’ to the waste
which is put by the adjoining population in the form of sewage, detergents, solid waste,
hospital waste, silt flow, agricultural run off to name a few. It processes these wastes
through nutrient cycle, filtration etc.
Other indirect uses are carbon fixing, micro-climatic effects, habitat for migratory birds.
Though the BWL is a provider of many such values but more so it is used as a CPR and
has been facing increasing pressure due to increasing anthropogenic activities. Many
uses are directly extracted and do not enter into market. People do have use values but
are not aware of market values of such uses. Even though in some cases market price
could be traced (which mainly accrues to individual stakeholder) but there are no supply
costs attached to it. To capture all such values, the valuation exercise has been
attempted and Ramsar’s Guide for Policy Makers & Planners on “Economic Valuation of
Wetlands” (Barbier et.al. 1997) has been used as main tool to attempt this valuation
exercise besides drawing from many other sources.
In the valuation exercise attempted here the actual use values accruing to various
stakeholders are estimated using alternative methodologies like :

171
ii. Supply cost technique is used to estimate actual value of water supply, which is
otherwise highly undervalued commodity as the water tax is very low.
iii. Market price of existing production of fish and trapa was used to express the
value for fishermen and trapa cultivators. Due to lack of information on changes
in productivity stemming from modification in BWL value of the existing
production is considered.
iv. Income estimation approach is used to capture the value accruing to boatmen,
washermen, and sellers of various edible items and joyrides undertaking
activities in and around the lake.
v. Revenue generation has been administered to arrive at values accruing to
MPTDC for running the Cafetaria and boats.
vi. Cost of illness technique has been used to measure the extent of damage to the
health of wetland ecosystem in terms of its linked impact on human health.
vii. The abatement cost method captured the cost of purification of water so as to
reflect the willingness to people to pay to obtain pure water.
viii. All the above techniques tried to capture the values for individual users but the
entire population for the purpose of recreation uses the lake. CVM has been
used to capture the willingness of people in terms of voluntary payment on tax to
conserve the lake for recreational purposes.
ix. Hedonic pricing was used to capture indirectly the premium prevalent in property
prices due to their location over the lake.
x. Multicriteria techniques tried to capture the preferences of buyers while
considering property purchases.

172
The valuation exercise revealed that high supply cost is borne by the authorities
whereas the revenue earned in exchange is very normal. Income earned by individuals
showed high economic dependence of certain class of people on the lake. The value of
lake’s deteriorating quality was reflected through willingness of people to pay for water
purification and the cost that they are bearing on account of water borne disease.
People showed high WTP for conserving the lake for recreational purpose. The
population of Bhopal city is WTP Rs. 4,84,68,956/- anually (Rs. 241/- per household) as
voluntary payment forwards Bhoj Wetland Management Society and only Rs. 59,32,922
annually (Rs. 29.50 per household) if it is taken as tax. Nearly 95% of the sampled
population visit lakes mainly for the purpose of recreation. They at the same time
showed high awareness for various threats. In property price approach also it was found
that aesthetic value of lake commands a high premium in case of existing properties but
in the purchase of new property by people other factors like availability of drinking
water, safety, various neighbourhood and accessibility factors gain more importance.
7.1.4 Restoration Activities for BWL
There are a number of restoration activities being carried out by the State Government
in the Upper and the Lower Lake which are aimed at restoring and maintaining the
water quality and the quantity in the Lakes. This project is not only expensive but quite
ambitious and the only one of its kind to be introduced in a freshwater wetland in India.
As a result it has brought widespread recognition and appreciation to the agencies
implementing it (dealt in Chapter II).
7.1.5 Ecosystem Modelling of BWL
Ecosystem Modelling has been attempted to study the past, present & future scenarios
of the lake. Various water quality parameters have been used here which are important
from the point of view of various economic values that are derived from the lake base on
ecological integrity of the BWL’s ecosystem. The valuation exercise attempted was
used to indicate the overall economic efficiency of the various competing uses of this
wetland resource. Further through modelling exercise the linkage between the
ecosystem’s health and the health of the economic system and also vice-versa has

173
been established. A major difficulty that the wetland valuation exercises face is on
account of complexity of such environmental systems due to insufficient information on
important ecological and hydrological processes that underpin the various values
generated by the wetlands( Barbier et.al. 1997). Through ecosystem modelling exercise
an attempt has been made to understand such ecological and hydrological processes
using only water quality parameters which greatly determine the potential of economic
values from the BWL ecosystem. It also contributes towards prioritization of wetland
uses as there are inherent conflicts or tradeoffs amongst them. For instance, it may not
be possible to manage BWL for drinking water or recreation or fishing while at the same
time using it as a sink for wastes of various kinds for their treatment. Further this
exercise compares PDL and ongoing restoration activities and projects. The status of
two lakes expressed through the modelling exercises could be used as an input by the
policy makers to prioritise various interventions for the wise use of Bhoj Wetland.
7.1.6 Policy Implications from Valuation & Ecosystem Modelling
After the restoration project is over, the maintenance of this Wetland is supposed to
pass into the hands of the Bhopal Municipal Corporation who have looked after these
lakes till now. But this project and the results that are expected to be achieved from it
would fail miserably if the lakes were not maintained in the future in the same way. Such
expensive restoration activities cannot be carried out every now and then but can be
said to be a one time effort actually. The sustainability of this kind of an effort is
obviously under considerable strain if the factors that were responsible for causing its
degradation in the first place, are not checked. For this purpose involvement of the
community becomes very necessary. Unfortunately, the people have not had anything
to do with this project till now. The awareness levels among the general population
about the details of this project are astonishingly low, considering the detailed publicity
and campaigns carried out in the city via popular media.
Secondly, sustainability is an issue that has been much debated in the past.
Sustainability as defined in general terms means use of a resource in a manner that
provides not just for the needs of the current generation but also leaving enough to

174
meet the needs of the future generations. Thus it talks not only about intra generational
but inter generational equity. Sustainability implies a balancing of economic benefits
with resource availability/replenishment and environmental costs of growth. But there
are problems with this sort of balancing. How much of use is good and when does it
become unsustainable? Again, how much should be left for our future generations and
how much should be consumed by this generation? All these questions are difficult to
answer and estimates are tough to arrive at.
The above problems of the Upper and Lower Lake have arisen due to unsustainable
use of this scarce resource - drinking water. Drinking water is the primary need of a
growing city and pollution of its source produces a grave threat not just to the
ecosystem but also to the health of the citizens in the city. Therefore care has to be
taken to look after this resource and maintain its sustainable use in the future.
But is this enough for sustainable development? How can development without
participation from the people be envisioned? Thus for development to fulfil its long term
objectives, it becomes necessary to ensure that it is of the people, for the people and by
the people. Unless people themselves come to realise the need for improvement and
maintenance of the resources, their misuse cannot be curtailed be it for the Bhoj
Wetland or some other natural resource like forests, pasturelands, etc. Thus it becomes
necessary to plan development in a manner that it does not alienate people but makes
them part of the system. And this is what is exactly required for the continued flow of
benefits from the Bhoj Wetland. Awareness about the problems and empathy for the
system have to be created not by holding sporadic and ineffectual awareness
campaigns but through building local participation and support by making them part of
the decision making process. This is possible only when a certain responsibility towards
the ecosystem is felt by the people, which in turn is possible only when the actual value
of this resource is known to them. The value worked out in this study should be of use
to the policy makers and city planners in working out future management strategies for
this important wetland resource (Verma and Bakshi, 2000).

175
7.2 Recommendations for Future Management Strategies: Lessons from Valuation & Ecosystem Modelling Exercise.
There are many ways of managing a resource. Two of the extreme ways by way of
example are total conservation and open use. Now, both of these are impractical and
impossible to allow, the first because the Wetland is a way of life for many people and
their entry just cannot be banned without reason; the second because it would lead to
the Wetland becoming a common property resource with common access and share the
fate that has happened to many others. Examples are abounding of water bodies which
have dried up due to human activities in their catchment area or they have been filled
up to create more land to be sold as plots. According to Garrett Hardin, freedom in a
commons leads to the ‘Tragedy of the Commons’, where each individual in his partial
rationality tries to maximise his gains and thereby rushes towards ruin. He also adds
that the air and water around us cannot be fenced, and so the tragedy of the commons
as a cesspool must be prevented by different means, by coercive laws or taxing devices
that make it cheaper for the polluter to treat his waste than to discharge them untreated.
Working along this line of thought, it makes sense to charge people for not just the
sewage that people put into the water but also the drinking water that they use. The
current tax rates are not even enough to look after the maintenance of the pipelines
used in water distribution. The water tax should be altered at differential rates for people
according to their ability to pay. Otherwise, water metres can be introduced and the
people should be charged according to what they actually use. This ought to lead to
some sort of social responsibility among the people whereby they would control their
use of the resource, drinking water in this case.
In light of the above mentioned valuation & ecosystem modelling exercises which were
brought about through extensive personal discussion, focal group meetings, secondary
data through various departments and stakeholders workshops (Annexure III), a set of
technical and policy recommendations are proposed to operationalize the objectives of
the study leading to analysing the factors causing Bhoj Wetland degradation; nature
and extent of injury to the wetland; How does this degradation impact on the uses that
citizens of Bhopal extract out of it ? What cost is borne by the users on account of

176
degradation in terms of productivity losses and health impacts? How feedback can be
taken from these impacts to revise or develop management policies and to seek
participation of stakeholders to check wetland degradation or losses? What is the
willingness of the people to pay to conserve this wetland? The following set of Technical
and Policy recommendations are proposed:
I Technical Recommendations
As the restoration activities are going on & shall take another year or so to complete
and their impacts could be rightly assessed only after their complete execution. At the
same time has been observed that the restoration and prevention activities have not
been taken up in sequential manner. Thus it is necessary to follow stepwise physical
interventions to restore the status of both the lakes of the Bhoj Wetland. The following
are suggested to effectively implement the restoration subprojects:
i. It becomes necessary to first bring the preventive measures into working
order before implementing what are known as the corrective measures. If the
former are not implemented at the right time, the effect of the latter cannot be
of any consequence. For example, floating fountains have been put up in the
Lower Lake at huge costs without first of all completing the garland drain
project which would stop the sewage from entering the Lower Lake. As a
result sewage continues to flow unabated into the Lower Lake and at the
same time, the floating fountains are supposed to aerate the Lakes. Naturally,
the effect of the latter cannot be observed unless the flow of sewage is
stopped.
ii. Retghat –Lalghati road has been constructed on the left bank of the Upper
Lake , which is supposed to act as barrier to prevent encroachment but
sewage through neighbouring colonies still continue to flow underneath.

177
II. Policy Related recommendations:
The critical need today is to recognize the inter-linkages and benefits that could be
obtained if the wetland is managed in ‘integrated manner’ and is ‘sustainably used’. It is
a very challenging task and requires actions at many levels and delicate integrity of
diversity of issues and management institutions. Such an approach must begin with
involving all stakeholders in the wetland in the form of a local area institution, which
shall be helpful in eliciting their views for use and future management of the Bhoj
Wetland. The Institution so formed could frame the action plan to cover all ecological,
economic, social and institutional issues. To cover the above issues the following set of
policy recommendation is proposed :
a. It is imperative to take into account the perceptions of the people before carrying
out any management exercise and especially one of this scale and to also
involve the people at every stage of the planning process.
b. The management of the Lakes looks at the restoration and maintenance from
each and every side. For this effective co-ordination between all the line
departments that are connected with the use or maintenance of the lakes
becomes necessary.
c. There needs to be more transparency in the system. When huge amounts of
public money/funds are used for development activities, it becomes the
responsibility of the concerned authorities to reveal to the people how the funds
have been used.
d. There is need of setting up of a Bhoj Wetland Management Committee which
should comprise of all the concerned line departments, such as the Public Health
and Engineering Department, the Municipal Corporation, the MP State Tourism
Department, research institutes like the Regional Research Laboratory, Indian
Institute of Forest Management, Limnology Department of Barkatullah University,
journalists, NGOs, representatives of the people through members of various
residential or commercial societies, the fishermen society and the dhobi

178
community and maybe even people from religious groups. This body should be
vested with all the decision making powers as far as the management of the
Lakes in the future goes. The functions of the society would be to ensure
maintenance and management of the Bhoj Wetland for Sustainable Use. The
structure of Bhoj Wetland Society is given in Annexure V.
e. The valuation of the Lakes should serve as an important basis for designing of
future strategies. It would also give an idea of the kind of money required for
maintenance activities in the future.
f. The people are willing to pay substantial amounts for enjoying recreational
benefits from the lake. This exercise should be followed by an actual collection
exercise and that money would serve as the corpus of the Bhoj Wetland
Management Committee. The figures so estimated by the Bhoj Wetland
Department for the purpose of maintenance of sub projects after their completion
roughly stands Rs. 80,70,000 (details in Annexure VI )If a ‘management fund’ is
generated through the collection in terms of voluntary payment, the maintenance
activities could be carried out smoothly.
g. A cost benefit exercise needs to be carried out once all the values have been
calculated. This exercise taking all social costs and benefits into account would
provide a picture of how effective the restoration programmes have actually
been.
h. It is necessary to promote eco-tourism in the city. The city has two picturesque
lakes which can provide an excellent site for adventure tourism as well. This
would provide employment to a large number of people and would also bring the
much required revenue into the coffers of the government. For this purpose, the
Lower Lake and the Spill channel of the Upper Lake are wonderful sites. Sports
like sport fishing, para sailing and para gliding, water scooters, yatching and
many more can be introduced at these sites. Bhopal could soon figure on the
international map for water sports provided the sports and the tourism ministry
take up this challenge seriously.

179
i. There are a number of sites in the city area on the Idgah Hills and Shyamala Hills
that provide a beautiful view of the Lake. If these sites can be developed as view
points, they can become wonderful picnic sites. It is necessary to take up the
development of these sites on a priority basis since land at these prime locations
is the target of encroachments.
j. It is also important for all the concerned departments to prioritise their activities
according to the simulation runs of the model for both the lakes. These models
depict the scenario as in the past, present and as expected in the future at the
following trends. Thus the effect of any management decision can be studied by
using this model and this becomes extremely necessary for the effective
implementation of the project.
It is believed that the recommendations listed above, if taken care off by management
authorities shall help in economically wise, environmentally sound and socially
acceptable process for sustainable management of such an important ‘Urban Wetland’

180
GLOSSARY
Alkalinity: It is inverse of acidity. A quantitative measure of water’s capacity to
neutralize acids. Alkalinity results from the presence of bicarbonates, carbonates,
hydroxides, salts and occasionally of borates, silicates and phosphates. Numerically, it
is expressed as the concentration of calcium carbonate that has an equivalent capacity
to neutralize strong acids. Alkalinity higher than 200 mg/l make the taste of water
unpleasant.
Bacterial Count: Maximum probable number (MPN) count of bacterial colony in a given
water sample shows the total bacterial count. Measured the number of colonies per 100
ml of sample. Drinking water standards of World Health Organization (WHO) insists
total absence of colonies in drinking water.
Bio-chemical Oxygen Demand: Biological uptake of molecular oxygen for the
degradation of organic and inorganic compounds in the water. A maximum permissible
limits of 25 mg/l BOD is given in WHO standards
Contingent Valuation: A valuation from a survey technique using direct questioning of
individuals to estimate individuals’ willingness to pay.
Direct Use Value: The value derived from direct use or interaction with a wetland’s
resources and services, such as the value of fish catches.
Dissolved Oxygen: Molecular oxygen dissolved in water from atmosphere and
photosynthetic activities of primary producers. Temperature, turbidity and
photosynthetic activities controls Dissolved oxygen value. Low value shows less primary
production and high metabolic consumption. Unit is milligrams per liter of sample(mg/l).
No. limits to drinking water standards but a minimum 4 mg/l is necessary for
aquacultural activities.
Eutrophic: From Greek for “well-nourished”, describes a lake of high photosynthetic
activity and low transparency.

181
Eutrophication : The process of physical , chemical ,and biological changes
associated with nutrient , organic matter, and silt enrichment and sedimentation of a
water body. If the process is accelerated by man- made influences, it is termed cultural
eutrophication.
Indirect Use Value: Indirect support and protection provided to economic activity and
property by the tropical wetlands’ natural functions, or regulatory ‘environmental’
services, such as flood alleviation.
Intrinsic Value: The worth of something in itself regardless of whether it serves as an
instrument for satisfying individuals’ needs and preferences.
Market: A collection of transactions whereby potential sellers of a good or service are
brought into contact with potential buyers and the means of exchange is available.
pH: A measure of the concentration of hydrogen ions of a substance, which ranges
from very acid (pH=1) to very alkaline (pH=14) . pH 7 is neutral and most lake waters
range between 6 and 9. pH values less than 6 are considered acidic and most life forms
can not survive at pH of 4.0 or lower.
Phosphates: Total organic and inorganic phosphate present in water sample. Organic
phosphate is the chemically bound phosphate with living cells and inorganic or
orthophosphate is absorbable form of nutrient. High phosphate value leads high organic
production because it is the limiting factor of primary production in inland water bodies.
Measured in milligrams of phosphate per litre of water sample.
Shadow Price: Price ‘adjusted’ to eliminate any distortions caused by policies or
market imperfections so as to reflect true willingness to pay.
Social Cost: The total cost to society of an economic activity.

182
Total Dissolved Solids: TDS is the amount of solids present in the water sample in
dissolved form. This is the absorbable form of compounds to all living forms. Measured
in milligrams per litre of sample. Drinking water limits of TDS is 1000 mg/
Total Economic Valuation: Assessment of the total economic contributions, or net
benefits, to society of the wetland system (e.g., for national income accounting or to
determine its worth as a protected area).
Total Hardness: It is the measure of salts like calcium bi-carbonate, carbonate and
magnesium sulphate dissolved in water hardness has adverse effect on domestic use of
water.. High hardness brings scales in the boilers. Unit of total hardness is mg/l.
Maximum permissible limit of hardness for drinking water is 500mg/l
Turbidity: It is the measure of colloidal suspended matter in the water which hinder/
reflect the light. Turbidity higher than 5 units affect the clarity of water & make it
unacceptable for drinking.
Valuation: Quantification of the values of a good or service.
Value: The worth of good or service, generally measured in terms of what we are willing
to pay for it, less what it costs to supply it.
Weeds: They are the unwanted plants growing in a water body. They prevent light
penetration and makes breeding ground for vectors like mosquitoes. Decayed plant
parts gives more BOD to the water. They are the indicators of high nutrient content of
the water.
Wetland Function: Processes among and within the various biological, chemical and
physical components of a wetland, such as nutrient cycling biological productivity and
groundwater recharge.
Willingness to Pay: The amount that someone is prepared to pay to purchase a good
or use of a service regardless of whether there is a prevailing market price or the good
or service is available free of charge.

183
BIBLIOGRAPHY
1. Allaby.M (1994) “ The Concise Oxford Dictionary of Ecology”, Oxford University
Press, Oxford
2. Barlow, S.M., Bridges, J.W.,Calow,P., Conning,D.M., Curnow,R.N., Dayan,A.D.,
and Purchase, I.F.H. (1992) Toxicity, toxicology and nutrition in risk analysis,
perption, management. Report of Royal Society Study Group. The Royal Society
, London. Pp. 35-65
3. David Pearce and Kerry Turner, 1990, Economics of Natural Resources and the
Environment
4. Environmental Status Report of Upper Lake, Bhoj Wetland, Bhopal
5. Gopal K.Kadekodi ., S.C,Gulati., (1999) “ Root causes of Biodiversity losses in
Chilika Lake: Reflections on Socio-Economic Magnitudes” Study report of
Institute of Economic Growth and Centre for Multi- Disciplinary Development
Research, supported by WWF-India, New Delhi.
6. Gordon.L.Swartzman and Stephen.P.Kaluzny.,(1987), “Ecological simulation
primer” Mac Millan Publication Company, New York.Pp. 01-03
7. Holling, C.S.(ed) (1978) Adaptive environmental Assessment and Management.
Johnwiley and sons, London.
8. Krebs,C.J., (1978) “Ecology: the experimental analysis of distribution and
abandance”
9. Measurement of Environmental and Resource Values, A. Myrick Freeman III.
Dying Wisdom
10. Robertson David, Alan Bundy, Robert Muetzelfeldt, Mundy Huggith and Michael
Uschold.,(1991) “Eco-Logic”. The MIT Press, Cambridge . Pp. 09-13

184
11. Swartzman,G.L.,Stephen ,P.K.,(1987) “Ecological simulation primer” Macmillan
Publication Company., NewYork. Pp. 01-05
12. Tony Prato, Natural Resource and Environmental Economics
13. Treeweek Jo (1999) “ Ecological Impact Assessment” ,Blackwell Science Ltd,
Oxford , London, Pp. 159-163
14. Verma, Madhu, Nishita Bakshi (2000) ‘ Sustainable Management of Natural
Resources – A Case of Bhoj Wetland’, IIFM Newsletter, July, 2000 Issue.
15. Verma, Madhu, Nishita Bakshi and Ramesh P.K.Nair (2000) ‘ Total Economic
Valuation of Bhoj Wetland for Sustainable Use’ Paper prepared for presentation
in the beijer Research Seminar on Environmental Economics, 18-20 September,
2000, Dhulikhel, Nepal, organised by the Beijer Institute, Stockholm, Sweden.
16. Walters,C.J.(1993) Dynamic Models and Large scale field experiments in
environmental impact assessment and management. Australian journal of
Ecology-18.Pp. 53-61

ANNEXURE I Ward-wise Population of Bhopal City
Ward No.
Name of Ward Population (1991)
% of Total Population
No. of Sampl
es 1* Mahatma Gandhi 16009 1.506 23 2* CTO ward 4856 0.456 6 3* Hemukalani 15470 1.455 22 4* Sadhu Waswani 15866 1.492 22 5* Koh-e-Fiza 15267 1.436 22 6* Noor Mahal 16304 1.534 23 7* Malipur 16210 1.525 23 8 Bag Munshi Hussain Khan 16290 1.532 23 9* Idgah Hills 16087 1.513 23 10 Babu Jag Jeeyan 16322 1.535 24 11* Gufa Mandir 16958 1.595 25 12 Geetanjali 16710 1.572 25 13 Shahjahanabad 16547 1.556 23 14 Congress Nagar 16497 1.552 23 15 Motilal nehru 14087 1.325 21 16 J.P.Nagar 15500 1.458 24 17 Ibrahim Ganj 15545 1.462 24 18 Ram Mandir 14520 1.366 22 19 Mangalwara 14357 1.350 22 20 Lal Bahabur Shastri 14975 1.409 23 21 Mahaveer ward 15163 1.426 23 22 Jain Mandir 14401 1.355 22 23* Moti masjid 15616 1.469 24 24 Islampura 14825 1.394 22 25* Bhoipura 13879 1.305 22 26* Ram Kamalapati 14701 1.383 22 27* Vivekanand 14499 1.364 22 28* Ambedkar 17625 1.658 25 29 Tulsi ward 16471 1.549 24 30 Panchsheel Nagar 16486 1.551 24 31 Maulana Azad 17675 1.663 26 32 Shivaji Nagar 16212 1.525 24

33 T.T.Nagar 16267 1.530 24 34* Jawahar Lal Nehru 16728 1.573 24 35 P Madan Mohan Malviya 16874 1.587 24 36* Ravindra nath Tagore 17735 1.668 26 37* Jehangirabad 17152 1.613 25 38* Barkheri 15960 1.501 22 39 Chand Barh 15,568 1.464 21 40 Kapda Mill 14706 1.383 18 41 Bag Umrao Dulha 15159 1.426 22 42 Aish Bagh 15200 1.430 22 43 Maharani Laxhmi Bai 16028 1.508 23 44 Jinsi Ward 14172 1.333 18 45 Maida Mill 17186 1.617 25 46 Netaji Subhash Chandra 15617 1.469 21 47 Maharana Pratap 17234 1.621 25 48 Ravi Shankar 17257 1.623 25 49 Dr. Rajendra Prasad 17721 1.667 26 50 Indira Gandhi 16202 1.524 24 51 Shahpura 16479 1.550 21 52 Asha Niketan 17721 1.667 25 53 Barkatullah 17486 1.645 25 54 Barkhera Pathani 16687 1.570 23 55 Saket-Shakti 15394 1.448 22 56 Kasturba 15000 1.411 20 57 Anna Nagar 16381 1.541 22 58 Barkhera, BHEL 17025 1.601 24 59 Govindpura 15409 1.449 21 60 Piplani 17551 1.651 25 61 Gautam Buddha 16801 1.580 23 62 Sonagiri 17489 1.645 25 63 Indrapuri 16758 1.576 23 64 Guru Nanak 15593 1.467 21 65 Rajeev Ward 17692 1.664705 25 66 Nabi bagh 15036 1.414792 21
Total 1,062,771 1504 * Wards draining into the lakes
Source : Bhopal Municipal Corporation

ANNEXURE II CONTINGENT VALUATION QUESTIONNAIRE FOR BHOJ WETLAND
Indian Institute of Forest Management, Nehru Nagar,
Bhopal 462 003 TO BE FILLED OUT BY THE INTERVIEWER
FILL IN BEFORE INTERVIEW Respondent's name:
Mr. / Mrs. / Ms / Address:
Telephone: 3. Date of Interview: 4. Start time of the Interview: FILL IN AFTER INTERVIEW 5. End Time of the Interview: 6. Length of Interview: 7. Name of the Interviewer:
INTRODUCTION Interviewer: Good Morning (evening), my name is _____________________________(first name and surname), and I am working on behalf of the Indian Institute of Forest Management. We are carrying out a survey for which we need to ask you a few questions. It will take around half an hour. Or, if you prefer, I could come back later. IF ASKED TO COME BACK LATER, ASK FOR A SPECIFIC TIME (AND DATE) IF AGREES TO BE INTERVIEWED IMMEDIATELY, PROCEED TO (2) Credentials: SHOW 1. Letter from Director, IIFM AND 2. The Official Enumerator Badge Let me begin by telling you a few things about this survey. As you may know the Upper Lake and the Lower Lake together constitute what is known as the Bhoj Wetland. These lakes are an important part of the city of Bhopal. Steps are being taken to maintain the wetland but these are costing the government a lot of money. The results of this survey will go towards helping the state government to make better decisions about whether these steps to maintain the lake are worthwhile to citizens like you.

Firstly, let me tell you that this interview is to do with your attitudes and opinions. There are no right or wrong answers. The answers that you provide may be used by policy makers in their decisions. How would you rank the following problems that the country is facing right now according to their order of importance to you as a person:
1 - most important 2 - very important 3 - important 4 - somewhat important 5 - Least important
Problem
Ranking
a) Corruption b) Foreign infiltration c) Pollution/Environmental Degradation d) Lack of a stable government e) Economic Issues
How would you rank the following environmental problems: 1 - most important 2 - very important 3 - important 4 - somewhat important 5 - Least important Problem
Ranking
Deforestation Urban Waste / Solid waste pollution
Noise pollution Vehicular pollution Industrial pollution
3. What are your sources of drinking water? Municipal supply (taps) Tube well Tankers other source: 4. Do you use any of the following appliances / techniques for water purification
purposes?
Aquaguard Zero B Ordinary Filter Chlorine/Alum Boil Water None 5. Please rank the following statement: “Important wetlands like the Bhoj Wetland require special conservation measures” Strongly agree Agree

Neutral Disagree Strongly disagree 6. You may be aware that the Bhoj Wetland provides a number of services to the citizens of this city. A few of them are listed below. Kindly rank them according to their importance in your opinion. 1 - most important 2 - very important 3 - important 4 - somewhat important 5 - Least important Services Ranking Drinking Water Stability of microclimate Employment to fishermen, boatmen, singhara cultivators and dhobis
Recreation and tourism because of boating and Van Vihar
7. Do you ever visit the Upper Lake for recreational purposes like boating etc.? Yes No 8. Do you ever visit the Lower Lake for recreational purposes like boating etc.? Yes No IF NO SKIP TO QUESTION 10. 9. How often do you go to the Lakes / Van Vihar? Every week Once in a fortnight Once in a month Once in two - six months Once in seven - twelve months 10. To what extent is the Upper Lake polluted in your opinion? a) Marginally b) Moderately c) Highly d) Not at all 11. To what extent is the Lower Lake polluted in your opinion? a) Marginally b) Moderately c) Highly d) Not at all 12. How would you rank the various threats to the lakes in order of importance? 1 - most important 2 - very important 3 - important 4 - somewhat important 5 - Least important
Problem Ranking a. Siltation b. Solid waste pollutants like polythenes, etc.

c. Sewage d. Washermen e. Trapa cultivators f. Encroachment g. Increasing population h. Weeds and eutrophication i. Boating j. Agricultural waste k. Idol immersion l. Hospital waste like bandages, waste medicines,
etc.
m. Others, please specify VALUATION B. SHOW THE PHOTOGRAPHS OF THE POLLUTED AND RESTORED WETLAND AND THE STRUCTURE AND FUNCTIONS OF THE PROPOSED BODY It is being tried to place a money value on services that you derive from the Lakes. You derive a number of benefits from this Wetland like recreational opportunities and microclimatic stabilisation. Suppose, an independent body was formulated by the government to maintain the lakes in the future for recreational activities and it would look after the Upper and Lower Lakes, maintaining and developing the recreational opportunities that would be made available to the people of Bhopal. This body would develop and maintain parks by the wetland, promote adventure boating, and other forms of ecotourism, fishing sports and other such activities. It would help to maintain the aesthetic beauty of the wetland as well. This kind of a body would require funds for operating. Suppose that this body would operate only on the funds collected through voluntary contributions and not through any government aid, we would like to know about your contribution to such a body? The persons contributing to this fund would get a privilege membership to the society whereby they could enjoy the various activities promoted by the society on nominal payment of ticket charges. 13. Assuming that such a body was formed and would work perfectly as specified, how much money would you (and your family) pay voluntarily, every year, to enjoy the improved recreational and aesthetic benefits of the Bhoj Wetland? None - GO TO QUESTION 14 Initial Amount: Rs ______________ ACCORDING TO THE BAND WITHIN WHICH THIS AMOUNT FALLS, SELECT THE NEXT AMOUNT AND ASK THE FOLLOW - UP QUESTION A. 1 - 250 Ask for Rs 300 B. 251 - 500 Ask for Rs 750 C. 501 - 1000 Ask for Rs 1500 D. 1001 - 2000 Ask for Rs 3000 E. More than 2000 Ask for Rs 5000 FOLLOW UP QUESTION: Since you are probably doing such a valuation exercise for the first time, let me try and ask you if this is definitely the value that you would place on the improved services that you would receive from the Bhoj Wetland For instance, would you pay Rs ____________, (value from the list given above corresponding to the band containing the initial bid) per year, on behalf of yourself and your family, in order to enjoy an improved Bhoj Wetland? YES

NO ENTER THIS AMOUNT AS NEXT VALUE STATED NEXT VALUE STATED: Rs ____________________ You have a limited income and in that case do you think that it will be possible for you to pay the amount that you have stated. If you want you can still adjust the amount
_ Suppose the government imposes a compulsory tax upon all the citizens of the city, whereby, the collections from this tax would entirely go towards maintaining the Wetland and providing the activities listed above with no special membership benefits, through the formation of a similar body. In this case how much would
Should there be a gate fee at the entrance of the parks that are created? YES NO
IF NO SKIP TO QUESTION 20 If so what should the amount per adult be fixed at? Re 1 – Rs 5 Rs 6 – Rs 10 Rs 10 – Rs 20 Rs 21 – Rs 50 Above Rs 50 People who say no usually have a reason for it. Could you please specify why you are not willing to pay for the benefits of the wetland?
a) The government should pay YES/NO b) The user should pay YES/NO c) I cannot afford to pay YES/NO d) The Wetland is not important to me YES/NO e) Other reasons:___________________________
Suppose that you were to buy a plot / piece of property within the city. What importance would you give to the following factors?
1 - most important 2 - very important 3 - important 4 - somewhat important 5 - Least important Variable Rank Proximity to a market place Proximity to place of work Proximity to major highways
Proximity to children’s school
Proximity to the lake
Proximity to a hospital / nursing home Safe neighbourhood as concerned to crime rate
Quality of construction Age of house

Housing Density General Air Pollution Levels Level of Noise Pollution Proximity to a park Availability of household help Availability of regular drinking water
SOCIO - ECONOMIC CHARACTERISTICS 21. Occupation: 1. Private Sector Employee ____________________________________________ 2. Government Employee _____________________________________________ 3. Self Employed ____________________________________________________ 4. Other ____________________________________________________________ 22. Number of Household Members above the age of 18: _____________________ 23. Number of Household Members below the age of 18: _____________________ 24. Formal education level of the head of the household / respondent A. Below Class XII B. Upto Class XII C. Undergraduate (B.A./ B.Com/B.Sc) D. Postgraduate (M.A. / M. Com / M.Sc.) E. Professional Qualifications ( B.E. / B. Tech. / M.B.A. / M.B.B.S.) F. Other __________________ 25. Please tell me the category which includes your (and your household's) total annual gross income from all sources for the last year (i.e. 1998 - 99): A. < Rs 25,000 B. Rs 25,000 - Rs 50, 000 C. Rs 50,000 - Rs 1 lakh D. Rs 1 lakh to Rs 2 lakhs E. Rs 2 lakhs to Rs 3 lakhs F. Rs 3 lakhs to Rs 5 lakhs G. Rs 5 lakhs and above. 26. Since when have you been staying in Bhopal? Less than 1 year 1 – 5 years 5 – 10 years 10 – 20 years 20 and more Concluding the interview: Thank you very much for your time. But before leaving I would like you to please answer the following questions as well. GIVE THE RESPONDENT THE NEXT PART OF THE QUESTIONNAIRE RESPONDENT EVALUATION 27. How well did the interviewer explain the context of the questions and the questions themselves? a) Very well b) Well c) Not very well d) Badly Please tick the relevant option

28. Do you believe that your answers will influence the decision by the government to create a body for improving the recreational facilities of the Upper and Lower Lakes? a) YES b) NO c) PERHAPS 29. Do you believe that you may be asked to pay for improvements in the Bhoj Wetland? a) YES b) NO c) PERHAPS ENUMERATOR EVALUATION AND DECLARATION COMPLETE THESE QUESTIONS AS SOON AS POSSIBLE AFTER THE INTERVIEW These questions are only concerned with how the respondent answered the questions on valuations. 30. Irrespective of whether or not the respondent answered the questions on valuation, in your judgement, how well did the respondent understand what he or she was asked to do in these questions? 1. Understood completely 2. Understood most of them 3. Understood somewhat 4. Did not understand at all 5. Other (specify) _______________________________________________________________________________________________________________________________________________________________________________________________________________________ 31. Which of the following descriptions best describes the degree of effort the respondent made to arrive at a value for the stated uses 1. Gave the questions prolonged consideration 2. Gave the questions careful consideration, but the effort was not prolonged 3. Gave the questions very little consideration 4. Other (specify) ________________________________________________________________________________________________________________________________________________________________________________________________________________________ FILL IN THE DETAILS ON THE TOP SHEET REGARDING TIME AND LENGTH OF THE INTERVIEW
DECLARATION BY THE ENUMERATOR I hereby certify that this is an honest interview taken in accordance with my instructions. ______________________ ______________________ Name of the Enumerator Signature of the Enumerator Date

ANNEXURE III One day Workshop on Sustainable Use of The Bhoj Wetland:
Stakeholders’ Perspective, 13th March, 2000
List of Participants of the workshop:
Mrs Vibha Patel, Mayor, Bhopal
Dr. Satyanand Mishra, Principal Secretary, Housing and Environment
Department, Govt of M.P.
Dr. Ram Prasad, Director, IIFM
Dr. A. J. James, Environmental Consultant, New Delhi
Dr. Sanjeev Sachdeva, Senior Research Officer, Bhoj Wetland Project
Dr. Balmukund Bharati, Sahyog
Dr. R.P. Upadhayay, Kshetriya Vikas Evam Jan Kalyan Samiti
Dr. J.S. Vashir, Swasthya Sampada
Dr. Vipin Vyas, Department of Limnology, Barkatullah University, Bhopal
Mr. Abdul Jabbar, Gas Peedit Mahila Morcha
Mr. Satinath Sarangi, Sadbhavna Trust
Ms Nishi Nariyani , M.P. Council Of Science and Technology
Corporators of various Municipal Wards
Representatives from Fishermen, Washermen, Boatmen communities
Project Team Members of IIFM
Workshop Proceedings: The participants were introduced with the objectives and methodology of the project
and how different valuation techniques like the Contingent Valuation Method
Hedonic Pricing, market analysis shall be used to arrive at the economic value of the
wetland. It was also mentioned that the co-operation of all the stakeholders in the
Wetland will be required for effective completion of the project .
This was followed by division of the participants into three groups and taking up of
one issue by each. The sticky cloth and paper technique was used to facilitate the
discussions. The groups dealt with three important topics like sewage and waste
disposal, fishing and washing activities and recreational activities. The outcome of
the group discussions and the response of the concerned departments who replied
to the queries, problems and alternatives suggested are listed in the table given

GROUP 1 – SEWAGE AND WASTE DISPOSAL
EPCO ACTION
PROBLEMS FACED OR REMAINING
ALTERNATIVES &
ADDITIONAL ACTION
NEEDED
INFORMATION GAP
RESPONSE OF THE
CONCERNED DEPTT.
Deweeding Unhealthy Environment
Removed weeds to be converted into compost / manure
Relocating sites of Idol immersions
Not practical Small, metallic idols can be encouraged
Sewerage system in all lake peripheral wards and its treatment
Waste disposal from slum areas where no sewage line exists
Treatment of sewage water and putting the water back into the lake to maintain water level Use of sewage water in irrigation
Non-traditional sewage plants, based upon the famous Calcutta system are being set up No response to problem of waste disposal in slums
Solid Waste Management, Waste Collection Bins and Municipal System for collection and disposal of waste in open land
Vegetable waste disposal from weekly market areas Cost & time required for collection of waste vis a vis creation of unhygienic conditions
Ask for advice from MJS, Lucknow, an NGO, which is successfully managing solid waste collection and treatment (organic compost through vermiculture) Dumping of solid waste to alternate site vis a vis alternate use of waste by processing
Such action is welcome/ will be encouraged
Removal of slums from the fringe area and link road construction
No alternative Policing systems are not enough to ensure total removal

GROUP 2 – FISHING AND WASHING ACTIVITIES
EPCO ACTIO
N
PROBLEMS ALTERNATIVES INFORMATION
GAPS
RESPONSE OF THE
CONCERENED DEPTT.
Plantation
Litter fall Organic Matter / Bird Droppings More Pollution Skin Problems
Plantations should be carried out away from the shore line
Plantation near the shore line is no longer being carried out but in the buffer zone
Deweeding
Nets are damaged Other weeds come up
Navigation routes of motor boats used in deweeding operations should be demarcated
To be pointed out to the BWL Project authorities
Fencing & Road
No place for fishing boats to land No access to lake for fishermen Water hyacinth
Gaps in the fencing should be provided to give space to the boats for landing
Van Vihar National Park is a notified area and so nothing can be done about it
Grass Carp
No information given to the fishermen about the stocking rate Fingerlings are flushed out from the spill way when the Bhadbhada gates are opened
Land should be provided in the vicinity of the lake to stock seed during rains Make Bhadbhada sluice gates an overflow system (as existed previously)
Project is already done with and check with PWD about the previous type of dam at Bhadbhada
Desilting
No information No idea about its impacts
Fishermen should be informed before the operation
Pamphlets to be distributed about this. Desilting to be done only in areas where there are no fishing activities
Removal of Dhobi Ghats
Two ghats belonging to dhobis, the one with the larger communtiy is consulted and not theirs Alternative space is insufficient for drying washed clothes
Adequate water for washing and drinking and sufficient space for drying clothes should be provided
Area has been chosen by BMC and has been found to be the least unsuitable. Community involvement is to be encouraged

GROUP 3 – RECREATIONAL ACTIVITIES
EPCO ACTION
PROBLEMS ALTERNATIVES INFORMATION
GAPS
RESPONSE OF THE
CONCERNED
DEPARTMENT
Retghat Lalghati Road
Additional Lead & SPM going into the Lake Not acting as the proposed buffer between population and lake Solid waste likely to be thrown into lake from road side Building activities continue south of the road near Khanugaon
Chain Link fence to stop waste? Environmental Information Awareness Campaigns? Effective Policing? Close Road?
Scientific testing of impact needed
People look for aesthetic utility from the lake and not just its existence
Chain Link Fencing and Social Forestry
People in jhuggi jhopris breaking fence for access to lake for water, sanitation and livelihood needs
Rehabilitate(relocate) those jhuggi jhopris which haven’t been shifted elsewhere Reforest the area with community participation
EPCO provisions for rehabilitation Who will look after the newly planted trees?
Policing not efficient and enough anyway
Deweeding – Water hyacinth
Complete removal upsets ecosystem How to harvest optimal amounts in future? Who? Problem with carp introduction?
Limnology Department and local fishermen to estimate optimal harvest High Powered multi disciplinary expert group (including ITK) to
How much of water hyacinth is useful? Has
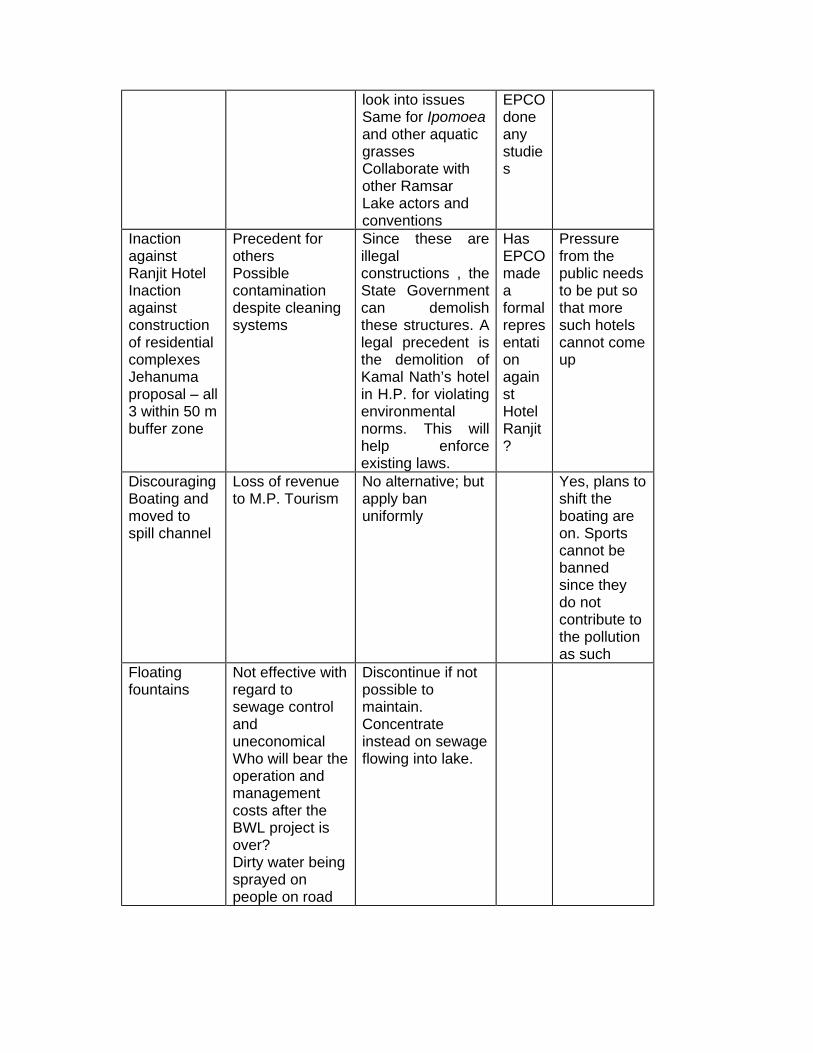
look into issues Same for Ipomoea and other aquatic grasses Collaborate with other Ramsar Lake actors and conventions
EPCO done any studies
Inaction against Ranjit Hotel Inaction against construction of residential complexes Jehanuma proposal – all 3 within 50 m buffer zone
Precedent for others Possible contamination despite cleaning systems
Since these are illegal constructions , the State Government can demolish these structures. A legal precedent is the demolition of Kamal Nath’s hotel in H.P. for violating environmental norms. This will help enforce existing laws.
Has EPCO made a formal representation against Hotel Ranjit?
Pressure from the public needs to be put so that more such hotels cannot come up
Discouraging Boating and moved to spill channel
Loss of revenue to M.P. Tourism
No alternative; but apply ban uniformly
Yes, plans to shift the boating are on. Sports cannot be banned since they do not contribute to the pollution as such
Floating fountains
Not effective with regard to sewage control and uneconomical Who will bear the operation and management costs after the BWL project is over? Dirty water being sprayed on people on road
Discontinue if not possible to maintain. Concentrate instead on sewage flowing into lake.

ANNEXURE IV Maintenance of Works (Annual Cost)
(i) Deweeding @ 2.5% of the work cost(Rs 1264 lacs) = Rs 31,60,000
(ii) Desilting @ 0.05% of the works cost (4200 lacs) = Rs 2,10,000
(iii) Check dams, silt traps, cascades
@ 2% of costs (Rs 100 lacs) = Rs 2,00,000
(iv) Afforestation @ 2.5% of the works cost (Rs 800 lacs) = Rs 20,00,000
(v) Floating fountain @ 5% of the work cost (Rs 500 lacs) = Rs 25,00,000
Total = Rs 80,70,000 Source: Bhoj Wetland Project Office

ANNEXURE V FUNCTIONS AND ACTIVITIES OF THE BHOJ WETLAND
MAINTENANCE SOCIETY
! Maintain Water Quality And Improve Lake Management ! Build Parks And Maintain Them ! Better Boating Facilities With Introduction Of Water And Adventure
Sports ! Encourage Sport Fishing Using Rods ! Hold Summer Camps For Children And Youth For Water Related
Recreational Activities ! Promote Ecotourism By Encouraging Visitors To Learn About Lake
Ecosystem And Biodiversity and How To Decrease Water Pollution By Regulating Use Of Polythenes, Etc. And Water Consumption
! Develop View Points With Sitting And Refreshment Arrangements ! Introduction Of Dal Lake Type Shikaras ! Generate Awareness For Clean Lakes By Holding Annual Lake
Festival, Distributing Souveniers, Declare Lakes As City’s Heritage, Etc.

LIST OF POTENTIAL BENEFITS FROM THE BHOJ WETLAND FROM THE STAKE HOLDER’S PERSPECTIVE
Direct Benefits: 1. Water supply to the city – Half the city’s water is supplied from the upper lake. 2. Commercial fishery – Major source of supply of fresh water fish for the city’s fish
loving population 3. Recreation – Boating facilities include speed/motor boats, row boats and paddle
boats. Favourite haunt of the city’s fun loving population. 4. Trapa and lotus cultivation – Source of the city’s supply of the same but also a
major menace to the lake waters. 5. Sewage Disposal - The lower lake especially serves as a dump not only for the
sewage wastes but also for the solid wastes. Many households open directly onto the lake and the garbage is dumped directly into the lake water.
6. Van Vihar National Park – This encloses a portion of the lake and these waters support the Van Vihar by providing not only water but also aesthetic beauty and more important a home to many species of migratory birds that arrive in the winters.
Indirect Benefits: 1. Ground Water Recharge – This is a very important function of the Bhoj Wetland
for which it had initially been constructed in the eleventh century. 2. Nutrient Retention – The lakes have a very large catchment area and along with
the water that is recharged a large amount of silt also comes into the lakes. The nutrient content in the lake waters thus increases and this serves as a good medium for the phyto-planktons and zoo-planktons and other macrophytic life forms in the lake waters.
3. Micro-climatic stabilisation – The lakes provide a very congenial environmental cooling effect in summers and a warming one during winters due to the large expanse of water surface. This is a very important function of the lakes.
4. Bio-diversity maintenance – This is another major function of the lake whereby the fresh water bio-diversity is maintained and also that in the Van Vihar.

LIST OF STAKEHOLDERS IN THE BHOJ WETLAND 1. The general population of the city – The large part of the benefits of the Bhoj Wetland
accrue to the general population including both direct and indirect benefits. 2. Fishermen / Boatmen / Trapa cultivators / Washermen (Dhobis) – These people
are dependant upon the Bhoj Wetland for their daily livelihood. The lakes form an integral part of their livelihood earning mechanisms.
3. Farmers – These people get the benefits of ground water recharging by the lake and so save a lot in costs.
4. State Government – It is a major stakeholder in the Bhoj Wetland since it is responsible for not only its management but is also the major policy maker as far as the Wetland is concerned.
5. Lake Front Property Owners – These are mainly the large hotels like the Jehanuma Palace, Lake View Ashoka, and the residential houses on Shyamla Hills and Koh-e-fiza. This land is considered to be prime property because of its proximity to the lake and the view that it provides.
6. National Park Authorities / Management – These are also a major stakeholder since the existence of the National Park is greatly dependant upon the Bhoj Wetland. There are conflicts because of the commercialisation of the lake by the State Government and the needs of the National Park.
7. Visitors – Though these are mainly part of the general population of Bhopal itself, (since the lake is a major attraction for the locals and not outsiders), they are taken as a separate sub-group since these people could give a more precise estimate of the value of the lake to him rather than an individual who has not visited the lake since a long time and has no intention of doing so either.