EEG-based Machine Learning Methods for Applications in Psychiatry Jim Reilly Gary Hasey Hubert de...
28
EEG-based Machine Learning Methods for Applications in Psychiatry Jim Reilly Gary Hasey Hubert de Bruin Ahmad Khodayari-R Duncan MacCrimmon ON Semiconductor, April 11, 2011
-
Upload
diana-mathews -
Category
Documents
-
view
231 -
download
0
Transcript of EEG-based Machine Learning Methods for Applications in Psychiatry Jim Reilly Gary Hasey Hubert de...
EEG-based Machine Learning Methods for Applications in Psychiatry
Jim ReillyGary HaseyHubert de BruinAhmad Khodayari-RDuncan MacCrimmon
ON Semiconductor, April 11, 2011
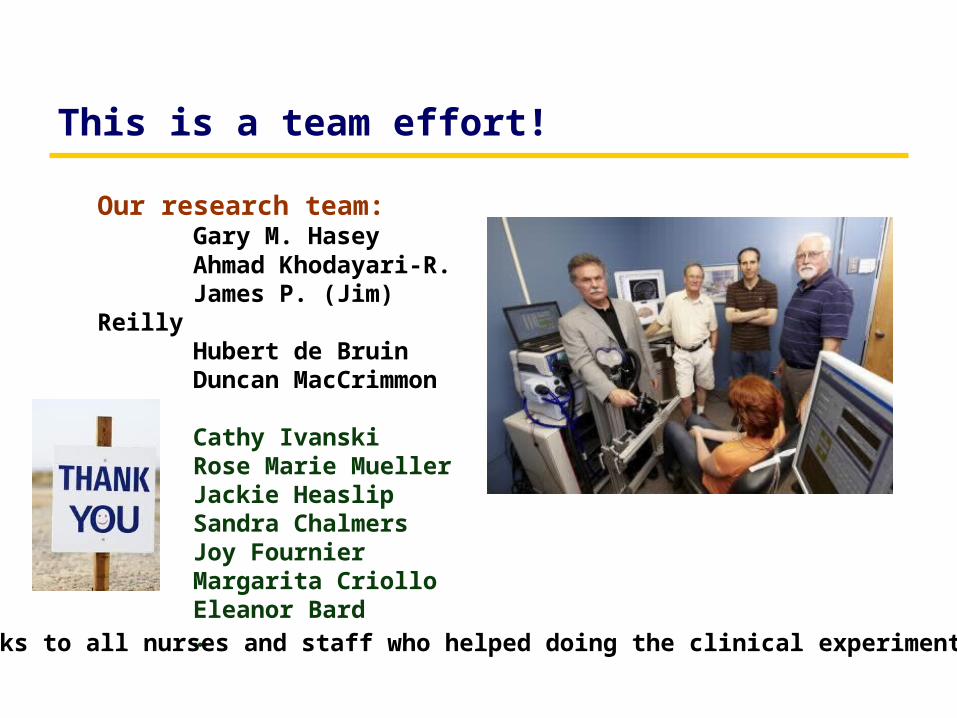
This is a team effort!
Our research team:Gary M. HaseyAhmad Khodayari-R.James P. (Jim) ReillyHubert de BruinDuncan MacCrimmon
Cathy IvanskiRose Marie MuellerJackie HeaslipSandra ChalmersJoy FournierMargarita CriolloEleanor Bard…
Thanks to all nurses and staff who helped doing the clinical experiments!
Outline
• Subject: Machine learning (ML) for prediction of response to psychiatric therapy
MotivationOverview of ML techniques
• Feature extraction• Feature selection/reduction• Classification• Validation
ResultsCommercial Potential
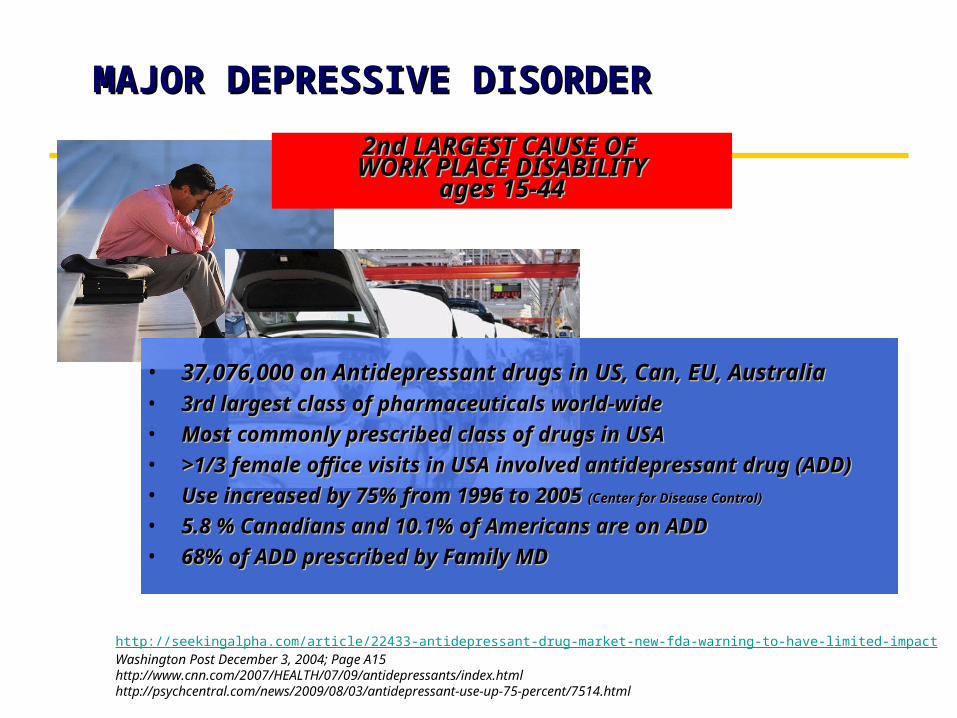
MAJOR DEPRESSIVE DISORDERMAJOR DEPRESSIVE DISORDER
2nd LARGEST CAUSE OF 2nd LARGEST CAUSE OF WORK PLACE DISABILITYWORK PLACE DISABILITY
ages 15-44ages 15-44
http://seekingalpha.com/article/22433-antidepressant-drug-market-new-fda-warning-to-have-limited-impactWashington Post December 3, 2004; Page A15http://www.cnn.com/2007/HEALTH/07/09/antidepressants/index.htmlhttp://psychcentral.com/news/2009/08/03/antidepressant-use-up-75-percent/7514.html
• 37,076,000 on Antidepressant drugs in US, Can, EU, 37,076,000 on Antidepressant drugs in US, Can, EU, AustraliaAustralia
• 3rd largest class of pharmaceuticals world-wide3rd largest class of pharmaceuticals world-wide• Most commonly prescribed class of drugs in USAMost commonly prescribed class of drugs in USA• >1/3 female office visits in USA involved antidepressant >1/3 female office visits in USA involved antidepressant
drug (ADD)drug (ADD)• Use increased by 75% from 1996 to 2005 Use increased by 75% from 1996 to 2005 (Center for Disease Control)(Center for Disease Control)
• 5.8 % Canadians and 10.1% of Americans are on ADD5.8 % Canadians and 10.1% of Americans are on ADD• 68% of ADD prescribed by Family MD68% of ADD prescribed by Family MD
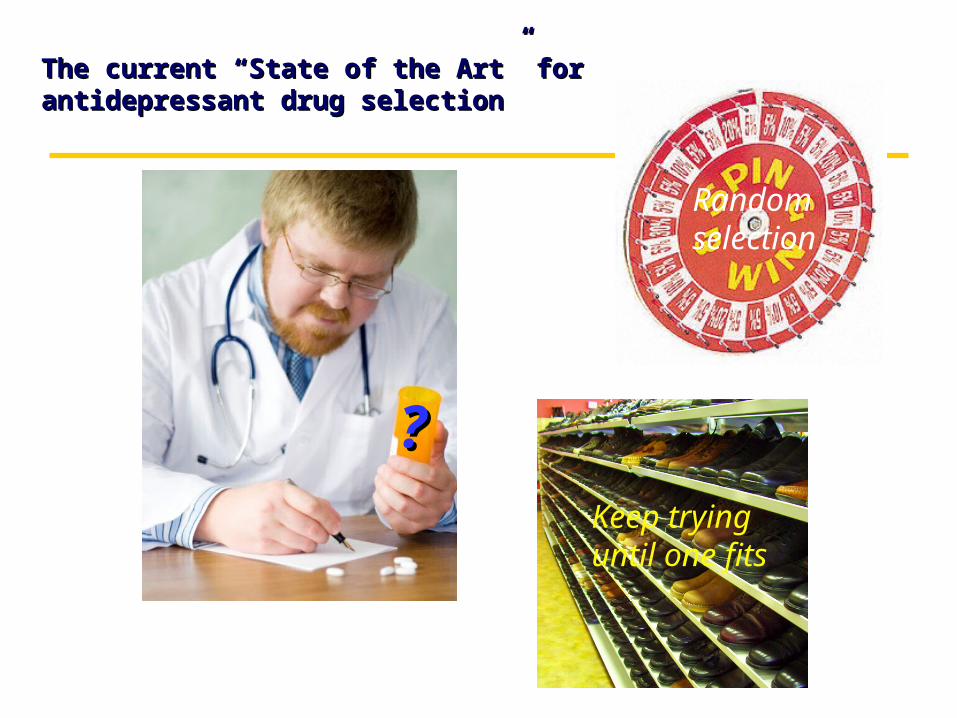
The current “State of the Art” for antidepressant drug The current “State of the Art” for antidepressant drug selectionselection
??Keep trying until one fits
Random selection
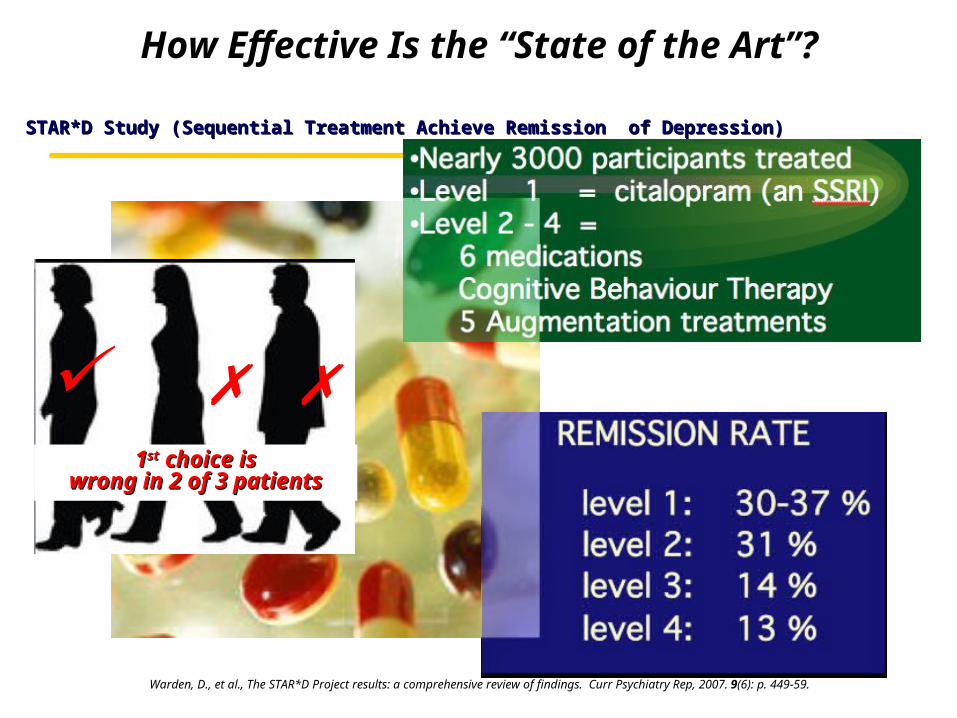
STAR*D Study (Sequential Treatment Achieve Remission of Depression)STAR*D Study (Sequential Treatment Achieve Remission of Depression)
Warden, D., et al., The STAR*D Project results: a comprehensive review of findings. Curr Psychiatry Rep, 2007. 9(6): p. 449-59.
How Effective Is the “State of the Art”?
✓✗ ✗11stst choice is choice is
wrong in 2 of 3 wrong in 2 of 3 patientspatients

COST OF ACHIEVING REMISSION
If Initial treatment works1 : $ 3,600
If initial treatment fails2 : $16,000
1) Baker, C. B. and S. W. Woods (2001). "Cost of treatment failure for major depression: direct costs of continued treatment." Administration and policy in mental health 28(4): 263-277 (1995 costs quoted adjusted for inflation).2) Malone, D. C. (2007). "A budget-impact and cost-effectiveness model for second-line treatment of major depression." J Manag Care Pharm 13(6 Suppl A): S8-18.
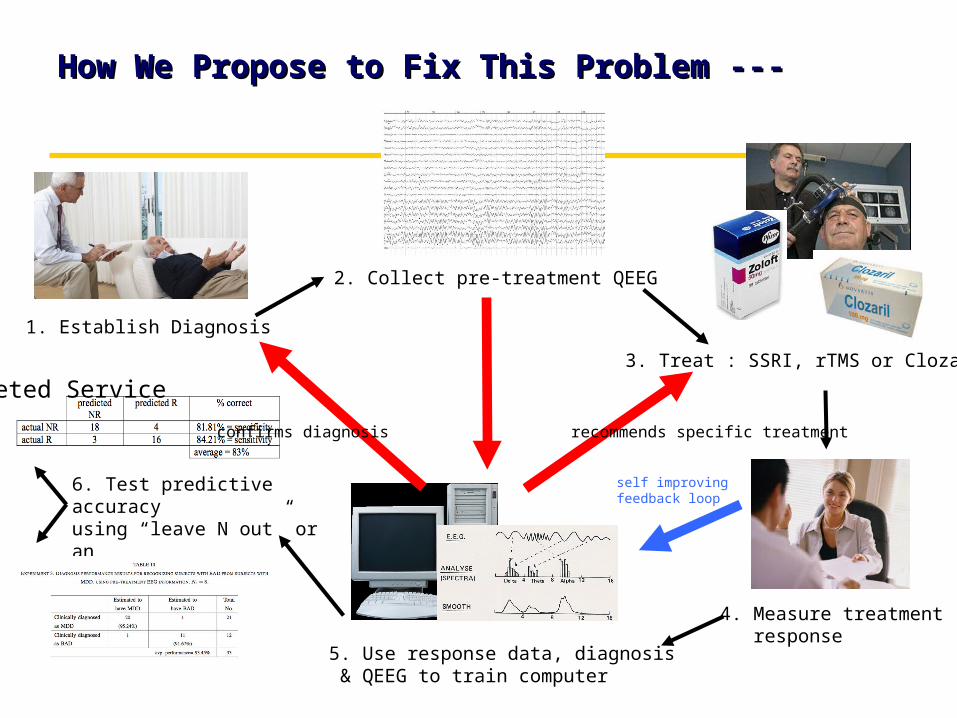
How We Propose to Fix This Problem ---How We Propose to Fix This Problem ---
2. Collect pre-treatment QEEG
5. Use response data, diagnosis & QEEG to train computer
4. Measure treatment response
1. Establish Diagnosis
3. Treat : SSRI, rTMS or Clozaril
6. Test predictive accuracyusing “leave N out” or anindependent sample
Marketed Service
confirms diagnosis recommends specific treatment
self improvingfeedback loop

Overview of the Prediction Procedure
22 Subjects were prescribed SSRI medication after pre-treatment EEG
• Response (R or NR) is recorded 6 weeks after onset of treatment.
• Responder is defined as 25% improvement in Hamilton Depression Rating Score
• Training Data: consists of subject EEG data and corresponding response value
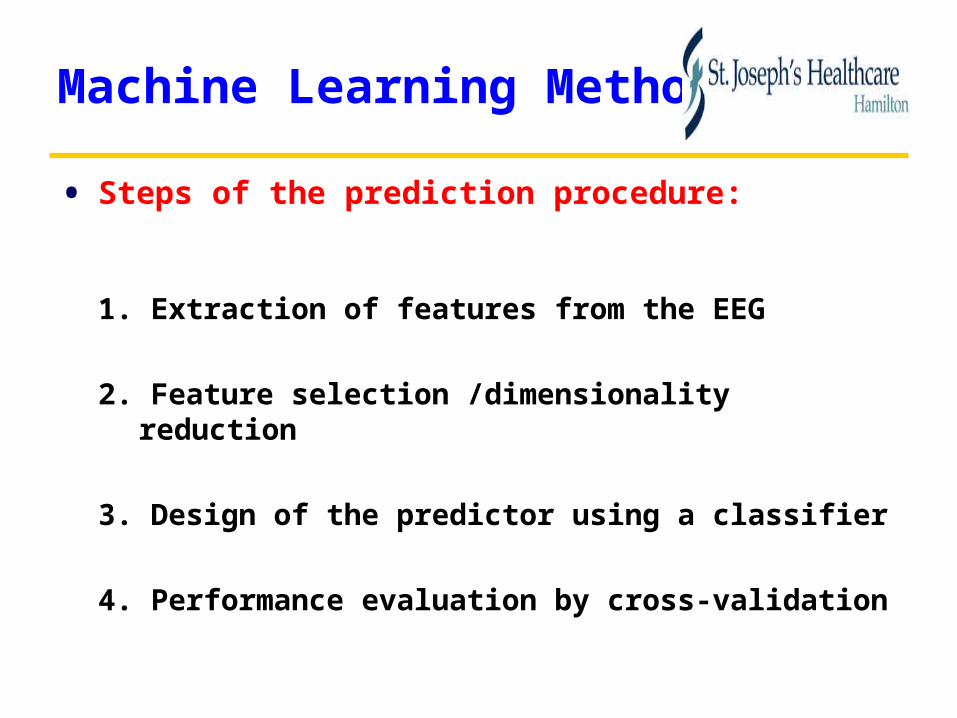
Machine Learning Method
• Steps of the prediction procedure:
1. Extraction of features from the EEG
2. Feature selection /dimensionality reduction
3. Design of the predictor using a classifier
4. Performance evaluation by cross-validation
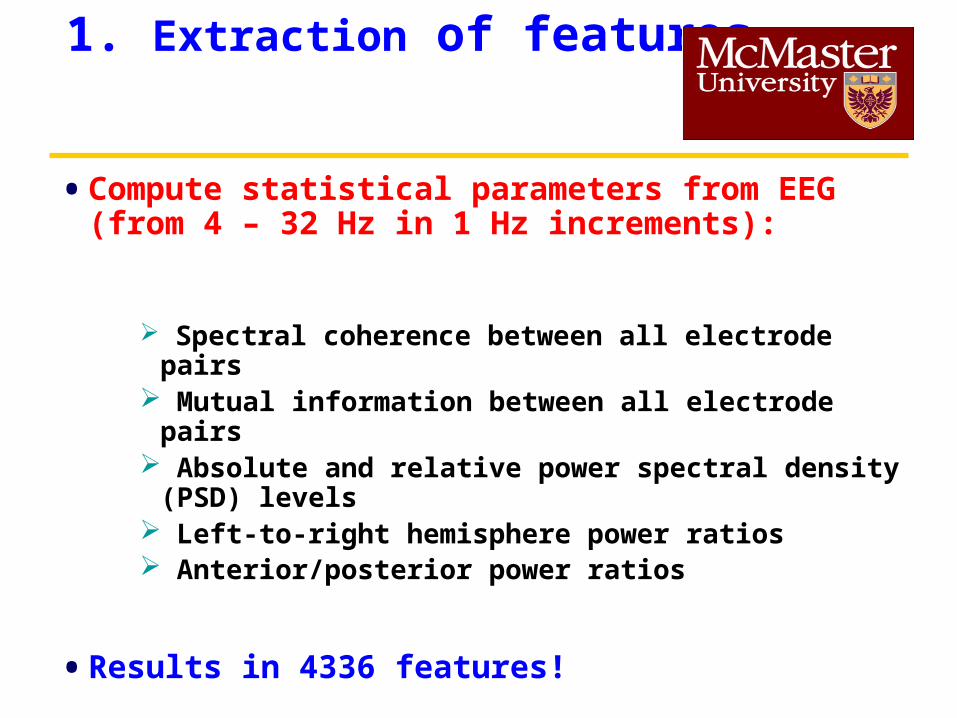
1. Extraction of features
• Compute statistical parameters from EEG (from 4 – 32 Hz in 1 Hz increments):
Spectral coherence between all electrode pairs Mutual information between all electrode pairs Absolute and relative power spectral density
(PSD) levels Left-to-right hemisphere power ratios Anterior/posterior power ratios
• Results in 4336 features!
2. Feature Selection
• the 4336 candidate features are highly correlated
• Most have no statistical dependence with the target variable (response)
• We select only those with most statistical relevance using a modified form of the method due to Peng2
2. H. Peng et al IEEE Trans PAMI Aug 2005
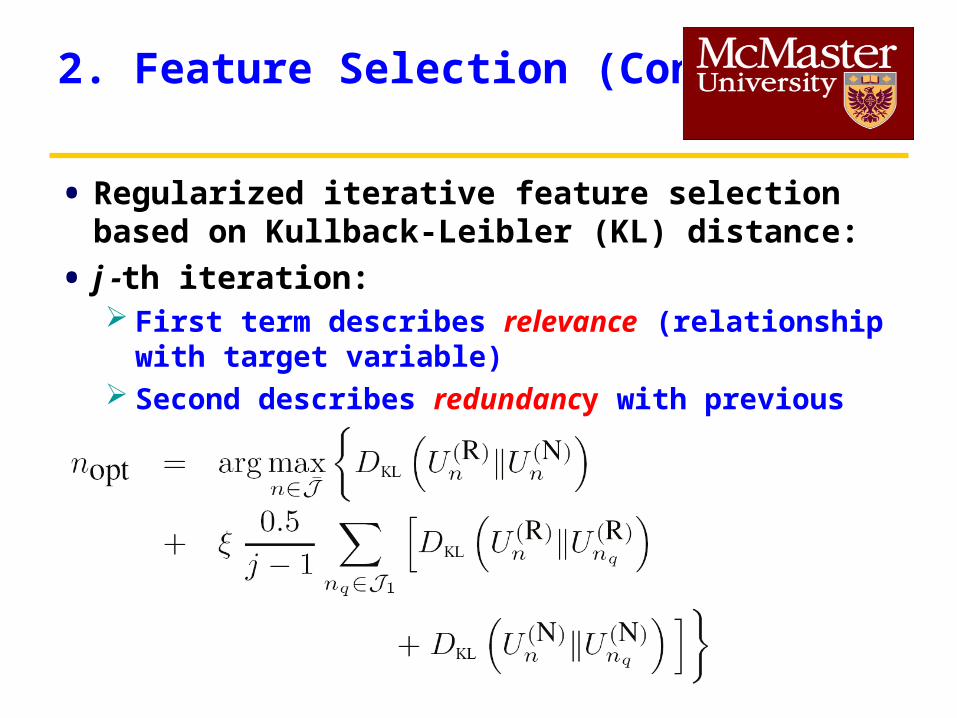
2. Feature Selection (Cont’d)
• Regularized iterative feature selection based on Kullback-Leibler (KL) distance:
• j -th iteration: First term describes relevance (relationship with target
variable) Second describes redundancy with previous features
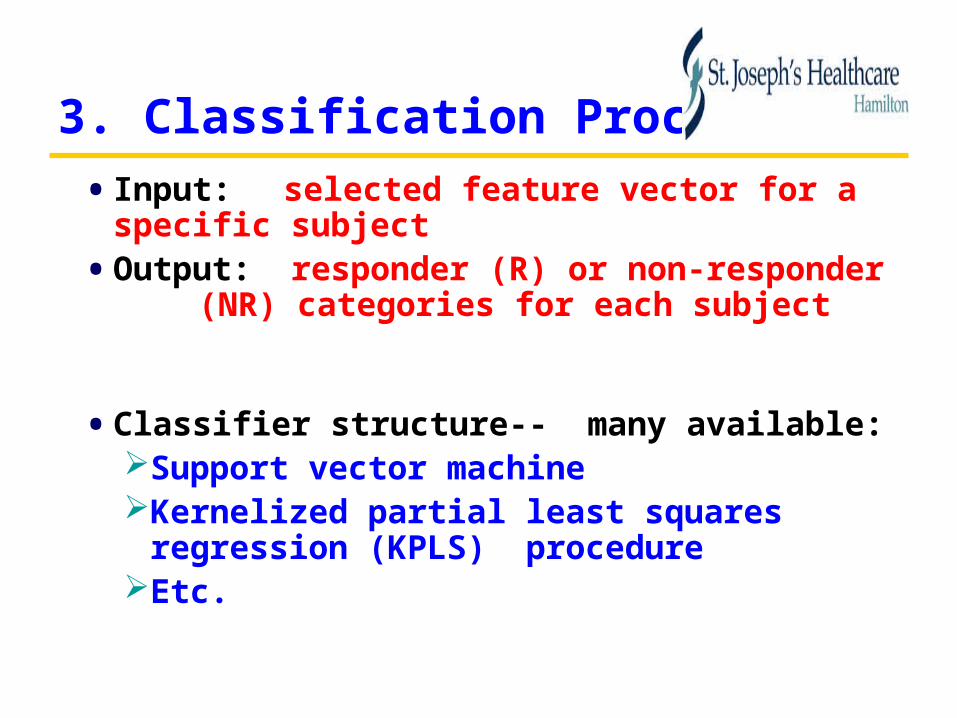
3. Classification Procedure
• Input: selected feature vector for a specific subject
• Output: responder (R) or non-responder (NR) categories for each subject
• Classifier structure-- many available:Support vector machineKernelized partial least squares regression
(KPLS) procedureEtc.
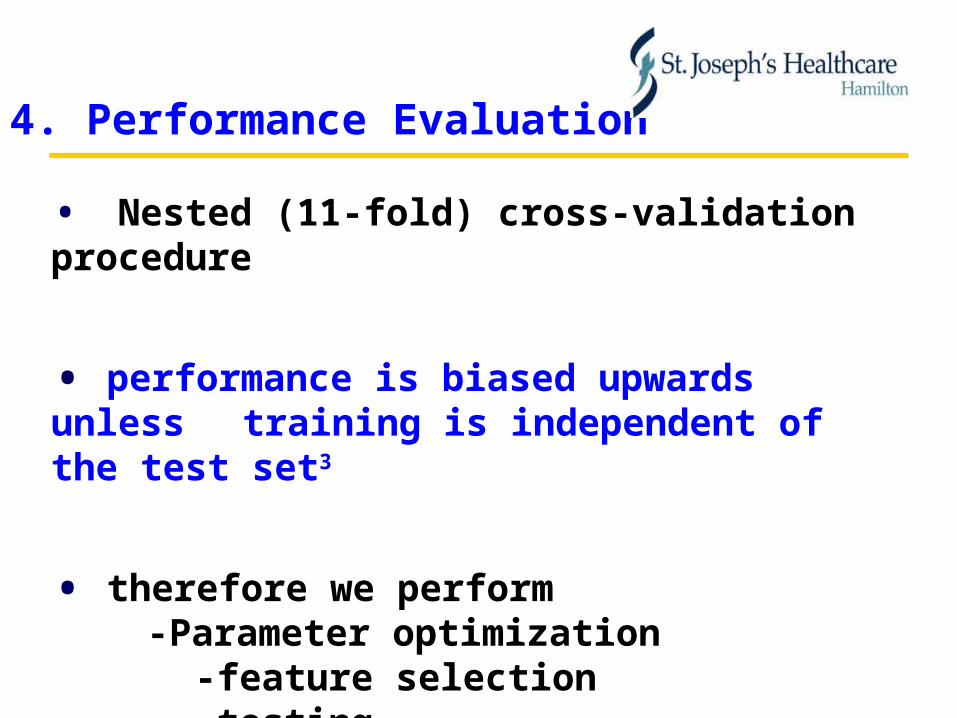
4. Performance Evaluation
• Nested (11-fold) cross-validation procedure
• performance is biased upwards unless training is independent of the test set3
• therefore we perform-Parameter optimization
-feature selection-testing
independently in each fold
[3] e.g., Hastie, Tibshirani and Friedman “The elements of Statistical learning”
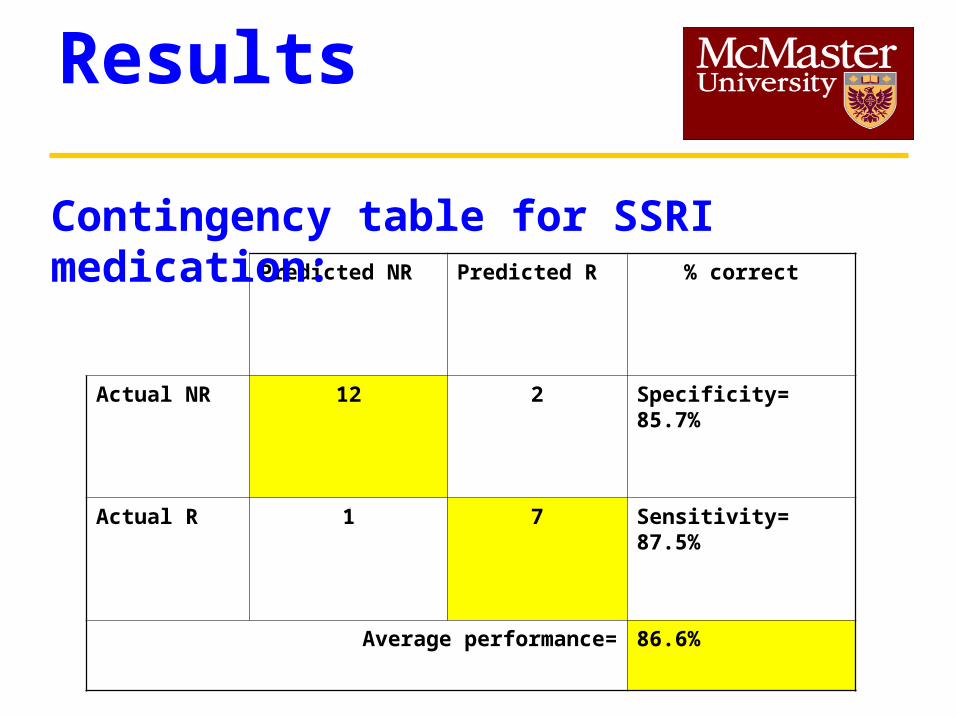
Results
Predicted NR Predicted R % correct
Actual NR 12 2 Specificity= 85.7%
Actual R 1 7 Sensitivity= 87.5%
Average performance= 86.6%
Contingency table for SSRI medication:
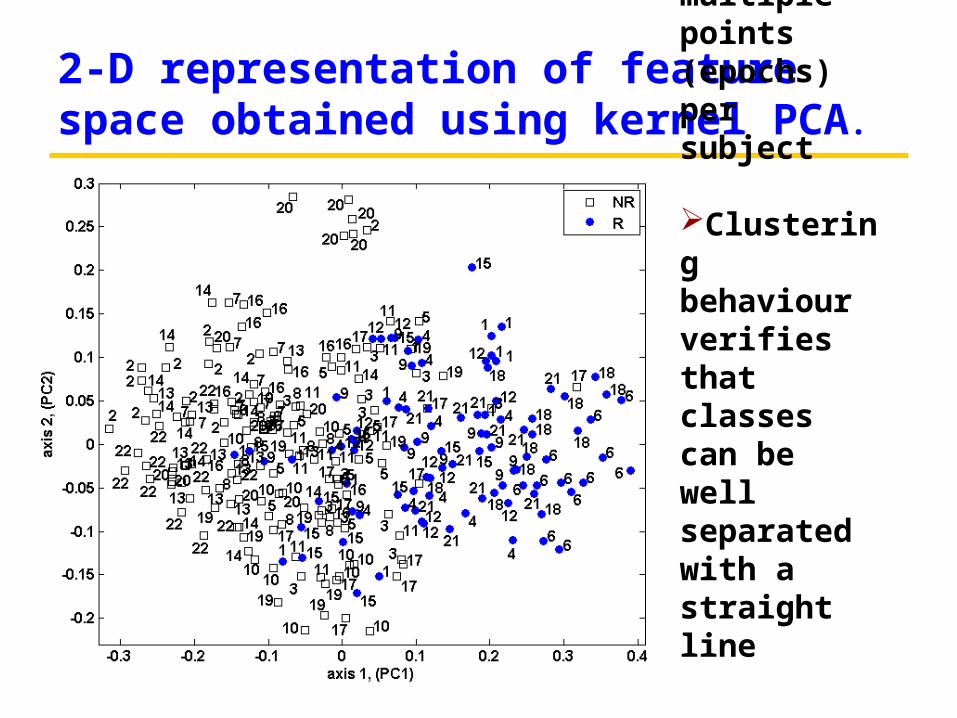
2-D representation of feature space obtained using kernel PCA.
multiple points (epochs) per subject
Clustering behaviour verifies that classes can be well separated with a straight line

2-D representation of scatter plot after averaging over available EEG epochs
Overfitting?• it is difficult to prove that the model has not
over-fit the data
• Rules of thumbComplexity of model (number of
parameters) should be small in comparison to number of training points
Test set must be independent of the training set
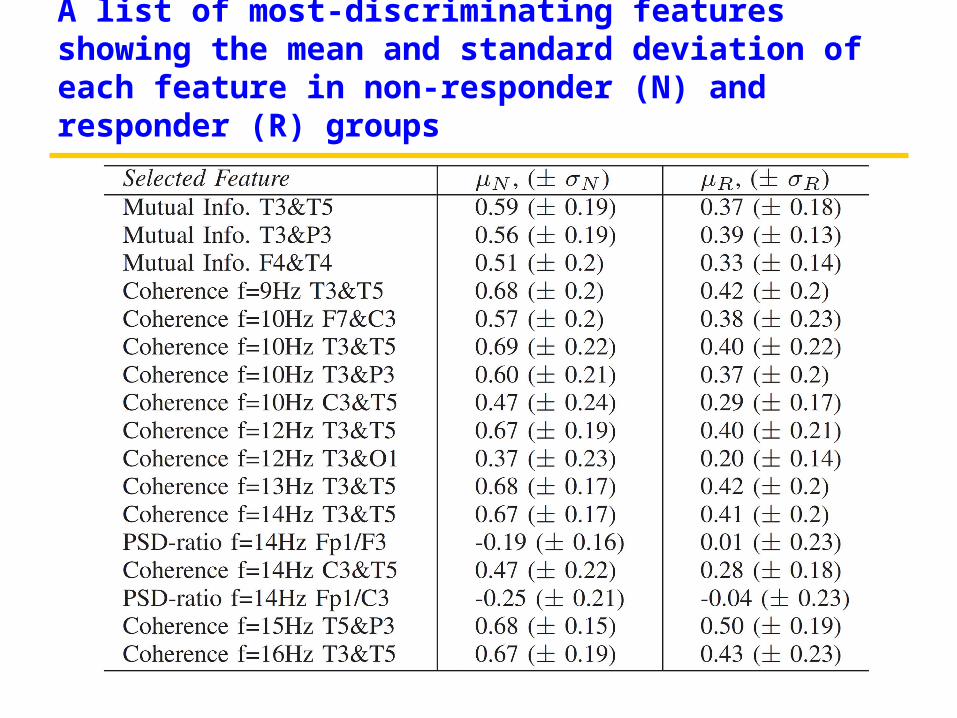
A list of most-discriminating features showing the mean and standard deviation of each feature in non-responder (N) and responder (R) groups
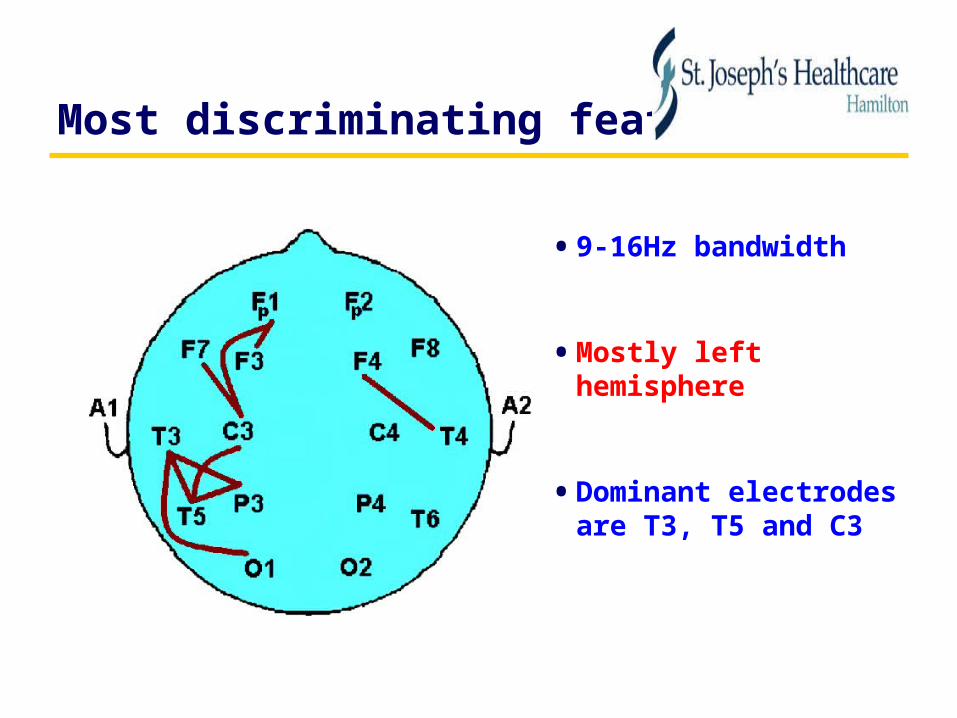
Most discriminating features
• 9-16Hz bandwidth
• Mostly left hemisphere
• Dominant electrodes are T3, T5 and C3
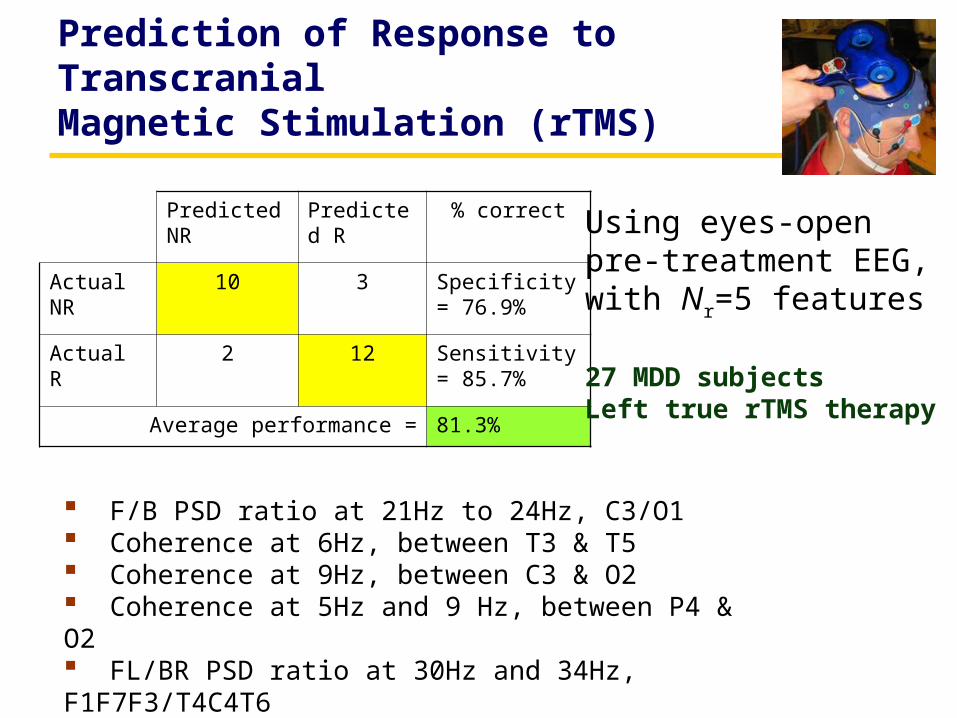
Prediction of Response to TranscranialMagnetic Stimulation (rTMS)
Predicted NR
Predicted R
% correct
Actual NR 10 3 Specificity= 76.9%
Actual R 2 12 Sensitivity= 85.7%
Average performance = 81.3%
Using eyes-openpre-treatment EEG, with Nr=5 features
27 MDD subjects Left true rTMS therapy
F/B PSD ratio at 21Hz to 24Hz, C3/O1 Coherence at 6Hz, between T3 & T5 Coherence at 9Hz, between C3 & O2 Coherence at 5Hz and 9 Hz, between P4 & O2 FL/BR PSD ratio at 30Hz and 34Hz, F1F7F3/T4C4T6 F/B PSD ratio at 6Hz, F7F3/P3O1
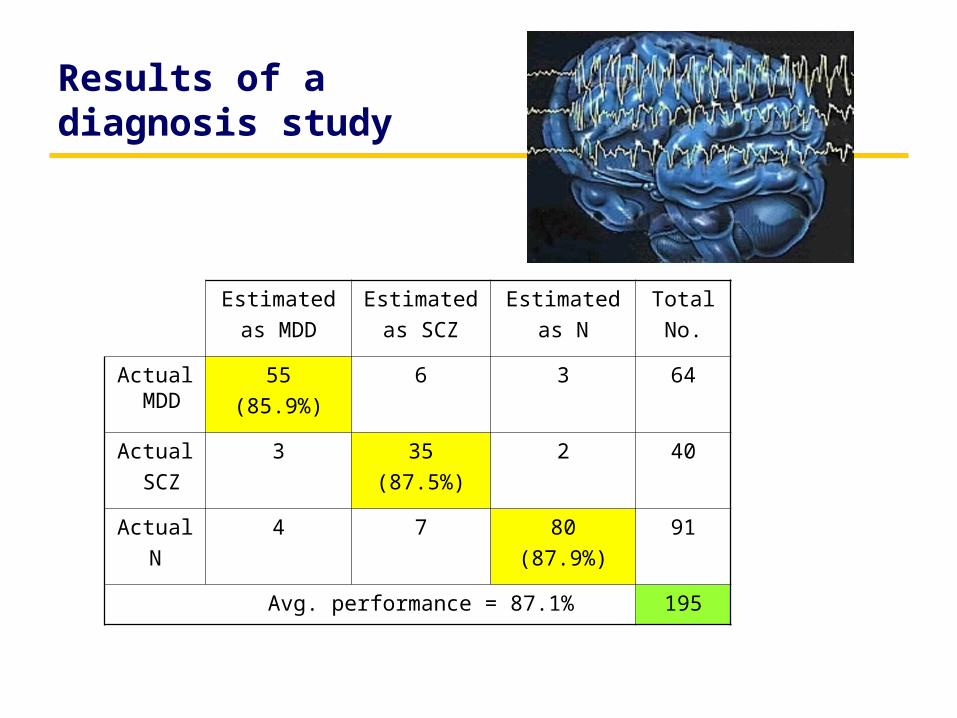
Results of a diagnosis study
Estimated
as MDD
Estimated
as SCZ
Estimated
as N
Total
No.
Actual MDD
55
(85.9%)
6 3 64
Actual
SCZ
3 35
(87.5%)
2 40
Actual
N
4 7 80
(87.9%)
91
Avg. performance = 87.1% 195
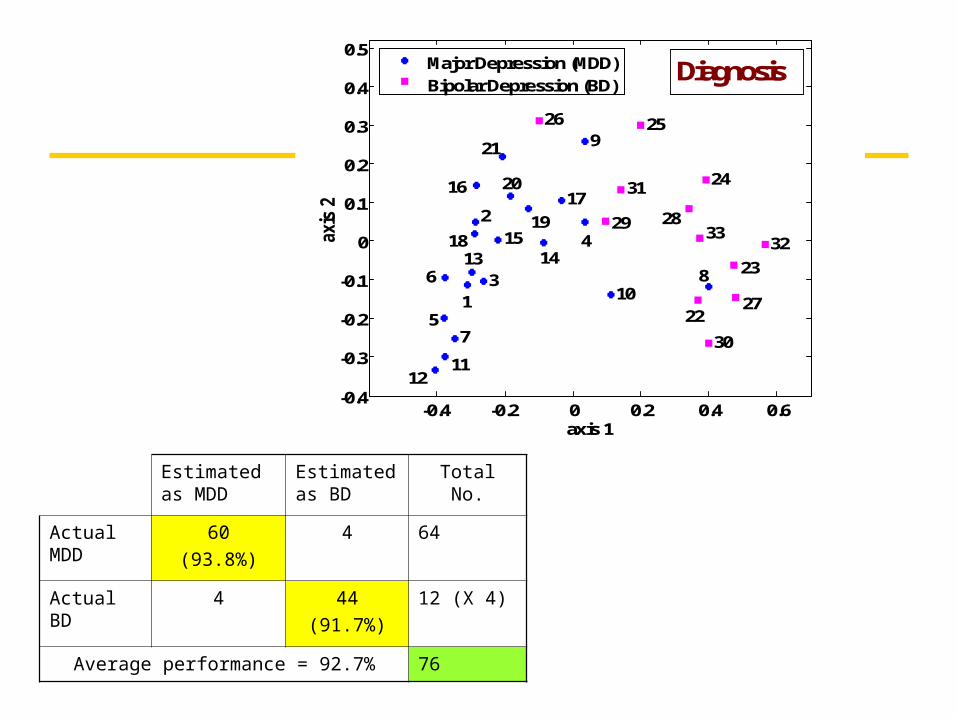
Estimated as MDD
Estimated as BD
Total No.
Actual MDD
60
(93.8%)
4 64
Actual BD 4 44
(91.7%)
12 (X 4)
Average performance = 92.7% 76
-0.4 -0.2 0 0.2 0.4 0.6-0.4
-0.3
-0.2
-0.1
0
0.1
0.2
0.3
0.4
0.5
1
2
3
4
5
6
7
8
9
10
1112
13 1415
1617
1819
20
21
22
23
24
2526
27
2829
30
31
3233
axis 1
axis
2
Major Depression (MDD)Bipolar Depression (BD)
Diagnosis
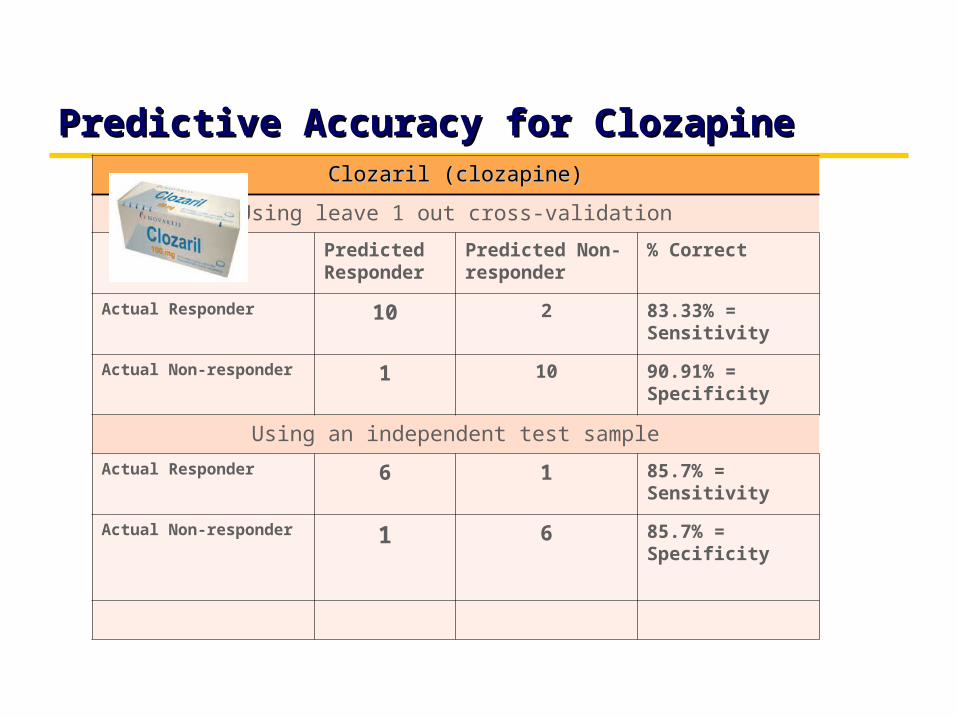
Predictive Accuracy for ClozapinePredictive Accuracy for ClozapineClozaril (clozapine)Clozaril (clozapine)
Using leave 1 out cross-validation
Predicted Responder
Predicted Non-responder
% Correct
Actual Responder 10 2 83.33% = Sensitivity
Actual Non-responder 1 10 90.91% = Specificity
Using an independent test sample
Actual Responder 6 1 85.7% = Sensitivity
Actual Non-responder 1 6 85.7% = Specificity
Plans for Commercialization
• The method is protected by patent applications
• We are currently in the process of gathering more training data to expand the number of medications, and increase quantity of training data
• A commercial partner is currently funding this effort
• Plans for starting our own company are currently underway
• Major market are the health care insurers in Canada, US and worldwide
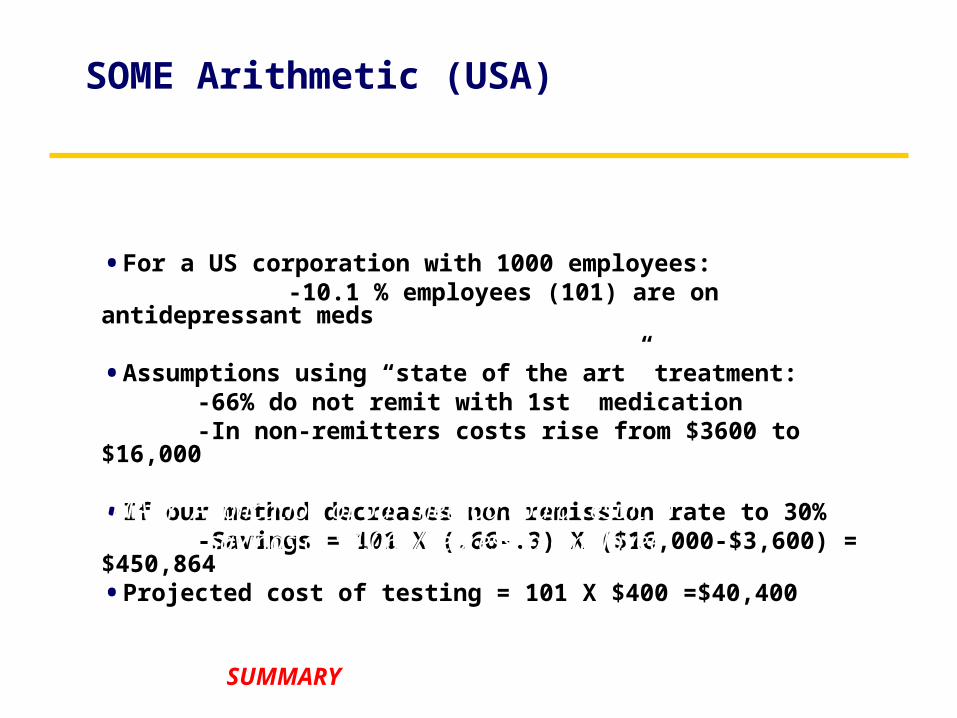
SOME Arithmetic (USA)
•For a US corporation with 1000 employees: -10.1 % employees (101) are on antidepressant meds
•Assumptions using “state of the art” treatment: -66% do not remit with 1st medication-In non-remitters costs rise from $3600 to $16,000
•If our method decreases non remission rate to 30%-Savings = 101 X (.66-.3) X ($16,000-$3,600) = $450,864
•Projected cost of testing = 101 X $400 =$40,400
SUMMARY: Application of our method could result in savings of $4,064/depressed employee
i.e. 11.1 X ROI
SUMMARY: Application of our method could result in savings of $4,064/depressed employee i.e. 11.1 X ROI
Discussion and ConclusionsOur results show it is possible to predict response
A surprising result is that a set of discriminating predictive EEG features for prediction do exist
The proposed methodology can result in significantly reduced times to remission
Neurological significance? -- selected features are mostly left temporal and alpha/high-beta band
previous work has identified a subset of the features identified in this study