EEEEEEEEEEohEEIEEEIIIIIIIIIE EEllEEEEEEEllE … · 2.4.2 Cantilever Bending: D2 ... APPENDIX B....
136
AD-Ai73 683 ON THE SUCKLIN 4 OF SANDWICH REAMS CONTAINING AN 1/2 UNBONDED REGION(U) AIR FORCE INST OF TECH WRIGHT-PATTERSON AFA OH C J FRUSHON KAY 86 UNCLASSIFIED AFIT/CI/NR-8 6-185T NFF-83-52370 F/G 11/6 L EEllEEll.EEll EllEEEEllEElEl EEEEEEEEEEohEE IEEEIIIIIIIIIE EEllEEEEEEEllE EIIEEEEIIIIIE-
Transcript of EEEEEEEEEEohEEIEEEIIIIIIIIIE EEllEEEEEEEllE … · 2.4.2 Cantilever Bending: D2 ... APPENDIX B....

AD-Ai73 683 ON THE SUCKLIN 4 OF SANDWICH REAMS CONTAINING AN 1/2UNBONDED REGION(U) AIR FORCE INST OF TECHWRIGHT-PATTERSON AFA OH C J FRUSHON KAY 86
UNCLASSIFIED AFIT/CI/NR-8 6-185T NFF-83-52370 F/G 11/6 L
EEllEEll.EEllEllEEEEllEElElEEEEEEEEEEohEEIEEEIIIIIIIIIEEEllEEEEEEEllEEIIEEEEIIIIIE-

231
11 11 1 10I1

10AD-A173 603
ON THE BUCKLING OF SANDWICH BEAMS
CONTAINING AN UNBONDED REGION D T ICby GELECTE
Carl Joseph Frushon, B.S. S0V 4 MOD
THESIS
Presented to the Faculty of the Graduate School of
The University of Texas at Austin
in Partial Fulfillment
of the Degree of
Master of Science in Engineering
JLAr y"Aif public relecg I
W.J THE UNIVERSITY OF TEXAS AT AUSTIN
~i'" May 1986
" G I/ 9 Oc~l" " , . ., " ' ' - " * ' -% " " " " " ' *, . , - , ,

SECURITY CLASSIFICATION OF THIS PAGE (W~hen Date Fnerd ____________________
REPORT DOCUMENTTI0" PAGE READ INSTRUCTIONS_______________________________________ ____ BEFORECOMPLETINGFORM
1. REPORT NUMBER 2. , GOVT4 No. 3.RCPET CTLGNME
AFIT/CI/NR 86- 185T 3. REIIN'ATLGNME
4. TI TL E (and Subtitle) 5. TYPE OF REPORT & PERIOD COVERED
on The Buckling Of Sandwich BeaRns THESIS/DYSWAtIkIA/Containing An Unbonded Region_____________
6. PERFORMING ORG. REPORT NUMBER
7. AUTHOR(S) S. CONTRACT OR GRANT NUMBER(s)
Carl Joseph Frushon
9. PERFORMING ORGANIZATION NAME AND ADDRESS 10. PROGRAM ELEMENT. PROJECT. TASKAREA & WORK UNIT NUMBERS
AFIT STUDENT AT: The University of Texas
1I. CONTROLLING OFFICE NAME AND ADDRESS 12. REPORT DATE1986
13. NUMBER OF PAGES
11714. MONITORING AGENCY NAME & ADDRESS(if different front Controlling Office) I5. SECURITY CLASS. (of this report)
UNCLASS
15a. DECLASSIFICATION" DOWNGRADINGSCHEDULE
16. DISTRIBUTION STATEMENT (of this Report)
APPROVED FOR PUBLIC RELEASE; DISTRIBUTION UNLIMITED
17. DISTRIBUTION STATEMENT (of the abstract entered in Block 20, it different from Report)
~1.18. SUPPLEMENTARY NOTES ococ4A4
APPROVED FOR PUBLIC RELEASE: lAW AFR 190-1 Dean for ResarcKan
Professional DevelopmentAFIT/NR
19. KEY WORDS (Continue on reverse side if necensery and identify by block number)
20. ABSTRACT (Continue on reverst, side If necessary and identify by block number)
.5ATTACHED..
D D IJAN 73 1473 EDITION OF I NOV 65 IS OBSOLETE
SECURITY CLASSIFICATION 0 -W+11AGE (Wl,irn Data Entered)
1 ~y

ABSTRACT
This study involves a combined experimental and analytical
analysis of the stability of a sandwich beam '(overall length of
16.5 inches) with a partially unbonded faceplate. For simplicity,
the beam considered was simply supported. Fully bonded beams as
well as beams with unbonded lengths ranging from 0.5 to 5.0 inches
were tested.
Two failure regimes were observed. A distinct collapse
load was evident in experiments with short unbond lengths ( : 2.0
inches). The loading histories of beams with longer unbond lengths
( 3.0 inches) were found to be characterized by a limit load. In
all cases, a transition from a symmetric to a nonsymmetric buckling
shape occurred. The presence of the unbonded region was found -to
drastically reduce the load-carrying capacity of the sandwich
structure. A power-law relationship was found between the unbond
length and maximum load.
The unbonded sandwich beam was modeled as an assembly of
three beams. This structure was assumed to be initially
geometrically perfect. A solution was found numerically and began
when the load within the unbonded faceplate was greater than the
Euler buckling load for that section. Limit loads were predicted
for all unbond lengths. The model was found to predict the
failure load of a sandwich beam (unbond lengths > 2.0 inches) to
within 12.5%.
Possible improvements and extensions of both the
experimental and analytical aspects of the investigation were
discussed.
iv
d4 'N N
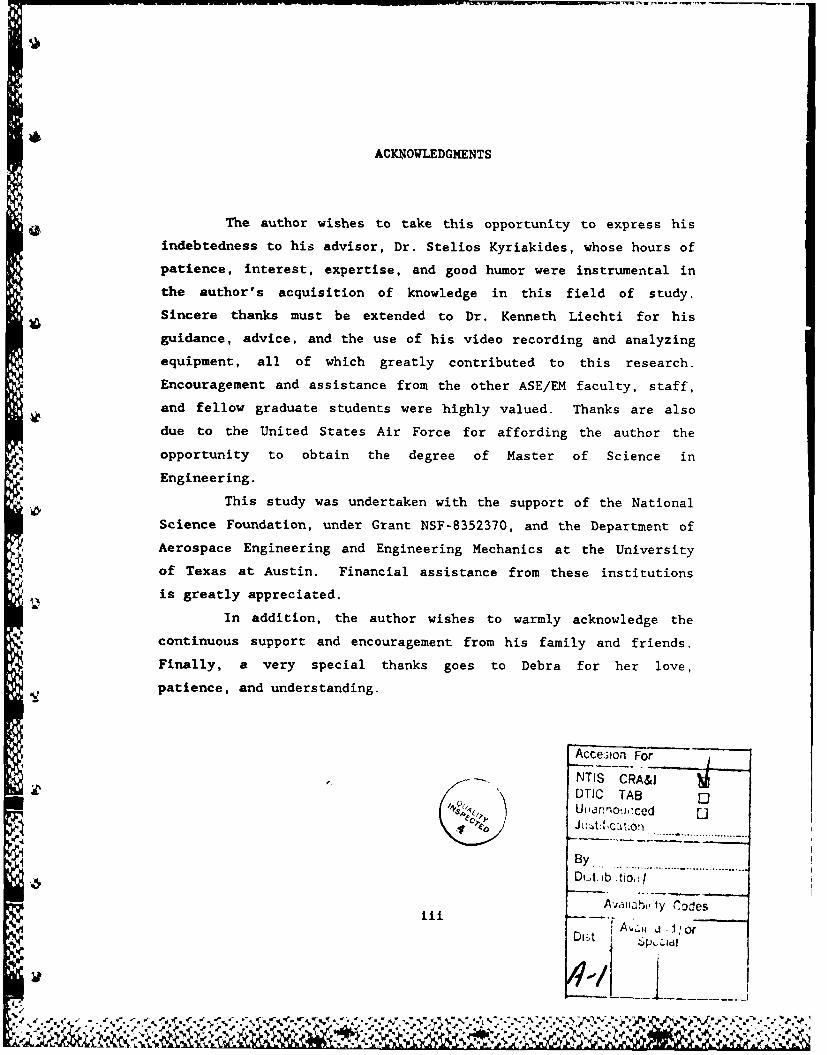
6ACKNOWLEDGMENTS
The author wishes to take this opportunity to express his
indebtedness to his advisor, Dr. Stelios Kyriakides, whose hours of
patience, interest, expertise, and good humor were instrumental in
the author's acquisition of knowledge in this field of study.
Sincere thanks must be extended to Dr. Kenneth Liechti for his
guidance, advice, and the use of his video recording and analyzing
equipment, all of which greatly contributed to this research.
Encouragement and assistance from the other ASE/EM faculty, staff,
and fellow graduate students were highly valued. Thanks are also
due to the United States Air Force for affording the author the
opportunity to obtain the degree of Master of Science in
Engineering.
*This study was undertaken with the support of the National
Science Foundation, under Grant NSF-8352370, and the Department of
Aerospace Engineering and Engineering Mechanics at the University
of Texas at Austin. Financial assistance from these institutions
is greatly appreciated.
In addition, the author wishes to warmly acknowledge the
continuous support and encouragement from his family and friends.
Finally, a very special thanks goes to Debra for her love,
patience, and understanding.
Acce;ion ForNTIS CRA&,DTIC TAB 0
U,,arino-,wced
By...... ...........B y .. .... .......... ....................
D .. ib .tioi
AXajiabi, ly Codes
D 7Ait i -.J.I o
.J1 4.r . %" %" , ..- . - -.. . ... .-.

ABSTRACT
"'This study involves a combined experimental and analytical
analysis of the stability of a sandwich beam (overall length of
16.5 inches) with a partially unbonded faceplate. For simplicity,
the beam considered was simply supported. Fully bonded beams as
well as beams with unbonded lengths ranging from 0.5 to 5.0 inches
were tested. > c z <or =
Two failure regimes were observed. A distinct collapse
load was evident in experiments with short unbond lengths ( < 2.0
inches). The loading histories of beams with longer unbond lengths
( > 3.0 inches) were found to be characterized by a limit load. In
all cases, a transition from a symmetric to a nonsymmetric buckling
shape occurred. The presence of the unbonded region was found to
drastically reduce the load-carrying capacity of the sandwich
structure. A power-law relationship was found between the unbond
length and maximum load.
The unbonded sandwich beam was modeled as an assembly of
three beams. This structure was assumed to be initially
geometrically perfect. A solution was found numerically and began
when the load within the unbonded faceplate was greater than the
Euler buckling load for that section. Limit loads were predicted
for all unbond lengths. The model was found to predict the
failure load of a sandwich beam (unbond lengths > 2.0 inches) to
within 12.5%. or =_
Possible improvements and extensions of both the
experimental and analytical aspects of the investigation were
discussed.
iv
. . . .4
. . .. ... * ,-

TABLE OF CONTENTS
ACKNOWLEDGMENTS.................................................. iii
ABSTRACT ...........................................................1iv
TABLE OF CONTENTS.................................................. v
NOMENCLATURE...................................................... ix
LIST OF TABLES.................................................... xi
LIST OF FIGURES.................................................. xii
1. INTRODUCTION................................................1I
1.1 DEFINITION OF A SANDWICH STRUCTURE ................... 1
1.2 SANDWICH STRUCTURE APPLICATIONS .......................3
1.3 SANDWICH STRUCTURE PROBLEM AREAS ..................... 4
1.4 PURPOSE OF THIS RESEARCH .............................. 5
2. EXPERIMENTAL PROCEDURE...................................... 6
2.1 SPECIMEN DESIGN...................................... 6
2.1.1 Faceplate Yielding ............................. 7
2.1.2 Intra-cell Dimpling ............................ 7
2.1.3 Shear Crimping ................................. 8
2.1.4 Faceplate Wrinkling ............................ 8
2.1.5 Overall Buckling ............................... 9
2.1.6 Sandwich Beam Geometry ....................... 10
2.2 DESIGN OF BEAM SUPPORTS .............................. 11
2.3 SPECIMEN FABRICATION ................................. 12
2.3.1 Component Preparation ......................... 12
V

Page
a. Aluminum 2024-T3 Faceplates ............ 12b. Aramid Fiber Reinforced
Honeycomb Core ......................... 12c. Film Adhesive .......................... 13
- 2.3.2 Beam Assembly ................................ 13
2.3.3 Curing Cycle ................................. 14
2.3.4 Attachment of End Fixtures ................... 14
2.3.5 Preparation of the Unbond for theShadow-moire Method .......................... 15a
2.4 MEASUREMENT OF FLEXURAL RIGIDITIES .................. 15
2.4.1 Four-Point Bending: D1 . . . .. . . . . . . .. . . .. . ... 15
2.4.2 Cantilever Bending: D2 . . .. . . . .. . . .. . . . .. . . . ..17
2.5 OTHER PROPERTY MEASUREMENTS ......................... 18
2.5.1 Shear Stress Shape Factor .................... 18
2.5.2 Modulus of Aluminum 2024-T3 .................. 19
2.5.3 Modulus of FM-300 Adhesive ................... 19
2.6 EXPERIMENTAL APPARATUS .............................. 19
2.6.1 The Testing Machine .......................... 20
2.6.2 Specimen Loading Configuration ............... 21
2.6.3 Measuring Instrumentation .................... 21
2.7 EXPERIMENT EQUIPMENT PREPARATION .................... 22
3. EXPERIMENTAL RESULTS ...................................... 24
3.1 LOADING HISTORY ..................................... 24
3.2 EXPERIMENTAL MEASUREMENTS ........................... 25
3.2.1 Load versus Stroke Displacement .............. 25
3.2.2 Load versus W3. Displacement ................. 26
3.2.3 w3(x) Displacement Shapes fromthe Shadow-moire Method ...................... 26
3.2.4 Maximum Load versus Unbond Length ............ 28
3.3 SPECIMEN FAILURE OBSERVATIONS ....................... 29
vi

4
Paa
3.3.1 Fully Bonded Specimens ....................... 29
3.3.2 Specimens with an Unbonded Faceplate......... 29
3.3.3 Imperfect Specimens.......................... 30
4. AN ANALYTICAL MODEL FOR THE BUCKLING OFUNBONDED SANDWICH BEAMS ................................... 32
4.1 PROBLEM FORMULATION ................................. 32
4.2 NUMERICAL SOLUTION USING NEWTON'S METHOD ............ 36
4.3 SIMPLIFIED MODEL .................................... 36
4.4 COMPARISON OF ANALYTICAL MODELS ..................... 38
5. COMPARISON OF EXPERIMENTAL AND THEORETICAL RESULTS ........ 40
5.1 COMPARISON OF BUCKLING AND FAILURE LOADS ............ 40
5.1.1 Load versus Axial displacement ............... 41
a. Fully Bonded Sandwich Beams .............. 41b. Sandwich Beams with Short
Unbonded Regions ......................... 41c. Sandwich Beams with Long
Unbonded Regions ......................... 42
5.1.2 Load versus W30 Displacement ................. 42
5.2 QUALITATIVE DISCUSSION OF BUCKLING SHAPES ........... 43
5.3 MAXIMUM LOAD VERSUS UNBOND LENGTH ................... 43
5.4 CRITICAL BENDING MOMENTS ............................ 44
6. CONCLUDING REMARKS ........................................ 46
6.1 EXPERIMENTAL FINDINGS ............................... 46
6.2 ANALYTICAL FINDINGS ................................. 48
6.3 EXPERIMENTAL/ANALYTICAL IMPROVEMENTSAND EXTENSIONS ...................................... 49
APPENDIX A. FLEXURAL RIGIDITY CALCULATIONS ...................... 51
APPENDIX B. FAILURE CRITERIA DERIVATIONS ........................ 54
vii

REFERENCES........................................................ 58
TABLES............................................................ 62
FIGURES........................................................... 69
VITA............................................................. 117
Jl
Iviii
ljl ' 11 1 Jill N U
Jill.

NOMENCLATURE
b beam width
c core thickness
D flexural rigidity
Di flexural rigidity of beam section i - 1, 2, 3
da c + t a
df c + tf
Ea Young's Modulus of the adhesive
Ec Young's Modulus of the core (through the thickness)
Ef Young's Modulus of the faceplate
GW core shear modulus
h sandwich beam thickness
Ia adhesive 2nd moment of area
If faceplate 2nd moment of area
kc elastic foundation stiffness
L beam length
Lo 0test specimen length (L + 1r)
1 critical wrinkling half-wavelength
ii length of beam section i - 1, 2, 3
Ir length of end fixture
M moment
Mi moment of beam section i - 1, 2, 3
N load
NB critical buckling load
NC critical shear crimping load
ND critical intra-cell dimpling load
NE Euler buckling load
NS shear component of buckling
NW critical faceplate wrinkling load
NY critical faceplate yielding load
ix
N .

P axial load (Nb)
P i axial load in beam sections i - 1, 2, 3
r distance from faceplate/adhesive interface to neutralaxis of beam section 2
S cell diameter of hexagonal honeycomb core
ta adhesive thickness
tf faceplate thickness
Ui load in beam section i - 1, 2, 3 (normalized by thefirst Euler buckling load for a clamped-clamped beam)
V shear force
W30 deflection of unbonded faceplate mid-point
w out-of-plane deflections along z-axis
wb deflections due to bending
w i displacements of beam section i - 1, 2, 3along z-axis
, ws deflections due to shear
xi coordinates of beam section i - 1, 2, 3
Q critical dimpling load constant
Oshear stress shape factor
Y shear strain
A axial displacement of beam ends
6 deflection of the interface from the unloaded position
6 deflection of the end fixture from the unloaded state0
e beam slope at the interface of the unbond
00 beam slope at the interface of the end fixture
V Poisson's ratio
P density of the core
a normal stress
Cy yield stress (0.2% strain offset)ytshear stress
x
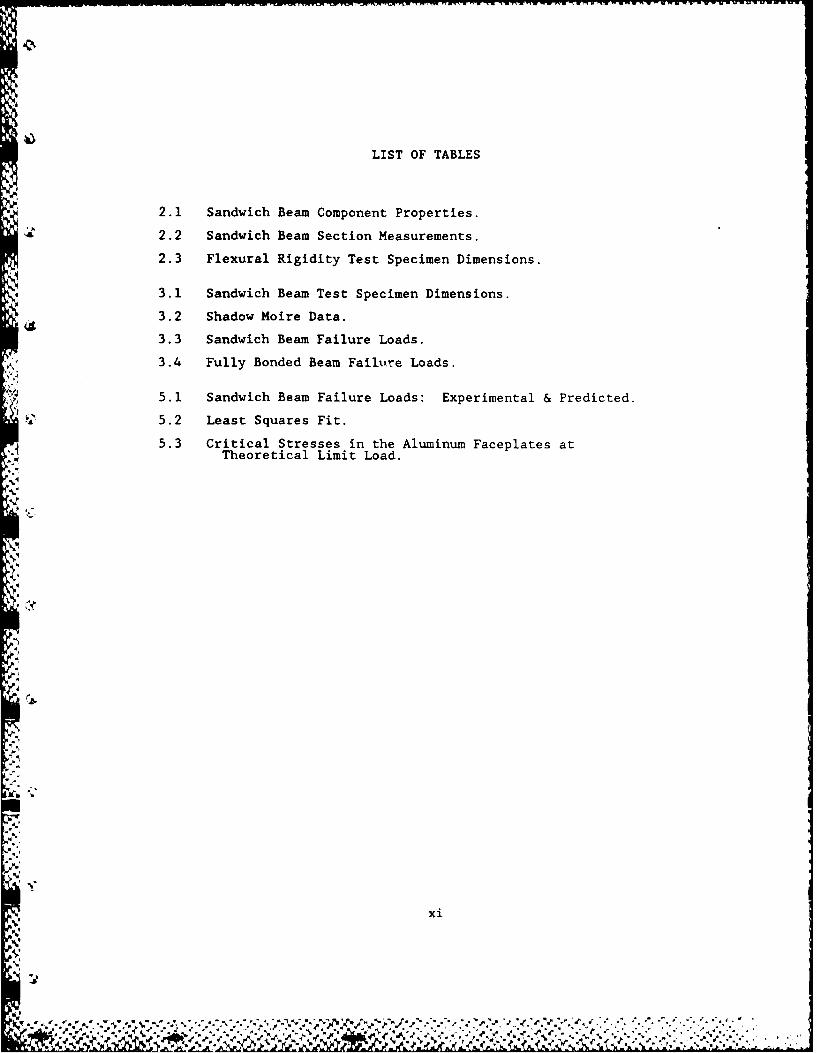
LIST OF TABLES
2.1 Sandwich Beam Component Properties.
2.2 Sandwich Beam Section Measurements.
2.3 Flexural Rigidity Test Specimen Dimensions.
3.1 Sandwich Beam Test Specimen Dimensions.
3.2 Shadow Moire Data.
3.3 Sandwich Beam Failure Loads.
" 3.4 Fully Bonded Beam Failure Loads.
5.1 Sandwich Beam Failure Loads: Experimental & Predicted.
5.2 Least Squares Fit.
5.3 Critical Stresses in the Aluminum Faceplates atTheoretical Limit Load.
xi
.','.': .". ,. ',.' '..''',':':''.>' '' ,* . " ' .'''..";, ,. . '. ." . ./ ,'•."• -' " "" -.' ""...'(%

LIST OF FIGURES
1.1 Sandwich Beam Construction.
2.1 Sandwich Beam Lay-up and Geometric Parameters.
2.2 Sandwich Beam Failure Modes.
2.3 Faceplate Yielding Load versus Faceplate Thickness.
2.4 Critical Dimpling Load versus Faceplate Thickness.
2.5 Critical Shear Crimping Load versus Core Thickness.
2.6 Critical Wrinkling Load versus Faceplate Thickness.
2.7 Critical Overall Buckling Load versus Beam Length.
2.8 Failure Criteria Plot: c - 0.457 in. (3 beam lengths)
2.9 Failure Criteria Plot: c - 0.506 in. (3 beam lengths)
2.10 Mechanical Drawing of Simple-Support End Fixtures.
2.11 Schematic of Specimen and End Fixture Assembly.
2.12 Specimen Components prior to Assembly.
2.13 Heated Platen Press Used for Curing the Sandwich Structure.
2.14 Adhesive Temperature Curing Cycle.
2.15 Cured Specimen Prior of Attachment of End Fixtures.
2.16 Sandwich Beam Four-Point Bending.
2.17 Sandwich Beam Cantilever Bending.
2.18 Three-Point Bending Schematic.
2.19 MTS Equipment Arrangement.
2.20 Experimental Equipment & Data Recording Schematic.
2.21 Arrangement of the LVDT Displacement Transducers.
2.22 Moire Equipment Arrangement.
2.23 Shadow Moire Schematic.
2.24 Arrangement of the Moire Grating Plate.
2.25 Video Recording and Analyzing Apparatus.
3.1 Load versus Axial Displacement: (Lu from 0.0 to 0.5 in.)
3.2 Load versus Axial Displacement: (Lu from 1.0 to 5.0 in.)
xii
MA4.-1

3.3 Load versus W3. Displacement.
3.4 Fringe Patterns of an Unbonded Faceplate atDifferent Loads. (Lu - 5.0-in.)
3.5 Light Intensity versus Scan Displacement for FringePatterns Shown in Figure 3.4.
3.6 Unbond Faceplate Out-Of-Plane Deflection Shapesversus Axial Load: (Lu - 1.0 in.)
3.7 Unbond Faceplate Out-Of-Plane Deflection Shapesversus Axial Load: (Lu - 2.0 in.)
3.8 Unbond Faceplate Out-Of-Plane Deflection Shapesversus Axial Load: (Lu - 3.0 in.)
3.9 Unbond Faceplate Out-Of-Plane Deflection Shapesversus Axial Load: (Lu - 4.0 in.)
3.10 Unbond Faceplate Out-Of-Plane Deflection Shapesversus Axial Load: (Lu - 5.0 in.)
3.11 Sandwich Beam Maximum Loads versus Unbond Length.
3.12 Logorithmic Plot of Maximum Loads versus Unbond Length.
3.13 Failure of a Fully Bonded Specimen.
3.14 Failure of an Unbonded Specimen.
3.15 Buckling Failure of Specimen ten. (Lu - 3.0 in.)
3.16 Buckling Failure of Specimen nine. (Lu - 5.0 in.)
4.1 Sandwich Beam General Model.
4.2 Geometry of the Unbonded Interface.
4.3 Sandwich Beam Simplified Model.
4.4 Predicted Load versus Axial Displacement. (Lu - 5.0 in.)
4.5 Predicted Section Two Load versus AxialDisplacement. (Lu - 5.0 in.)
4.6 Predicted Load versus W30 Displacements. (Lu - 5.0 in.)
4.7 Beam Shapes Predicted by the General Model at Three Loads.(Lu - 5.0 in.) (Not to Scale)
B.1 Bending and Shear Contributions to Total
Buckling Deflections.
B.2 Bending Contribution to Buckling Deflections.
B.3 Shear Contribution to Buckling Deflections.
xiii
"~ % % % %"- , . ," . ... .- . . ,.'"""""". - ' %', %" %. " ...- -" . -. "'"i " i - - -"/ ." " ; "; "" " " " "" "" '."

Chapter 1
INTRODUCTION
6 Throughout the history of the aerospace industry, Man's
ambition to fly faster, farther, and higher has produced many
sophisticated and expensive flight vehicles. Today, pure desire to
achieve these goals is insufficient motivation for producing newer
craft. A variety of factors, from economical feasibility to
availability of resources, have come to significantly influence the
design and manufacturing processes.
Thus, the role of the design engineer has changed from
"making an aircraft fly," to "making it inexpensive and fly more
efficiently." In the area of structural design, analysis has come
to place more emphasis on developing lighter, stronger and more
versatile, yet specialized materials. Aircraft once chiefly made
from plywood and then aluminum are now manufactured with large
amounts of fiberglass and carbon fiber epoxy-resin composites.
Another "new" material which is becoming more widely used
in aircraft and space vehicles is the sandwich structure. Although
-ot a recent innovation--the concept of sandwich construction has
been accredited to Fairbairn (1849) [l]--its wider use has been
affected by newly developed lightweight core and faceplate
materials and improved adhesives and bonding methods.
Prior to discussing some of the advantages, disadvantages,
uses, and failure characteristics of the sandwich structure, a
proper definition is in order.
1.1 DEFINITION OF A SANDWICH STRUCTURE
A sandwich structure was identified by the American Society
for Testing Materials as "A laminar construction comprising a
combination of alternating dissimilar simple or composite materials
assembled and intimately fixed in relation to each other so as to
ZPZ 7Z 7::
ci -~-:wzla~--r -11e1

2
use the properties of each to attain specific structural advantages
for the whole assembly" [2]. In aerospace applications, a typical
sandwich construction usually contains two similar faceplates which
are adhesively bonded to a core (fig. 1.1).
The faceplates are typically made from strong, thin, stiff
materials such as aluminum, fiberglass, or graphite-epoxy fiber
composites. However, the core is usually much thicker, more
flexible, and less dense than the faceplates. Cores for aerospace
applications are often made from aluminum, resin-reinforced paper,
glass, or stainless steel and titanium alloys, and are shaped in
hexagonal honeycomb or corrugated configurations. The volume of the
honeycomb core is typically 90 to 99 percent open space [3].
Once the faceplates are securely bonded to the core, this
structure behaves like an "I" beam. The faceplates, being the
primary load-carrying members, are comparable to the "I" beam
flanges, while the core, which separates and supports this skin, is
similar to the web.
Like the web, the honeycomb core carries the majority of
the shearing stresses. Since the faceplates carry most of the
bending load as tensile and compressive stresses, the stiffness of
the beam can be greatly increased by spreading the faceplates
farther apart. The translation of the faceplates' moment of
inertia away from the centroid of the entire structure is the
mechanism which causes this increase in the beam flexural rigidity
(D) (See Appendix A), without significantly increasing the weight
of the structure.
To further emphasize this point, consider a solid metal
laminate of thickness t and a sandwich panel with core thickness t
and overall thickness 2t. The sandwich will exhibit a 7 fold
increase in stiffness, and an increase in strength over the solid
plate by a factor of 3.5, with only a 5% increase in weight.
Increasing the sandwich core thickness so that the overall heightis now 4t, increases the stiffness by 37 times, and the strength by
X 4 4

3
9.25 times above the solid laminate. This stronger and
significantly stiffer sandwich panel still only increased in weight
by 9% [3].
The advantages of a sandwich construction are thus
obvious. Large strength-to-weight and stiffness-to-weight ratios
are the primary and most important properties of the sandwich
structure. In addition, the core supports the faceplates and keeps
them parallel over the entire region of the structure, adding to
the torsional stiffness. Finally, the flexible core allows freedom
to easily manufacture curved panels, and the core can be machined
into a variety of shapes for special applications.
1.2 SANDWICH STRUCTURE APPLICATIONS
In the aerospace industry, sandwich structures have been
marginally used in aircraft since the WWII "Mosquito." Today
however, new applications are continuously being conceived for use
in both military and civilian vehicles--from wing tips and speed
brakes in the McDonnell-Douglas F-15 and F-18 tactical fighters,
entire control surfaces in the DC-10, Rockwell's B-lB bomber and
Boeing's 767, Rotodomes of the AWACS surveillance aircraft,
Sikorsky's UH-60 helicopter main rotor blades [3], DC-9-80 engine
nacelles, Airbus A-310 empennage [4], to the design of entire
aircraft wings [5] and the entire monocoque fuselage of the Avtek
400 turboprop aircraft, which because of its sandwich fuselage
boasts the ability to carry six persons across the country on a
single tank of fuel [6].
Uses of sandwich structures are not limited to aircraft
structural components. They are also found in airplane bulkheads
and seats where weight savings will additionally increase overall
performance. Outside the aerospace industry, sandwich panels are
used for tooling structures, molds, energy absorption, and
packaging. In addition, these structural panels are used in
buildings, from homes to high-rise office buildings [7-9].
YX-

4
In the future, use of the sandwich structure should greatly
increase with further applications to space-based technologies.
Lightweight sandwich structures could be easily carried aboard the
space shuttle for construction of spacestation bulkheads, storage
areas, equipment platforms, and deep-space vehicles. In fact, a
sandwich shell structure is presently being considered for the fuel
tank of the second generation (single-stage-to-orbit) Space
Transportation System [10].
1.3 SANDWICH STRUCTURE PROBLEM AREAS
This versatile sandwich structure is not the solution to
every problem where high-strength and low-weight structures are
needed. It too suffers from deficiencies, as do all structural
materials. In the area of design, some difficulties arise in
calculating sandwich loading characteristics because of the complex
and little-understood relationship between the adhesive and
honeycomb [11].
Faulty bonds and damage to the structure during the
manufacturing process can lead to reduced load-carrying abilities
* [2]. In addition, solvents within the adhesive may vaporize during
the curing process and become trapped within the honeycomb cells.
After a period of time, the core may warp, the resins may leach,
the organic materials can deteriorate, and in cold environments ice
may form and damage the bonds [12].
During use, safety inspections of sandwich components prove
quite cumbersome because critical damage usually occurs within the
structure. In addition, there are presently no quick and efficient
methods for determining the integrity of sandwich constructions.
Ultrasonic testing may be used, but getting the sandwich submersed
in water can be difficult, especially if it is part of a 767 wing.
Still, this method of testing is not efficient in detecting voids
within the adhesive bond [2]. While portable ultrasonic and x-ray
techniques are available, maintaining inspections of a fleet of

aircraft, which widely use sandwich components, can be a formidable
task. Other methods for testing the quality of the sandwich can be
9more accurate, but are usually destructive.
In the Avtek 400 [6], 25% of the labor cost to rivet and
fasten components together was saved because the aircraft was glued
together. However, should the need arise to replace a defective
section of sandwich construction, repair can be very difficult.
Although methods exist [2], ensuring that the structure will be
capable of identical loading conditions can be a tedious task.
1.4 PURPOSE OF THIS RESEARCH
There are several modes of failure for a sandwich structure
(see chapter 2). A majority of the analytical and experimental
work to determine these modes has been performed by the U.S.
Department of Agriculture's Forest Products Laboratory--from
effects of shear deformation [13], to simply supported panel
buckling [14].
Within the confines of this study, it was desired to
examine the effects of an unbonded region on the overall buckling
of a sandwich plate. Motivation for this work stems from the fact
that this seems to be one of the most critical failure modes
experienced by sandwich structures on flight vehicles (e.g., ice
may form within a sandwich panel and cause delamination of a
faceplate). If the structure happens to be a primary load-carrying
member or control surface of an aircraft, failure can cause
catastrophic loss of equipment and life.
In addition, apparent lack of significant analysis on this
important failure topic necessitates discussion of this failure
mode. As a first step, it was thought prudent to narrow the scope
of this analysis to the study of the effects of an unbonded region
on the buckling failure of a sandwich beam. Once a basic
understanding of this failure mode is accomplished, extensions to
the more useful and general plate problem will be less laborious.

Chapter 2
EXPERIMENTAL PROCEDURE
Experimentation was important in establishing the effect
of the presence of an unbonded area on sandwich beam buckling. In
order to achieve this goal, a careful examination of major
alternate modes of sandwich beam failure was necessary. Within
this chapter, an overview of the steps necessary to construct and
test this composite structure is presented. Described are the
design and construction of the sandwich beam and its simple-support
joints, the testing apparatus used, the measurements of the
rV sandwich component material properties, and the data acquisition
and reduction techniques used.
2.1 SPECIMEN DESIGN
The sandwich beam considered in this study consisted of an
aramid-fiber honeycomb core to which two aluminum faceplates were
bonded using a film adhesive (fig. 1.1). Figure 2.1 shows the
geometry and reference frame orientation for this structure.
Sandwich beams and plates loaded axially or transversely
can fail in several different modes [15]. Five of these failure
conditions were important to this analysis: overall buckling,
faceplate yielding, intra-cell dimpling, faceplate wrinkling, and
shear crimping (fig. 2.2). To establish the effect of an unbond on
sandwich buckling, the structure must be designed such that all
other failure modes do not precede buckling. Thus, a close
examination of all five failure modes was needed to determine a
safe experimental regime.
For this preliminary design study, Bernoulli/Euler beam
theory was used, along with several conventional assumptions. I(1) Plane sections remained plane and perpendicular
to the neutral axis.
61

0
(2) The neutral axis was assumed inextensional.
(3) The beam slope w' - dw/dx << 1 at all points
along the beam.
(4) Stress in the beam width, or "y" direction, was
zero.
(5) All materials were linearly elastic.
(6) The faceplate and core were assumed to behave
isotropically, although the core was actually
an orthotropic material.
2.1.1 Faceplate Yielding.
As is customary, the axial load was assumed to be carried
exclusively by the faceplates. Thus, the maximum allowable axial
load per uni- beam width is bounded by the yield load of the
faceplates. The following relationship was readily derived:
Ny - 2 tf 0y (2.1)
The plot of this equation (fig. 2.3) demonstrates the obvious
increase in yielding load due to increasing faceplate thickness.
2.1.2 Intra-cell Dimpling.
Faceplate dimpling is a localized, intra-cell buckling
instability of the sandwich faceplates (fig. 2.2b). When viewed on
a scale the order of the core cell diameter, dimpling can be
easily visualized as a plate-buckling mode. This failure mode is
controlled by the honeycomb cell diameter and by the faceplate
thickness. Using plate-buckling theory, the critical load equation
can be derived [16] as:
atE [tlND - (2.2)(I - v 2 ) J
From this theory, the value for a was found to be 4.642.
According to the Military Handbook, Construction of Sandwich
fo - .

8
Comiosites [17], an empirical formula for this failure mode
determined a to be 2. The empirical formula was chosen to
determine the critical loads. Figure 2.4, the plot of eq. 2.2 with
ax - 2, showed that the critical dimpling load decreased as the cell
size increased or the faceplate thickness decreased.
2.1.3 Shear Crimping.
Shear crimping occurs if the core is insufficiently thick
or its shear modulus is small. Essentially this failure results
when the shearing stress within the core becomes larger than the
shear strength of the core. Since the core is bonded to the
:0 faceplates, shearing may wrinkle or crush the core within the
failure area (fig. 2.2c).
The critical shear crimping failure load is linearly
related to the core thickness and its shear modulus [15]:
NC - c Gw (2.3)
The parametric plot of this equation can be found in fig.
2.5. Note that as the core thickness or shear modulus decreased,
so did the critical load. Another trend indicated that, for a
particular cell size, a decrease in shear modulus was the result of
decreasing core density. In addition, as the cell size increased
while holding the core density fixed, the shear modulus also
decreased.
2.1.4 Faceplate Wrinkling.
Wrinkling is a localized buckling of the sandwich
*faceplates in short, sinusoidal waves (fig. 2.2d). The behavior of
the faceplates closely resembles the buckling of a beam on an
elastic foundation. A first-order approximation of the critical
wrinkling loads is typically found by modeling the core as a
linearly elastic Winkler foundation (18]. Appendix B contains the
derivation of the following equation:
..... ,_ o_ _ -_ _ -. _._ ,- -.- . . - - ,' '.' '.' ' ' ',- ." . . ., . • . .- - , ,'. " . . . --, ..

-- - --- ----- --
9
NW - tfEf • tfE] (2.4)[I c Ef
* In this mode, core and faceplate properties play an
important role in failure. Since the faceplates are sufficiently
thick, overall buckling does not occur. It is the core compressive
modulus and thickness that greatly influence wrinkling, as does the
spring stiffness in an elastic foundation.
Fro! the graph of the above equation (fig. 2.6), this
dependence can be easily seen. Decreasing faceplate thickness had
the obvious decreasing effect of the critical wrinkling load. A
Wdecrease in the failure load also resulted if the core thickness
* was increased while the core compressive modulus was held
constant. Finally, note that as the core modulus decreased, the
load also decreased.
2.1.5 Overall Buckling.
Buckling of an isotropic, geometrically straight, axially
loaded beam depends upon the column's flexural rigidity, boundary
conditions, and length. Typically shear deformations are small and
neglected in most buckling analysis. However, because of the type
of core used in this sandwich structure, shear deformations may
'3' significantly contribute to the buckling failure, and are thus
considered in this analysis.
VFrom the derivation in Appendix B, it was found that the
critical buckling load can be expressed as:
NB - (2.5)[I + NE/NS]
where, ,2 D Gwdf2'p NE "- 2 ' N -
A parametric plot of this equation (fig. 2.7) shows that
increasing beam length or decreasing faceplate thickness will
.$ . . " • ' . ,1 2.7....'- 2 , N' .".--- ,2 -' ''." ' - .

10
decrease the failure load. However, the greatest effects on the
critical buckling load arose from changes in the core thickness
and shear modulus. Increasing the core thickness by 50% was found
li to increase the failure load by approximately the same amount.
This was due to the added flexural rigidity that resulted when the
41 faceplates were moved farther apart.
On the other hand, a 47% increase in the shear modulus (Gw)
also increased the buckling load by about 50% at small beam
lengths, while at larger beam lengths only a 15% increase in load
occurred. This exemplifies the fact that this sandwich beam is
subject to large shear deformations, especially at shorter beam
lengths.
2.1.6 Sandwich Beam Geometry.
Beam geometry was not fixed by determining an efficient
combination of parameters that satisfied the failure criteria. It
would have been impractical to choose the sandwich dimensions on
this basis. Rather than fixing geometry from the failure criteria
alone, commercial availability and economic feasibility of
Pmaterials were also considered.
Thus, a Nylon Fiber Reinforced Honeycomb core (NOMEX) was
chosen from HEXCEL. Aluminum 2024-T3 was picked for the sandwich
faceplates because of its high strength (ay - 40 ksi, Ef - 107 psi)
and common use in sandwich construction. Table 2.1 lists the
properties of these materials in detail.
With these properties fixed, the five failure criteria were
parametrically plotted to determine faceplate thickness and beam
length. Figures 2.8 and 2.9 show the failure criteria plots for
0.457 and 0.506 inch core thicknesses, respectively. Each graphs
the failure loads per unit beam width for the five failure modes
versus beam length and faceplates thickness.
It is interesting to note that only the overall buckling
load was affected by changing the beam length. As anticipated,
%'-".-% % • . ".-.% , % % ." ", q.-. -. . " % . . . "...,, .,% . . . % % • %

111
this load decreased with increasing beam length. Since it was
desirable to have the largest possible margin between buckling and
the other failure modes, a large beam length should have been
chosen. However, dimensions of the oven used to cure the specimen,
limited the beam length to 13.0 inches. Although longer beams are
more desirable, fig. 2.8 and 2.9 show that a 13.0 inch beam would
ensure a 620-lb/in margin between buckling and other failure modes
if a 0.020-inch faceplate thickness was used.
2.2 DESIGN OF BEAM SUPPORTS
End fixtures were designed to provide support and transmit
the axial load to the specimen. Simple supports were chosen
because of the simplicity they added to both experiments and
analysis without loss of generality.
Since the sandwich faceplates carried the compressiveloads, they were made to extend 3/4-inch beyond the core to allow
bonding of the end fixtures (fig. 2.10 and 2.11). The end
supports were made from steel.
The fixture was machined to fit snugly between the aluminum
faceplate extensions. This ensured that the faceplates would
remain parallel at the loading points, thus avoiding failure at the
interfaces. The supports were carefully machined to close
tolerances so that support center lines would be aligned with those rof the specimen to prevent eccentric loading of the column during
testing. To aid the transmission of the axial force from the end
fixture to the faceplates, aluminum grips were bonded to the
exterior of the faceplate extensions and to the angled stop of the
fixture.
At the tip of the support, the end was rounded to allow
free rotation. The loading block, which was attached to the
testing apparatus by means of a threaded hole, had a "v" trench
into which the rounded end fixture rested. These were well
lubricated to reduce friction.
5N N

4. 12
2.3 SPECIMEN FABRICATION
The sandwich beam was constructed by bonding the honeycomb
core to the aluminum faceplates by means of a film adhesive.
Within this section is a description of the procedures used to
prepare the various components and assemble the test specimen.
2.3.1 Component Preparation.
The three sandwich components--the aluminum faceplates, the
aramid fiber honeycomb core, and the film adhesive--needed
preparation before curing. This was necessary to ensure a
sufficiently strong bond that would not allow failure other than
the desired buckling mode.
(a) Aluminum 2024-T3 Faceplates.
Faceplate preparation began by cutting the 3.0 x 14.5 inch
plates from the aluminum 2024-T3 sheet. Each beam faceplate was
cut along the same orientation to ensure minimum variation of
material properties. A shearing machine was used to cut the
aluminum, and then all plates were milled to obtain geometrically
identical faceplates with square edges.
After cutting, the aluminum surfaces to be bonded to the
core were lightly sanded with emery cloth and cleaned with
acetone. Finally, penciled lines were used to mark the 3/4-inch
extensions and the boundary of the unbond. The marks for the
unbond were laid out so that the unbonded area would be centered on
one face of the sandwich beam.
(b) Aramid Fiber Reinforced Honeycomb Core.
This hexagonal-celled honeycomb core "consists of DuPont's
NOMEX aramid-fiber paper treated with a heat resistant phenolic
resin. It features high strength and toughness in a small cell
size, low density nonmetallic core" [19]. The core was
manufactured in blocks and then cut into sheets [15].
'NN
J. 7;-
...........

13
From these sheets, the 3.0 x 13.0 inch beams were cut.
Care was taken to insure that the cell arrangement was such that
the core "w" direction was parallel to the beam length (fig. 2.1).
Z? The core was cut by hand using a sharp knife and straight edge to
make it square. Finally, the honeycomb was blown with compressed
air to remove any loose particles or fibers.
(c) Film Adhesive,
The film adhesive used was manufactured by American
Cyanamid and had a designation FM-300. It was shipped in rolled
, form with protective plastic on either side. To prolong its
lifetime, it was stored at -400 F. Because this temperature made
the adhesive brittle, it was necessary to allow the film to warm to'
room temperature before handling.
Once warm, the adhesive was carefully cut into 3.0 x 13.0
inch sections. For the faceplate with an unbond, two identical
sections were cut in such a way that their lengths, including the
-' unbond length, would add to 13.0 inches. Care was taken to
minimize contamination of the adhesive which could degrade the
integrity of the bond.
2.3.2 Beam Assembly.
The sandwich was assembled as shown in fig. 2.12. Lines
marked on the aluminum faceplates served as guides while
positioning the adhesive. One of the protective backings was
removed from the 13.0-inch adhesive strip, and the film was
carefully centered on the clean aluminum plate. The adhesive was
* pressed into place and stuck since it was slightly tacky.
On each side of the unbond, adhesive film was positioned
and aligned. To prevent seeping into the unbond area and to reduce
local deformation of the faceplate, a piece of 0.0035-inch teflon
was centered between the core and faceplate of the unbond. It was
cut to the exact length of the unbond by 2.5 inches wide.
4- -Pb

14
As soon as the adhesive and teflon were situated, the
honeycomb core was placed on top of the unbonded faceplate and
centered. The other faceplate was then positioned on the core. A
T-square was used to ensure that both faceplates were aligned and
square. Next, the entire structure was lightly pressed by hand to
make the core stick to the adhesive to prevent the faceplates from
slipping while being transported to the oven. Finally, aluminum
spacers were placed between the faceplate extensions to keep the
them parallel during the curing cycle.
2.3.3 Curing Cycle.
The adhesive curing process entailed heating the sandwich
for a specified time. A press with carefully aligned heating
platen was used to apply the necessary temperature and pressure to
the specimen (fig. 2.13).
The sandwich was placed on the lower platen. Steel spacers
were positioned on either side of the beam to prevent the core from
being crushed. The lower platen was hydraulically raised until the
specimen just touched the upper platen. This slight contact
pressure was maintained throughout the curing cycle and until the
specimen completely cooled.
The platen temperature was monitored and controlled by a
thermocouple temperature controller. The adhesive curing cycle
"- (fig. 2.14) required bringing the sandwich temperature up to 3500 F
and holding it there for one hour. Upon completion of this cycle,
the specimen was allowed to cool overnight.
2.3.4 Attachment of End Fixtures.
Once the specimen cooled, the end fixtures were attached.
The aluminum extensions and end supports were first lightly sanded
with emery cloth and then cleaned with acetone. Figure 2.15 showsthe specimen ready for the attachment of the end supports.
Next, a five-minute, two-part liquid epoxy was mixed and
-. ,"'

15
*|
applied to the contact surfaces of the fixtures and grips. These
were then joined to the aluminum extensions and hand-pressed to
remove excess adhesive.
Wood blocks were used to evenly distribute the c-clamp
load. The assembly remained clamped for one hour to ensure bonding
of the surfaces. After the adhesive dried, any hardened excess
glue was carefully removed.
0I
2.3.5 Preparation of the Unbond for the Shadow-moire Method.
A Shadow-moire Method [20] was used to measure the out-of-
plane displacement of the unbonded faceplate during testing. To
eliminate glare from the shiny aluminum, the surface was dulled by
shot peening the unbonded region of the faceplate. This process
entailed using a small pressurized jet of water containing fine
sand particles to erode the surface to a rougher state. Care was
taken to protect the exposed honeycomb core during this procedure.
2.4 MEASUREMENT OF FLEXURAL RIGIDITIES
The flexural rigidity (D) of a composite beam is calculated
by summing the contributions from each constituent. This was done
for the three sections of the sandwich beam used in this analysis
(Appendix A)--the fully bonded sandwich specimen (DI), the section
of core with only one faceplate attached (D2), and the unbonded
aluminum faceplate (D3 ).
To verify the accuracy of the calculated rigidities,
separate experiments were performed to directly measure these
properties. The stiffness of section one (Dl) was measured by a
four-point bending test, and a cantilever bending experiment was
used for section two (D2 ).
2.4.1 Four-Point Bending: DIOne method of directly measuring the flexural rigidity
of a beam is to apply a pure moment to its ends and measure the
IL[' _ . . , .-. . . .. -.- 4- - 4..-.4' ,J ~ P

16
displacement at the center of the beam. The following equation was
derived from beam theory and used to determine the value for the
flexural rigidity of this section:
Mo L_2
w(L/2) - 8 (2.6)8D
To perform this test, a four-point bending device (fig.
2.16) was constructed. It was capable of applying pure moments to
the central section of the beam. To allow rotation during bending,
four well-lubricated rollers were used to apply the load to the
sandwich specimen. An aluminum strip was placed between each
roller and the beam to distribute the load applied to the specimen.
A fully bonded sandwich beam specimen (table 2.3) was
positioned between the upper and lower sets of rollers. Load was
applied to this system at the center of the upper section of
aluminum. For this loading, the uniform moment in the central beam
section was calculated to be one half the applied load times the
lengthwise distance (q) between the lower and upper rollers.
Substituting this into eq. 2.6 yielded:
)w(L/2) (2.7)
This experiment was performed on an MTS testing machine
using displacement control. Figure 2.16 shows the four point
bending device attached to the MTS and set-up to begin testing the
sandwich specimen.
An eddy-current displacement transducer (proximeter) was
P.' fixed to the upper aluminum block and used to measure the downward
displacement at the center of the beam. The slope from the
experimental plot of the applied load versus w(L/2) displacement
(eq. 2.7) yielded the value for flexural rigidity of section one
(D1 - 31288.47 in.lb).
The experimental value for DI was found to be 31.8% larger
A

17
than the theoretical value (table 2.2). This significant
difference may be a result of an incorrect assumption in the role
that the adhesive layer played in the flexural rigidity of the
system.
2.4.2 Cantilever Bending: D2
The unbonded region of the sandwich beam can be considered
as two separate beams--the unbonded aluminum faceplate (section
three) and the core with one bonded faceplate (section two). The
flexural rigidity for section three (D3) was directly calculated
from El. On the other hand, D2 needed to be experimentally found
and compared to theoretical calculations as was done with DI .
A specimen was manufactured with one faceplate and adhesive
layer absent (table 2.3). The stiffness of this sandwich was
significantly less than that for the fully bonded beam because of
the missing faceplate and adhesive layer. Since the expected loads
would be small, an end-loading cantilever device was used to
measure D2 (fig. 2.17).
The following relationship between tip load and
displacement was found from beam theory:
P (3 . zw(L) (2.8)
CThe experiment was also performed on an HTS testing machine
in the displacement control mode. A vertical aluminum support was
used to clamp the specimen like a cantilevered beam. This support
could be translated to choose any desired beam length. A beam
length of 4.0 inches was used for this test.
To achieve a greater accuracy in results, a 300-lb load
cell was used instead of the MTS's 20,000-lb cell. A wedge was
used to apply the point load at the beam tip.
The experiment was performed with the aluminum faceplate
placed up so it would bend as the section does in the unbonded
JIJ

18
sandwich beam. D2 was determined from the initial tangent of the
experimental load versus tip displacement plot. Table 2.2 contains
the measured values for D2 . It was found that the predicted value
for D2 was 43% lower than the experimentally recorded value. These
errors may be attributed to the effect of the adhesive on the
flexural rigidity of the structure.
2.5 OTHER PROPERTY MEASUREMENTS
To validate any theoretical predictions of failure loads,
the core shear stress shape factor and Young's Modulus for the film
adhesive and aluminum faceplates were also experimentally found.
2.5.1 Shear Stress Shape Factor.
Determination of the shear stress shape factor ( a s) was
necessary to verify the value assumed while deriving the overall
buckling failure equation (Appendix B). In a homogeneous beam, the
stress distribution is usually parabolic. In this composite beam,
however, it was assumed that the shear stress across the core
thickness was uniform.
This shape factor determines the amount of shear
contribution to the deflection of a buckling column. In order to
find the magnitude of this contribution, a three-point bending
experiment was performed (fig. 2.18). Dimensions for this test
specimen are listed in table 2.3.
Similar to the four-point bending test, the three-point
bending experiment differed only in the application of load.
Instead of using the upper aluminum plate to distribute the load to
two points, the load was applied directly to the beam's center.
The deflection equation for this loaded beam included a
shear deflection term, along with the usual bending component. By
measuring the displacement at the beam's midsection and plotting it
versus the applied load, the shear stress shape factor (as) was
determined from the slope of the following equation:

19
w(L/2) - -P 1 + (2.9)48 DI L A Gw
where, - b df2/c (see ref. [21])
The experimental value for as was found to be within 1.9%
of the predicted value (table 2.2).
2.5.2 Modulus of Aluminum 2024-T3.
The Young's modulus for the aluminum faceplate was
determined by performing a simple tension test. A standard "dog-
bone" specimen was cut from the aluminum sheet in the same
direction as the length of the beam faceplates. The test area was
4.0 x 0.409 inches.
Strain gages and an extensometer were used to measure the
axial strain of the specimen as it was loaded on the testing
machine (displacement control). The Young's Modulus was determined
to be 9.951 x 10³ ksi, and the 0.2% strain offset yield stress,
42.68 ksi (table 2.1).
2.5.3 Modulus of FM-300 Adhesive.
A similar tension test was performed on the adhesive. The
specimen was made by curing six layers of the FM-300 adhesive in an
aluminum mold that was lined with teflon. The curing cycle was
identical to the one used in the lay-up procedures for the sandwich
beam specimens (fig. 2.14).
The adhesive test coupon was loaded in tension on the MTS
machin, using displacement control. The elastic modulus of the
J adhesive was found to be approximately 463.5 ksi (table 2.1).
2.6 EXPERIMENTAL APPARATUS
An MTS closed-loop servo-hydraulic testing device was used
to perform the sandwich buckling and material property
experiments. Figure 2.19 is a photo of the MTS equipment
%~

20
arrangement, and fig. 2.20 shows a schematic representation of the
testing and data collection system. Experimental apparatus
preparation included configuring the MTS loading device and
specimen support network and aligning the various displacement
measuring devices.
2.6.1 The Testing Machine.
The MTS is a versatile materials-testing machine with a 22
kips loading capacity (tension or compression). Applied loads were
measured via a load cell (maximum error of + 0.10 %) that was
calibrated using dead weights. Since the MTS load cell had a
capacity of 20,000 pounds, external load cells with 300 and 500
pound limits were used to obtain more accurate results when small
loads were expected.
Axial displacements of the hydraulic actuator were measured* "using a linearly variable differential transducer (LVDT), an
internal component of the MTS system. It had a range of ± 3.0
inches with a + 0.80% maximum error. Because axial displacements
of only a few thousandths of an inch were expected before the
C sandwich column buckled, the actuator had to be positioned within
0.002 inch of the range zero for these measurements to be
accurately recorded.
The MTS is capable of operating under load, strain, or
displacement control. A function generator controls the actuator
movement through various loading functions (ramp, sine, haversine,
etc.). In addition, rate of loading can be selected to provide
additional control over experimental operating conditions.The rate of loading was determined by the function
generator TIME and SPAN settings. According to the MTS operation
manuals [22], the loading rate was found from the following
equation:
Total output SPANRate - - - (volt/sec) (2.10)
Total time TIME
. . . .-. .I

21
2.6.2 Specimen Loading Configuration.
As mentioned earlier, the hydraulic actuator (fig. 2.19)
needed to be positioned as close to the zero range as possible.
This was done by raising the crossbeam support until the LVDT
output indicated a zero voltage with the sandwich specimen fitting
between the loading blocks.
The upper loading block was attached directly to the load
cell suspended from the crossbeam support. Attached to the
actuator was the second loading block. A ball joint was placed
between the block and actuator, allowing free 3600 rotation of the
block.
This joint proved invaluable in aligning the specimen prior
to testing, ensuring that a uniform load was applied through the
center line of the specimen. The ball joint, loading blocks, and
specimen end fixtures were well lubricated to reduce friction.
2.6.3 Measuring Instrumentation.
Various instruments were used to monitor the specimen
during testing. The MTS or an external load cell was used to
measure the axial load being applied to the sandwich beam. An
internal MTS LVDT measured the axial displacement applied to the
sandwich beam. These measurements were recorded using an X-Y
plotter.
Two spring-loaded LVDT's were placed on opposite sides of
the specimen to detect changes in the mid-point deflections of the
unbonded beam section (fig. 2.21). Displacements from section two
and three mid-points, w2(0) and w3(0) respectively, were recorded
Con an X-Y Y plotter versus axial load.
Finally, a Shadow-moire Method [20] was used to measure the
out-of-plane displacements of the unbonded alumit4um faceplate.
Figures 2.22 and 2.23 schematically depict the set-up of this
technique.
For sandwich buckling experiments with an unbond, a ruled

* 22
screen was positioned in front of the shot peened, unbonded
aluminum faceplate (fig. 2.24). This grating screen contained 200
lines per inch and was placed so that the lines were parallel to
the width of the beam. A 1500-watt quartz halogen light source was
used to illuminate the master grating from an incidence angle. Two
lenses were positioned between the light source and moire screen to
collimate the beam of light. The light passing through the lined
grating cast shadows on the unbonded surface and produce fringes
when observed from a viewing angle.
A video camera system was used to record the changing
fringe pattern (out-of-plane displacement of the unbond), along
with a digital readout of the load cell voltage, as the sandwich
, was tested. This tape was later analyzed with a video analyzer
(fig. 2.25) to determine the buckling faceplate shape at particular
loads.
2.7 EXPERIMENT EQUIPMENT PREPARATION
The testing machine was warmed up prior to each experiment
by sinusoidally cycling the actuator for 15 minutes. Displacement
control was used to load the test specimens. A maximum stroke
displacement of 1/4 inch was set for all experiments, with a
loading rate of approximately 0.001 inch every 15 seconds.
Once the machine was sufficiently warmed, the actuator wasmoved to zero, and the specimen was carefully fitted between the
loading blocks. The section midpoint LVDT's were positioned
perpendicular to the specimen and zeroed. In addition, the moire
screen was placed in its holder and adjusted so that the fringes
would appear parallel to the beam width.
Both plotters were readied, and the scales were adjusted to
yield the largest plots possible. Finally, after the VCR was
activated, the function generator started to begin ramping the
actuator displacement.
Recording equipment was continuously monitored throughout
V %........... ................-... ...........
23
the experiment for detection of any problems. In addition, visual
observations were made of the beam edge of the unbonded section to
determine if a failure mechanism could be observed.
After maximum load occurred, the displacement was continued
until the load decreased. The function generator was then stopped
manually, and the load removed from the specimen. Recording
instruments were turned off and the buckled column removed from the
HTS.
V" %
N%, , g . % , ¢ , ' , g . '
. -. -- - . -o-i. . . -.-. . -. . -, . -

Chapter 3
EXPERIMENTAL RESULTS
The primary objective of the experimental program was to
establish the failure mechanisms of partially unbonded sandwich
beams subjected to axial compression. In order to achieve this
goal, thirteen specimens were manufactured and tested under the
guidelines presented in the previous chapter. These test
specimens were geometrically identical with the exception of the
unbond length.
Physical dimensions of the sandwich specimens are listed in
table 3.1. Overall, common dimensions were fixed to a 3.00 + 0.02
in. specimen width (b), and a beam length (L) of 13.00 + 0.05 in.
With the end fixtures attached, the overall structure length (Lo)5.0
was 16.50 + 0.05 in. The unbond lengths (Lu) ranged from 0.0 to
a'.' 5.0 inches.
Data was collected from these experiments in order to
quantify the failure of the unbonded sandwich beam and to validate
"\. the results obtained from the theoretical models. The effect ofincreasing unbond length on the buckling load, the mode of
buckling, and the failure mechanism were the three main parameters
of interest investigated.
3.1 LOADING HISTORY
An MTS closed-loop, servo-hydraulic testing machine was
used to load the simply supported test specimens (fig. 2.19 and2.20). The first two sandwich beams tested utilized the load-
. Ix control feature of the MTS. These specimen--a fully bonded beam
(specimen one), and one which contained a 3.0-inch unbond (specimen
two)--were found to fail catastrophically at some critical load.
In order to capture the load-deformation characteristics of
the columns in more detail (especially near the critical load),
24
",.
%*~-~ - 5 . . . . . . . 55

25
displacement-controlled loading was necessary and was used in all
subsequent tests. This made it possible to make observations of
the failure mode and to determine the initial post-buckling history
of the sandwich specimen. A loading rate of approximately 0.004
in/mmn was used for all experiments.
The actuator was ramped to a maximum "breakpoint"
displacement of 0.25 in. Stroke displacements for experiments one
and two were found to be only 0.047 in. and 0.005 in.,
respectively. The margin between the experimental and "breakpoint"
displacement was necessary for accurately placing the specimen
between the loading blocks.
Once the specimen was positioned, the function generator
was activated, starting the displacement ramp. At first contact,
loading was interrupted, and all measuring equipment was re-zeroed.
The test was then resumed, and the loading continued until the
column failed or until a well-defined limit load was obtained.
3.2 EXPERIMENTAL MEASUREMENTS
Four sets of data were collected in each experiment--the
load versus the applied axial displacement, the load versus the
midpoint deflections of beam sections two and three, w2(0) and
w3 (0) (fig. 2.21), and the displacement families of out-of-plane
deflections along the unbond length obtained from the Shadow-moire
Method.
3.2.1 Load versus Stroke Displacement.r Figures 3.1--L u from 0.0 to 0.5 inches--and 3.2-- Lu f rom
1.0 to 5.0 inches--plot the axial load (PI) versus the applied
axial displacement (A or actuator translation), for each performed
experiment. According to load cell specifications, measurements
of the load (in the test regime) were accurate to within + 0.5 lbs.
On the other hand, actuator displacements were measured to within
+ 0.0005 inches.
t%.. -

26
I The initial nonlinearity observed in these loading
histories was due to "settling" of the test fixtures and specimen.
Response curves from beams having unbonded lengths of 2.0 inches or
less were characterized by a distinct failure point, beyond which
the columns load-carrying capacity was significantly reduced.
. Loading histories of beams with longer unbonded sections were
characterized by limit loads. (Note that the distinct failure for
one 3.0-in. unbond specimen was a result of controlling the load
during testing.) These columns were found to retain their load-
carrying abilities for deflections well beyond the displacement
measured at the limit load.
3.2.2 Load versus W30 Displacement.
Two LVDT's positioned at the midpoints of beam sections two
and three monitored the respective displacements 02(0) and C3 (0)
during testing (fig. 2.21). Subtracting :2(0) from ' 3(0) yielded
-the relative displacement of the section three midpoint from the
core (W30 ).
Figure 3.3 contains the W30 displacements for experiments
with a 1.0, 3.0, 4.0, and 5.0-in. unbond (test specimens 4, 10, 11,
and 9 respectively). The midpoint displacement of the unbonded
faceplate did not begin as loading was initiated. Instead it began
at a load which may be linked to the buckling load of the unbondedfaceplate. This idea will be expanded further in the theoretical
discussion of this structure (chapter 4).
3.2.3 V3(x) Displacement Shapes from the Shadow-moire Method.
' The Shadow-moire Method, see ref. [20], was used to
determine the overall shape of the unbonded faceplate as the
sandwich beam was loaded. The changing fringe pattern was recorded
on a VCR system. Figure 3.4 shows photos taken from the VCR of
fringe patterns for four loads of the 5.0-in. unbonded specimen.
Notice the increase in fringe density as the load increased. The
% ,
A

27
photo at the right was taken at the limit load.
A video image analyzer was used to plot the intensity of
the fringe pattern versus scan position. Lined tape was placed on
each beam and used to calibrate the scan position with the actual
lengthwise position on the specimen. Figure 3.5 exhibits fringe
intensity plots, made by the analyzer and recorded on an X-Y
plotter, corresponding to the four loads at which the photos in
fig. 3.4 were taken.
Each curve corresponded to a different shape as determined
by the load applied to the sandwich beam. From these plots the
minima and maxima represent the whole and half fringe numbers,
respectively, corresponding to the shape displacements. Table 3.2
lists the data from each experiment used to find the order of the
moire fringe displacements. The equation which related the fringe
order (N), grating pitch (p), point-source incidence angle (a), and
' viewing angle (a) to the out-of-plane displacement (w) was found
from [20] to be (fig. 2.23):
1Np
w - - N p(3.1tan a + tan (3.1)
Using the fringe data for each load, the 03 (x) displacement
I%, shapes were calculated and plotted. These curves were then
digitized on an IBM-PC AT and for each unbond were combined to form
a three-dimensional plot. Figures 3.6 through 3.10 contain these
plots for specimens 4, 3, 10, 11, and 9, with unbond lengths of
1.0 through 5.0 inches, respectively.
The horizontal axis represents the length along the unbond
* from top (-13/2) to bottom (+13/2) (see fig. 4.1). w3 (x)
displacement was plotted along the vertical axis, with the positive
direction indicating displacements away from the core of the
structure. Each plot was found at the same position on the unbond
but at different loads. Thus, the third axis showed the increase
in the applied load P1..4,
28
Since it was desired to determine the deflections of the
unbonded faceplate from its unloaded position, all displacements
were referenced to the top edge of the unbonded region. The
deformation profiles were found to be almost symmetric about the
mid-span of the beams during initial loading. At higher loads the
shapes became progressively less symmetric. This indicated that a
transition from the symmetric buckling mode to a nonsymmetric one
may have occurred. Since the last curve plotted was at or just
prior to maximum load, the transition was not a result of the
specimen reaching maximum load.
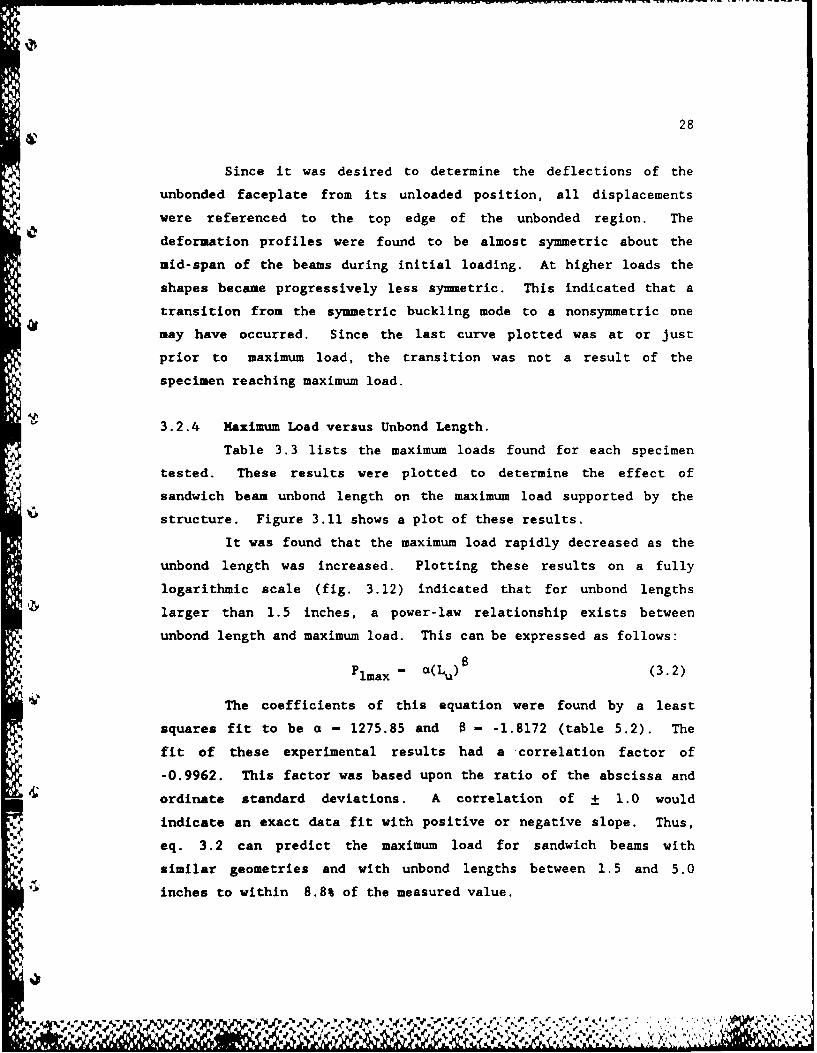
3.2.4 Maximum Load versus Unbond Length.
Table 3.3 lists the maximum loads found for each specimen
tested. These results were plotted to determine the effect of
sandwich beam unbond length on the maximum load supported by the
structure. Figure 3.11 shows a plot of these results.
It was found that the maximum load rapidly decreased as the
unbond length was increased. Plotting these results on a fully
logarithmic scale (fig. 3.12) indicated that for unbond lengths
larger than 1.5 inches, a power-law relationship exists between
unbond length and maximum load. This can be expressed as follows:
Plmax - a(Lu)8 (3.2)
The coefficients of this equation were found by a least
squares fit to be a - 1275.85 and B - -1.8172 (table 5.2). The
fit of these experimental results had a correlation factor of
-0.9962. This factor was based upon the ratio of the abscissa and
ordinate standard deviations. A correlation of + 1.0 would
indicate an exact data fit with positive or negative slope. Thus,
eq. 3.2 can predict the maximum load for sandwich beams with
similar geometries and with unbond lengths between 1.5 and 5.0
inches to within 8.8% of the measured value.
NS N V

29
3.3 SPECIMEN FAILURE OBSERVATIONS
Visual observations of the sandwich specimen were made
during loading to augment and support physical measurements.
Several details observed during testing proved useful for
interpreting and verifying results from the collected data.
Observations concentrated on determining the failure mechanism of
both fully bonded and unbonded specimens.
3.3.1 Fully Bonded Specimens.% Two fully bonded specimens were tested. The first
experiment (specimen one) was run using load control. Displacement
control was used for the second (specimen eight). A similar
failure was noted in each of these sandwich beams.
Figure 3.13 shows the failure shape of specimen one. The
predicted failure load for this beam was found to be 2297.4 lbs.
The load actually measured was 3480 lbs. Using the experimentally
measured flexural rigidity Dlex (see 2.4.1) in eq. 2.5 still
resulted in a low prediction of the failure load (table 3.4). The
most accurate failure estimation was achieved by using Dlex and an
equation derived from classical stability analysis. This approach
yielded a load (Pcr - 3454.2 lbs.) which was within 2.5% of the
experimental failure loads.
Although specimen two was over-collapsed because the
experiment was load controlled as mentioned earlier, both fully
bonded columns appear to have failed similarly. In addition, the
failure load measured in experiment eight was also close to the
predicted at 3540 lbs.
3.3.2 Specimens with an Unbonded Faceplate.
Photos in figs. 3.14 through 3.16 document some of the
observations made of sandwich beams with an unbonded faceplate.
Specimen three, with a 2.0-inch unbond, was held in the expected
symmetric failure mode and compared to the collapsed 3.0-inch

30
unbond specimen two (fig. 3.14). Notice that specimen two
exhibited the same general failure shape as the fully bonded beam
(fig. 3.13). Also observe that the core of the 3.0-in. unbond
failed at the left unbond interface (fig. 3.14a).
It was uncertain whether the core failure caused the change
in the collapsed mode shape or if both were a result of over-compression due to the test being performed in the load-controlled
configuration. However, observations from other beam tests
strongly indicated that transition to the nonsymmetric mode was
gradual for large unbond lengths, but more sudden and occurring at
or just prior to maximum load for short unbonded faceplates.
From experiment six (0.5-inch unbond) crushing of the core
and some permanent deformation of the aluminum faceplates occurred
as a result of the sudden transition. Figure 3.15 shows the
symmetric shape of 3.0-inch unbond specimen ten prior to any
noticeable change in shape. This photo roughly corresponded to the
moire shape plot (fig. 3.8a) with a load of approximately 160 lbs.
In contrast, a photo of specimen nine with a 5.0-inch unbond (fig.
3.16), taken just prior to maximum load (fig. 3.10a), exhibited the
nonsymmetric shape.
Close examination of the unbond interface of all specimens
with unbond lengths larger than 1.5 inches did not indicate any
obvious failure of the honeycomb core. Thus, the transition in
mode shape was most likely caused by either the fact that the
*. unbond was itself an imperfection of the beam, or imperfections of
the unbonded faceplate may have caused eccentric loading of the
structure.
3.3.3 Imperfect Specimens.
Two of the sandwich beams tested contained large,
observable imperfections in the unbonded region, with the maximum
displacement in the warped core approximately 8.6% of the core
thickness. These two specimens (twelve and thirteen) were tested
.4%

31
and were found to reach maximum loads 7.9% and 24.2% lower than
similarly tested sandwich beams. Since this study was not
concerned with the effects of imperfections, results from these
experiments were not used in this analysis.
,.
_1 1110 IV . S
N*O %4

Chapter 4
AN ANALYTICAL MODEL FOR THE BUCKLING OFUNBONDED SANDWICH BEAMS
In a paper discussing the failure in laminated
graphite/epoxy plates by delamination buckling, Chai et al. [23]
developed a set of equations to describe the stability, growth, and
arrest of local delaminations. Their work provided a foundation
for the unbonded sandwich beam models derived within this chapter.
A general model and a simplified version were developed in
an attempt to describe the buckling failure of axially loaded
sandwich beams containing an unbonded faceplate section. These
theoretical models were derived by considering the equilibrium of
such a beam with a buckled faceplate, as shown in figure 4.1.
4.1 PROBLEM FORMULATION
The structure was idealized as a long, simply supported
column of length L. This column consisted of two faceplates of
equal thickness tf, bonded to a honeycomb core of thickness c. One
of the faceplates was not bonded to the core over a length Lu,
which was symmetrically located as shown in figure 2.12.
Under the action of the compressive axial load P1, the
unbonded section buckled. The failure configuration was assumed to
be symmetric about the beam midspan. Several additional, customary
assumptions were made:
(a) Axial loads were carried strictly by the
faceplates.
(b) The neutral axis (N.A.) of the faceplate was
considered inextensional.
(c) Plane sections through the faceplate thickness,
and perpendicular to the N.A. prior to
deformation, remain normal during deformation.
(d) The strains were assumed to be small.
32
S%,

33
(e) Deflections and rotations of all components
were also assumed to be small.
(f) The unbonded section did not delaminate during
deformation.
(g) All beam constituents were linearly elastic.
Eauilibrium Eguations.
0For convenience, the sandwich structure was analyzed in
three separate sections as shown in fig 4.1. From this figure, the
following section equilibrium equations were readily derived:
Ml (xI ) - Mo + Pl[wl(xl) - 60] (4.1)
M2 (x2) - M2 + P2 [w2 (x2) - 6] (4.2)
M 3(x3) - M3 + P3 [w3 (x3) - 6] (4.3)
Constitutive Eauations.
The moment (Mi) in each section was related to the
displacement (wi) as follows:
4 0 - -D i x- -) , i - 1 , 2 , 3( 4 )
where Di is the flexural rigidity of the ith member. Substituting
eq. 4.4 into eq. 4.1-4.3, the following expression for the
displacements (wi) can be obtained:
wi(xi) - Alsin(kixi) + A2cos(kixi) + A3 (4.5)
ki2 - Pi/Di i - 1,2,3
Boundary and Compatibility Conditions.
The following section boundary and compatibility conditions
were found to hold: (see fig. 4.1; invoke symmetry about the beam
midspan):
ftiLn.. i: Wl(O) - 6% , wI (o) - eo
wl(11/2) - 6 , wl'(1 1 /2) - e (4.6)
%%e
, - -. y. ,- - -. ' ."-Z0 1.

34
Section 2 & 3:
wi'(O) - 0 wi(li/2) - 6 1 - 2,3 (4.7)wi '( -li/
2) - e
By substituting boundary conditions 4.6 and 4.7 and eq. 4.1-4.4
into eq. 4.3, the following displacement expressions were obtained:
wl(xl) - 2 i l ) sin ul + 60 (4.8), 2u I cos ulI -( -)I"
-1 el o (2uixi\wiOxi us - cos ui + 6 (4.9)wix)-2ui sin ui Ii )/
i - 2,34where,
6 - Ir (see fig. 4.1) (4.10). o 2 cos u,
6 - tanul + 60 (4.11)
u i - (li/2)(Pi/Di)I/2 i - 1,2,3 (4.12)
Interface Continuity.
Axial and moment equilibrium at the interface of the three
sections required that:
PI - P 2 + P3 (4.13)
M1 - H2 + H3 + P( " tf ( + r) (4.14)
(The distance, r (fig. 4.2), from the aluminum faceplate/adhesive
joint to the neutral axis, was taken to be 0.00976 inches.) Using
eq. 4.4-4.12 in eq. 4.13 and 4.14 yielded:
24 D2 ~21 - - 0 (4.15)i 12 13
1

35
Du2 2D u 2 c r(h- tf - + r) - "tan uI
13 12 2 J 1/ (4.16)
1 DiTu ctu 2 D 1(D2u2) 3u3
-0+ l2COS u1 . cot u2 - - cot u3 -0
Beam Shortening due to Bending.
Two additional equations were determined from the fact that
the beam shortened as a result of bending deformations (fig. 4.2).
1 .13/2 2ri 1 (12/2 2 +e(.7
So (w3') dx3 - J (w2') dx2 + e (4.17)
2 (W1 ')2 dx l + 02 (w2 ') 2 dx2 + ] (4.18)
K- where, e - 8(h - tf) g - e/2
Equation 4.17 related the amount of shortening in sections
two and three, since 12 - 13. The amount that the entire sandwich
beam shortened (A) was found from eq. 4.18. Using eq. 4.17 and
4.18 with eq. 4.8 to 4.12 produced the following two equations:
13 sin 2u3 I 1~ 1 si *n2usi2- -2u 3 2u2sin u3 (4.19)
h h- tf c + r -08 -+ rj~2
1os + i 2ui s1nsin 2u2'' 2u, + 2u2 (4.20)
co~)2 J 2e(c + r - - 0
The system of equations 4.15, 4.16, 4.19,and 4.20 was used
to solve for the five unknowns ul, u2., u3 , 8 , and L. Due to the
nonlinear nature of these equations, a numerical iterative scheme
was employed to determine the solution.
----------------------------------------------@, --
36
4.2 NUMERICAL SOLUTION USING NEWTON'S METHOD
The system of aforementioned nonlinear equations were
solved numerically using a variation of Newton's method [24]--which
employed a modification of the POWELL-HYBRID method. Due to the
. nature of the problem, it was found convenient to prescribe the
' interface angle e and solve for the normalized loads with eq.
4.15, 4.16 and 4.19. The final equation (eq. 4.20) was used after a
solution was determined in order to find the axial displacement '.
Convergence of the Newton scheme greatly depended upon the
initial guess of the unknown values. According to ref. [23], a
* first guess for would be 7r. This was reasonable since the
unbonded faceplate was essentially a clamped beam, and the loads
were normalized by the Euler buckling load for this type of beam.
To avoid the singularity which develops at this load, the initial
guess for u3 was taken to be an incremental amount ( C ) larger than
7r. Initial values for u2 , ul, and 6 were made by trial and error
until a solution was found in which all quantities increased.
4.3 SIMPLIFIED MODEL
Solution of the nonlinear system of equations presented
above required a considerable computational effort. Thus it was
desired to develop a simplified model which could be utilized
without loss of generality. Table 2.2 presented evidence for such
a simplification.
An examination of this table indicated that the bending
stiffness for section one was approximately 2000 times larger than
the other sections. In effect, section one can be considered a
rigid beam, with the other two constituents having different, yet
finite rigidities (fig. 4.3). Development of this model followed a
J%., procedure identical to the one used in the general case.
A' It was found that the boundary and compatibility conditions
for the unbonded beam sections (eq. 4.7) were still valid.
However, the conditions for section one (eq. 4.6) needed alteration
No e
,$SA

37
to reflect the now infinite rigidity of this section.
Modified Section 1:
wl(O) - 0 wl'(O) - (4.21)
wl(11 /2) - 6 , wI'(11/2) - ewhere, i i + Ir
Section equilibrium indicated that displacement eq. 4.9
holds for this simplification, while eliminating eq. 4.8. The
equation for the interface displacement 6 was found to reduce to:
6 - 11 e/2 (4.22)
Interface equilibrium produced equations identical to
eq. 4.13 and 4.14. In addition, the beam shortening relationship
eq. 4.17 also remained the same. Combining eq. 4.15 with eq. 4.16
eliminated the unknown load u, as follows:
[D2 u2 3u3 D u u+ fcot u2 + cot u3 iI + II12 13 12 13 (4.23)
2423
DU 2 (h tf) 2D- 2 (c + r ) -
Finally, the assumption that beam section one was rigid
altered eq. 4.20 to:
0212 sin 2u2 i [ (i _ 02) 1/2]
n2u 1 2u2 + -j4i 222(4.24)
+ 2 ( r - - 0
For this simplified theory, it was only necessary to solve
eq. 4.19 and 4.23 using Newton's method. This meant that only
initial guesses for u2, u3 , and 8 were required to initiate the
solution process. Thus, computational effort was reduced along
with the energies for estimating the initial solution.
G~ o,

38
4.4 Comparison of Analytical Models.
The equations derived for the two analytical models were
used to calculate load and displacement data for direct comparison
with experimental results and to relate additional properties not
directly measured. It was found that results calculated from both
the simplified and general models were almost identical. For
example, the general model was used to calculate various data for a
5.0-inch unbond sandwich (figs. 4.4-4.6). If similar responses
were found from the simplified model and plotted on these figures,
visual differences would be indiscernible.
Computations for other sandwich beams (Lu from 1.0 to 5.0
-' inches) demonstrated that both the general and simplified models
were similar. The displacement shapes of constituent sections two
and three were also found to be nearly identical. For section one,
however, the shapes were slightly different since the simplified
model assumed that this component of the beam was rigid.
Returning to fig. 4.4, this plot of load (PI) and overallaxial displacement ( A ), demonstrated two important characteristics
of the analytical models. First, the loading histories for all
unbond lengths from 1.0 to 5.0 inches were not complete- -solutions
were found only after u3 - N. This was a result of assuming that
the initial geometry of the sandwich beam was perfect. And more
importantly, it was found that the analytical models predicted
limit loads for all unbond lengths.
In addition, since the load in the three beam sections were
related (eq. 4.13) and the overall load (PI) reached a limit, the
:-0 loading in section two also reached a limit (fig. 4.5)--the load insection three was still increasing. A careful examination of fig.
4.4 and 4.5 indicates that the limit load within section two
occurred at a displacement prior to the limit load for the overall
beam. Figure 4.6 emphasized the fact that the displacement of the
S-', unbond midspan (W30 ) did not begin until the buckling load in
section three (u3 v) was reached.
=========== ============ ==================- =p - * . a=-=?========= === i! i !:i- :

39
Finally, the general model was used to plot the buckling
shape of a sandwich beam with a 5.0-in. unbond (fig. 4.7). Half of
the symmetric beam was plotted, excluding the left end fixture.
Three loaded configurations are shown for comparison. Note that
displacements were amplified approximately 12.5 times and the beam
dimensions were scaled so that the shapes could be easily
identified. The first beam shape was found at the initial load of
the solution. The second represented the shape found when the load
within section two reached a limit. And finally, the third
indicated the beam displacements at the time of maximum (limit)
load.
jii
%!
20J
-I J " ," . ,' '" ""'- ".""" .' " .. . . ',.'.,' " .', 7. " , , . , . " ,",--.. , ,

G"
Chapter 5
COMPARISON OF EXPERIMENTAL AND THEORETICAL RESULTS
Thus far, this analysis has followed two separate paths.
One concerned with the design, construction, and experimentation of
sandwich beams containing an unbonded section, and the other with
the development of analytical models to establish the response and
stability of the structure.4In this chapter, data from theory and experiment will be
compared in the following areas: load and axial displacement, W3o
displacements, buckling shapes of the unbonded faceplate, load
versus unbond length, and critical bending moments. This
comparison was used to critically review the assumptions made while
deriving the analytical models and to identify areas and reasons
for disagreements between the two.
5.1 COMPARISON OF BUCKLING AND FAILURE LOADS
It is important to note that the problem formulation, as
presented in chapter 4, assumed that the sandwich beam structure
was initially geometrically perfect. As a result, all analytical
load-displacement responses start after the unbonded aluminum
faceplate reached its buckling load (u3 - r). Thus, direct-(u.
comparison of the experimental and theoretical loading histories
was not possible.
All of the tested columns exhibited, to varying degrees,
pre-buckling transverse deflections. These were primarily caused
by initial geometric imperfections, which are always present in
real structures. Another notable deficiency in the analytical
models may be in the assumption that the linearized form of the
curvature-displacement relationship could be adopted (w' << 1).
From experimental results of beams with long unbond
i .lengths, it was found that this assumption may have been violated.
40
-" ' d'"-
4, . " . - -" .-. -"." ' e ' ' ' . ' - ". '" ' ".:' ' z - . ". '" ". ".. ". '"". " 'v ' .m . ' . -,. . t l t ,

41
This was due to the fact that the maximum lateral deflection of the
unbonded faceplate exceeded the thickness of the plate by a factor
of more than five. Thus, the comparisons which follow must be
viewed with these limitations in mind.
5.1.1 Load versus Axial Displacement.
Loading histories (load versus axial displacement)
experimentally recorded were plotted in figs. 3.1 and 3.2. Due to
the previously mentioned reasons, only the limit loads obtained
analytically were shown in these plots. Comparison of the
predicted and measured failure loads indicate three distinct unbond
length regimes which should be discussed separately: fully bonded
beams, those with short unbond lengths (Lu : 2.0 in.), and those
with longer unbonded specimens (Lu 3.0 in.).
(a) Fully Bonded Sandwich Beams.
The buckling load of a simply supported sandwich column
with rigid end fixtures can be shown to be directly proportional to
the bending rigidity (table 3.4). Due to difficulties in
accurately predicting the flexural rigidity of the column, the
measured value had to be used. With it, the buckling load could be
predicted to within 2.5% of the experimental failure load.
If flexural rigidity (D) testing is not possible, design
using a calculated value of D in the above procedure, in the Euler
buckling equation, or in eq. 2.5 (table 3.4) will yield failure
loads between 26.8% to 52.1% lower than will actually occur--as
long as a careful manufacturing process is employed. This margin
of safety ensures that nox buckling failure will not occur.
(b) Sandwich Beams with Short Unbonded Regions.
In the regime of short unbond length specimens
(Lu : 2.0 in.), figs. 3.1 and 3.2 indicate that distinct failure
loads occur. During testing, visual observations of these columns
&!

42
revealed that some type of core failure may have occurred at, or
near, the maximum load. Accurate analytical predictions for these
failure loads were not possible. The analysis developed yielded
buckling loads substantially higher than those measured
experimentally (table 5.1).
To obtain a more practical model then, it will be necessary
to eliminate a majority of the errors caused by stiff assumptions
imposed upon the analytical models. This can be achieved by
revaluating the assumptions used and incorporating:
(a) A failure criterion for the core at the
interface of the fully bonded and unbonded
4sections.
(b) An extended analysis which includes the initial
imperfections of the unbonded faceplate.
(c) Sandwich Beams with Long Unbonded Regions.
For beams with unbond lengths longer than 2.0 inches (fig.
3.2), comparison between theoretical and experimental failure loads
indicated that the analytical models were accurate to within 12.5%
(table 5.1). It was found that the experimental loading histories,
for the columns with 3.0, 4.0 and 5.0-in. unbonded regions, were
characterized by limit loads. This validated the theoretical
conclusion that a limit in the loading history was a buckling
attribute of an unbonded sandwich beam.
In addition, finding an experimental limit load response
also supported the deficiencies identified in the analytical
models. Since the only variable which separates the distinct
failure and limit load responses was the unbond length, failure of
the short unbond regions may result from either geometric
imperfections or failure of the core.
5.1.2 Load versus W30 Displacement.
From analytical results, the W30 displacement (fig. 2.21)
"-4,'• -
00','.~ d- %

43
should begin when the load within section three reached thebuckling load of the unbonded section (u3 - 1). In the
experiments, W30 displacements began well below this load (fig.
3.3). This was attributed to the presence of initial geometric
imperfections within the sandwich specimens. Also because of this
difference, the theoretical predictions of the W30 displacement at
critical limit load were found to be much smaller than those
measured experimentally.
5.2 QUALITATIVE DISCUSSION OF BUCKLING SHAPES
Out-of-plane displacement shapes of the unbonded faceplate
were found from the experimental moire fringe data and calculated
from the theoretical equations. These shapes were plotted in figs.
3.6-3.10 for comparison.
In the case of the 1.0-in. unbond (fig. 3.6), the beam
failed well before the limit load was reached. As a result, direct
comparison of the faceplate deformations was not possible. For
unbond lengths from 2.0 to 5.0 inches (figs. 3.7-3.10), the failure
loads were within 12.5%. It was found, however, that the
magnitudes of the experimental displacement shapes were up to four
times larger than those predicted from the analytical models.
The buckling shapes for these unbonded faceplates were
qualitatively compared. Figures 3.7-3.10 indicate that the
experimental and analytical deformation shapes were similar.
Finally note that the transition in buckling mode--from symmetric
to nonsymmetric, and found in all tested specimens--was not
predicted by the theoretical models. Again, these differences were
mainly due to the lack of geometric imperfection sensitivity of the
analytical models.
5.3 MAXIMUM LOAD VERSUS UNBOND LENGTH
Plots of maximum load versus sandwich unbond length (fig.
3.15 and 3.16) indicated that the analytical models were capable of
4'.i

44
predicting the limit load to within 12.5% for unbond lengths from
2.0 to 5.0 inches (table 5.1). If the 4.0-in. specimen was
excluded, since it had an observable, initial displacement
imperfection shape, estimations were within 7.7% of the measured
loads.
In addition, it was found that a full logarithmic plot of
Vthis data (fig. 3.16) indicated a direct power-law relationship
(eq. 3.2) between maximum load (Plmax) and unbond length (Lu).
Constants for this equation, for both experimental and theoretical
data, can be found in table 5.2. The analytical data indicated an
almost exact fit (Lu from 1.0 to 5.0 inches). A power-law fit of
4 experimental results (Lu between 1.5 and 5.0 inches) was found to
predict failure loads to within 8.8%.
5.4 CRITICAL BENDING MOMENTS
In the design analysis of the fully bonded sandwich beam
(chapter 2), yielding of the aluminum faceplates was not to occur
until well after buckling failure. For the unbonded specimens
tested, additional stresses were expected within the buckling
faceplate. In order to determine if any yielding occurred,
possibly causing the transition in mode failure shape or beam
collapse load, it was necessary to examine critical bending moments
at the maximum load.
Critical areas of the failing sandwich beam were considered
to be along the interface and midspan of the unbonded section.
*Thus, the moments were calculated from the analytical model at the
interface, M2 and M3 , and unbond midsection, M20 and M3o (fig.
4.1). The moments were found at the theoretical limit loads.
Since these loads were close to those measured for long unbond
lengths, and higher at shorter unbond lengths, meeting the
yielding criteria for the aluminum faceplates would indicate a
margin of safety for the experimentally tested beams.
From the critical moments, the maximum stresses within the
.. - - . , -, . . . . . % " - ' ,- . -- .- -% , ," .T .- . , " , .', .- " ' ', ' ,"," . , -.-%

t45
faceplate were calculated. The yielding stress for the aluminum
used was found to be approximately 42.68 ksi (table 2.1). Thus all
stresses at the critical moments should be below this value. Table
5.3 listed the predicted maximum stresses found within the critical
areas.
It was theoretically determined that all stresses were at
most 65.3% below the yielding stress of the aluminum. The largest
stresses were found to be within the unbonded faceplate, with the
greatest magnitude occurring in the 1.0-inch unbond (14.82 ksi) and
decreasing for longer unbond lengths. Thus, it was concluded that
the transition in failure mode shape and actual buckling of the
structure was not a result of yielding of the load-carrying
aluminum faceplates.
7,..
, ...'
'.4

Chapter 6rCONCLUDING REMARKSA combined experimental and analytical study has been
performed to establish the effect of a partially unbonded faceplate
on the stability of sandwich beams. The sandwich structure
considered was comprised of a lightweight aramid-fiber honeycomb
core to which two aluminum 2024-T3 faceplates were bonded using a
film adhesive.
In what follows the important experimental and analytical
conclusions from the study are summarized. In addition,
improvements and extensions of both the analytical models as well
as the experimental work are suggested.
6.1 EXPERIMENTAL FINDINGS
In the experimental part of this work, the geometry of the
beam was kept constant and the length of the unbonded section was
varied. The beam geometry and properties of the constituents were
chosen such that buckling would precede all other major failure
modes--faceplate yielding, intra-cell dimpling, shear crimping, and
faceplate wrinkling.
A total of 13 sandwich beam specimens were tested, two of
which were fully bonded. The remainder contained an unbonded
region which was always located symmetrically about the midspan of
the beam. Experiments were performed over a range of unbond
lengths from 0.5 to 5.0 inches. Both ends of the specimens were
simply supported.
Each beam was axially loaded until either a distinct
failure developed or until a limit load was obtained and surpassed.
The majority of the tests were conducted using displacement control
so that the load-defomation characteristics of the beam near the
critical load could be identified.
46

47
Results from two fully bonded specimen indicated that a
buckling instability developed which was then followed by
catastrophic collapse of the structure. These failure loads were
found to be within 2.5% of the load estimated by a classical beam
stability analysis. However, in order to obtain this accuracy, it
was necessary to use an experimentally determined bending rigidity.
The presence of an unbonded section along the length of the
beam was found to drastically reduce the capacity of the structure
to support axial loads. For example, an unbonded section with a
0.5 inch length caused a 46.4% reduction in failure load from the
fully bonded case. In addition, it was found that a 98.2% load
reduction occurred if the unbond length was 5.0 inches. Thus, as
the unbond length was increased, the load carrying capacity
decreased. Failure load (Plmax) was found to be related to the
unbond length (Lu) by a least squares power-law fit. This
relationship could predict the failure load of a sandwich beam (Lubetween 1.5 and 5.0 inches) to within 8.8%.
Two distinct failure modes were observed in the loading
histories of the beams tested. For unbond lengths of 2.0 inches or
less, the column was found to fail suddenly and catastrophically.
Calculations of the critical stresses within the unbonded region of
the sandwich beam indicated that yielding of the aluminum
faceplates did not occur. However, visual observations of these
sandwich beams indicated that some type of core failure occurred at
or near the maximum load.
A second failure mode was identified for sandwich unbond
lengths of 3.0 inches or greater. For these specimens, a limit
load characterized the loading histories. The deformation of the
unbonded sections of the sandwich beams were initially symmetric
*, about the beam midspan with the unbonded faceplate deflecting away
from the honeycomb core. At some point in the loading history a
transition in this deformation pattern--where the two sections
started deforming in an nonsymmetric mode--was noted. This
* ~ ~ ~ ~ ~ ~ ~ S 110%.~ *A~\%~.* ~ *
%~ A -

48
occurred for all unbonded sandwich beams tested. This transition
was sudden and occurred at or just prior to the maximum load for
beams with short unbonded sections. For longer unbonded regions,
the transition from the symmetric shape was much more gradual and
occurred well before the limit load. Failure of the core was not
observed in the specimens with long unbonded lengths.
6.2 ANALYTICAL FINDINGS
Analytical models were concurrently developed with the
objective of predicting the observed unbonded beam instabilities.
The structure was modeled as a beam comprised of three different
sections--a fully bonded segment, the unbonded faceplate, and the
opposite faceplate with the core attached--with compatibility and
continuity enforced at the interface.
Among other more customary assumptions, it was assumed that
this structure had an initially perfect geometry and that only
symmetric failure shapes were possible. The measured flexural
rigidities of the constituent sections were used in the analysis
because of large uncertainties found in their predicted values.
The bending rigidities of the beam segments within the
unbonded region were up to 2000 times lower than the value measured
for the fully bonded section. It was found that because of the
significantly large stiffness, deflections of the fully bonded beam
segments contributed little to the displacements of the interior
unbonded sections. Thus it was possible to assume that this
section was rigid, which greatly simplified the solution process.
It was found that the responses of the models, for all
unbond lengths, were characterized by limit loads. Because of the
assumed initially perfect geometry, results were only obtained just
prior to and after the limit load. In addition, while all
predicted displacements were much lower than those measured, the
models could accurately estimate experimental failure loads to
within 12.5% (unbond lengths from 2.0 to 5.0 inches).
L

49
6.3 EXPERIMENTAL/ANALYTICAL IMPROVEMENTS AND EXTENSIONS
Throughout this analysis, modeling and experimental
deficiencies have been noted. The primary cause for the observed
differences between the predicted and measured results were due to
the restrictions placed on the analytical model. It was found that
the assumption which modeled the sandwich beam as initially
geometrically perfect led to underestimations of all displacement
measurements. In addition, the assumed inextensionality and linear
curvature-displacement relationships also contributed to the
observed differences between the calculated and measured
* deflections. Thus, for more accurate predictions of the loading
histories and displacements, a modification of the analytical
equations will be necessary. As a first step, geometricN imperfections of the unbonded faceplate should be incorporated. If
satisfactory results are not found, the addition of large rotations
should be considered.
Experimentally, the displacement-measuring techniques canbe improved. Use of an external LVDT for determining the axial
displacement of the sandwich specimen will remove settling errors
associated with the loading apparatus. Improvements in the Shadow-
moire Method are necessary. Increasing the light source and camera
angles will increase the accuracy of the measured faceplate
displacements. Better alignment of the moire grating plate and
continuous measurement of the distance between the plate and
specimen will help determine a fixed reference for all fringe
patterns. In addition, using the Shadow-moire Method on both sides
of the unbond will yield the complete displacement profiles for the
specimen. These will be useful in developing a better perspective
of the transition in buckling shapes encountered.
While it was desired to determine the buckling failure of a
sandwich plate with an unbond, further work on the unbonded beam is
necessary prior to extending this analysis to the more general
plate problem. Measurement of geometric imperfections and their
44

50
inclusion into the analytical models is one such area. In addition,
the causes for the failure observed within the core of shorter
unbonded sections will have to be established. It would also be
useful to examine variations in loading--such as eccentrically
loading the sandwich beam--nonsymmetric and other buckling modes,
and possible crack growth in the core or adhesive interface.
In conclusion, this study has considered several methods
for predicting the failure loads of sandwich beams with an unbonded
region and has gained some insight as to the instability of this
structure. However, unanswered questions remain, and new ones have
arisen. It is anticipated that with additional analysis, the
causes of failure--both catastrophic and limit load--and the
reasons for buckling shape transition will be determined and
analytically predicted.
V,).
.4.,
.4
J,,
" "1
,,; -. " "

APPENDIX A
FLEXURAL RIGIDITY CALCULATIONS
Flexural rigidity (D) is defined as the product of the
materials Young's Modulus (E) and the second moment of area (I).
Determination of D for beam sections one and two (fig. 4.1) was
necessary to accurately predict failure loads.
Fully Bonded Beam: DI
According to ref. [1], a simple approximation of flexural
rigidiLy (per unit width of beam), for a fully bonded sandwich
beam, contained contributions from the core and faceplates only
(fig. 2.2).
3c 2 3 2ECC 2Eftf 2EftfdfD -S-- + + (A.l)12 12 4
A simplification was then made in eq. A.1 since tf<<l and
Ec<<E f (i.e. Ec 0):
DI Eftfdf2 (df - c + tf) (A.2)2
-. Using dimensions and properties from table 2.1, it was
N. found that DI equalled 23731.28 in.lb. In order to compare this
approximation with experimental results, contributions from all
components were found:
DI - Dc + Dfl + Df2 + Dal + Da2 (A.3)
Dc - 0 (A.4)
Eft f3
Dfl - -- 13.94 in.lb (A.5)6
Df2 2 23123.25 in.lb (A.6)
a5
51
N

52
-Eata 3
Dal - "ata 3 0.17 in.lb (A. 7)
Et 2
D - ata a 593.92 in.lb (A.8)a2 2
Totaling the contributions in A.4 through A.8 using A.3
showed that D1 was equal to 23731.28 in.lb, and was not
significantly larger than the value determined by eq. A.2.
However, comparison with the experimentally determined value for D1
(table 2.2) indicated that a significant discrepancy existed in the
method used to predict flexural rigidity for a sandwich beam. It
was unclear as to the exact reason for these large errors.
Beam with one faceplate: D2
The flexural rigidity for beam section two--only one .
faceplate bonded to the core--was found in a similar procedure.
Adhesive contributions to D2 were again included. For this
section, it was necessary to determine the location of the new
neutral axis. This was accomplished by integrating the stress
distribution through the beam section and setting the resulting
force equal to zero.
N - adz - 0 (A.9)
Again assuming that Ec - 0 and the thickness of the
adhesive (ta - 0.013 in.) was uniform, the approximate location of
the neutral axis was found to be within the aluminum faceplate a
distance r - 0.00976 in. from the adhesive interface (fig. 4.2).
The flexural rigidity was found by summing the ".'
contributions from each component, as before:
D2 - Dc + Df1 + Df2 + Dal + Da2 (A.10)
Dc - 0 (A.11)
Dfl - 12 6.97 in.lb (A.12)
%I% -12
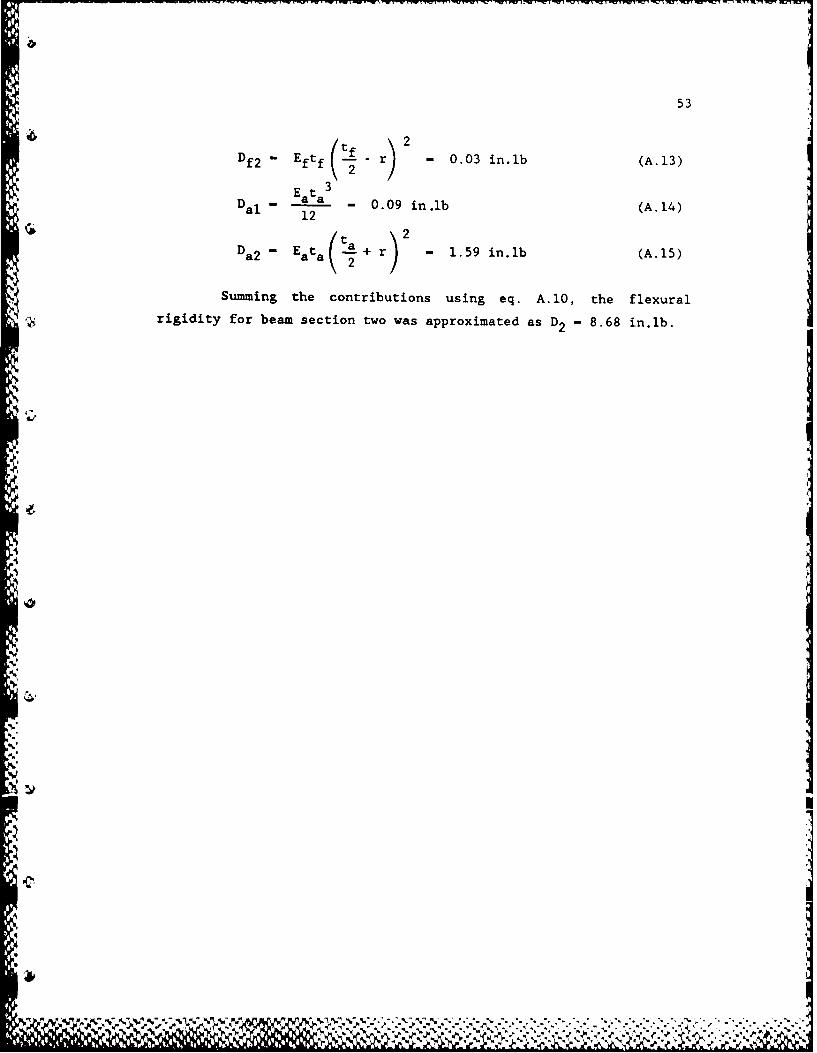
Ii- M M M
53
Df2 - Eftf -r) 0. 03 in. lb (A.13)
Et2
Dal - E a - 0.09 in.lb (A.14)12
Da2 - Eata(12A*+ r)2 _ 1.59 in.lb (A.15)/
Summing the contributions using eq. A.10, the flexural
rigidity for beam section two was approximated as D2 8.68 in.lb.
-ft
V S.".4 P
p%

APPENDIX B
.., FAILURE CRITERIA DERIVATIONS
Two sandwich beam failure modes are explained further
within this section: overall column buckling including the effectsi : - " of shear deformations, and faceplate wrinkling.
'.
" Column Buckling with Shear Deformations.
Buckling deformations in sandwich beams are primarily
; caused by bending deflections (w b ) and shear deformations (Ws)
~(fig. B.1). The bending contribution was derived from fig. B.2 and
, Bernoulli/Euler beam theory:
d_ M~x)(B.1)
m -U.
r...e.,dx+ D1
" 'From fig. B.3, shear angle ()was found to be:
%iY df dw sy (B.2)
c dx
:Integrating Y through the core thickness (c) produced anequation for shear force (V). Using B.2 and introducing a geometry
dependent shape factor ( s) , as proposed by Timoshenko since the
shear was not constant through the core, yielded:
Sdw s V(B3
dx sGd f
SUsing symmetry, equilibrium produced:
SV - N dw/dx (B.4)
% M(x) - -N [ 6 o w(x)] (B.5)
Bsubstituting eq. B.4 into B.3 i gave:
.,. 54-4'c
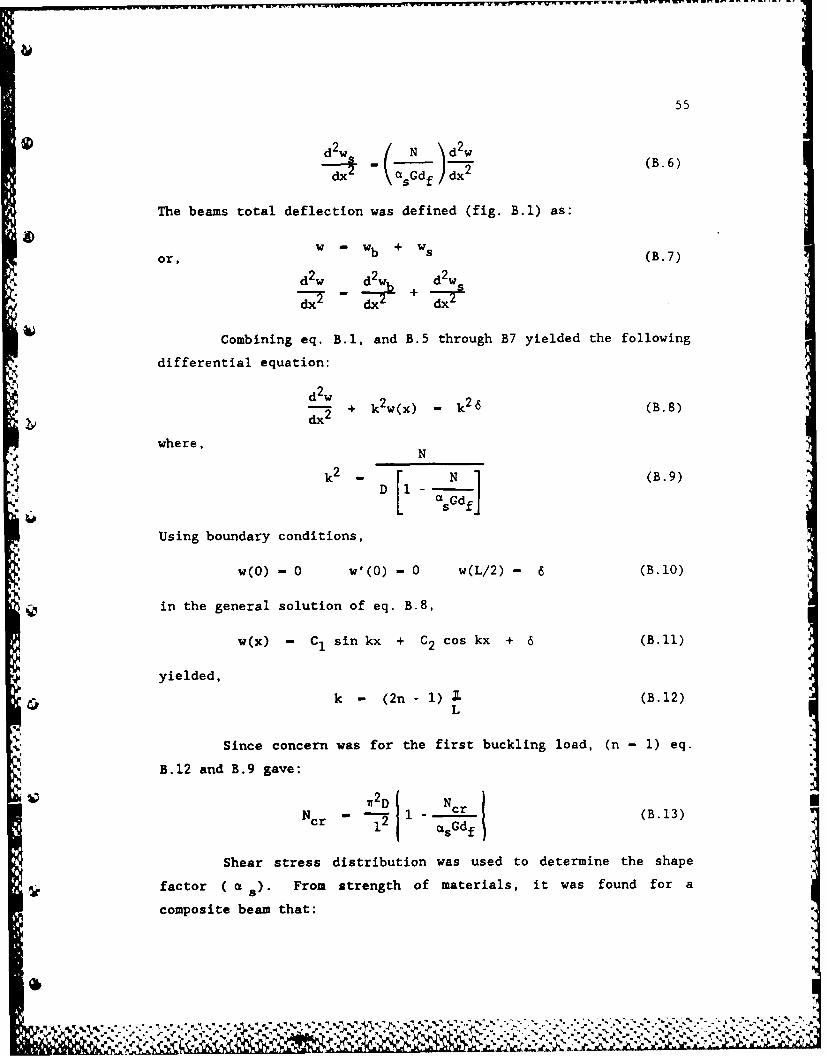
55
d2w IN )d 2 w
:dx ac1Gdf dx2 (.)
The beams total deflection was defined (fig. B.l) as:
or, w Wb + ws (B.7)
d2w d2w d2w s+
Combining eq. B.1, and B.5 through B7 yielded the following
differential equation:
d2w+ k2w(x) - k26 (B.8)
dx
where,N
k k2 - N (B.9)D 1
I D [ 1 - c G d f J B 9
Using boundary conditions,
w(O) - 0 w'(O) - 0 w(L/2) - 6 (B.10)
in the general solution of eq. B.8,
w(x) - C1 sin kx + C2 cos kx + 6 (B.11)
yielded,
k - (2n - 1) Z (B.12)L
Since concern was for the first buckling load, (n - 1) eq.
B.12 and B.9 gave:
SN 11 cr (B.13)
_ 12 asGdf
Shear stress distribution was used to determine the shape
Ifactor ( a s). From strength of materials, it was found for a
composite beam that:
" 99%' .V . *Y ,a4" " I

56
V [ Efdftf E c' (B.14)-L (7- - z 2)(B14
D 2 2
From ref. [1], since Ec<<Ef and tf<<c, eq. B.14 reduced to:
T - V/df (B.15)
Since T - G Y and from eq. B.2 and B.3, it was found that
- df/c. Using this result in eq. B.13, the equation for
critical buckling load (per unit width) was found:
NENB - NE (B.16)1 + NE/NS
where, NE - r2D/L2
Ns - Gdf2 /c
Faceplate Wrinkling.
Only symmetric wrinkling was considered, since sandwich
design was based upon the lowest loads of the various failure modes
(fig. 2.3d). Using symmetry, the structure can be modeled as a
beam on a linearly elastic spring foundation [3]. The spring
constant was found to be:
kc - 2Ec/c (B.17)
From beam theory, the equation of motion for this model was
determined.
dw N d2w 'kc- -'-2 + )o (B.18)dx4 +x w -
Substituting the assumed solution,
w(x) - C1 Sn (B.19)
into eq. B.18 yielded:
. . . . . ...
%'

57
N - EfIf( Wr/1) 2 + kc( IT/l) 2 (B.20)
Minimizing eq. B.20 (i.e. dN/dl - 0) produced the equation for
critical half-wavelength (fig. 2.3d):
[c - .Ef If ]1/4 (B.21)cr kcJ
Substituting eq. B.21 into B.20 lead to the equation for the
critical wrinkling load:
NW tf~f2ECtf] 1/2 (.2
Nw - f~f [3Efc (.2
Z.
.0IC

REFFRENCES
1. Fairbairn, W., "An Account of the Construction of the
Britannia and Conway Tubular Bridges," John Weale et al.,London, 1849.
2. Composite Construction for Flight Vehicles, MIL-HDBK-23,
Part 1, USGPO, Washington D.C., Oct. 1959.
3. HEXCEL Honeycomb, HEXCEL Corporation, 1983.
4. Langston, P.R., "Design and Use of KEVLAR in AircraftStructures," Composites: Design and Manufacturing for
General Aviation Aircraft, SAE, General Aviation AircraftMeeting and Exposition, Wichita, KS, pp. 41-55, April 1985.
5. Neubert, H.D., and Kiger, R.W., "Modern Composite Aircraft
Technology," Sport Aviation, pp. 55-63, Sept. 1976.
6. DeMeis, R., "Avtek 400: light is right," Aerospace America,
V. 23, No. 8, pp. 62-66, Aug. 1985.
7. Minnford, J.D., and Vader, E.M., "Aluminum-Faced SandwichPanels and Laminates," Adhesives Age, V. 18, No. 2, pp. 30-
35, Feb. 1975.
8. Becker, W.E., U.S. Sandwich Panel: Manufacturing/Marketing
Guide, Technomic Publishing Co., Stamford, CT, 1968.
9. U.S. Forest Products Laboratory, "Characteristics of Load-
Bearing Sandwich Panels for Housing," USDA, 1973.
10. Shideler, J.L., Swegle, A.R., and Fields, R.A., "HoneycombSandwich Structure for Future Space Transportation Systemswith Integral Cryogenic Tankage," Journal of Spacecraft and
Rockets, V. 21, No. 3, pp. 246-252, May/June 1984.
11. Grimes, G.C., "The Adhesive-Honeycomb Relationship,"
Applied Polymer Symposia No. 3, Hoboken, NJ, 1965,Structural Adhesives Bonding, pp. 157-190, Wiley & Sons,NY, 1966.
58
% %
_, 'l ;k

59
12. Parkinson, R.E., "Selection of Materials for ArchitecturalSandwich Panels," ASTM, Symposium on Structural Sandwich
Constructions, Los Angeles, CA, Sept. 1956.
13. Ericksen, W.S., and March, H.W., "Effects of ShearDeformation in the Core of a Flat Rectangular SandwichPanel," FPL Report No. 1583-B, Revised Nov. 1958.
14. Jahnke, W.E., and Kuenzi, E.W., "Buckling of SimplySupported Rectangular Sandwich Panels Subjected to EdgewiseBending," FPL Report No. 1868, Mar. 1959.
15. "The Basics on Bonded Sandwich Construction," TSB124,
HEXCEL, 1984.
16. Column Research Committee of Japan, ed., Handbook ofStructural Stability, pp. 3-121, Corona, Tokyo, 1971.
17. Construction of Sandwich Composites, Military Handbook,Vol. 23A, USGPO, Revised 1984.
18. Yusuff, S., "Theory of Wrinkling in Sandwich Construction,"Journal of the Royal Aeronautical Society, Vol. 59, No.529, pp. 30-36, Jan. 1955.
19. "Mechanical Properties of HEXCEL Honeycomb Materials,"TSBl20, HEXCEL, 1981.
20. Chiang, F.P., "Moire Methods of Strain Analysis," Manual on
Experimental Stress Analysis, SESA, 3rd ed., A.S.Kobayiashi, ed., Chapter VI, pp. 51-69, 1978.
21. Allen, H.G., Analysis and Design of Structural SandwichPanels, Pergamon Press, London, 1969.
22. Material Test System Reference Manual, MTS SystemsCorporation, Minneapolis, MN, 1978.
23. Chat, H., Babcock, C.D., and Knauss, W.G., "One DimensionalModelling Of Failure in Laminated Plates by Delamination
Buckling," International Journal of Solids & Structures,Vol. 17, No. 11, pp. 1069-1083, 1981.

60
24. Garbow, B.S., Hillstrom, K.E., and More, J.J.,"Documentation for MINPACK Subroutine HYBRDl," Argonne
National Laboratory, Mar. 1980.
Additional General References
25. Plantema, F.J., Sandwich Construction: The Bending and
Bucklinz of Sandwich Beams. Plates. and Shells, Wiley &Sons, NY, 1966.
26. Hoff, N.J., The Analysis of Structures, Wiley & Sons, NY,
1956.
27. Webber, J.P.H., Kyriakides, S., and Lee, C.T., "On thewrinkling of honeycomb sandwich columns with laminated
cross-ply faces," Journal of the Royal Aeronautical
Society, V. 80, pp. 263-272, June 1976.
28. Webber, J.P.H., "Least-weight design of carbon fibre
honeycomb sandwich columns," Journal of the RoyalAeronautical Society, V. 83, pp. 314-319, Aug. 1979.
29. Chapman, R.G., "Compression Tests on Dural-Balsa Sandwich
Panels," R.A.E. Report No. S.M.E. 3326, Aug. 1945.
30. Webber, J.P.H., and Pearce, T.R.A., "Buckling of Sandwich
Panels with Laminated Face Plates," The Aeronautical
Quarterly, V. XXIII, pp. 147-160, May 1972.
31. Lo, K.H., and Conway, H.D., "Effects of Interface
Conditions on the Bending of Laminated Beams," ASME,Journal of Applied Mechanics, V. 43, pp 495-496, June 1975.
32. Webber, J.P.H., "Governing Equations for Thick SandwichShells with Honeycomb Cores and Laminated Faces," The
Aeronautical Quarterly, V. XXV, pp. 270-286, Nov. 1974.
33. Reissner, E., "On Small Bending and Stretching of Sandwich-Type Shells," International Journal of Solids & Structures,
V. 13, pp. 1293-1300, Dec. 1977.

61
34. Brush, D.O., and Almroth, B.O., Buckling of Bars. Plates,
and Shell s , Mc Graw-Hill, NY, 1975.
35. Oden, J.T., and Ripperger, E.A., Mechanics of Elastic
SnStructure., d ed., Mc Graw-Hill, NY, 1981.
36. Jones, R.M., Mechanics of Composite Materials, Mc Graw-
Hill, NY, 1975.
37. Dally, J.W., and Riley, W.F., Experimental Stress Analysis,2nd ed., Mc Graw-Hill, NY, 1978.
38. Beer, F.P., and Johnston, E.R., Mechanics of Materials,Mc Graw-Hill, NY, 1981.
39. Ralston, A., and Rabinowitz, P., A First Course inNumerical Analysis, Mc Graw-Hill, NY, i978.
40. Chajes, A., Principles of Structural Stability Theory,
Prentice-Hall, NJ, 1974.
WI4 I"

62
FACEPLATES Aluminum 2024-T3
tf - 0.0203 + 0.0001 in
Ef - 9.951 x 10³ ksi
Cr 0.2% - 42.68 ksi
CORE Arainid Fiber Hexagonal Celled
Honeycomb: HRH 10-1/8-3.0(2)
s - 0.125 + 0.002 in
p- 3.054 pcf
E- 20.0 ksi
Gw -3.5 ksi
GL - 7.0 ksi
ADHESIVE FM 300 Film Adhesive
ta - 0.013 + 0.001 in
Ea - 463.5 ksi
TEFLON SPACER
t- 0.0035 + 0.0002 in
Table 2.1 SANDWICH BEAM COMPONENT PROPERTIES .

*N63
MEASURED PREDICTED
D3 6.97 in-lb
c - 0.457 in
D1 31288.47 in-lb 23731.28 in.lbD 15.27 in'lb 8.68 in'lb
as 1.0245 d/c - 1.0444
c - 0.506 in
D 14.363 in'lb 8.68 in-lbD2
Table 2.2 SANDWICH BEAM SECTION MEASUREMENTS
4-pt Bending L - 12.02 + 0.01 in
b - 1.507 + 0.001 inh - 0.496 + 0.001 inq - 2.52 + 0.005 inr - 6.00 + 0.005 ins - 0.49 + 0.005 in
Cantilever Bending L - 4.00 ± 0.005 in
b - 1.50 + 0.005 inh - 0.477 + 0.001 in
3-pt Bending L - 12.02 + 0.01 inb - 1.50 + 0.005 inh - 0.496 + 0.001 in
r - 5.50 + 0.005 ins - 0.50 ± 0.005 in
Table 2.3 FLEXURAL RIGIDITY TEST SPECIMEN DIMENSIONS
4..A
* '.
f+,,. .. r+ ''; ., , , ,. :. " 'v .. . , v -" . .",: " -.'. :. -" . .. ." . .'. .'. '. .:"." ': - '.". -.. .:""

64
SPECIMEN THICKNESSNO. Lu CORE OVERALL
(in) c (in) h (in)
1 0.000 0.457 0.4952 3.000 0.457 0.4983 2.001 0.457 0.4984 0.995 0.457 0.4985 1.504 0.457 0.4986 0.500 0.457 0.4987 1.504 0.457 0.4978 0.000 0.457 0.4969 5.000 0.506 0.547
10 3.012 0.506 0.54811 4.020 0.506 0.54812* 4.010 0.506 0.54613* 2.998 0.506 0.545
Note: All measurement uncertanties are + 0.001 in.* Imperfect Beam
Table 3.1 SANDWICH BEAM TEST SPECIMEN DIMENSIONS

65
SPECIMEN Lu GRATING a "n- 1NO. PITCH
(in) (lines/in) (deg) (deg) (in)
2 . 20 2. .0 007
2 3.0 120 20.0 72.0 0.0171
4 1.0 200 18.0 24.0 0.00655 1.5 200 19.0 18.0 0.00756 0.5 200 19.0 18.0 0.00757 1.5 200 20.0 23.0 0.00638 0.0 200 20.0 25.0 0.0069 5.0 200 20.5 14.0 0.00810 3.0 200 17.0 22.0 0.00711 1 4.0 200 17.0 122.0 0.007
Note: Displacement errors are approximately ±1/2 Wn-i
Table 3.2 SHADOW MOIRE DATA
Lu P 1max(in) (lbs)
0.0 3480.03540.0
0.5 1898.01.0 914.01.5 574.0
582.02.0 390.03.0 185.5*
190.04.0 95.05.0_____ 65.4*
NOTE: Core thickness c - 0.506 inAll Others c - 0.457 in
Table 3.3 SANDWICH BEAM FAILURE LOADS

* 66
~I)
FAILURE Pcr (lbs)EQN. 1 theory D1 exper
EULER 2580.9 3402.8STABILITY EQUILIBRIUM 2619.9 3454.22BEAM THEORY W/SHEAR 1717.6 2046.5
,1.
Note: End fixtures included in beam length.
EULER: Pcr - b D1 ( /Lo)2
STABILITY EQUILIBRIUM: tan [kl(l - n )] - I/(kl Y )
4; where k 2 - Pcr/(Dlb)
1 - L0/2 , nl - 1.75 in.
BEAM THEORY W/ SHEAR: see eqn. 2.5.9,
where, Dl theory - 23731.28 in-lb
D1 exper - 31288.47 in'lb
Lo - 16.5 in
b - 3.0 in
Experimental failure loads: 3480 lbs (specimen one)
3540 lbs (specimen eight)
Table 3.4 FULLY BONDED BEAM FAILURE LOADS
;0I
V"V
%h

67
Pmax (lbs)
ANALYTICAL MODEL
Lu EXPERIMENT GENERAL SIMPLIFIED
(in) c (in) error c (in) error
0.0 3480.0 -
3540.0 ,
0.5 1898.0 10519.0 454.2% 6633.87 249.5%
1.0 914.0 1661.75 81.8% 1664.62 82.1%
1.5 574.0 741.85 29.1% 742.71 29.4%582.0
2.0 390.0 419.17 7.5% 419.48 7.6%
2.5 - 269.47 - 269.62 -
3.0 185.5 187.97 1.3% 188.05 1.4%190.0
3.5 - 138.79 - 138.84 -
4.0 95.0* 106.77* 12.4% 106.80* 12.4%
4.5 - 84.87 - 84.86 -
5.0 65.4* 69.08* 5.6% 69.09* 5.6%
NOTE: Core thickness c - 0.506 in
All Others c - 0.457 in
Table 5.1 SANDWICH BEAM FAILURE LOADS
EXPERIMENTAL & THEORETICAL
,_,"

68
IU DATA SET 8 LOG a a CORRELATION(in) FACTOR
,4 Experimental
1.5 to 5.0 -1.8172 3.1058 1275.9 -0.99615
Theoretical1.0 to 5.0 -1.97622 3.21849 1653.8 -0.99999
* Correlation Factor - I - o 2/ a 2x y
where o and o are the summation of standard deviation
of error estimate of the absissa and ordinate.
Plmax u
Table 5.2 LEAST SQUARES FIT
Lu 02 0 2o 03 0 3o(in) (psi) (psi) (psi) (psi)
1.0 12.13 22.78 14819.24 14819.48
1.5 18.40 34.21 12124.24 12124.91
2.0 21.98 40,48 9871.39 9872.53
2.5 24.52 44.71 8288.96 8290.60
3.0 27.09 48.92 7216.13 7218.36
3.5 29.60 52.89 6422.83 6425.73
4.0 31.84 56.28 5788.30 5791.89
4.5 35.23 61.60 5376.17 5380.74
5.0 38.34 66.28 5010.68 5016.28
Table 5.3 CRITICAL STRESSES IN THE ALUMINUM FACEPLATESAT THEORETICAL LIMIT LOAD
~. '%

69
Faceplate
Adhlmv Honeyco0mbA d h e si v eC o re
CURINGCYCLE
Sandwich
FIG 1.1 SANDWICH BEAM CONSTRUCTION

70
\01 x
Cell ArrongementEnd View NO
Tb
Enlarged End ViewV b/2 ~t
z4FIG 2.1 SANDWICH BEAM LAY-VP AND
GEOMETR IC PARAMETERS

a 71
A. FACEPLATE YIELDING
ND NDB. INTRA-CELL DIMPLING
NCC.SERCIPN NC
C.4 7 SHA RIPN
Nw xI Nwz
D. FACEPLATE WRINKLING
N8 N
E. OVERALL BUCKLING
* FIG 2.2 SANDWICH BEAM FAILURE MODES
aii I 111 II I II

72
C-.,
CU LL
cueooz
cu -j2m
ccL LIi
C-)
I- I -
rul
en Lnc n nI
CU -
-A% % 1w%z

73
Coe
N 2C
ru
~II
-LJ
N.l
C3
- ~ ~7 -

74
C-"
L.
-
LUN
'It
in. c iniV;D
(b
,,q

75
\% C..)%g%U
- L
% cu U-
% -%2m
2C
\ \\ \%
as sea '-amII..:so. S *sTm
i~UD
z
ljj I; l, P.,

76
-- A - C ma -I LUJ
in 9! U in irUt *~ ,I ILi)
3, I cc
14i1 UJC)
Jsu In Ina
Ale -
/ 'I

77
'I3 C
Lii
lt0i
'S c c cu
via.
AZ .IIAc . C'C' lax
I -
* *i~~ I :LU~U!~III a
S., -uL
I -4
LL.
CL

- - -- - -
78
L.J
4 .1 _ -
ICU
I p -
* L
%mop'
-0 kT

PRO ~~ ~ ~ ~ rr r~ PC PR Fr.VWVWV
79
CYUL
SnL
2MUL
0~ U-
0 V)
F-i1d IV)~
KL
-4'~
III U.__
,\II~ II,] 0
Ll 1 I L.
L=L

80
II ~ LOADINGLi--~JJ BLOCK
ALUMINUM-,GRIPS
SANDWICHBEAM
ENDFIXTURE-'O
FIG 2.11 SCHEMATIC OF SPECIMEN AND END FIXTURE ASSEMBLY

81
FIG 2.12 SPECIMEN COMPONENTS PRIOR TO ASSEMBLY
;' r. - Platen
ThermocoupleSpecimen
Temperature
- Hydraulic Actuator
FIG 2.13 HEATED PLATEN PRESS USED FOR
CURING THE SANDWICH STRUCTURE

" 82
* 400-
-350I(OF) -
300-
= ,"' '=200-
Pressure1I0- Range: 15 to 100psi
. ,I I I I I I I I I
0 20 40 60 80 100-. t (min)
FIG 2.14 ADIESIVE TEIPERATIRE CURING CYCLE
FIG 2.15 CURED SPECIMEN PRIOR TO ATTACHMENT
OF END FIXTURES
4 : w ."O .- " .- £' ' .- .=-. ' " . ' , -" ' . .' -" ." . , -.". . --'. ..- .. ..""% % . ..

A-A7 683 ON THE BUCKLING OF SANDWICH BEANS CONTAINING 2/2UNBONDED REGION(U) AIR FORCE INST OF TECHWRIGHT-PATTERSON RFB OH C J FRUSHON NAY 86
UNCLASSIFIED AFIT/C/NR-86-i85T NFF-83-52370 F/G i/6 L
EMNIIIIII30DBN,EEEEEEEE--EIIIII

M L2.5
96'
L-..68-.
CR(XOPy RESOLUTION TEST CHART
"I 6w i., %

83
0b
V P/2
P/ P/2
r1
P/2s...
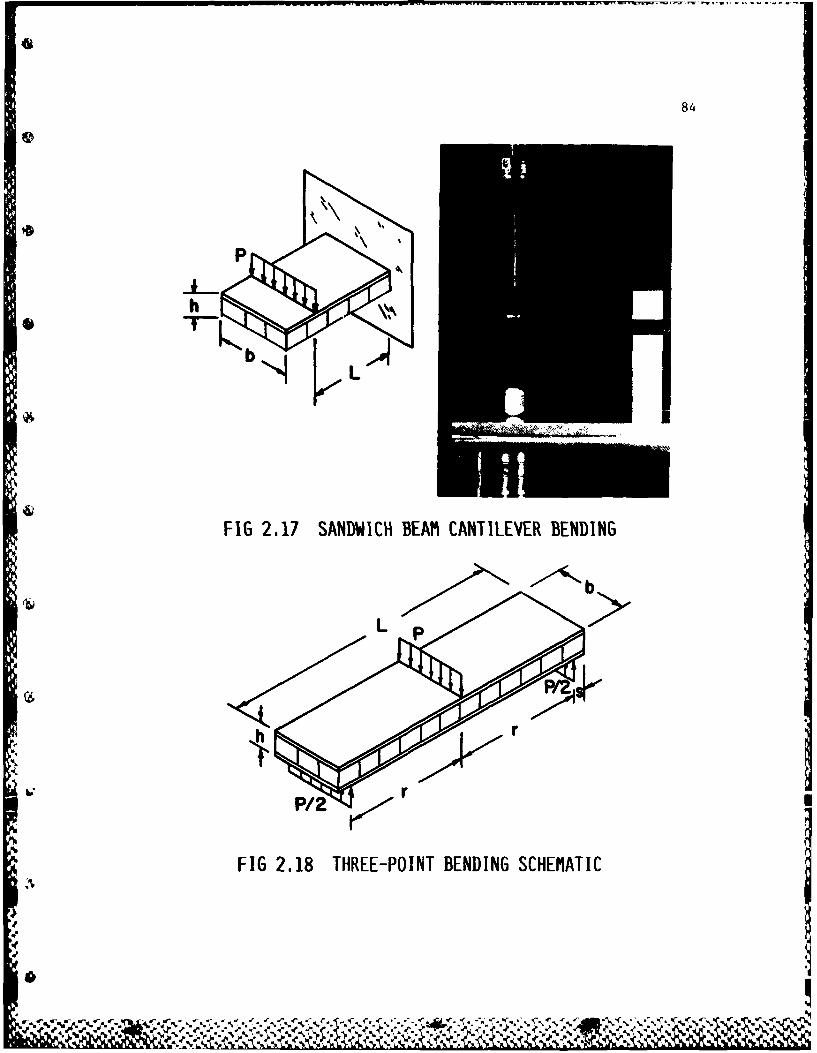
84
h
*L
FIG 2.17 SANDWICH BEAM CANTILEVER BENDING
FIG 2.18 THREE-POINT BENDING SCHEMATIC

85
0
C2
LL 0
LLU
I-
CL.
0-4cm
V

86
Monitor X-Y Y Plotter
VideoAnnlyze
* VCRILoadCell
Video~CameraX-Y Plotter
,-- LVDT's p,
,,Specime n
LightSource
~Servo-
Actuator -- "I I " ---Acuao Function_ ~~~ _.ivGnerator, ILVDT
FIG 2.20 EXPERIMENTAL EQUIPMENT &DATA RECORDING SCHEMATIC
IJo
'" 3 . '. . " '' ' s , '4 " '' , '' :;'' < ;2- ,.' .- ' ,'-,: .:,";, . i,,".'' N-'-,"-.-" * y -.; .".2-":-"*

87
C CO
-JL
Cl-
mC-,
-LJ
014C14
L-

88
00
LJ
Lm
00CD
LU
CD
CNCN
00
0II
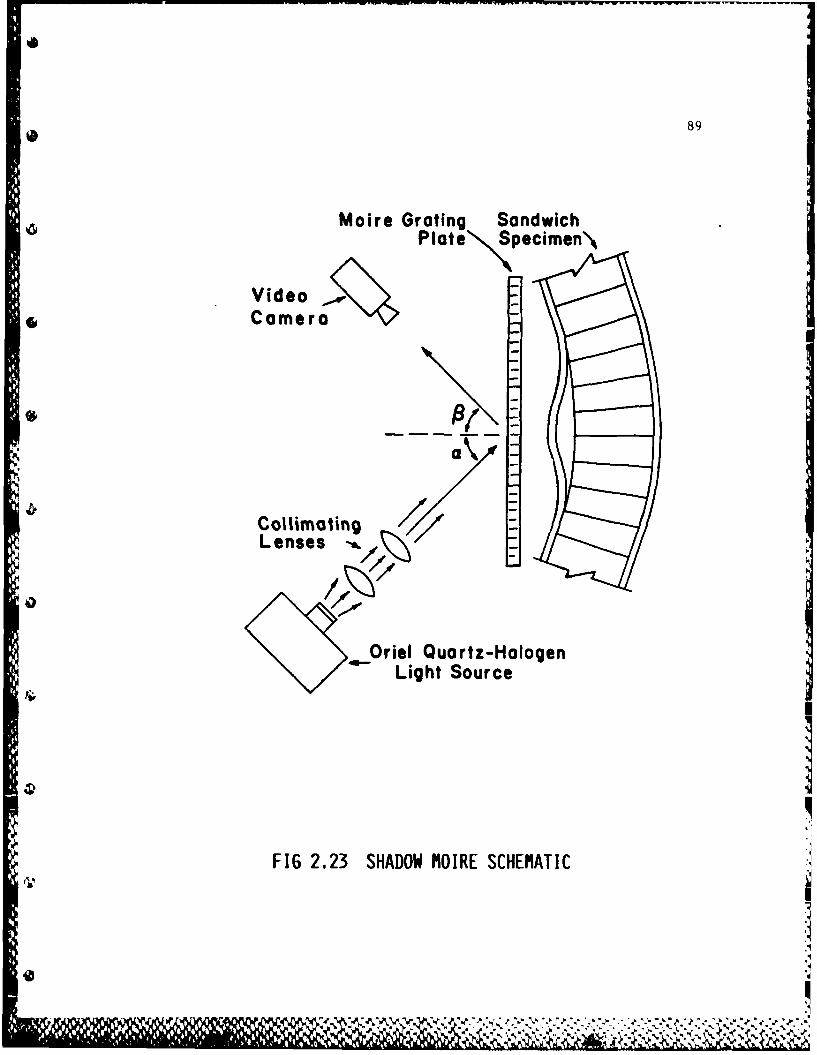
89
Moire Grating SandwichPlate Secimen\
Video ,* Camera
CollimatingLenses A 'a\
.. Oriel Quartz-HalogenLight Source
FIG 2.23 SHADOW MOIRE SCHEMATIC

90
Loading Block
Grating Plateisplacement LVDT
Specimen
FIG 2.24 ARRANGEMENT OF THE MOIRE GRATING PLATE
, .N .; .-? ',, % .r - 2, .-.-. .- .Jm.,-. ..., . ...i.- - .;."''i-'-"."- . -~ ,% .,"

91
Monitor
* a Vido Analyzer
Video Cassette
Rcrd Sr
FIG 2.25 VIDEO RECORDING AND ANALYZING APPARATUS
1JI-A

92
3.6P,
(kips) Experimental 0.0
3 PredictedI 0
(in)2.4 1
1.2 4
.6
0 15 30 45 60-3.- ~A(inxl1 )
FIG 3.1 LOAD VERSUS AXIAL DISPLACEMENT I(Lu FROM 0.0 TO 0.5 IN.)
, :
j°i)K,4

93
P 1.0
(kips) Experimental.8 !" Predicted Lu
(Limit Load) (in)
.64 1.5
'.48
2.0
.32
.A6 3.0
4.0
5.
0 4 B 12 16
-- A (ini )
FIG 3.2 LOAD VERSUS AXIAL DISPLACEMENT(LU FROM 1,0 TO 5.0 IN.)

[ 94
.96 I
P, 1.0(kips) .8
I.64 (in)
qP,
.48 Experimental
Predicted
(Limit Load)!
..
3.0
' ---- 4.0
5.00
0 50 t00 150 200
W3, (in x 10
.r. FIG 3.3 LOAD VERSUS W30 DISPLACEMENT
S1.2
"p. l-
.. : ... ..,- , ,,. . . -_, .," . ." . , .. , ', ,,,. , .*. ... -.- . .. . . . . . . . ,.> ,, - . , . .. . ... , ...

95
CO)
LA ~ LAU
LUc-
U-
_______ CD,
00
C-2C
Lt U00 CLY.UIw
LLI
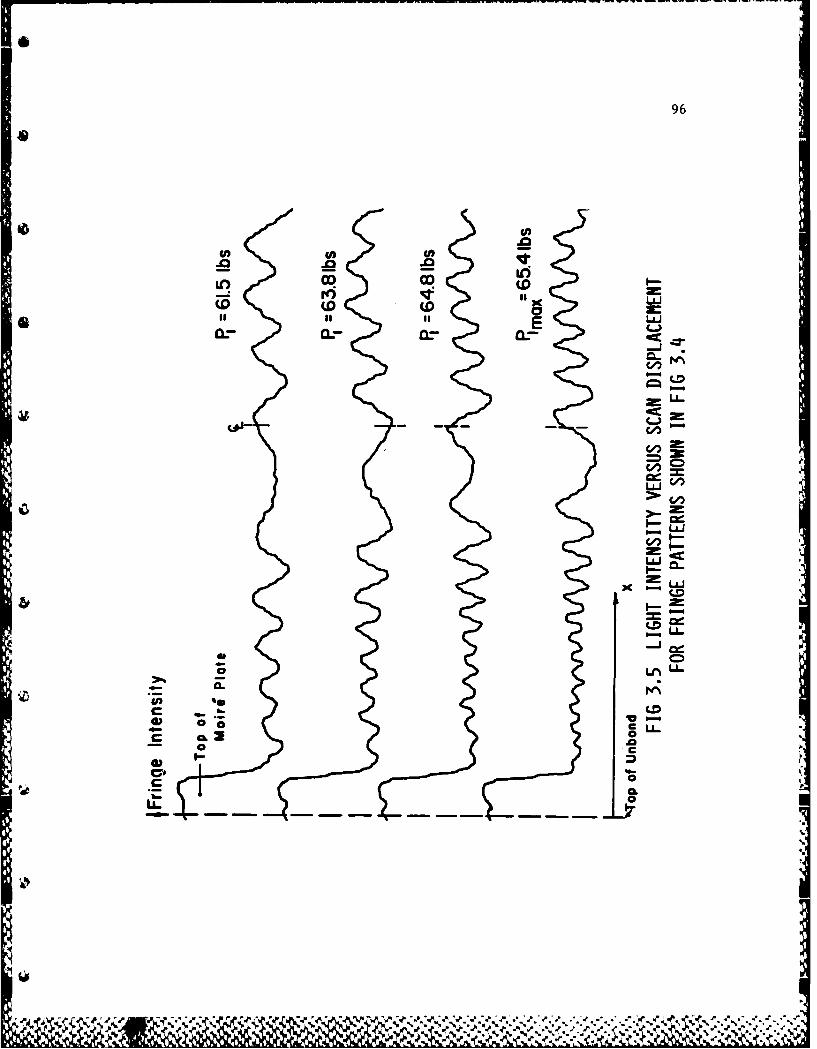
96
If) OD OD-u (D 2
-J
COO-
3C,
KLUJ
-U-* 0J
CC
0 CD
CL 0
CM
0
IL.pY -

97
Oln 10- 3) b5/ 75
-12 - Specimens 4
-24L (A) EXPERIMENTAL
4..J) 6 66
Co. 163) P 16
4x 13 (in)
-6- (B) PREDICTED
FIG 3.6 UNBOND FACEPLATE OUT-OF-PLANEDEFLECTION SHAPES VERSUS AXIAL LOAD
(Lu = 1.0 IN.)
'a%
* ~%

98
80- 400
w(x 3) p1 42
00L
-40- pecimw 3 3 in)
(B)3 PRDCE
0L -t 0 IN.
X'0I
_10-

99
w3 K)60- 190.
-ial )L (n
-30- Specimen: 10
-60-(A) EXPERIMENTAL
wx)30 -p, 188
15II53(n)
(B) PREDICTED
FIG 3.8 UNBOND FACEPLATE OUT-OF-PLANEDEFLECTION SHAPES VERSUS AXIAL LOAD
(Lu =3.0 IN.)

100
r)so- 3 P. 100*3 3
-40- specimens I I 3(n
-,SOL(A) EXPERIMENTAL
40- p 3 jI
(B) PREDICTED-40
FIG 3. 9 UNBOND FACEPLATE OUT-OF-PLANE
DEFLECTION SHAPES VERSUS AXIAL LOAD(Lu 4.0 IN.)
-i ''l -p l 1 op
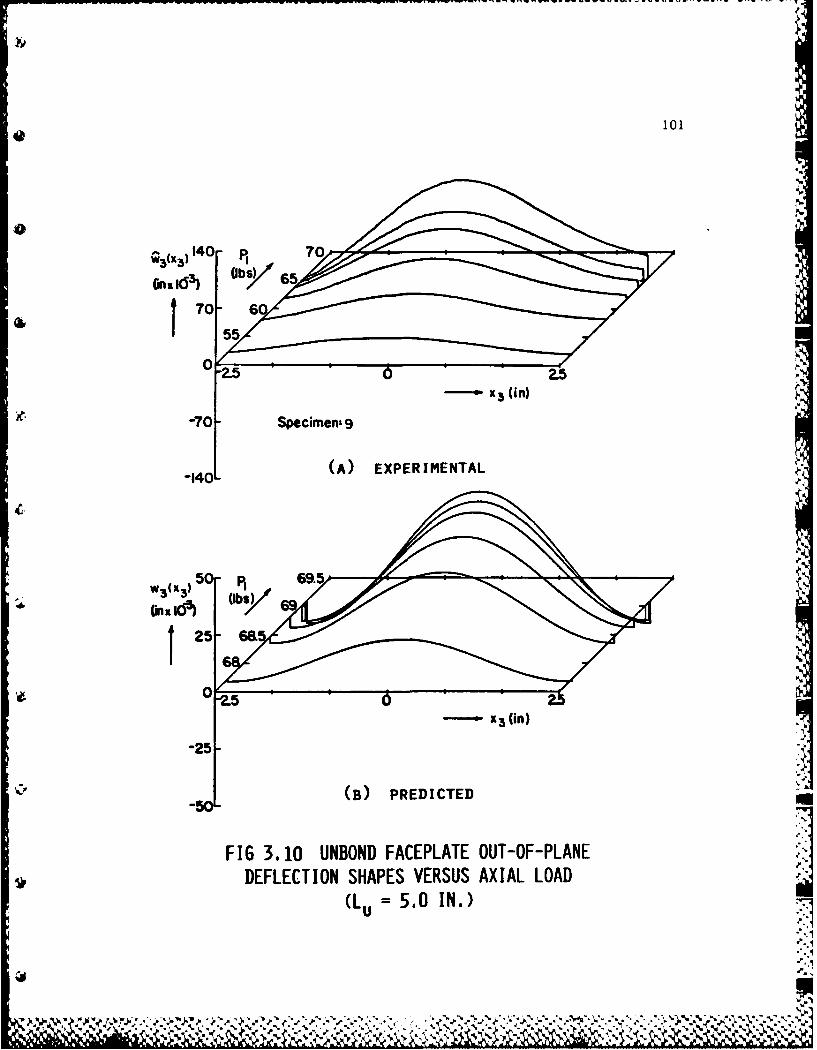
101
13x) 4 0 p, 70
Oi6 3) (bs/ 65
-70- Specimens 1((11
-140-(A) EXPERIMENTAL
50 69.11
(B) PREDICTE
x~n)
FIG 3.10 UNBOND FACEPLATE OUT-OF-PLANEDEFLECT ION SHAPES VERSUS AXIAL LOAD
(Lu 5.0 IN.)]
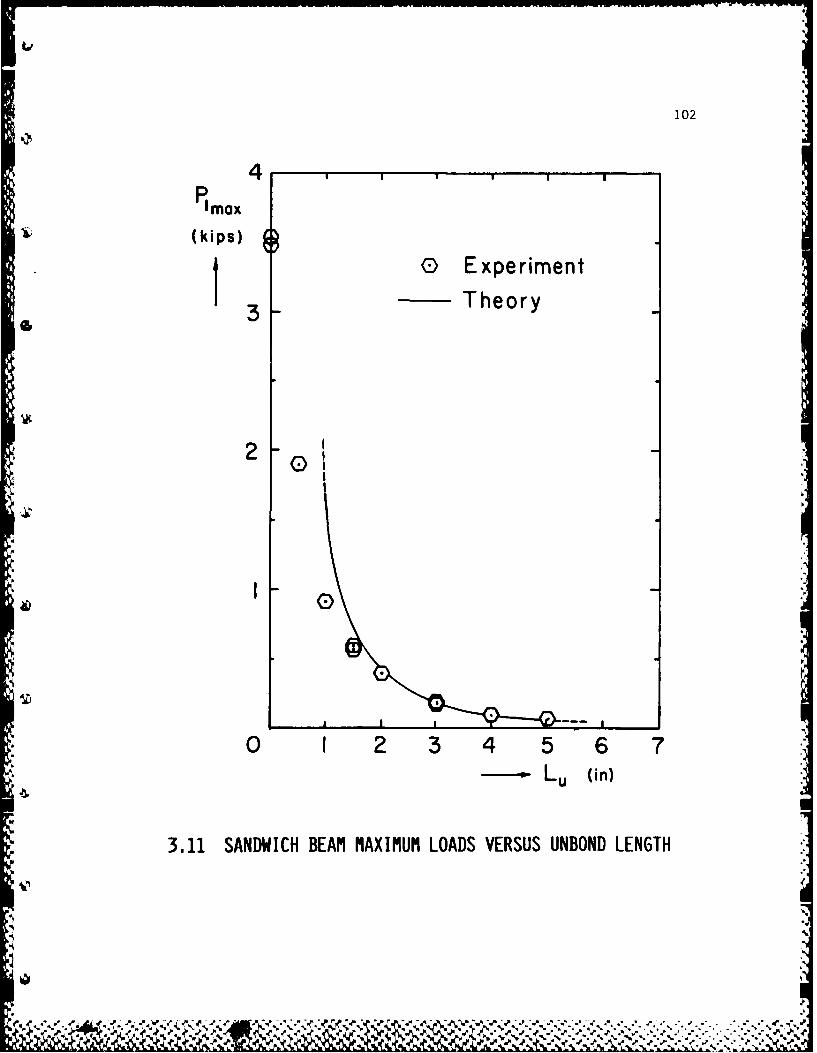
102
4
'mox(kips)
0 Experiment
43 Theory
20
0 1 2 34 5 6 7-L~ (i0n)
*3.11 SANDWICH BEAM MAXIMUM LOADS VERSUS UNBOND LENGTH
le

103
5.0 1111 1 1 1 1 T I1
(kips)0
0 1 1.0 0
.5-
0 Experiment
.05- --- Least Squares FitTheory
-OilI 1 j a II1 1.1 .5 1 5 10
Lu (in)
FIG 3.12 LOGORITHMIC PLOT OF MAXIMUM LOADSVERSUS UNBOND LENGTH
Ar

104
c.
A. OVERALL VIEW
B. CLOSE-UP VIEW OF FAILURE REGION
FIG 3.13 FAILURE OF A FULLY BONDED SPECIMENV.
f-t. ft. -.- ,-,- ,, , ,.,.Z,.. " "'C , ' ', - -"" - -"" - - " ' -
'"""""'--- "-"' " " " ' - - "'- - -""., r

105
Al
B)
Al: L a3in. A2: L u 2in.
A. OVERALL VIEW
Bl: Lu 2in. B2: L 3 1in.
qB. CLOSE-UP VIEW OF UNBONDED REGION
it (OPPOSITE SIDE OF BEAM)
FIG 3.14 FAILURE OF AN UNBONDED SPECIMEN

106
FI .5BCLIGFIUEOFSEIE E
(L .0 I .
6r l IIII llI j jl I"'
0I

107
4
.
4-..
FIG 3.16 BUCKLING FAILURE OF SPECIMEN NINE(Lu = 5.0 IN.)
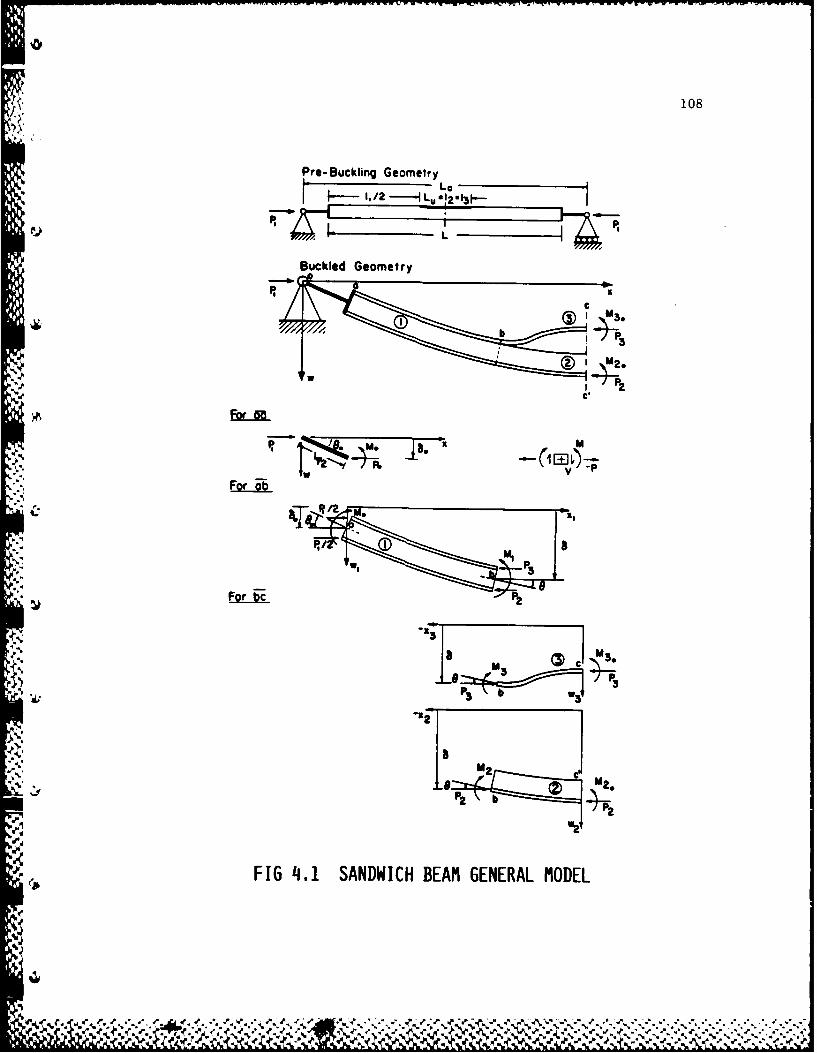
108
Pre-Buckling Geometry
1. 1/2 -1Lu @!2 3
Buckled Geometry
K
I b,
#w %:
a, 2C
R. /2
P.
P3 b
% I34.
FIG 4.1 SANDWICH BEAM GENERAL MODEL
.,,..'e .~ _'..,.4._, f ,r , ',.e ,_ ,4 .r ',. , -i.J.e'', -,' ..- ,..,.,€ .. , .,.,.,..- -. ..- -

* 109
... ~- ~LLI
L-
LL-
LUI
LLU
.... L......
. . . . . . ..
LL4
. ~ ~ ~ ~ ~ 0 . ..... A

110
-ar
.77
N b-- 1,1
0~L1
N --
Cu d
arf 4

70.0
(Ibs)I 69.5-
69.0-
68.5-
0 0.6 1.2 1.8 2.4-A A(in x l0 )
FIG 4.4 PREDICTED LOAD VERSUS AXIAL DISPLACEMENT(Li, 5.0 IN.)
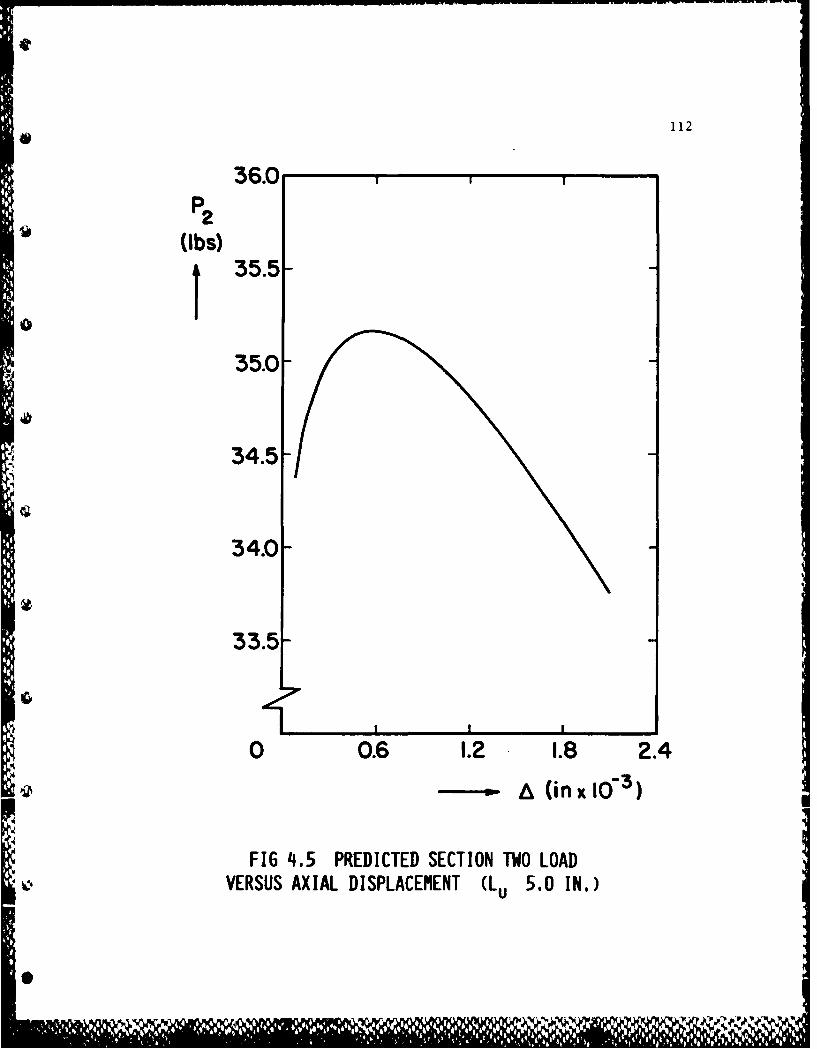
112
36.0P2
(Ibs)
35.0-
34.5-
34.0-
33.5[
0 0.6 1.2 1.8 2.4
SA (in xt03)
FIG 4.5 PREDICTED SECTION TWO LOADVERSUS AXIAL DISPLACEMENT (Lu 5.0 IN.)
I0 1" 11 1 v -

113
70.0PI
(Ibs)I69.5-69.0-
* 68.5-
68.0-
67.5-
0 30 60 90 120
--- - W3 (in xi )
FIG. 4.6 PREDICTED LOAD VERSUS W30 DISPLACEMENTS(Lu 5.0 IN.)

04P 114
* * *. LLI
LUII-
LJ
U-J
:21 U
.iol
-I' too

115
FIG B.1 BENDING AND SHEAR CONTRIBUTIONS TOTOTAL BUCKLING DEFLECTIONS
p
NN
FIG B.2 BENDING CONTRIBUTION TO BUCKLING DEFLECTIONS

116
Iss
FIG B.3 SHEAR CONTRIBUTION TO BUCKLING DEFLECTIONS

VITA
% Carl Joseph Frushon was born in Wilkes-Barre, Pennsylvania,
on July 4, 1962, the son of Rita Elizabeth Frushon and Carl
Benjamin Frushon. After completing his work at Hereford Junior-
Senior High School, Hereford, Maryland, in 1980, he entered the
University of Notre Dame, Notre Dame, Indiana. While at Notre
Dame, he was actively involved in the Air Force ROTC program.
During the spring of 1983, he became the first Junior to hold the
position of Corps Commander. In May, 1984, he received the degree
of Bachelor of Science in Aerospace Engineering from the University
of Notre Dame. Upon receipt of his degree in May 1984, he was
commissioned a Second Lieutenant in the USAF. After acceptance
into the Air Force Institute of Technology, Civilian Institutions
Program, he entered The Graduate School of The University of Texas
in September 19B4.
Permanent address: 197 S. Southwood Ave.
Annapolis, Maryland 21401
This thesis was typed by the author.117
I%* O .' le
AA'.

iv~Z~~ ,*.;
MM -.5A