Effect of the liberalization on maize production systems in ...
77
Faculty of Bioscience Engineering Academic year 2011-2012 Effect of the liberalization on maize production systems in Kenya: 1990-2010 Jolien Swanckaert Promotors: Prof. Dr. ir. Marijke D’Haese Dr. ir. Hugo De Groote Master’s dissertation submitted in partial fulfillment of the requirements for the degree of Master of Bioscience Engineering: Agriculture
Transcript of Effect of the liberalization on maize production systems in ...

Faculty of Bioscience Engineering
Academic year 2011-2012
Effect of the liberalization on maize production
systems in Kenya: 1990-2010
Jolien Swanckaert
Promotors: Prof. Dr. ir. Marijke D’Haese
Dr. ir. Hugo De Groote
Master’s dissertation submitted in partial fulfillment of the requirements
for the degree of Master of Bioscience Engineering: Agriculture

Deze pagina is niet beschikbaar omdat ze persoonsgegevens bevat.Universiteitsbibliotheek Gent, 2021.
This page is not available because it contains personal information.Ghent University, Library, 2021.

Acknowledgments
First, I would like to thank Prof. dr. ir. Marijke D’Haese for her enthusiastic supervision and her
advices in directing me all through this work. I would also like to thank Dr. ir. Hugo De Groote
for guiding me during my stay in Nairobi, Kenya.
I would also like to thank ir. Friedl Vancoillie for her efforts in helping me analizing GIS data.
The financial support provided by the faculty of bio-engineering and the facilitation by the Interna-
tional Maize and Wheat Improvement Center (CIMMYT) in Nairobi, Kenya. I am grateful to all
the people in CIMMYT who generously offered me their time, guidance and suggestions: Zachary
Gitonga, Stephen Mugo, Isaac Mutabai.
My gratitude also extends to the leaders of the maize seed companies and institutions for their
time and explanations: Francis M. Ndambuki, Saleem Esmail, Syed O. Bokhari, Omari M. Odongo,
Moses Onim, Kassim Owino, Kinyua Mbijjewe, James Mburu, and James Muthee.
Finally, to my friends and family for their continuous moral support, care and understanding. Thank
you for your encouragement when it was most required.

CONTENTS
Contents
List of Tables vi
List of Figures viii
Acronyms ix
Executive summary x
Executive summary in Dutch xi
1 Introduction 1
1.1 Background . . . . . . . . . . . . . . . . . . . . . . . . . . . . . . . . . . . . . . 1
1.2 Problem statement . . . . . . . . . . . . . . . . . . . . . . . . . . . . . . . . . . 2
1.3 Research objectives . . . . . . . . . . . . . . . . . . . . . . . . . . . . . . . . . . 3
1.4 Dissertation structure . . . . . . . . . . . . . . . . . . . . . . . . . . . . . . . . . 3
2 Literature review 4
2.1 The plant of study: maize . . . . . . . . . . . . . . . . . . . . . . . . . . . . . . . 4
2.1.1 Introduction . . . . . . . . . . . . . . . . . . . . . . . . . . . . . . . . . . 4
2.1.2 Challenges of maize production in Africa . . . . . . . . . . . . . . . . . . . 6
2.1.3 Green revolution . . . . . . . . . . . . . . . . . . . . . . . . . . . . . . . . 9
2.1.4 Evolution of the maize seed sector . . . . . . . . . . . . . . . . . . . . . . 11
2.2 The country of study: Kenya . . . . . . . . . . . . . . . . . . . . . . . . . . . . . 12
2.2.1 Maize in Kenya . . . . . . . . . . . . . . . . . . . . . . . . . . . . . . . . 12
2.2.2 Evolution of Kenya’s agricultural development policy . . . . . . . . . . . . 14
2.2.3 Maize research and seed production in Kenya . . . . . . . . . . . . . . . . 17
2.2.4 Plant variety protection . . . . . . . . . . . . . . . . . . . . . . . . . . . . 19
iii

CONTENTS
3 Methodology 20
3.1 Conceptual framework . . . . . . . . . . . . . . . . . . . . . . . . . . . . . . . . . 20
3.2 The data . . . . . . . . . . . . . . . . . . . . . . . . . . . . . . . . . . . . . . . . 21
3.3 Empirical framework . . . . . . . . . . . . . . . . . . . . . . . . . . . . . . . . . . 22
3.4 Adoption model specification . . . . . . . . . . . . . . . . . . . . . . . . . . . . . 23
3.5 Structure of the results section . . . . . . . . . . . . . . . . . . . . . . . . . . . . 24
4 Results and discussion 25
4.1 Description of the study area . . . . . . . . . . . . . . . . . . . . . . . . . . . . . 25
4.1.1 General descriptives of farmers in the study . . . . . . . . . . . . . . . . . 25
4.1.2 Precipitation and temperature . . . . . . . . . . . . . . . . . . . . . . . . 28
4.2 Market liberalization . . . . . . . . . . . . . . . . . . . . . . . . . . . . . . . . . . 30
4.2.1 Market structure: maize seed companies and their varieties . . . . . . . . . 30
4.2.2 Market structure: the role of the public sector . . . . . . . . . . . . . . . . 32
4.3 Effect of the liberalization . . . . . . . . . . . . . . . . . . . . . . . . . . . . . . . 34
4.3.1 Variety replacement . . . . . . . . . . . . . . . . . . . . . . . . . . . . . . 34
4.3.2 Market penetration . . . . . . . . . . . . . . . . . . . . . . . . . . . . . . 35
4.3.3 Adoption rates . . . . . . . . . . . . . . . . . . . . . . . . . . . . . . . . . 39
4.3.4 Comparing adopters and non-adopters . . . . . . . . . . . . . . . . . . . . 39
4.3.5 Logistic model estimates . . . . . . . . . . . . . . . . . . . . . . . . . . . 44
4.4 Trends in variety choice . . . . . . . . . . . . . . . . . . . . . . . . . . . . . . . . 46
4.4.1 Increased importance of hybrids . . . . . . . . . . . . . . . . . . . . . . . 46
4.4.2 Increased importance of early and medium maturing varieties . . . . . . . . 47
4.4.3 Increased importance of the second season . . . . . . . . . . . . . . . . . . 49
5 Conclusion 52
iv

CONTENTS
References 54
Appendices i
A Interviewees i
B Maize varieties ii
v
LIST OF TABLES
List of Tables
1 Climatic conditions over the AEZs (Corbett, 1998) . . . . . . . . . . . . . . . . . 13
2 Average maize area (ha) . . . . . . . . . . . . . . . . . . . . . . . . . . . . . . . 26
3 Farmer characteristics . . . . . . . . . . . . . . . . . . . . . . . . . . . . . . . . . 27
4 Average seasonal temperature (◦C) . . . . . . . . . . . . . . . . . . . . . . . . . . 30
5 Maize seed companies active in Kenya . . . . . . . . . . . . . . . . . . . . . . . . 31
6 Comparison of the average weighted age of IMVs by AEZ (years) . . . . . . . . . . 34
7 Average weighted age in 2010 (years): Comparison of the KSC subsample and the
overall situation . . . . . . . . . . . . . . . . . . . . . . . . . . . . . . . . . . . . 35
8 IMVs planted on more than 5% of the area in the low tropics (% of the total maize
area) . . . . . . . . . . . . . . . . . . . . . . . . . . . . . . . . . . . . . . . . . 37
9 IMVs planted on more than 5% of the area in the dry midaltitude zone (% of the
total maize area) . . . . . . . . . . . . . . . . . . . . . . . . . . . . . . . . . . . 37
10 IMVs planted on more than 5% of the area in the dry transitional zone (% of the
total maize area) . . . . . . . . . . . . . . . . . . . . . . . . . . . . . . . . . . . 38
11 IMVs planted on more than 5% of the area in the moist transitional zone and high
tropics (% of the total maize area) . . . . . . . . . . . . . . . . . . . . . . . . . 38
12 IMVs planted on more than 5% of the area in the moist midaltitude zone (% of the
total maize area) . . . . . . . . . . . . . . . . . . . . . . . . . . . . . . . . . . . 39
13 Comparison of farmer characteristics in the low tropics in 2010 . . . . . . . . . . . 40
14 Comparison of farmer characteristics in the dry midaltitude zone in 2010 . . . . . . 41
15 Comparison of farmer characteristics in the dry transitional zone in 2010 . . . . . . 41
16 Comparison of farmer characteristics in the moist transitional zone in 2010 . . . . 42
17 Comparison of farmer characteristics in the high tropics in 2010 . . . . . . . . . . 43
18 Comparison of farmer characteristics in the moist midaltitude zone in 2010 . . . . 43
19 The logit analysis for adoption of IMVs . . . . . . . . . . . . . . . . . . . . . . . 44
vi
LIST OF TABLES
20 The logit analysis for adoption of IMVs: final model . . . . . . . . . . . . . . . . . 45
21 Importance of hybrids and OPVs (% of IMV area planted) . . . . . . . . . . . . . 46
22 Recycling of improved OPVs and hybrids in 2010 . . . . . . . . . . . . . . . . . . 46
23 Changes in maturity (% of the IMV area weighted by AEZ) . . . . . . . . . . . . . 47
24 Maturity of IMVs used by farmers who produce maize during both the long and
short season in 2010: Comparison between the two seasons . . . . . . . . . . . . . 51
25 Maturity of IMVs in 2010: Comparison between farmers who have one growing
season and farmers who have both seasons . . . . . . . . . . . . . . . . . . . . . . 51
26 Interviewees seed companies . . . . . . . . . . . . . . . . . . . . . . . . . . . . . i
27 Maize varieties . . . . . . . . . . . . . . . . . . . . . . . . . . . . . . . . . . . . . ii
vii

LIST OF FIGURES
List of Figures
1 Maize affected with Striga . . . . . . . . . . . . . . . . . . . . . . . . . . . . . . 8
2 Maize production in Kenya (FAO stat) . . . . . . . . . . . . . . . . . . . . . . . . 12
3 Maize area per AEZ in 1990 (Corbett, 1998) . . . . . . . . . . . . . . . . . . . . . 14
4 The major AEZs for maize growing in Kenya . . . . . . . . . . . . . . . . . . . . . 21
5 Maize area per household (ha) . . . . . . . . . . . . . . . . . . . . . . . . . . . . 25
6 Total precipitation in 1992 (mm) . . . . . . . . . . . . . . . . . . . . . . . . . . . 28
7 Total precipitation in 2010 (mm) . . . . . . . . . . . . . . . . . . . . . . . . . . . 29
8 Number of varieties reported by farmers by origin . . . . . . . . . . . . . . . . . . 31
9 Number of varieties used in 2010 per AEZ . . . . . . . . . . . . . . . . . . . . . . 32
10 (A) Market structure in 1992; (B) Market structure after the liberalization . . . . . 33
11 Source of genetic material . . . . . . . . . . . . . . . . . . . . . . . . . . . . . . . 33
12 Market penetration of the different company groups . . . . . . . . . . . . . . . . . 36
13 Adoption improved maize varieties (% farmers) . . . . . . . . . . . . . . . . . . . 39
14 Maturity of IMVs in 1992 . . . . . . . . . . . . . . . . . . . . . . . . . . . . . . . 47
15 Maturity of IMVs in 2001 . . . . . . . . . . . . . . . . . . . . . . . . . . . . . . . 48
16 Maturity of IMVs in 2010 . . . . . . . . . . . . . . . . . . . . . . . . . . . . . . . 48
17 Relative share of the second maize growing season based on area . . . . . . . . . . 50
18 Percentage farmers having two maize growing seasons . . . . . . . . . . . . . . . . 50
viii
ACRONYMS
Acronyms
AEZ . . . . . . . . . . . . . . . . . . agro-ecological zone
CIMMYT . . . . . . . . . . . . . . . International Maize and Wheat Improvement Centre
DUS . . . . . . . . . . . . . . . . . . Distinctness, Uniformity and Stability
GATT . . . . . . . . . . . . . . . . . General Agreement on Tariffs and Trade
GDP . . . . . . . . . . . . . . . . . . gross domestic product
IMV . . . . . . . . . . . . . . . . . . improved maize variety
IPR . . . . . . . . . . . . . . . . . . Intellectual property right
IRMA . . . . . . . . . . . . . . . . . Insect Resistant Maize for Africa
KARI . . . . . . . . . . . . . . . . . Kenya Agricultural Research Institute
KEPHIS . . . . . . . . . . . . . . . . Kenyan Plant Health Inspectorate Services
KSC . . . . . . . . . . . . . . . . . . Kenya Seed Company
NCPB . . . . . . . . . . . . . . . . . National Cereals and Produce Board
NPT . . . . . . . . . . . . . . . . . . National Performance Trial
OPV . . . . . . . . . . . . . . . . . . open pollinated variety
SAP . . . . . . . . . . . . . . . . . . Structural Adjustment Programmes
TRIPS . . . . . . . . . . . . . . . . . Trade-Related Aspects of Intellectual Property Rights
UPOV . . . . . . . . . . . . . . . . . Union for the Protection of New Varieties of Plants
WSC . . . . . . . . . . . . . . . . . . Western Seed Company
ix

EXECUTIVE SUMMARY
Executive summary
This dissertation analyzes the response of the maize seed industry to the seed market liberalization
in Kenya, and studies how farmers have reacted to the increased market supply of improved maize
varieties. The analysis uses outcomes from three random household surveys in the six agroecological
zones in Kenya, the first from before the liberalization, and the others from afterwards.
The main findings are that maize market liberalization has increased the options for farmers, but
seed companies are having a hard time reaching and convincing farmers with their new varieties.
The penetration of new companies has been successful in Central Kenya, but the diffusion in
other areas stays behind. Similarly, the Kenya Seed Company as the traditional seed provider
still holds the largest market share in the high potential zones, but it has difficulties replacing old
varieties. Although good progress is made in some parts of Kenya, the total adoption of improved
maize varieties has stagnated around 77%. These findings suggest there is substantial room for
improvement in both the further liberalization of the market and the adoption of improved varieties
by farmers. Maize planting strategies are influenced by the higher supply of improved maize varieties.
Although improved maize varieties are available as hybrids and improved open pollinated varieties,
hybrids are preferred. The use of early maturing maize varieties has increased with a shift to two
maize growing seasons.
Parameters that characterize non-adopters are intercropping, no-fertilization, and recycling. These
non-adopting farmers will only use improved maize varieties when these characteristics are tackled.
In order to increase farmer adoption rates, companies should include, and better communicate,
maize production strategies in their breeding program. One way to achieve this, is a balanced
collaboration between public and private institutions whereby objective information is provided to
the farmers.
x

EXECUTIVE SUMMARY IN DUTCH
Executive summary in Dutch
Deze masterproef analyseert hoe de maıszaadindustrie reageerde op de marktliberalisatie in Kenia
en hoe boeren hebben omgegaan met het toegenomen marktaanbod van verbeterde maısrassen.
De analyses maken gebruik van drie at random enquetes bij de Keniaanse gezinnen in de zes
agro-ecologische zones. De eerste enquete is afgenomen voor de liberalisatie, de andere twee zijn
afgenomen na de liberalisatie.
De voornaamste ondervindingen zijn dat de maıszaad marktliberalisatie heeft gezorgd voor een toe-
name in het aanbod van maısrassen voor de boeren, maar de zaaizaadbedrijven kunnen boeren
moeilijk bereiken en overtuigen met hun nieuwe rassen. Nieuwe bedrijven waren succesvol in Cen-
traal Kenia maar konden weinig boeren in de andere zones bereiken. Ook het Keniaanse zaadbedrijf
’Kenya Seed Company’ dat historisch de enige verdeler van maıszaad was, heeft nog steeds het
grootste marktaandeel in de hoog-potentiele zones dankzij oude maısrassen maar heeft moeilijkhe-
den om deze te vervangen met hun nieuwe rassen. De totale adoptie van verbeterde maısrassen
stagneerde rond 77% ook al is er vooruitgang geboekt in sommige regio’s in Kenia. Verdere
vooruitgang is dus mogelijk zowel in de marktliberalisatie als in de adoptie van verbeterde rassen
door boeren. Het hogere aanbod van verbeterde maısrassen heeft ook een invloed gehad op het
productieproces. Het aanbod aan verbeterde rassen bevat hybriden en open bestoven populaties,
maar er is een sterke voorkeur naar hybriden. Het gebruik van vroegrijpe rassen is toegenomen met
daaraan gekoppeld een toenemende productie tijdens het tweede groeiseizoen.
Boeren die enkel lokale rassen gebruikten, worden gekenmerkt door het toepassen van mengteelten,
geen gebruik van meststoffen en hergebruik van hun eigen oogst voor een volgend seizoen. Deze
niet-adopters zullen de voordelen van verbeterde rassen enkel inzien als deze productiekenmerken
aangepakt worden. Het is dus aan de zaaizaadbedrijven om hun veredelingsstrategie beter af te
stemmen op de vereisten van de boeren. Via samenwerkingen tussen de publieke en private sector
kunnen boeren beter geınformeerd worden op basis van objectieve informatie.
xi


1 INTRODUCTION
1 Introduction
1.1 Background
Maize is believed to have its origin in Central America about 6,000 to 7,000 years ago. Domestic
maize was developed by the inhabitants of present-day Mexico. Although the geographical origin of
the crop is known, its evolutionary line remains unclear. Modern maize is described as an evolution
from a now extinct ancestor, from teosinte, or from a wild pod corn that later hybridised with
Tripsacum spp. or teosinte (Smith, 1995).
From its centre of origin, maize spread gradually throughout the Americas and later was carried by
European sailors to Europe, Africa and Asia. Maize arrived in Africa most likely through Portuguese
traders who stopped along the African coasts during the sixteenth century (Miracle, 1965). This
maize was flinty, low-yielding, and varied in colour. From the coast, maize slowly moved inland
particularly through the routes of slave traders. Maize only became an important food crop in East
Africa at the beginning of the twentieth century, when European settlers introduced new, white
dent varieties imported from South Africa. By the 1930s, maize was the dominant food crop, its
expansion driven by the demand for white maize for the starch industry in England and the need to
feed miners and farm workers (Byerlee and Eicher, 1997; Smale and Jayne, 2003).
In 2011, maize covered 25 M ha in Sub-Saharan Africa mainly produced by smallholders for food
(77%), while only 12% is used as feed. However, the potential maize production is estimated at 88
M ha after excluding protected and forested areas. This available land is mainly found in Sudan and
other areas in Eastern and Southern Africa, including Mozambique, Angola, Zambia, Madagascar
and Tanzania. West Africa, where no maize hybrids were developed by organizations and companies
of settler farmers like in Eastern and Southern Africa, nevertheless realized the highest growth in
maize area, yields and production (Smale et al., 2011).
As in Kenya, most households rely on their own maize production, food security is in reality a case
of maize security. The Kenyan government, sharing this concern, has tightly controlled the maize
market for more than 30 years, as did the colonial government earlier. The government controlled
marketing within the National Cereals and Produce Board (NCPB), as the centre of the maize
marketing system, and managing the maize movements from farmer to consumer in the country.
Furthermore, maize research and breeding was in hands of Kenya Agricultural Research Institute
(KARI) and its predecessors. Maize seed production and distribution were done by the Kenya Seed
Company (KSC), established by farmers but later on taken over by the government and parastatals
(Jayne and Argwings-Kodhek, 1997; Wangia et al., 2004).
1
1 INTRODUCTION 1.2 Problem statement
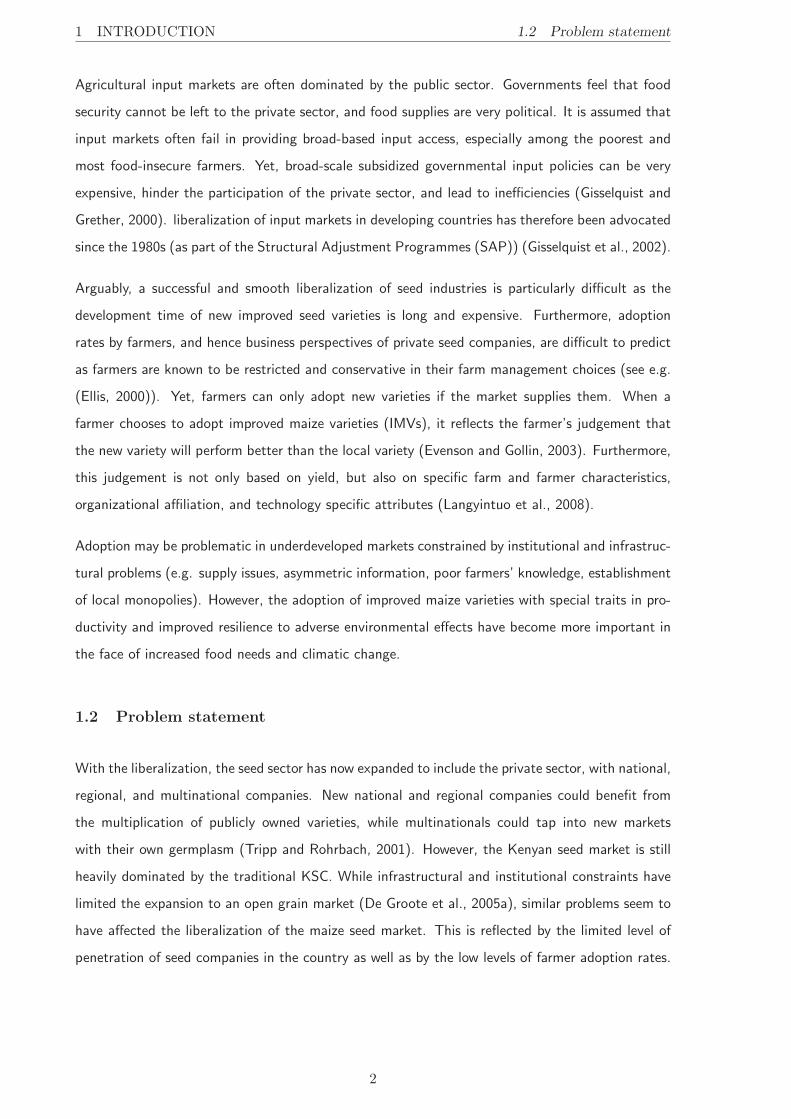
Agricultural input markets are often dominated by the public sector. Governments feel that food
security cannot be left to the private sector, and food supplies are very political. It is assumed that
input markets often fail in providing broad-based input access, especially among the poorest and
most food-insecure farmers. Yet, broad-scale subsidized governmental input policies can be very
expensive, hinder the participation of the private sector, and lead to inefficiencies (Gisselquist and
Grether, 2000). liberalization of input markets in developing countries has therefore been advocated
since the 1980s (as part of the Structural Adjustment Programmes (SAP)) (Gisselquist et al., 2002).
Arguably, a successful and smooth liberalization of seed industries is particularly difficult as the
development time of new improved seed varieties is long and expensive. Furthermore, adoption
rates by farmers, and hence business perspectives of private seed companies, are difficult to predict
as farmers are known to be restricted and conservative in their farm management choices (see e.g.
(Ellis, 2000)). Yet, farmers can only adopt new varieties if the market supplies them. When a
farmer chooses to adopt improved maize varieties (IMVs), it reflects the farmer’s judgement that
the new variety will perform better than the local variety (Evenson and Gollin, 2003). Furthermore,
this judgement is not only based on yield, but also on specific farm and farmer characteristics,
organizational affiliation, and technology specific attributes (Langyintuo et al., 2008).
Adoption may be problematic in underdeveloped markets constrained by institutional and infrastruc-
tural problems (e.g. supply issues, asymmetric information, poor farmers’ knowledge, establishment
of local monopolies). However, the adoption of improved maize varieties with special traits in pro-
ductivity and improved resilience to adverse environmental effects have become more important in
the face of increased food needs and climatic change.
1.2 Problem statement
With the liberalization, the seed sector has now expanded to include the private sector, with national,
regional, and multinational companies. New national and regional companies could benefit from
the multiplication of publicly owned varieties, while multinationals could tap into new markets
with their own germplasm (Tripp and Rohrbach, 2001). However, the Kenyan seed market is still
heavily dominated by the traditional KSC. While infrastructural and institutional constraints have
limited the expansion to an open grain market (De Groote et al., 2005a), similar problems seem to
have affected the liberalization of the maize seed market. This is reflected by the limited level of
penetration of seed companies in the country as well as by the low levels of farmer adoption rates.
2
1.3 Research objectives 1 INTRODUCTION
Kenya is not the only country to struggle with input market liberalization. The balance between
public and private investments is also a challenge for other African countries, e.g. Malawi (Denning
et al., 2009), Benin (Lutz et al., 2007), and Ethiopia (Byerlee et al., 2007), and for other crops
than maize (Tripp, 2000). Kenya has chosen to increase the contribution of the private sector in
the seed market but, unlike the successful liberalization of the fertilizer market (Omamo and Mose,
2001), the maize seed industry has yet to fulfil the expectations.
1.3 Research objectives
This study seeks to understand how the liberalization had an impact on the maize seed industry and
how this changed producers’ behaviour. Unlike previous studies, this paper analyzes the evolution
of selected indicators over the last 20 years using primary data from three household surveys.
The specific objectives are:
• To analyze changes in market structure and the role of the public sector;
• To measure the effect of the liberalization on variety replacement, market penetration, and
adoption rates;
• To analyze trends in variety choice resulting from an increased market supply.
1.4 Dissertation structure
This dissertation is organised in five chapters. In addition to the introduction dealt with in this
chapter, the next chapter reviews the theoretical framework of study. Chapter 3 explains the design
of the research and the analytical methodology. The results are presented and discussed in chapter
4. This chapter is divided in an descriptive part and an analytical part. The descriptive part deals
with the description of the farmers who participated and the study area, and gives an overview of
the seed market structure. The analytical part includes the effect of the liberalization on variety
replacement, market penetration, and adoption rates, and analyzes the trends in variety choice such
as hybrids, maturity, and seasonality. Chapter 5 summarizes the major findings and concludes.
3
2 LITERATURE REVIEW
2 Literature review
2.1 The plant of study: maize
2.1.1 Introduction
Maize (Zea mays L.) belongs to the family Gramineae, subfamily Panicoideae, and tribe Maydeae.
The tribe Maydeae includes seven distinct genera: Zea and Tripsacum (native to the Western
Hemispere), as well as Coix, Chionachne, Sclerachne, Polytoca, and Trilobachne (native to Asia).
The genus Zea includes four forms of teosinte: annual teosinte (Zea luxurians), perennial tetraploid
teosinte (Zea perennis), perennial diploid teosinte (Zea diploperennis), and a polytypic annual
teosinte (Zea mays) (Hallauer, 1987; Fukunaga et al., 2005).
Maize is grown at latitudes ranging from the equator to approximately 50◦ North and South, and
at altitudes ranging from sea level to over 3,000 meters elevation. This reflects its ability to adapt
to a wide range of production environments, under temperatures ranging from extremely cold to
very hot, under moisture regimes ranging from extremely wet to semi-arid. It is grown on terrain
ranging from completely flat to precipitously steep, in many different types of soil (Morris, 1998b).
The wide range of conditions has led to a continuous interaction of genotype with the environment
and the formation of new maize types in farmers’ fields both through natural crossing and farmer
selections. The performance of a maize variety is therefore highly specific to each condition (Smale
et al., 2011). Most of the improved maize varieties developed for use in the US, Western Europe,
and northern China are only of interest for regions with a similar climate.
Colour and hardness are the two main traits on which grain types are commonly characterized. The
colour is determined by the presence (or absence) of certain pigments in the pericarp. In Africa, the
first varieties introduced before the colonial times, were coloured flint varieties but nowadays white
maize is predominantly produced and consumed except for the South African and North African
market. This shift has been that strong that yellow grains are often associated with food aid and
with animal feed. Furthermore, it made it difficult to introduce yellow maize again with provitamin
A carotenoids (De Groote et al., 2011). For example in Zimbabwe, a “low-yielding but hardy” flint
maize of variable colour was cultivated in the 1980s. Although the first settler farmers bred with
local maize seed, they soon sought improved cultivars from overseas. White cultivars were preferred
because of a yield advantage over the yellow cultivars during tests in Zimbabwe. Furthermore,
yellow maize would face an uncertain local demand, and was less resistant to maize blight (Byerlee
and Eicher, 1997). Marketing boards in many countries rejects coloured maize (Smale and Jayne,
2003).
4

2.1 The plant of study: maize 2 LITERATURE REVIEW
Maize kernels differ not only in colour but also in texture. The five texture classes are (a) sweet
containing sugar rather than starch and the kernel is considerably wrinkled and translucent after
drying, (b) pop, with small smooth round hard seeds, (c) floury, with soft floury endosperm, (d)
dent, with central core of soft starch, and (e) flint, with hard endosperm with occasional floury
softer tissue near the centre of the kernel. The grain of dent varieties has a high proportion of soft
endosperm that contracts as they dry, giving the kernel a concave, opaque surface. The grain of
flint varieties, on the other hand, has a higher proportion of hard endosperm, giving the kernel a
rounded, slightly shiny surface.
In high-income countries, only 3 percent is consumed directly by humans. An estimated 70 percent
of maize is used for animal feed, and the remainder is destined for biofuels, industrial products and
seed. In Sub-Saharan Africa except for South Africa, 77 percent of maize is used as food. Two
types are associated with the use in different food products. Dent, soft maize is floury and used for
porridges, while the flint, hard maize is primarily used for gruel or couscous (Smale et al., 2011).
Maize varieties can also be divided according to maturity, expressed in days from planting to ma-
turity. Early maturing varieties mature in 5 months, medium maturing varieties take 5 to 6 months
until maturity, and late maturing varieties mature after 6 months. Early maturing maize varieties
have several advantages in dry areas. They can be used to escape drought, permit double cropping,
and spread the harvest period with a mix of early and late maturing varieties. Late maturing vari-
eties on the other hand, tend to be taller and more susceptible to lodging (Poehlman and Sleper,
2006).
Maize is a monoecious plant, with the male (tassel) at the top of the stem and the female (ear)
located about midway down. This spatial arrangement allows the plant to self-pollinate (the pollen
fertilize the female flower of the same plant) or cross-pollinate (the pollen of a different plant fertilize
the female flower). When maize plants self-pollinate, the progeny are weaker because of inbreeding.
But when maize cross-pollinate, some of the progeny perform better than the parents. This so-called
hybrid vigour is attributable to the complementary action of favourable genes. This phenomenon
is linked to heterosis and is frequently exploited by plant breeders to develop commercial hybrids.
Unfortunately for farmers (but fortunately for commercial seed companies), the benefits of hybrid
vigor do not persever across generations. In a farmers’ field, where genetically identical heterozygous
hybrids (known as F1 hybrids) are growing, the cross-fertilization is actually a self-fertilization across
the field. According to Mendel’s law of segregation, only half of the genes initially heterozygote
remain so. The performance of the resulting progeny (known as F2 hybrids) decreases because of
inbreeding and the yield loss in the F2 generation may be as great as 35-40% (Morris, 1998b). This
characteristic of hybrids makes farmers very reliant on a commercial seed industry.
5

2 LITERATURE REVIEW 2.1 The plant of study: maize
Populations of open pollinated varieties (OPVs) are the second option of improved varieties for
maize farmers. Although F1 hybrids do yield more than OPVs, the development of OPVs can be
justified for three reasons. First, the development of OPVs is relatively easy. Second, seed of OPVs
is simple and inexpensive to produce and therefore cheaper for the farmer. Third, farmers can
replant saved seed and are thus less dependent on the seed industry (Morris, 1998b; Pixley, 2004).
This allows farmers to select seed with personal selection criteria and breed more effectively for their
own farm systems. Even after more than eight decades since the commercial introduction of hybrid
maize in the United States, there is still some doubt whether OPVs should be abandoned because
they are inferior to hybrids. However, the critical question is not whether hybrids are superior to
OPVs, but whether a product is superior to what the farmers grow and which new product they
can afford (Berlan, 2002; Kutka, 2011).
Seed companies cannot be blamed to sell seed of low quality. On the contrary, the hybrid cultivars
are distinguishable, uniform and stable (DUS, which is in fact what we expect from a variety). For
a farmer in the US or Western Europe, who is not interested in saving seed and who can afford to
buy hybrid seed every year, the uniformity is an advantage. However, for a farmer in a developing
country, who wants to recycle maize seed, this uniformity is not a priority. So the uncritical transfer
of the hybrid-based farming system from industrialized countries to developing countries is not
indicated. While keeping in mind that it is the handling on the farm which make the seed unusable
for a second growing season, a farmer in a developing country can mix different hybrid varieties in
one field.
2.1.2 Challenges of maize production in Africa
Most of the major success stories in international agricultural research have occurred in produc-
tion environments characterized by favourable and high-input agronomic conditions. However, the
expected spill-over effects to the low-input, marginal environments have been limited. Marginal
land, mostly owned by smallholders, indicates complex stresses and high production risks resulting
in growing conditions that vary over time and space (Brouwer et al., 1993). To deal with these
variations, farmers have created a specific growing environment with within-plant (genetic) diver-
sity and within-field (intercropping) diversity to stabilize the yield to minimize crop failure risks
(Almekinders and Elings, 2001).
Unlike in temperate zones, where growing seasons and life cycles mainly respond to fluctuations in
temperature, in Africa the rhythm is determined by the availability of moisture, especially rainfall
(McCann, 2005). In hot, dry weather maize pollen shedding is terminated earlier and shoot de-
velopment is delayed. This frequently results in failure of late-emerging shoots to be pollinated.
6
2.1 The plant of study: maize 2 LITERATURE REVIEW
Fertilization of the ovule usually occurs within 12 to 28 hours after the silks have been pollinated.
Severe drought may delay emergence of the shoots, which combined with the early termination of
pollen shedding, may result in failure of pollination and barren or partially barren ears. Resistance
to heath or drought can be obtained by developing varieties that will escape drought, and tolerate
to a greater extent the unfavourable conditions (Poehlman and Sleper, 2006).
Traditionally, African farmers have maintained soil fertility through fallowing land. Because of
the higher population pressure, the method of fallowing land was no longer sustainable. The
commercialization in many systems have lead to intensification and a reduction or elimination of
the fallow period, which resulted in a declining soil fertility and soil degradation. This resulted in
heterogeneous soil conditions (within and between fields) which combined with unpredictable and
erratic climatic conditions (Almekinders and Elings, 2001) gives a difficult production environment.
The choice of a suitable maize variety is often determined by the soil fertility level. In general, less
fertile soils have a low water-holding capacity because of their low organic matter content. On these
soils, early maturing varieties have a better chance of setting seed before exhausting the moisture
and available nutrients (Poehlman and Sleper, 2006).
Alternatively, soil fertility can be increased by the use of chemical fertilizers, but the amount applied
to maize is generally still quite low in Africa due to economic constraints (Byerlee and Heisey, 1996).
The transport costs, long distances, poor infrastructure and limited purchases result in much higher
fertilizer costs. Since most African countries must import chemical fertilizers, the price of external
sources of nutrients is higher than in other parts of the developing world. With an increase of
fertilizer costs, a better solution is to search for genotypes that will utilize available nutrients more
efficiently. Instead of correcting soil deficiencies, improved varieties which are also relatively less
expensive than fertilizers, can perform economically on soils with low fertility (Poehlman and Sleper,
2006).
The use of genetic variation is another way of dealing with variations in growing conditions and
reducing the risks of crop failure (Louette et al., 1997). Typically in variable environments, farmers
use a relatively large number of crops and crop varieties. The mixture of different crop varieties
stabilizes yield through the reduction of pest and disease damage. In marginal areas farmers may
use improved varieties, but they mainly plant local varieties. In general, these local varieties remain
in the production chain as the primary source of germplasm. The local system should be considered
as a dynamic in situ conservation of a portfolio of crops and varieties (Almekinders and Elings,
2001).
7
2 LITERATURE REVIEW 2.1 The plant of study: maize
Similarly, within-field genetic diversity in the form of intercropping contributes to a yield stability,
mainly through a reduced spreading of pathogens and insects that result from between-plant dif-
ferences and competition. A considerable proportion of the maize in sub-Saharan Africa is grown
in complex crop combinations, which are beneficial in terms of nutrient use and it gives farmers
the possibility to harvest two crops from a field in one season. Although the yields of the two
crops are lower in the intercropping system than monocropping of either crop, farmers continue
to intercrop because of the various advantages like minimizing crop failure risks, utilizing available
land optimally and reducing soil erosion (Byerlee and Heisey, 1996; Onduru and Du Preez, 2007).
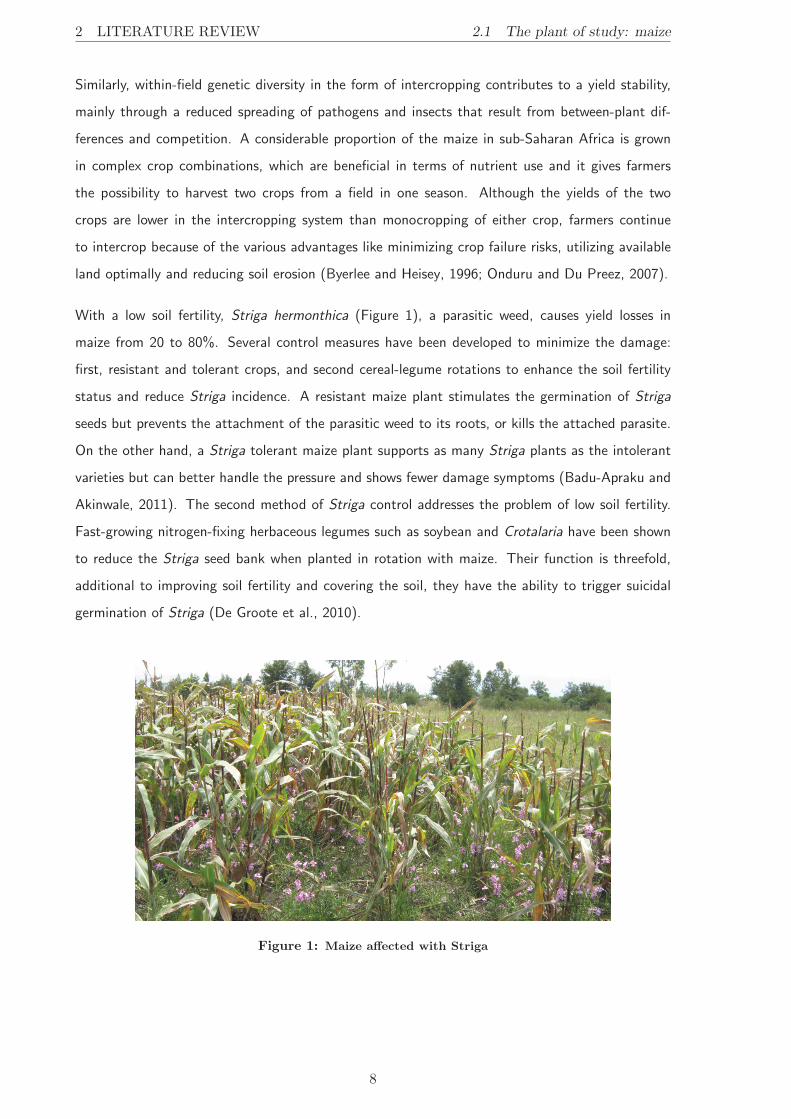
With a low soil fertility, Striga hermonthica (Figure 1), a parasitic weed, causes yield losses in
maize from 20 to 80%. Several control measures have been developed to minimize the damage:
first, resistant and tolerant crops, and second cereal-legume rotations to enhance the soil fertility
status and reduce Striga incidence. A resistant maize plant stimulates the germination of Striga
seeds but prevents the attachment of the parasitic weed to its roots, or kills the attached parasite.
On the other hand, a Striga tolerant maize plant supports as many Striga plants as the intolerant
varieties but can better handle the pressure and shows fewer damage symptoms (Badu-Apraku and
Akinwale, 2011). The second method of Striga control addresses the problem of low soil fertility.
Fast-growing nitrogen-fixing herbaceous legumes such as soybean and Crotalaria have been shown
to reduce the Striga seed bank when planted in rotation with maize. Their function is threefold,
additional to improving soil fertility and covering the soil, they have the ability to trigger suicidal
germination of Striga (De Groote et al., 2010).
Figure 1: Maize affected with Striga
8
2.1 The plant of study: maize 2 LITERATURE REVIEW
A next problem in maize production is lodging. The development of the root system influences
the water and nutrient uptake by the plant, and furthermore the susceptibility to lodging. The
term lodging means that the plant is leaning over or the stalk is breaking below the ear. Losses
in yield, both quantity and quality, due to lodging may result from the development of a light and
immature ear, or damaged from kernel rots when the ear touches the ground. Root lodging may be
caused by (a) an inherently weak root system, (b) rotted roots, and (c) roots damaged by insects.
Stalk breakage is influenced by (a) height of the plant and ear placement on the stalk, (b) inherent
strength of the stalk, (c) resistance to disease, (d) resistance to insect injury, and (e) resistance
to frost injury. Although the problem of lodging is inherent to soil fertility problems, especially
nitrogen, it is also included in African breeding programs. American breeding programs of the
late 1950s and 1960s embrased higher fertility levels and plant populations as breeding objectives,
but lodging became again a problem because plants responded to higher fertilizer application by
developing weak stalks (Kloppenburg, 1990; Poehlman and Sleper, 2006).
Finally, maize plants can suffer from weather damage such as hail. To protect the ear of maize, it
is enveloped by a husk. The husk covering moreover reduces the injury caused by insects, birds,
and diseases. Tropical adapted maize varieties have a long husk extending beyond the tip of the
ear and remaining tightly closed after maturity. In contrast, varieties adapted to industrial regions
have a loose-fitting husk just long enough to cover the end of the ear. In these areas, longer husks
serve no useful purpose, and have a rather negative effect on harvest techniques and retard maturity
(Poehlman and Sleper, 2006).
2.1.3 Green revolution
During the history of cereal varietal changes, maize followed a very different path from that followed
by rice and wheat. The so-called green revolutions describe the introduction of improved semidwarf
varieties of rice and wheat into some of the developing world’s most populated countries. Because
rice and wheat are self-pollinated crops, each generation remains identical to its preceding gener-
ation, which means farmers can replant their harvested seed. During the green revolutions in rice
and wheat, farmers could spread improved varieties through farmer-to-farmer seed exchanges, with
relatively little involvement by any sort of formal seed industry. These improved varieties performed
significantly better than the local varieties when the fertilizer and water supply increased. This led
to substantial production increases and higher incomes for millions of farmers who adopted the high
input package (Morris, 1998b).
9
2 LITERATURE REVIEW 2.1 The plant of study: maize
In the case of maize, a maize based green revolution is defined but an impact equivalent to the green
revolution in rice and wheat has not yet taken place in many developing countries (De Groote et al.,
2005a; Eicher, 1995; Smale, 1995; Howard and Mungoma, 1996), eventhough the green revolution
was launched in 1960 in Zimbabwe, five years before it got underway in India. The dualistic agricul-
ture, where large-scale farmers and smallholders live side by side, created a specific environment at
the start of the maize based green revolution in Zimbabwe. The first maize revolution (1960-1980)
was mainly focussed on large-scale farmers who owned the most land and who controlled the farmer
organizations. These commercial farmers adopted very quickly high yielding hybrids. Two political
events of the 1950s and 1960s contributed to the rapid adoption of hybrid maize in Zimbabwe and
neighbouring Zambia. The first was Great Britain’s decision in 1953 to establish a regional research
network and an exchange of hybrid maize varieties in three countries including Northern Rhodesia
(now Zambia), Southern Rhodesia (now Zimbabwe), and Nyasaland (now Malawi). The second po-
litical influence on the adoption of hybrid maize was Rhodesia’s illegal assumption of independence
from Great Britain in 1965. As a result of the international sanctions against Rhodesia’s exports,
commodity prices fell. Farmers replaced tobacco, the leading agricultural export, by maize, cotton,
wheat, soybeans, and coffee (Byerlee and Eicher, 1997).
After independence in 1980, smallholders in Zimbabwe, located in the driest parts of the country,
could profit from the green revolution mainly due to the technological and institutional spillovers
from large-scale maize farmers. The independence agreement defined that commercial farm land
would be sold on a “willing buyer – willing seller”basis in the next decade. With this agreement, the
new government declared its political support for a second green revolution. However, the impact of
this second maize based green revolution in Zimbabwe (1980-1986) was not equal for every farmer.
Smallholders in higher-rainfall areas could benefit more (Eicher, 1995).
The green revolution also had a negative side. The economic pressures forced farmers to adopt
expensive Western technologies while simultaneously the prices of agricultural commodities went
down. These converging trends facilitated consolidation of land ownership by forcing small-scale
farmers to sell land to larger farmers who could survive through economies of scale. While the
green revolution may have a positive impact on overall agricultural output, it decreased levels of
food security among rural smallholders (Evenson and Gollin, 2003; Zerbe, 2001).
10
2.1 The plant of study: maize 2 LITERATURE REVIEW
2.1.4 Evolution of the maize seed sector
The history of maize breeding can roughly be divided into three major periods for the more com-
monly used methods (Hallauer, 1987). The first period from 7000 to 10,000 years ago includes the
conversion from a weedy species to a cultivated species by local farmers. The second period, up to
1920 is characterized by mass selection among and within the cultivated species to produce distinc-
tive races and cultivars for specific environments and cultural need. The third period, from 1909
when Shull discovered the inbred-hybrid concept, to the present is dominated by the development
hybrids.
When hybridization has uncoupled seed as “seed” from seed as “grain”, it became evident that
there was a market and private companies were formed to produce the hybrids developed by public
breeding programs. This has been fundamental to the rapid growth of the American seed industry
since 1935 (Kloppenburg, 1990). Along a continuous growth curve of the seed sector, four stages
can be described, (a) the preindustrial stage, (b) the emergence stage, (c) the expansion stage,
and (d) the maturity stage (Morris, 1998a). During the preindustrial stage, both seed production
and seed development occured at the farm level. Farmers selected superior ears from their own
harvest to use as seed in the following planting season. The materials grown were OPVs with
high variability within and between fields. While realizing that specialized knowledge and skills
are needed to carry out germplasm improvement work, the seed industry evolve to the emergence
stage with the formation of specialized research organizations. In first instance, the whole process
of plant breeding; conducting varietal evaluation trials; producing foundation seed; multiplying,
conditioning, and testing commercial seed; and distributing it to farmers was dominated by the
state. Once farmers appreciated the benefits of high-quality seed, specialized seed production firms
began to multiply and distribute seed which was released by the government research stations. This
is an indication of the next stage in the seed industry, the expansion stage. Private companies
started to assume an increasingly important role in carrying out plant breeding while the dominant
seed type changed to hybrids. The last stage of maturity was reached when private firms came
to dominant the seed sector. Public research institutes however, are still active in breeding crops,
especially orphan-crops that fail to attract the attention of private firms.
11
2 LITERATURE REVIEW 2.2 The country of study: Kenya
2.2 The country of study: Kenya
2.2.1 Maize in Kenya
Kenya, the country of focus in this study, is situated in East Africa. It covers an area of 58 thousand
square kilometres, of which 38% is agricultural land. It has a population of 40 million people (World
Bank, 2010), 50% of the population lives in rural areas. It borders Ethiopia and Somalia on the
North, Uganda on the West and Tanzania on the South. On the East, it borders the Indian Ocean.
Maize is the key food crop in Kenya, accounting for 2.4% of Kenya’s gross domestic product (GDP)
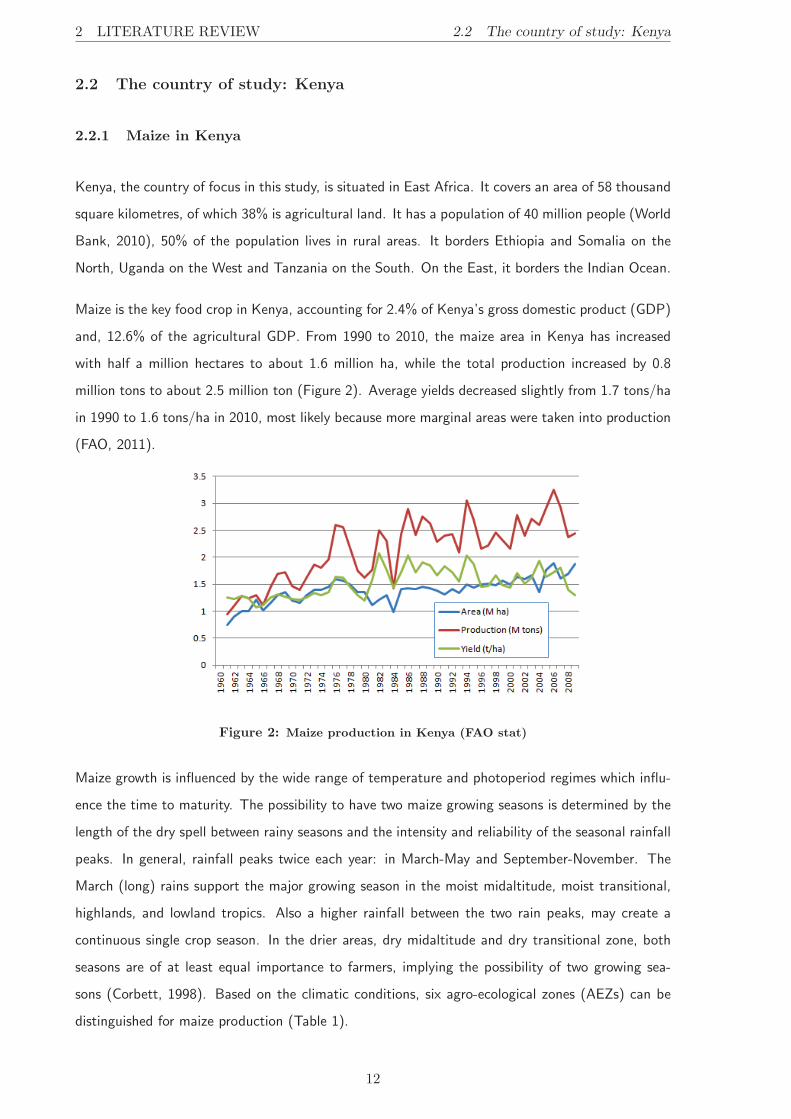
and, 12.6% of the agricultural GDP. From 1990 to 2010, the maize area in Kenya has increased
with half a million hectares to about 1.6 million ha, while the total production increased by 0.8
million tons to about 2.5 million ton (Figure 2). Average yields decreased slightly from 1.7 tons/ha
in 1990 to 1.6 tons/ha in 2010, most likely because more marginal areas were taken into production
(FAO, 2011).
Figure 2: Maize production in Kenya (FAO stat)
Maize growth is influenced by the wide range of temperature and photoperiod regimes which influ-
ence the time to maturity. The possibility to have two maize growing seasons is determined by the
length of the dry spell between rainy seasons and the intensity and reliability of the seasonal rainfall
peaks. In general, rainfall peaks twice each year: in March-May and September-November. The
March (long) rains support the major growing season in the moist midaltitude, moist transitional,
highlands, and lowland tropics. Also a higher rainfall between the two rain peaks, may create a
continuous single crop season. In the drier areas, dry midaltitude and dry transitional zone, both
seasons are of at least equal importance to farmers, implying the possibility of two growing sea-
sons (Corbett, 1998). Based on the climatic conditions, six agro-ecological zones (AEZs) can be
distinguished for maize production (Table 1).
12

2.2 The country of study: Kenya 2 LITERATURE REVIEW
Table
1:Climaticconditionsoverth
eAEZs(C
orb
ett,1998)
Agro-ecolog
ical
Altitude
Averageseasonal
Average
Average
Average
Variabilityin
Recom
men
ded
Average
zone(A
EZ)
(m)
temperature
(◦C)
totalseason
altotalseason
altotalbetween
season
alplantingdate
timeto
precipitation
precipitation
season
sprecipitation
maturity
March-A
ug
Sep
t-Feb
precipitation
June-Aug
max
min
(mm)
(mm)
(mm)
(%CV)
(days)
Low
trop
ics
<800
29.4
2030
0-10
0034
921
936
April(1)-May
(1)
120
Dry
midaltitudes
700-13
0027
.916
.1<
600
414
1352
March
(2)-April(1)
114
Dry
transitional
1100
-170
025
.34
<60
046
045
40March
(2)-April(3)
144
Moist
tran
sition
al11
00-200
023
.313
.4>
500
545
338
27March
(4)-April(4)
181
Hightropics
>160
023
0>
400
384
326
32March
(4)-April(1)
213
Moist
midaltitudes
1100
-150
028
.35.9
>50
058
529
332
April(1)-May
(1)
163
13
2 LITERATURE REVIEW 2.2 The country of study: Kenya
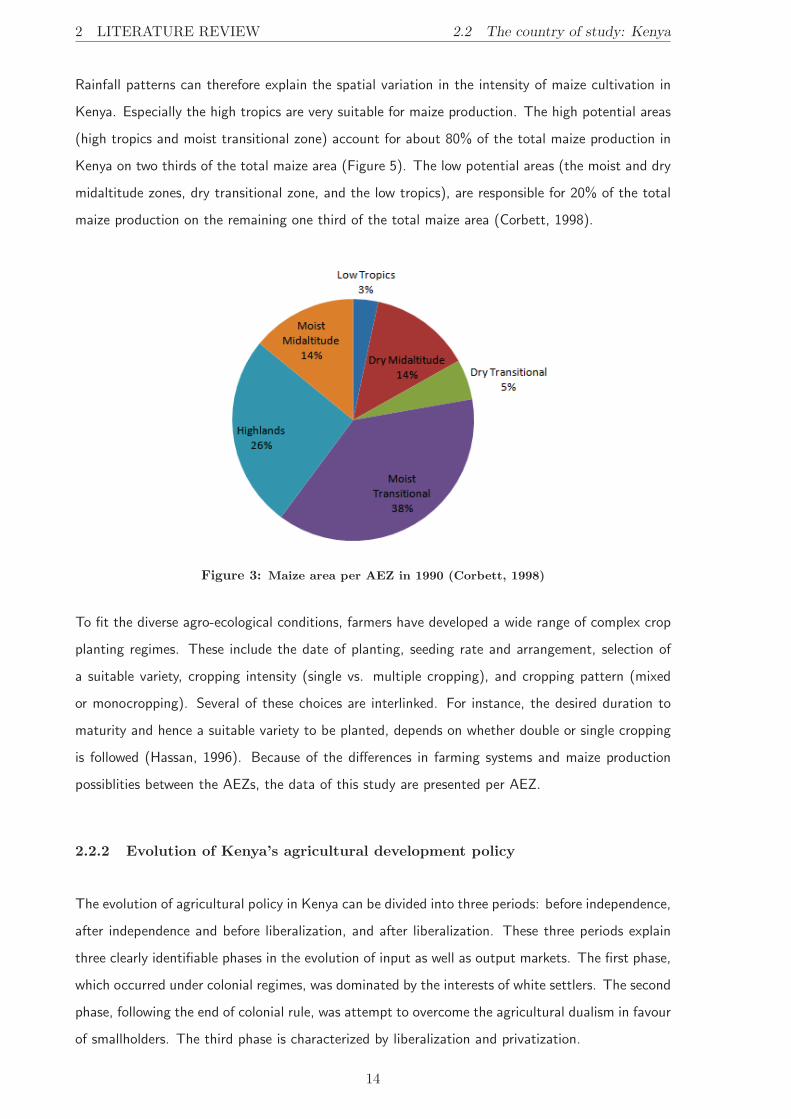
Rainfall patterns can therefore explain the spatial variation in the intensity of maize cultivation in
Kenya. Especially the high tropics are very suitable for maize production. The high potential areas
(high tropics and moist transitional zone) account for about 80% of the total maize production in
Kenya on two thirds of the total maize area (Figure 5). The low potential areas (the moist and dry
midaltitude zones, dry transitional zone, and the low tropics), are responsible for 20% of the total
maize production on the remaining one third of the total maize area (Corbett, 1998).
Figure 3: Maize area per AEZ in 1990 (Corbett, 1998)
To fit the diverse agro-ecological conditions, farmers have developed a wide range of complex crop
planting regimes. These include the date of planting, seeding rate and arrangement, selection of
a suitable variety, cropping intensity (single vs. multiple cropping), and cropping pattern (mixed
or monocropping). Several of these choices are interlinked. For instance, the desired duration to
maturity and hence a suitable variety to be planted, depends on whether double or single cropping
is followed (Hassan, 1996). Because of the differences in farming systems and maize production
possiblities between the AEZs, the data of this study are presented per AEZ.
2.2.2 Evolution of Kenya’s agricultural development policy
The evolution of agricultural policy in Kenya can be divided into three periods: before independence,
after independence and before liberalization, and after liberalization. These three periods explain
three clearly identifiable phases in the evolution of input as well as output markets. The first phase,
which occurred under colonial regimes, was dominated by the interests of white settlers. The second
phase, following the end of colonial rule, was attempt to overcome the agricultural dualism in favour
of smallholders. The third phase is characterized by liberalization and privatization.
14
2.2 The country of study: Kenya 2 LITERATURE REVIEW
(a) Phase 1: Pre-independence
During the pre-independence period (before 1963), agricultural development was almost entirely
focused on white-settler farmers with little support for African farmers. On the contrary, European
practices such as African forced labour were acts of discrimination against local farmers who were
furthermore not allowed to grow cash-crops until the mid 1950s. The best land in terms of soil
fertility was set aside exclusively for European settlers, called the “White Highlands”. In these
regions coffee, tea and pyrethrum was ’scheduled’ for European production. The creation of the
“Native Reserves” exclusively for particular tribes stood in contrast to these high potential “White
Highlands”. Pressure on land in the “Native Reserves”with soil erosion as a result was one of the
main reasons of the Swynnerton Plan, produced in 1954. This economic policy document outlined a
new strategy to end the discriminatory agricultural policies against African farmers (Ongaro, 1988).
An important driving factor for the increase of maize production during the colonial period in Kenya
was the British starch market. Since the British starch market preferred white maize for its better
grading and uniformity, settler farmers switched to white maize though both white and yellow maize
varieties were grown. As a consequence, yellow maize was described as “a vital danger to the maize
growing industry”(Smale and Jayne, 2003). When yellow maize pollen fertilizes white maize, the
developing kernel is light yellow because the yellow endosperm colour is conditioned by a dominant
gene (Poehlman and Sleper, 2006). This phenomenon called xenia, led to an unsuitable product for
export. Currently, Kenyan maize consumers prefer white maize as opposed to yellow maize, while
yellow maize is seen as inferior and often associated with food aid and animal feed (De Groote
et al., 2008).
As the number of Europeans engaged in farming rose during the 1920s, settler farm organization
successfully lobbied in the colonial legislatures for protection from African competition. Dual mar-
keting channels were established for European and African farming areas, regulated by ’the Native
Foodstuffs Ordinance of 1922’, and followed by ’the Marketing of Native Produce Ordinance’ in
1935. These state regulations tightened control of grain movements but also created a monopo-
lized Maize Board to purchase maize from European areas. In contrast were the Provincial Boards,
purchasing Africans’maize produce generally at lower prices (Jayne and Argwings-Kodhek, 1997).
(b) Phase 2: Independence
The expansion of smallholder maize production was the central element after independence in
1963. Large farms from European settlers were transferred to African farmers. However, a dualistic
agriculture, defined by large-scale farmers against smallholders, was preserved.
15

2 LITERATURE REVIEW 2.2 The country of study: Kenya
Many of these large farms were taken over by local elites, who enjoyed good links with politicians
and policy-makers (De Groote et al., 2005a). Nevertheless, new institutions faced the need to find
finances to assist African farmers in the resettled farms.
Crop marketing boards also needed restructuring to serve the growing number of small-scale com-
mercial farms. The Maize Board and the Provincial Boards were merged to form a single marketing
Maize Board. Later in 1980, it combined with the Wheat Board to form the NCPB. The Board’s
mandate was to stabilize prices and to ensure food security while the policy of inter-regional maize
trade restriction was still followed. Although the NCPB had legal monopoly to trade in maize,
the unregulated and unofficial informal system handled 50-60% of all marketed maize in Kenya.
Because of the extensive network of rural markets, the informal system could operate parallel to
the formal system (Wangia et al., 2004).
The NCPB controlled prices by the concept of pan-territorial pricing. Prices were announced by the
Ministry of Agriculture at various levels of the marketing system from producers, traders, NCPB,
millers, wholesalers, to consumers. This pan-territorial pricing encouraged an increase in smallholder
maize production. The protection of maize producers and consumers had important successes in
boosting grain production and incomes in some rural areas. However, by the mid-1980s major
problems had emerged as a result of inefficient management and the suppression of normal market
function and private sector involvement (Jayne and Argwings-Kodhek, 1997; Wangia et al., 2004).
(c) Phase 3: Liberalization
The liberalization started in the early 1980s under the pressure of the World Bank and the donor
community in the framework set by the SAPs. The reforms were only firmly established in 1995,
after a long period of 15 years of uncertainty. The liberalization aimed at three major changes,
namely (1) the lifting of some controls in the maize market, (2) the restructuring of the NCPB,
and (3) market development (Lewa and Hubbard, 1995). The government readily agreed to re-
align export crop prices to world market prices, but reforms in the grain marketing system took
more efforts. The private sector is often associated with predatory practices and price uncertainty,
and privatization was believed to lead to food riots and political unrest. There was an on-and-off
removal of controls until 1993, seemingly for food security reasons. Until today, the NCPB is still
involved in marketing alongside the private sector, often in complete disregard of market forces
(Mwabu et al., 2006).
The structural adjustment programmes demanded the complete liberalization of seed multiplication
and distribution, restriction of public agricultural research variety development, and limitations to
the state’s regulatory capacity. In Kenya, the seed sector has expanded to include the private sector,
16

2.2 The country of study: Kenya 2 LITERATURE REVIEW
with national, regional and multinational companies. New national and regional companies could
benefit from the multiplication of publicly owned varieties, while multinationals could tap into new
markets with their own germplasm (Tripp, 2001). However, the Kenyan seed market is still heavily
dominated by the traditional KSC.
2.2.3 Maize research and seed production in Kenya
Until the 19th century, maize improvement was in the hands of farmers who selected the seed from
preferred plant types of landraces. Maize research in East Africa began in the early 1950s under
the colonial East African Agriculture and Forestry Research Organization. The KARI started their
maize breeding program in Kitale in 1955 for the highlands (Harrison, 1970), and later established
programs in Embu, Machakos, Kakamega and Mtwapa for the other AEZ.
The KSC was established by European settlers in 1956 for the production of pasture seed. From
1963 onwards, it was mandated by the Kenyan government to produce the seed of the new maize
varieties developed in the 1960s and 1970s. The Kenyan government obtained a majority share
through the Agricultural Development Corporation, but the company kept its commercial nature.
The first hybrid (H611) in Kenya was released in 1964, it had as parents Kitale Synthetic II and
Ecuador 573, and it performed 40 percent better than its parents (Harrison, 1970). Especially
large-scale farmers could benefit from the yield advantages of these cross-bred hybrids. The new
varieties, with seed produced by KSC and distributed through the Kenyan Farmer Association and
other outlets, led to a strong boost in maize yields and production in the 1960s. Unfortunately,
the “boost” was short-lived and from the mid-eighties onwards, maize productivity could no longer
keep up with the rapidly increasing population.
The International Maize and Wheat Improvement Centre (CIMMYT) is an international non-profit
research institute, established to assist in the development of national and regional maize improve-
ment programs in developing countries. The research institute started as a collaborative program
between the Rockefeller Foundation and the Mexican Ministry of Agriculture. After about 20 year,
CIMMYT was founded in Mexico City, D.F., Mexico in 1966. CIMMYT’s focus is on the tropical
maize producing countries and on countries where maize is utilized as a human food. The activities
of CIMMYT include the maintenance of a germplasm bank, coordination of international maize
testing trials, a research program to develop improved maize populations and germplasm which are
distributed to maize research workers in cooperating countries through the international maize tri-
als, and sponsorship of workshops and training programs for maize research workers in cooperating
countries (Poehlman and Sleper, 2006).
17

2 LITERATURE REVIEW 2.2 The country of study: Kenya
After the liberalization, new national, international and regional companies started business in
Kenya’s maize seed market. KSC is not part of the national group, and is discussed seperately
because of its history in Kenya. Prior to the liberalization, KSC had the exclusive rights to distribute
maize varieties developed by KARI in the 1960s and 1970s. KSC started their own breeding program
in 1989 in preparation of the liberalization. Even after the liberalization, KSC kept the exclusive
rights to some popular varieties through licenses. These varieties are the pillars of the company
and are familiar with farmers (http://kenyaseed.com/). The varieties of KSC can be divided in
4 categories. The first category consists of the early composites. These OPVs were distributed
by KSC but are no longer in production by the company in 2010. The second category are late
maturing maize varieties in the H600 series. Third are the medium maturing maize varieties in the
H500 series. The fourth category includes the dryland and coastal hybrids.
The first fully private seed company in Kenya was Western Seed Company (WSC), which started
its maize breeding program when the seed industry liberalized in 1992. WSC is based in Kitale, the
center of the high potential moist transitional zone, where its main competitor KSC is also based
(http://westernseedcompany.com/). Today, about 90% of the sales by value are local sales. Maize
varieties from WSC include both hybrids and OPVs. The Kenyan, private company Lagrotech
specialized in OPVs. Apart from breeding, this company also advizes farmers on improved practices
such as intercropping, fertilization, and recycling nutrients. The Kenyan, private company Faida
Seeds is a relatively small company established in Nakuru. ’Faida’ in Kiswahili means ’profit’ or ’to
benefit’. Through partnerships with Kenyan parastatals and national, educational institutions, Faida
Seeds tries to supply quality seeds. Freshco, also a Kenyan private company, entered the maize
seed market in 1997 as a distributor for Pioneer Hi-Bred International and later for Monsanto.
Meanwhile, Freshco started its own breeding program in collaboration with KARI and CIMMYT,
and as a result in 2002, Freshco became a local Kenyan seed producer with headquarters in Nairobi.
The international companies Monsanto and Pioneer could enter the market ahead of the national,
private companies with the varieties they had already developed. But technical problems made it very
difficult to release varieties in the first years of liberalization. For example, control of imported maize
seed in Mombasa took a long time leading to a delay of import and the missing of a season. Long
exposure to the heat in Mombasa also resulted in damaged seed with low germination percentages.
Monsanto has offices in 66 countries of which 7 in Africa (http://monsanto.com/). Pioneer has
operations in more than 90 countries of which 9 in Africa (http://pioneer.com/). Pioneer has been
in Africa for more than 50 years, and opened a new research center in Eldoret, Kenya in 2009.
Regional companies, including Pannar and SeedCo, differ from the international companies by their
African origin. They have become part of the Kenyan maize seed sector each with their own African
18

2.2 The country of study: Kenya 2 LITERATURE REVIEW
background. Pannar started as a family company in South Africa, and has expanded to 10 other
African countries and four countries outside Africa (http://www.pannarseed.co.za/). Pannar was
one of the first maize seed companies in Kenya after the liberalization. SeedCo, established in
Zimbabwe, operates in 13 African countries (http://www.seedcogroup.com/). In 2002, Seedco
entered the Kenyan market and in 2010, SeedCo has become one of the most popular companies
in Kenya for his early maturing maize varieties.
2.2.4 Plant variety protection
Seed regulation is meant to protect consumers and to promote a responsible and productive seed
industry (Tripp et al., 2007). The major concern is the design and implementation of varietal
registration that ensures the genetic identity of a variety. Before the liberalization, seed testing,
inspection, and certification was done by KARI’s National Seed Quality and Control Board. Because
this role involved a potential conflict of interest, seed control is now undertaken by the independent
Kenyan Plant Health Inspectorate Services (KEPHIS) (Nyangito and Karugia, 2002). The official
National Performance Trial (NPT) in several locations in the country and in parallel the Distinctness,
Uniformity and Stability (DUS) test are time-consuming activities of two to three years. This
registration process represents a serious obstacle to the introduction of new varieties and lengthens
the time it takes for a newly developed variety to reach farmers. Langyintuo et al. (2010) estimated
that in Kenya even after the release of the variety, it takes 2.4 years before farmers have access to
the new variety.
Intellectual property rights (IPRs) are implemented to stimulate investments in research, develop the
domestic seed sector, and allow countries to take advantage of foreign technology. The agreement
on Trade-Related Aspects of Intellectual Property Rights (TRIPS), introduced in 1994 following
the completion of the Uruguay Round of the General Agreement on Tariffs and Trade (GATT),
stipulates that member nations shall provide a minimum level of intellectual property protection in
their national laws. This protection can be implemented through either joining the International
Union for the Protection of New Varieties of Plants (UPOV), or allowing plant variety patents. The
first strategy, implemented in Kenya since 1999, allows the use of protected material for research,
but prohibits the unauthorized marketing of “essentially derived varieties”. These essentially derived
varieties are distinct from, but based almost entirely upon protected varieties. Furthermore, this
strategy recognizes “farmers’privilege” or the right of farmers to save seed of a protected variety.
The second strategy under the form of patents, is more strict and normally used to protect products
and processes that do not occur naturally (Morris, 1998b; Tripp and Louwaars, 1997).
19
3 METHODOLOGY
3 Methodology
3.1 Conceptual framework
Market liberalization is meant to increase the participation of the private sector in the targeted
markets. The reduction of government monopolies and the increase of choices offered to farmers at
a lower cost and with better information, is expected to make markets more effective and efficient,
leading to an increase in agricultural production and an increase of food security and income of rural
households. To analyze the success of market liberalization policies in increasing farm production
and household income, the extent of the liberalization needs to be determined first.
Market development and its dynamics are reflected by the firms’ output in new varieties released.
Market penetration and efficiency is reflected by farmers’ responses, as measured by the number
of these varieties actually planted by farmers and the average time they use a variety. Average
age of maize IMVs weighted by the proportion of area sown to each variety, can be used as an
estimate of speed of variety replacement (Heisey and Brennan, 1991). This weighted average age
is negatively related to variety replacement. Diffusion rates of IMVs can be expressed in terms of
the percentage area planted to IMVs or in terms of the percentage of farmers using IMVs (Morris
and Heisey, 2003). Adoption levels are often correlated with farmer characteristics such as age,
gender, and level of education (Hassan et al., 1998). The use of IMVs as a maize production
strategy can be correlated with other maize production strategies such as intercropping, fertilizing,
and recycling, but the adoption of these are not analyzed in this dissertation. Yet, maize production
systems differ between adopters and non-adopters. Specific trends in planting strategies explain
how farmers combine the choice of an IMV with other maize production strategies.
Once a farmer chooses to plant an IMV, he has to choose between improved IMVs and hybrids.
While IMVs include both improved OPVs and hybrids, farmers seem to adopt hybrids more rapidly
(Corbett, 1998) and private companies tend to concentrate on hybrids as this could maximize profits
(Pixley, 2004). The change in the seed sector with an increased importance of private companies,
brings an expected change in area share of hybrids versus OPVs.
Maturity of maize varieties determines the length of the maize growing season. KSC focused and
still focuses on late maturing varieties, new companies entered the market mainly with medium and
early maturing varieties. Early maturing varieties have the advantage to escape drought and make
it possible to have two growing seasons. However, early maturing maize varieties yield less than
late maturing maize varieties. Using the short rains for a second maize growing season is then a
way to increase yield per year.
20
3.2 The data 3 METHODOLOGY
3.2 The data
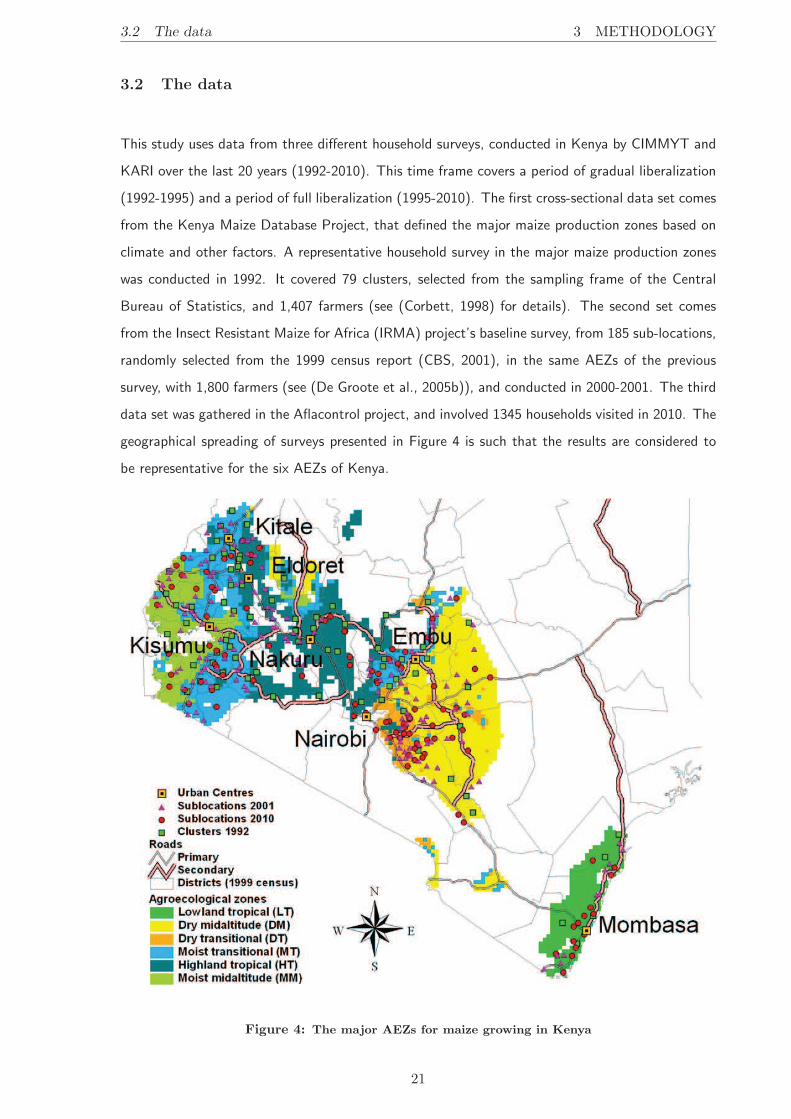
This study uses data from three different household surveys, conducted in Kenya by CIMMYT and
KARI over the last 20 years (1992-2010). This time frame covers a period of gradual liberalization
(1992-1995) and a period of full liberalization (1995-2010). The first cross-sectional data set comes
from the Kenya Maize Database Project, that defined the major maize production zones based on
climate and other factors. A representative household survey in the major maize production zones
was conducted in 1992. It covered 79 clusters, selected from the sampling frame of the Central
Bureau of Statistics, and 1,407 farmers (see (Corbett, 1998) for details). The second set comes
from the Insect Resistant Maize for Africa (IRMA) project’s baseline survey, from 185 sub-locations,
randomly selected from the 1999 census report (CBS, 2001), in the same AEZs of the previous
survey, with 1,800 farmers (see (De Groote et al., 2005b)), and conducted in 2000-2001. The third
data set was gathered in the Aflacontrol project, and involved 1345 households visited in 2010. The
geographical spreading of surveys presented in Figure 4 is such that the results are considered to
be representative for the six AEZs of Kenya.
Figure 4: The major AEZs for maize growing in Kenya
21
3 METHODOLOGY 3.3 Empirical framework
3.3 Empirical framework
First, some general characteristics of farmers in the surveys, and an overview of the climatic varia-
tions between 1992 and 2010 are presented. For analyzing the climatic conditions at the times of
the surveys, precipitation data and temperature were extracted from the database of the World Me-
teorological Organization (http://www.wmo.int/). Total monthly precipitation data and monthly
minimum and maximum temperature data were obtained from 6 meteorological stations in Kenya.
A simplified map is made for the years 1992 and 2010 based on geographically interpolation using
the program Idrisi.
Next, changes in the following indicators of market liberalization are analyzed:
(1) number of new companies active in the market: these new companies include private regional,
national and multinational companies;
(2) number of varieties released : obtained from the national variety registry, with date and source
(http://www.kephis.org/);
(3) number of varieties adopted and used by farmers: this should capture the total number of vari-
eties officially produced and available on the seed market, without distinguishing between different
local varieties and recycled seed of old varieties;
(4) importance of public breeding : the area share of public bred varieties is calculated against the
area share of private bred varieties and local varieties.
The following indicators are used to test the impact of market liberalization in Kenya’s maize seed
markets:
(5) speed of variety replacement: which is measured as the average weighted age of the varieties
planted by the farmers, calculated by taking the difference of the survey year with the year of release
as reference for IMVs. For each farmer, this “age” of each of the varieties planted is weighted by
the size of the plot planted. An average is made of these weighted ages for all farmers surveyed in
each AEZ;
(6) area planted by farmers with different varieties: as an indication of the level of adoption by
farmers, where a distinction is made between IMVs versus local varieties, as well as between varieties
provided by the traditional seed company KSC and the new (regional, national, and international)
private companies;
(7) adoption of improved maize varieties: is compared over the six AEZs of Kenya, where the
adoption rate is measured by the number of farmers using at least one improved variety and non-
adopters are farmers planting only local varieties. Farmers who combined local maize varieties with
IMVs are categorized as adopters(Doss, 2006).
22
3.4 Adoption model specification 3 METHODOLOGY
Further trends reflecting farmers’ preferences in variety choice which also have an impact on the
future plant breeding and seed sector are described with the following indicators:
(8) importance of hybrids: area planted with improved OPVs against hybrids;
(9) shift in maturity : early maturing varieties mature in less than 5 months, medium maturing
varieties take 5 to 6 months until maturity, and late maturing varieties mature after 6 months. The
area planted with IMVs is measured by each maturity group;
(10) first season versus second season: knowing that some regions in Kenya are better suitable for
a second season, the area used for maize production in the second season is calculated relative to
the area planted in the first season per AEZ;
(11) importance of the second maize growing season: is measured as the percentage farmers using
the second season for maize production.
3.4 Adoption model specification
The dependent variable adoption is dichotomous (1=adopter, 0=non-adopter), so a logistic model
is recommended (Gujarati, 2003). This approach is appropriate because most farmers grow either
local varieties or IMVs exclusively, only 7.6% of the farmers combined local maize varieties with
IMVs in 2010. Factors affecting the IMV adoption can be expressed dichotomous or continuous.
These factors are AEZ, socio-economic characteristics (such as gender, age, literacy rate, and formal
education), farm characteristics (such as maize area, farming experience and level of marketing),
and cultural practices (such as intercropping, fertilizing, and recycling).
The empirical model for IMV adoption is specified as follows:
ADOPT = B0 +B1X1 +B2X2 +B3X3 + ...+B15X15 + U
Where:
ADOPT = adoption of IMVs
X1 = AEZ1 (1=Low tropics, 0=Moist midaltitude)
X2 = AEZ2 (1=Dry midaltitude, 0=Moist midaltitude)
X3 = AEZ3 (1=Dry transitional, 0=Moist midaltitude)
X4 = AEZ4 (1=Moist transitional, 0=Moist midaltitude)
X5 = AEZ5 (1=High tropics, 0=Moist midaltitude)
23
3 METHODOLOGY 3.5 Structure of the results section
X6 = gender of household head (1=female, 0=male)
X7 = age of household head (years)
X8 = literacy rate (1=yes, 0=no)
X9 = formal education (years)
X10 = maize area (ha)
X11 = farming experience (years)
X12 = percentage maize sold
X13 = intercropping (1=yes, 0=no)
X14 = fertilizing (1=yes, 0=no)
X15 = recycling (1=yes, 0=no)
To estimate the model, a logistic regression was run in SPSS with as independent variable the
dummy of adoption (1=yes, 0=no) and the independent variables as mentioned above.
3.5 Structure of the results section
The study is organized in four parts. The first part describes the farmers who participated in the
surveys and the variation of precipitation and temperature between 1992 and 2010. The second
part describes the changes in market structure after the liberalization. This is measured by number
of companies active in the market and the varieties released compared to what is found in the three
surveys. The market structure is discribed with a distinction between private and public varieties.
The third part measures the extent of liberalization. Market penetration and efficiency is reflected
by farmers’ responses, as measured by the speed of variety replacement. Market penetration is
analyzed by the area share of the seed companies, and the varieties popular per AEZ. Following to
this area share is the percentage farmers using IMVs as an indication of adoption rates. Adopters
are characterized by socio-economic, and farm characteristics and cultural practices whereby an
adoption model is defined. In the fourth part, trends in variety choice are described. This include
the importance of hybrids, the shift in maturity, and use of the second maize growing season.
24

4 RESULTS AND DISCUSSION
4 Results and discussion
4.1 Description of the study area
4.1.1 General descriptives of farmers in the study
The most recent survey in 2010 included more small-scale maize farmers in comparison with the
surveys conducted in 1992 and 2001 (Figure 5). The percentage small maize farms with less than
1 hectare increased from 64% in 1992 to 71% in 2001 and 78% in 2010.
Figure 5: Maize area per household (ha)
The average maize area per household decreased from 3.67 ha in 1992 to 1.38 ha in 2001, and 0.78
ha in 2010 (Table 2). This decrease was measured in every AEZ except for the low tropics. In the
dry midaltitude zone, the average maize area was 1 ha 2010, 0.5 ha lower than in 1992 and 0.6
ha lower than in 2001. In the dry transitional zone, a significant difference in average maize area
was only measured between 2001 and 2010. The maize area almost halved with 1.5 ha in 2001 and
0.8 ha in 2010. The decrease in average area planted with maize was particularly high in the high
potential zones. An average household in the moist transitional zone planted 6.5 ha with maize in
1992, this was only 1.5 ha in 2001 and 0.7 ha in 2010. In the high tropics, the average maize area
of 3.24 ha in 1992 decreased to 1.4 ha in 2001 and 0.8 ha in 2010. In de moist midaltitude zone,
the average maize area decreased significantly from 0.76 ha in 1992 to 0.56 ha in 2001.
25
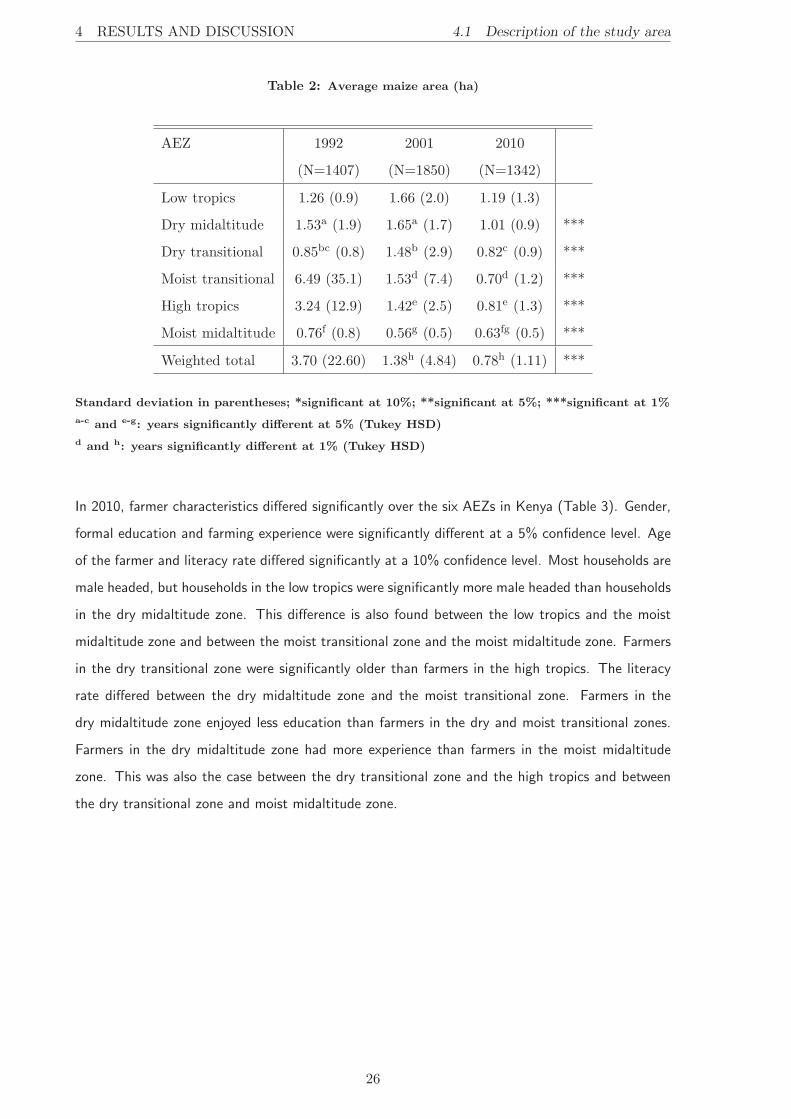
4 RESULTS AND DISCUSSION 4.1 Description of the study area
Table 2: Average maize area (ha)
AEZ 1992 2001 2010
(N=1407) (N=1850) (N=1342)
Low tropics 1.26 (0.9) 1.66 (2.0) 1.19 (1.3)
Dry midaltitude 1.53a (1.9) 1.65a (1.7) 1.01 (0.9) ***
Dry transitional 0.85bc (0.8) 1.48b (2.9) 0.82c (0.9) ***
Moist transitional 6.49 (35.1) 1.53d (7.4) 0.70d (1.2) ***
High tropics 3.24 (12.9) 1.42e (2.5) 0.81e (1.3) ***
Moist midaltitude 0.76f (0.8) 0.56g (0.5) 0.63fg (0.5) ***
Weighted total 3.70 (22.60) 1.38h (4.84) 0.78h (1.11) ***
Standard deviation in parentheses; *significant at 10%; **significant at 5%; ***significant at 1%
a-c and e-g: years significantly different at 5% (Tukey HSD)
d and h: years significantly different at 1% (Tukey HSD)
In 2010, farmer characteristics differed significantly over the six AEZs in Kenya (Table 3). Gender,
formal education and farming experience were significantly different at a 5% confidence level. Age
of the farmer and literacy rate differed significantly at a 10% confidence level. Most households are
male headed, but households in the low tropics were significantly more male headed than households
in the dry midaltitude zone. This difference is also found between the low tropics and the moist
midaltitude zone and between the moist transitional zone and the moist midaltitude zone. Farmers
in the dry transitional zone were significantly older than farmers in the high tropics. The literacy
rate differed between the dry midaltitude zone and the moist transitional zone. Farmers in the
dry midaltitude zone enjoyed less education than farmers in the dry and moist transitional zones.
Farmers in the dry midaltitude zone had more experience than farmers in the moist midaltitude
zone. This was also the case between the dry transitional zone and the high tropics and between
the dry transitional zone and moist midaltitude zone.
26

4.1 Description of the study area 4 RESULTS AND DISCUSSION
Table
3:Farm
erch
ara
cte
ristics
Low
Dry
Dry
Moist
High
Moist
trop
ics
midaltitude
tran
sition
altran
sition
altrop
ics
midaltitude
(N=90
)(N
=21
6)(N
=20
3)(N
=35
3)(N
=24
0)(N
=24
0)
Gen
der
(%male)
92a
78bc
81abc
86ab
83abc
75c
***
Agefarm
er(years)
51.98de(13.4)
51.67d
e(16.3)
55.51d(16.5)
52.16de(14.1)
51.51e(14.2)
52.02d
e(15.9)
*
Literacyrate
(%farm
ers)
86fg
77f
85fg
86g
85fg
81fg
*
Formaled
ucation(years)
7.45h
i(4.5)
6.07
h(4.3)
7.45
i(4.3)
7.57
i(4.3)
7.06
hi(4.1)
6.89
hi(4.3)
***
Farmingexperience
(years)
24.44
jkl(15.3)
28.38j
k(17.3)
29.29j
(17.7)
26.36j
kl(14.4)
25.30kl(14.3)
24.15l
(15.2)
***
Sta
ndard
deviation
inpare
nth
ese
s;*significantat10%;**significantat5%;***significantat1%
Test:F-sta
tistic
forcontinuousvariables;
chi2
test
forcate
goricalvariables
a-cand
h-i:AEZssignificantly
diff
ere
ntat5%
(Tukey
HSD)
d-gand
j-l:AEZssignificantly
diff
ere
ntat10%
(Tukey
HSD)
27

4 RESULTS AND DISCUSSION 4.1 Description of the study area
4.1.2 Precipitation and temperature
Cimatic conditions determine the specific maize production strategy per year. To compare furher
results, these conditions should be determined first. In 1992, the moist transitional zone and moist
midaltitude received the most precipitation during the long season and between the two seasons
(Figure 6). Rainfall in the second season was low in the whole country.
Precipitation during the long season (March-
August)
Precipitation during the short season
(September-February)
Precipitation between the long and short season
(June-August) Map AEZ Kenya
Figure 6: Total precipitation in 1992 (mm)
(Source: GIS using data from the World Meteorological Organization (http://www.wmo.int/))
28

4.1 Description of the study area 4 RESULTS AND DISCUSSION
In 2010, higher rainfall is measured during the long rains in the moist transitional, high tropics, and
moist midaltitude zones (Figure 7). During the short rains, all zones got more rain than in 1992,
except the low tropics. The rainfall in the period between the two rainy seasons differed between
the AEZs. The dark color in the center of the map covering the dry zones, dry transitional and
dry midaltitude, indicates low precipitation between the seasons and divide the year in two possible
growing seasons. This division is more pronounced in 2010 than in 1992.
Precipitation during the long season (March-
August)
Precipitation during the short season
(September-February)
Precipitation between the long and short season
(June-August) Map AEZ Kenya
Figure 7: Total precipitation in 2010 (mm)
(Source: GIS using data from the World Meteorological Organization (http://www.wmo.int/))
In general, the maximum temperatures were not different between the survey years (Table 4). The
average minimum temperatures were 1.6 degrees higher in 2010 compared to 1992.
29

4 RESULTS AND DISCUSSION 4.2 Market liberalization
Table 4: Average seasonal temperature (◦C)
AEZ 1992 2001 2010
max min max min max min
Low tropics 30.3 20.8 29.6 21.7 30.3 22.2
Dry midaltitude 28.1 17.0 26.5 18.0 27.4 18.3
Dry transitional 25.6 14.4 24.0 15.7 25.0 16.0
Moist transitional 28.0 14.8 25.3 16.4 26.4 16.7
High tropics 27.2 14.7 24.9 16.1 26.1 16.4
Moist midaltitude 28.9 15.4 26.1 16.9 27.2 17.1
4.2 Market liberalization
4.2.1 Market structure: maize seed companies and their varieties
After 15 years of liberalization, new companies have found their place in the maize seed market.
As mentioned earlier, prior to 1992, only one single maize seed company was registered, KSC.
Consequently, the survey of 1992 only found farmers growing varieties from KSC. By 2010, 11
companies had maize varieties registered to their name (http://www.kephis.org/) apart from KARI.
During the 2001 survey, farmers reported the use of seeds of five new maize seed companies
(Table 5); these included two national private companies, Lagrotech and WSC, two multinationals,
Monsanto and Pioneer, and one regional company, Pannar from South Africa. By 2010, farmers
were using varieties from two more local private companies, Faida Seeds and Freshco, and one
regional company, SeedCo from Zimbabwe.
Currently, the plant variety registry of KEPHIS lists 164 varieties (http://www.kephis.org/) which
were registered since 1964. This list does not include several old KSC varieties registered prior
to 1964 (e.g. Kitale Synthetic II). Up to 1989, 14 varieties were registered, owned by either
“KARI/KSC”or “KSC/KARI”, so clearly resulting from public breeding efforts. The 15th variety
(PAN 5195), registered in 1995, was the first fully privately owned variety. The 16th variety (H627)
was the last “KSC/KARI”variety: from then on, KSC would only register varieties from its own
breeding program, while KARI would register varieties under its own name. It took KARI until
2000 to register its own variety independently (KSTP 94 as a 24th variety). About 85% of Kenya’s
varieties were registered in 2000 or later, to include 164 varieties in 2009.
30
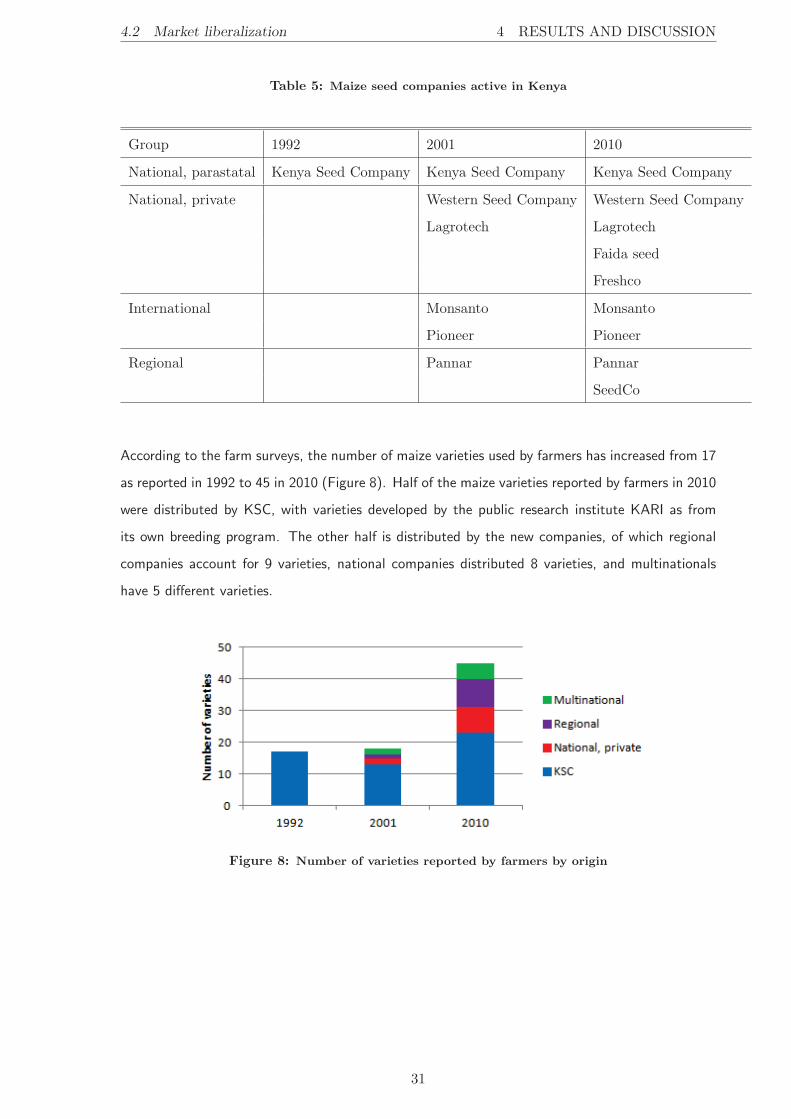
4.2 Market liberalization 4 RESULTS AND DISCUSSION
Table 5: Maize seed companies active in Kenya
Group 1992 2001 2010
National, parastatal Kenya Seed Company Kenya Seed Company Kenya Seed Company
National, private Western Seed Company Western Seed Company
Lagrotech Lagrotech
Faida seed
Freshco
International Monsanto Monsanto
Pioneer Pioneer
Regional Pannar Pannar
SeedCo
According to the farm surveys, the number of maize varieties used by farmers has increased from 17
as reported in 1992 to 45 in 2010 (Figure 8). Half of the maize varieties reported by farmers in 2010
were distributed by KSC, with varieties developed by the public research institute KARI as from
its own breeding program. The other half is distributed by the new companies, of which regional
companies account for 9 varieties, national companies distributed 8 varieties, and multinationals
have 5 different varieties.
Figure 8: Number of varieties reported by farmers by origin
31
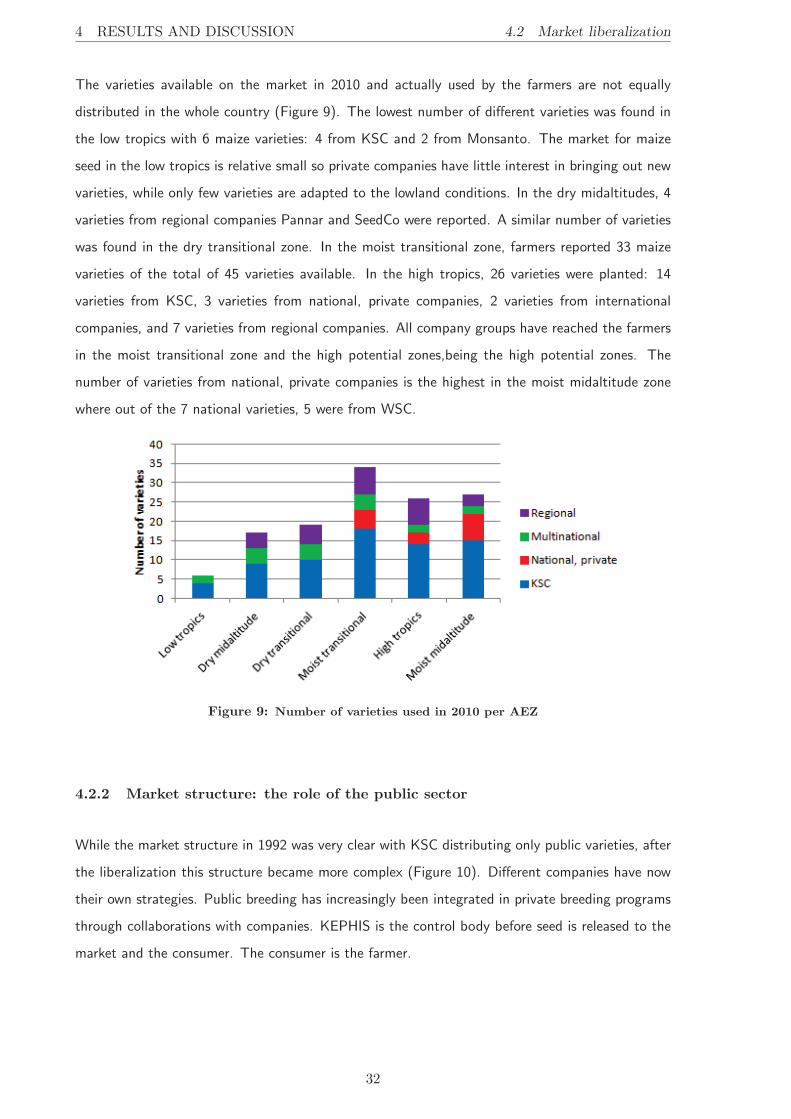
4 RESULTS AND DISCUSSION 4.2 Market liberalization
The varieties available on the market in 2010 and actually used by the farmers are not equally
distributed in the whole country (Figure 9). The lowest number of different varieties was found in
the low tropics with 6 maize varieties: 4 from KSC and 2 from Monsanto. The market for maize
seed in the low tropics is relative small so private companies have little interest in bringing out new
varieties, while only few varieties are adapted to the lowland conditions. In the dry midaltitudes, 4
varieties from regional companies Pannar and SeedCo were reported. A similar number of varieties
was found in the dry transitional zone. In the moist transitional zone, farmers reported 33 maize
varieties of the total of 45 varieties available. In the high tropics, 26 varieties were planted: 14
varieties from KSC, 3 varieties from national, private companies, 2 varieties from international
companies, and 7 varieties from regional companies. All company groups have reached the farmers
in the moist transitional zone and the high potential zones,being the high potential zones. The
number of varieties from national, private companies is the highest in the moist midaltitude zone
where out of the 7 national varieties, 5 were from WSC.
Figure 9: Number of varieties used in 2010 per AEZ
4.2.2 Market structure: the role of the public sector
While the market structure in 1992 was very clear with KSC distributing only public varieties, after
the liberalization this structure became more complex (Figure 10). Different companies have now
their own strategies. Public breeding has increasingly been integrated in private breeding programs
through collaborations with companies. KEPHIS is the control body before seed is released to the
market and the consumer. The consumer is the farmer.
32
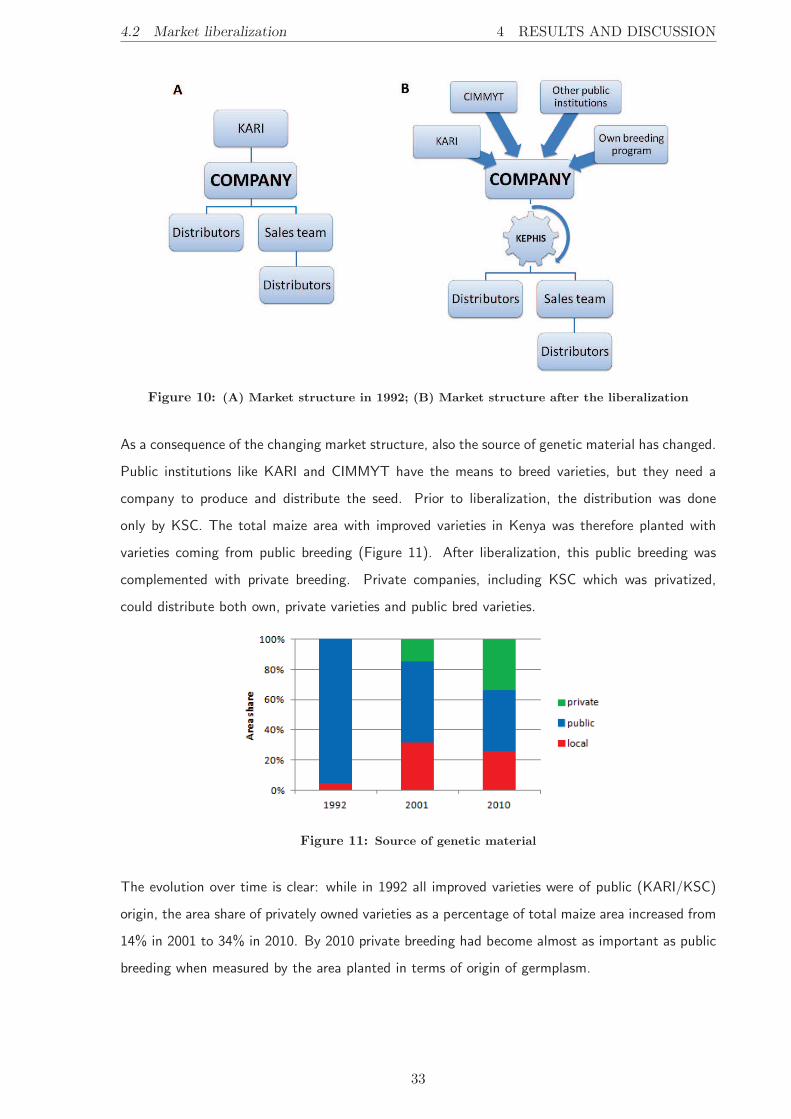
4.2 Market liberalization 4 RESULTS AND DISCUSSION
Figure 10: (A) Market structure in 1992; (B) Market structure after the liberalization
As a consequence of the changing market structure, also the source of genetic material has changed.
Public institutions like KARI and CIMMYT have the means to breed varieties, but they need a
company to produce and distribute the seed. Prior to liberalization, the distribution was done
only by KSC. The total maize area with improved varieties in Kenya was therefore planted with
varieties coming from public breeding (Figure 11). After liberalization, this public breeding was
complemented with private breeding. Private companies, including KSC which was privatized,
could distribute both own, private varieties and public bred varieties.
Figure 11: Source of genetic material
The evolution over time is clear: while in 1992 all improved varieties were of public (KARI/KSC)
origin, the area share of privately owned varieties as a percentage of total maize area increased from
14% in 2001 to 34% in 2010. By 2010 private breeding had become almost as important as public
breeding when measured by the area planted in terms of origin of germplasm.
33
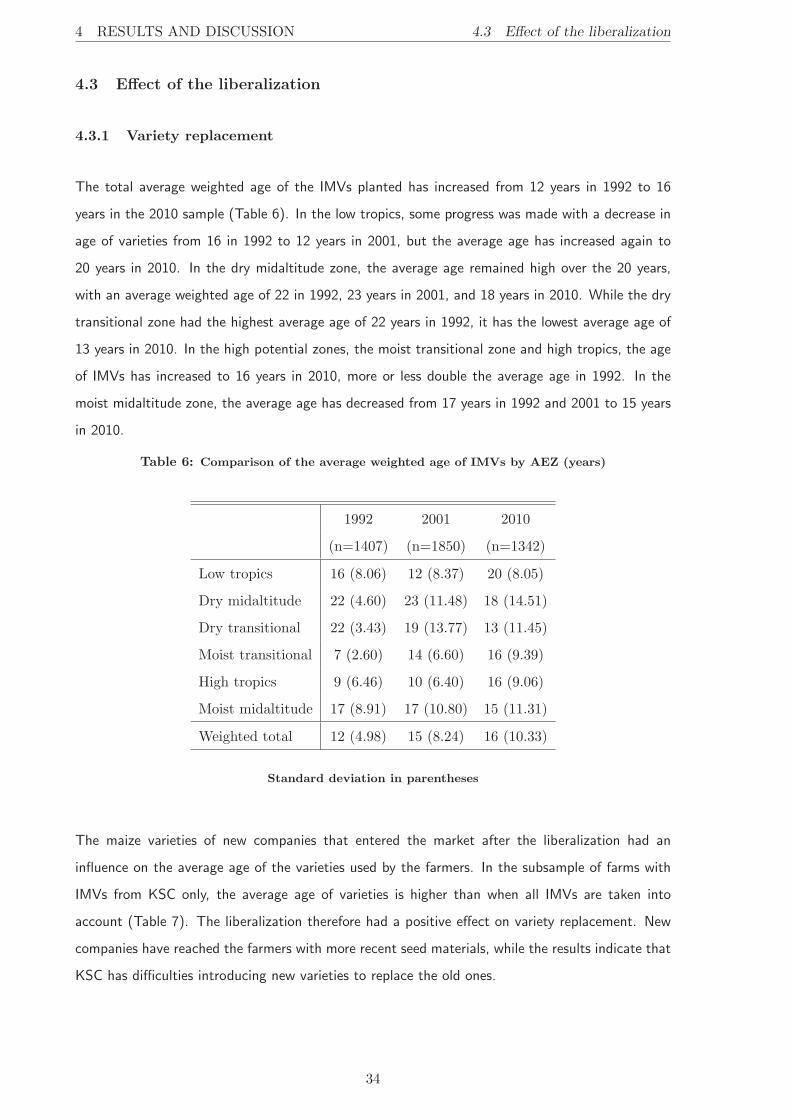
4 RESULTS AND DISCUSSION 4.3 Effect of the liberalization
4.3 Effect of the liberalization
4.3.1 Variety replacement
The total average weighted age of the IMVs planted has increased from 12 years in 1992 to 16
years in the 2010 sample (Table 6). In the low tropics, some progress was made with a decrease in
age of varieties from 16 in 1992 to 12 years in 2001, but the average age has increased again to
20 years in 2010. In the dry midaltitude zone, the average age remained high over the 20 years,
with an average weighted age of 22 in 1992, 23 years in 2001, and 18 years in 2010. While the dry
transitional zone had the highest average age of 22 years in 1992, it has the lowest average age of
13 years in 2010. In the high potential zones, the moist transitional zone and high tropics, the age
of IMVs has increased to 16 years in 2010, more or less double the average age in 1992. In the
moist midaltitude zone, the average age has decreased from 17 years in 1992 and 2001 to 15 years
in 2010.
Table 6: Comparison of the average weighted age of IMVs by AEZ (years)
1992 2001 2010
(n=1407) (n=1850) (n=1342)
Low tropics 16 (8.06) 12 (8.37) 20 (8.05)
Dry midaltitude 22 (4.60) 23 (11.48) 18 (14.51)
Dry transitional 22 (3.43) 19 (13.77) 13 (11.45)
Moist transitional 7 (2.60) 14 (6.60) 16 (9.39)
High tropics 9 (6.46) 10 (6.40) 16 (9.06)
Moist midaltitude 17 (8.91) 17 (10.80) 15 (11.31)
Weighted total 12 (4.98) 15 (8.24) 16 (10.33)
Standard deviation in parentheses
The maize varieties of new companies that entered the market after the liberalization had an
influence on the average age of the varieties used by the farmers. In the subsample of farms with
IMVs from KSC only, the average age of varieties is higher than when all IMVs are taken into
account (Table 7). The liberalization therefore had a positive effect on variety replacement. New
companies have reached the farmers with more recent seed materials, while the results indicate that
KSC has difficulties introducing new varieties to replace the old ones.
34
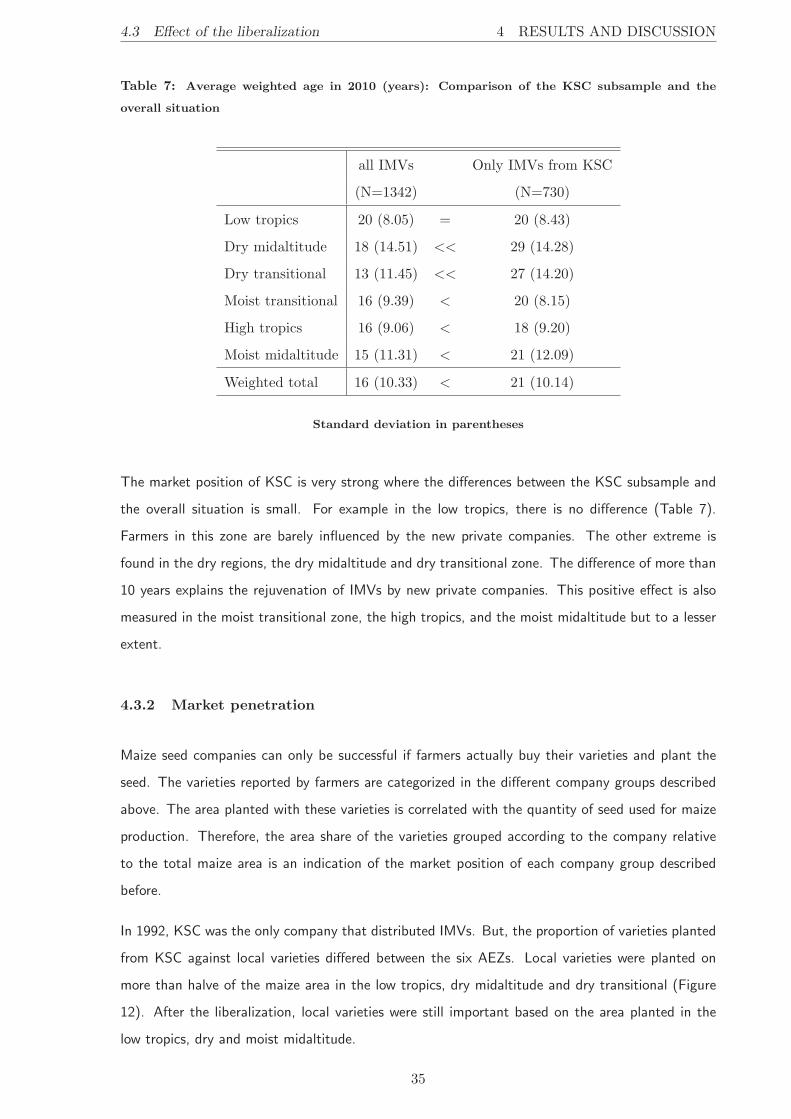
4.3 Effect of the liberalization 4 RESULTS AND DISCUSSION
Table 7: Average weighted age in 2010 (years): Comparison of the KSC subsample and the
overall situation
all IMVs Only IMVs from KSC
(N=1342) (N=730)
Low tropics 20 (8.05) = 20 (8.43)
Dry midaltitude 18 (14.51) << 29 (14.28)
Dry transitional 13 (11.45) << 27 (14.20)
Moist transitional 16 (9.39) < 20 (8.15)
High tropics 16 (9.06) < 18 (9.20)
Moist midaltitude 15 (11.31) < 21 (12.09)
Weighted total 16 (10.33) < 21 (10.14)
Standard deviation in parentheses
The market position of KSC is very strong where the differences between the KSC subsample and
the overall situation is small. For example in the low tropics, there is no difference (Table 7).
Farmers in this zone are barely influenced by the new private companies. The other extreme is
found in the dry regions, the dry midaltitude and dry transitional zone. The difference of more than
10 years explains the rejuvenation of IMVs by new private companies. This positive effect is also
measured in the moist transitional zone, the high tropics, and the moist midaltitude but to a lesser
extent.
4.3.2 Market penetration
Maize seed companies can only be successful if farmers actually buy their varieties and plant the
seed. The varieties reported by farmers are categorized in the different company groups described
above. The area planted with these varieties is correlated with the quantity of seed used for maize
production. Therefore, the area share of the varieties grouped according to the company relative
to the total maize area is an indication of the market position of each company group described
before.
In 1992, KSC was the only company that distributed IMVs. But, the proportion of varieties planted
from KSC against local varieties differed between the six AEZs. Local varieties were planted on
more than halve of the maize area in the low tropics, dry midaltitude and dry transitional (Figure
12). After the liberalization, local varieties were still important based on the area planted in the
low tropics, dry and moist midaltitude.
35
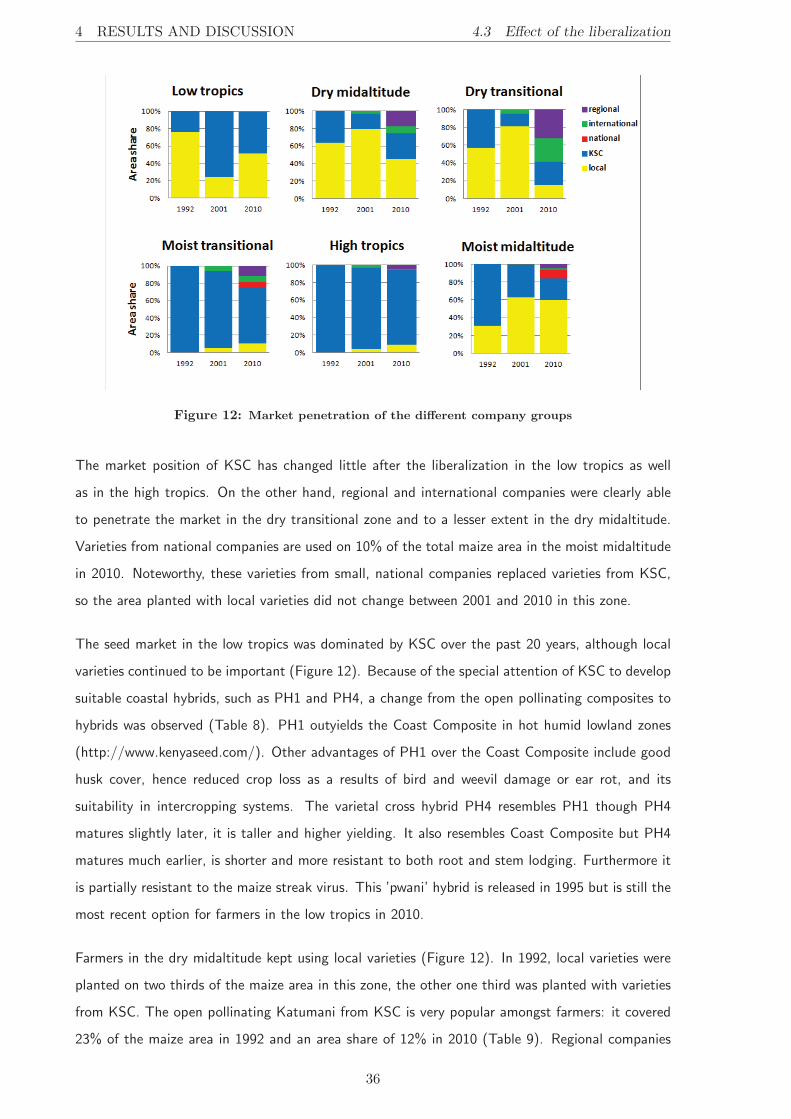
4 RESULTS AND DISCUSSION 4.3 Effect of the liberalization
Figure 12: Market penetration of the different company groups
The market position of KSC has changed little after the liberalization in the low tropics as well
as in the high tropics. On the other hand, regional and international companies were clearly able
to penetrate the market in the dry transitional zone and to a lesser extent in the dry midaltitude.
Varieties from national companies are used on 10% of the total maize area in the moist midaltitude
in 2010. Noteworthy, these varieties from small, national companies replaced varieties from KSC,
so the area planted with local varieties did not change between 2001 and 2010 in this zone.
The seed market in the low tropics was dominated by KSC over the past 20 years, although local
varieties continued to be important (Figure 12). Because of the special attention of KSC to develop
suitable coastal hybrids, such as PH1 and PH4, a change from the open pollinating composites to
hybrids was observed (Table 8). PH1 outyields the Coast Composite in hot humid lowland zones
(http://www.kenyaseed.com/). Other advantages of PH1 over the Coast Composite include good
husk cover, hence reduced crop loss as a results of bird and weevil damage or ear rot, and its
suitability in intercropping systems. The varietal cross hybrid PH4 resembles PH1 though PH4
matures slightly later, it is taller and higher yielding. It also resembles Coast Composite but PH4
matures much earlier, is shorter and more resistant to both root and stem lodging. Furthermore it
is partially resistant to the maize streak virus. This ’pwani’ hybrid is released in 1995 but is still the
most recent option for farmers in the low tropics in 2010.
Farmers in the dry midaltitude kept using local varieties (Figure 12). In 1992, local varieties were
planted on two thirds of the maize area in this zone, the other one third was planted with varieties
from KSC. The open pollinating Katumani from KSC is very popular amongst farmers: it covered
23% of the maize area in 1992 and an area share of 12% in 2010 (Table 9). Regional companies
36
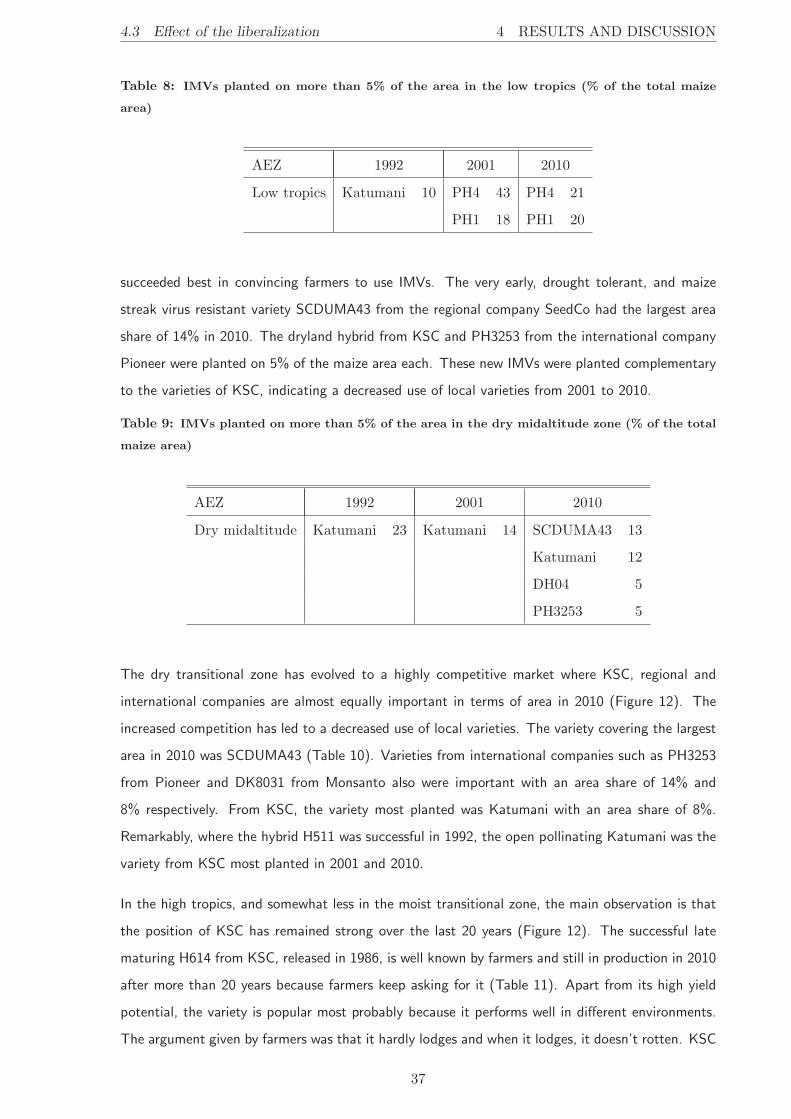
4.3 Effect of the liberalization 4 RESULTS AND DISCUSSION
Table 8: IMVs planted on more than 5% of the area in the low tropics (% of the total maize
area)
AEZ 1992 2001 2010
Low tropics Katumani 10 PH4 43 PH4 21
PH1 18 PH1 20
succeeded best in convincing farmers to use IMVs. The very early, drought tolerant, and maize
streak virus resistant variety SCDUMA43 from the regional company SeedCo had the largest area
share of 14% in 2010. The dryland hybrid from KSC and PH3253 from the international company
Pioneer were planted on 5% of the maize area each. These new IMVs were planted complementary
to the varieties of KSC, indicating a decreased use of local varieties from 2001 to 2010.
Table 9: IMVs planted on more than 5% of the area in the dry midaltitude zone (% of the total
maize area)
AEZ 1992 2001 2010
Dry midaltitude Katumani 23 Katumani 14 SCDUMA43 13
Katumani 12
DH04 5
PH3253 5
The dry transitional zone has evolved to a highly competitive market where KSC, regional and
international companies are almost equally important in terms of area in 2010 (Figure 12). The
increased competition has led to a decreased use of local varieties. The variety covering the largest
area in 2010 was SCDUMA43 (Table 10). Varieties from international companies such as PH3253
from Pioneer and DK8031 from Monsanto also were important with an area share of 14% and
8% respectively. From KSC, the variety most planted was Katumani with an area share of 8%.
Remarkably, where the hybrid H511 was successful in 1992, the open pollinating Katumani was the
variety from KSC most planted in 2001 and 2010.
In the high tropics, and somewhat less in the moist transitional zone, the main observation is that
the position of KSC has remained strong over the last 20 years (Figure 12). The successful late
maturing H614 from KSC, released in 1986, is well known by farmers and still in production in 2010
after more than 20 years because farmers keep asking for it (Table 11). Apart from its high yield
potential, the variety is popular most probably because it performs well in different environments.
The argument given by farmers was that it hardly lodges and when it lodges, it doesn’t rotten. KSC
37
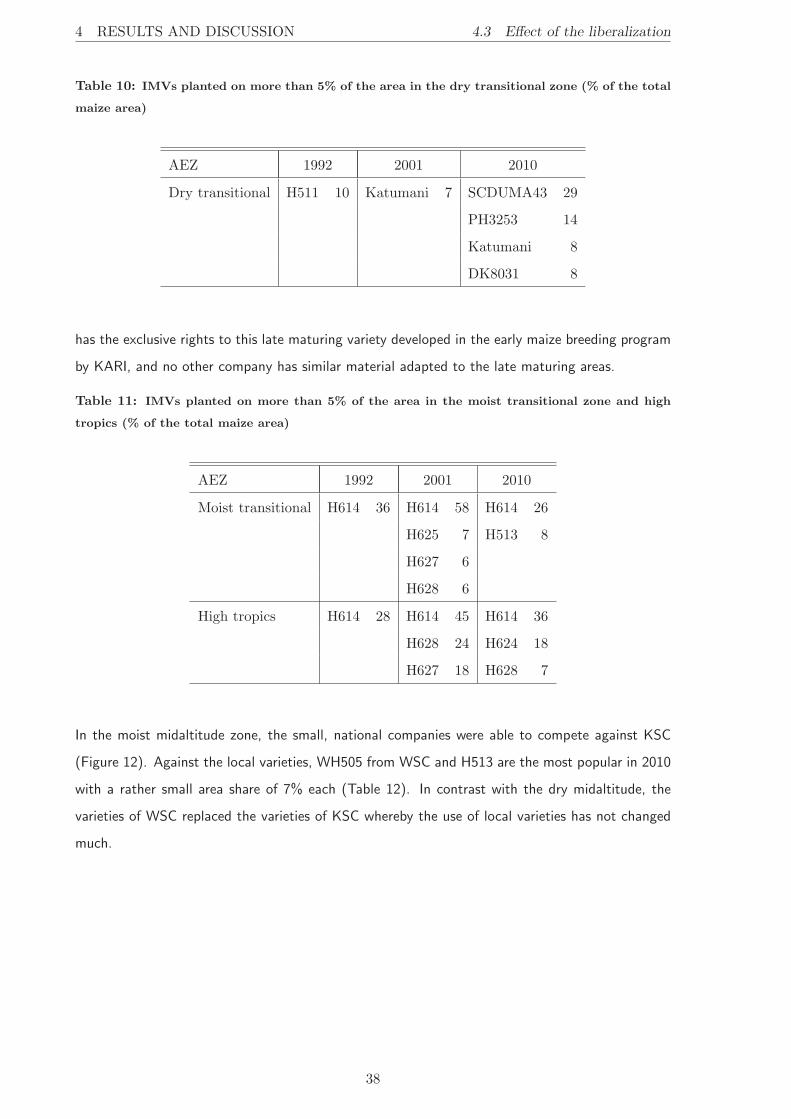
4 RESULTS AND DISCUSSION 4.3 Effect of the liberalization
Table 10: IMVs planted on more than 5% of the area in the dry transitional zone (% of the total
maize area)
AEZ 1992 2001 2010
Dry transitional H511 10 Katumani 7 SCDUMA43 29
PH3253 14
Katumani 8
DK8031 8
has the exclusive rights to this late maturing variety developed in the early maize breeding program
by KARI, and no other company has similar material adapted to the late maturing areas.
Table 11: IMVs planted on more than 5% of the area in the moist transitional zone and high
tropics (% of the total maize area)
AEZ 1992 2001 2010
Moist transitional H614 36 H614 58 H614 26
H625 7 H513 8
H627 6
H628 6
High tropics H614 28 H614 45 H614 36
H628 24 H624 18
H627 18 H628 7
In the moist midaltitude zone, the small, national companies were able to compete against KSC
(Figure 12). Against the local varieties, WH505 from WSC and H513 are the most popular in 2010
with a rather small area share of 7% each (Table 12). In contrast with the dry midaltitude, the
varieties of WSC replaced the varieties of KSC whereby the use of local varieties has not changed
much.
38
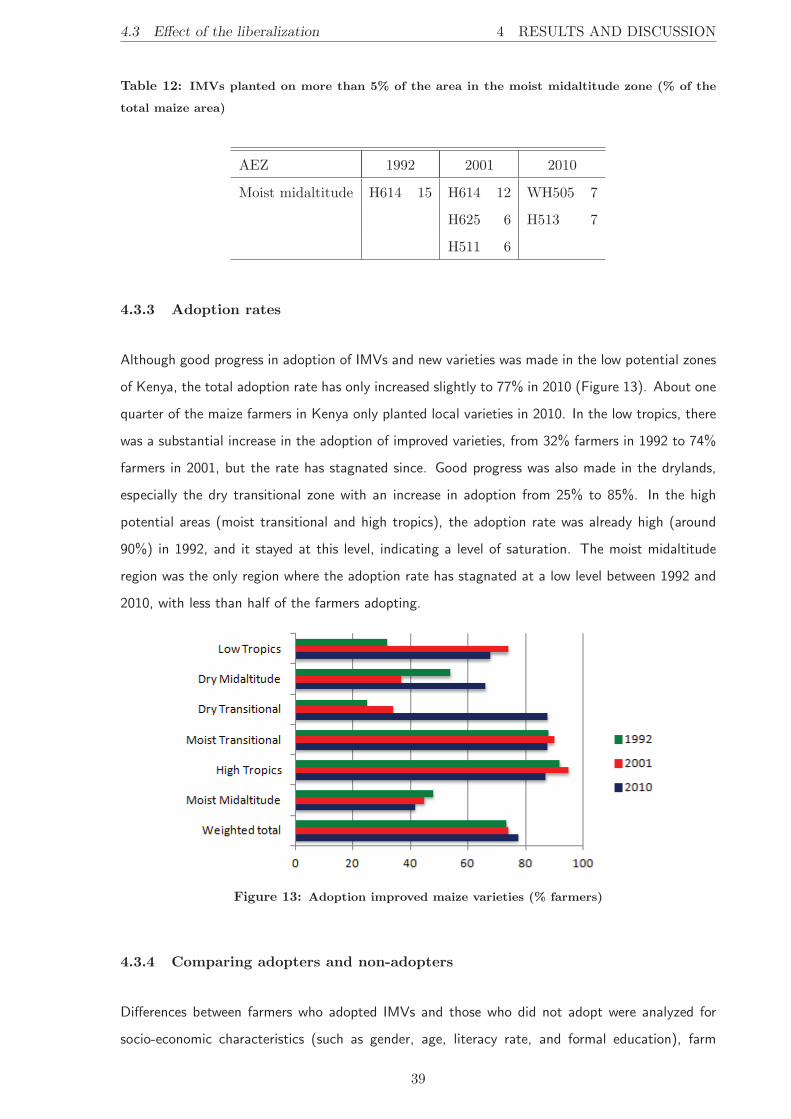
4.3 Effect of the liberalization 4 RESULTS AND DISCUSSION
Table 12: IMVs planted on more than 5% of the area in the moist midaltitude zone (% of the
total maize area)
AEZ 1992 2001 2010
Moist midaltitude H614 15 H614 12 WH505 7
H625 6 H513 7
H511 6
4.3.3 Adoption rates
Although good progress in adoption of IMVs and new varieties was made in the low potential zones
of Kenya, the total adoption rate has only increased slightly to 77% in 2010 (Figure 13). About one
quarter of the maize farmers in Kenya only planted local varieties in 2010. In the low tropics, there
was a substantial increase in the adoption of improved varieties, from 32% farmers in 1992 to 74%
farmers in 2001, but the rate has stagnated since. Good progress was also made in the drylands,
especially the dry transitional zone with an increase in adoption from 25% to 85%. In the high
potential areas (moist transitional and high tropics), the adoption rate was already high (around
90%) in 1992, and it stayed at this level, indicating a level of saturation. The moist midaltitude
region was the only region where the adoption rate has stagnated at a low level between 1992 and
2010, with less than half of the farmers adopting.
Figure 13: Adoption improved maize varieties (% farmers)
4.3.4 Comparing adopters and non-adopters
Differences between farmers who adopted IMVs and those who did not adopt were analyzed for
socio-economic characteristics (such as gender, age, literacy rate, and formal education), farm
39
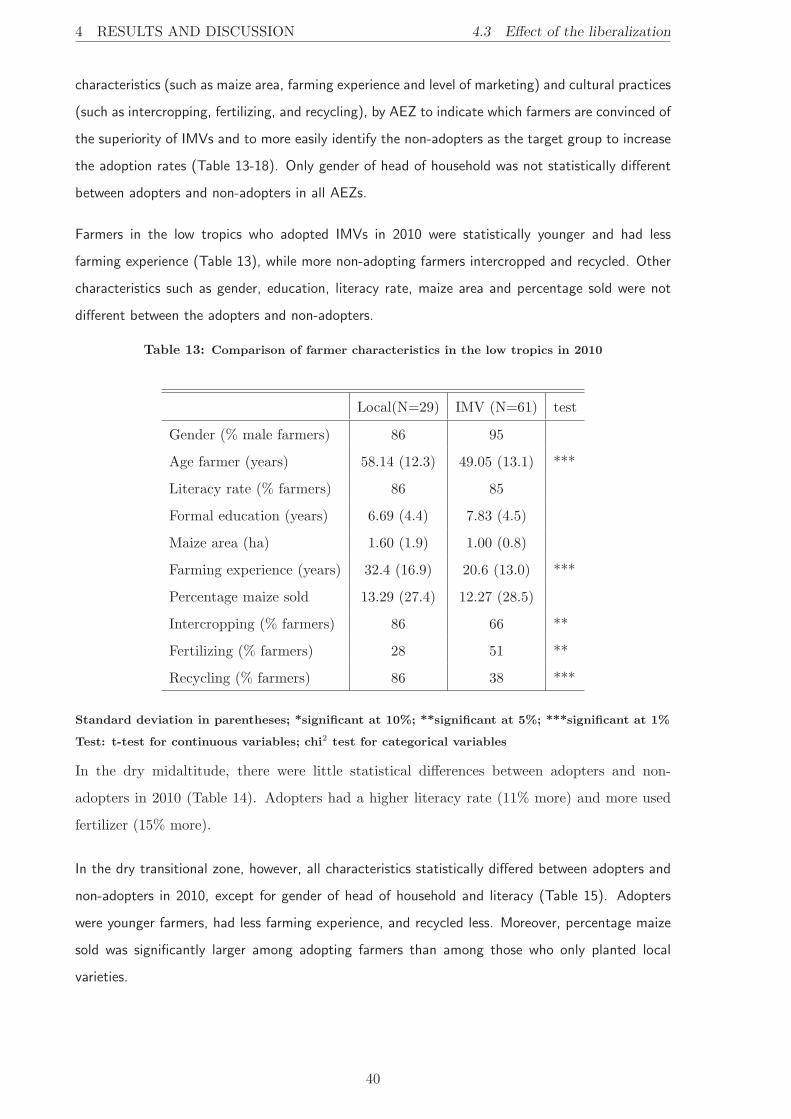
4 RESULTS AND DISCUSSION 4.3 Effect of the liberalization
characteristics (such as maize area, farming experience and level of marketing) and cultural practices
(such as intercropping, fertilizing, and recycling), by AEZ to indicate which farmers are convinced of
the superiority of IMVs and to more easily identify the non-adopters as the target group to increase
the adoption rates (Table 13-18). Only gender of head of household was not statistically different
between adopters and non-adopters in all AEZs.
Farmers in the low tropics who adopted IMVs in 2010 were statistically younger and had less
farming experience (Table 13), while more non-adopting farmers intercropped and recycled. Other
characteristics such as gender, education, literacy rate, maize area and percentage sold were not
different between the adopters and non-adopters.
Table 13: Comparison of farmer characteristics in the low tropics in 2010
Local(N=29) IMV (N=61) test
Gender (% male farmers) 86 95
Age farmer (years) 58.14 (12.3) 49.05 (13.1) ***
Literacy rate (% farmers) 86 85
Formal education (years) 6.69 (4.4) 7.83 (4.5)
Maize area (ha) 1.60 (1.9) 1.00 (0.8)
Farming experience (years) 32.4 (16.9) 20.6 (13.0) ***
Percentage maize sold 13.29 (27.4) 12.27 (28.5)
Intercropping (% farmers) 86 66 **
Fertilizing (% farmers) 28 51 **
Recycling (% farmers) 86 38 ***
Standard deviation in parentheses; *significant at 10%; **significant at 5%; ***significant at 1%
Test: t-test for continuous variables; chi2 test for categorical variables
In the dry midaltitude, there were little statistical differences between adopters and non-
adopters in 2010 (Table 14). Adopters had a higher literacy rate (11% more) and more used
fertilizer (15% more).
In the dry transitional zone, however, all characteristics statistically differed between adopters and
non-adopters in 2010, except for gender of head of household and literacy (Table 15). Adopters
were younger farmers, had less farming experience, and recycled less. Moreover, percentage maize
sold was significantly larger among adopting farmers than among those who only planted local
varieties.
40

4.3 Effect of the liberalization 4 RESULTS AND DISCUSSION
Table 14: Comparison of farmer characteristics in the dry midaltitude zone in 2010
Local(N=73) IMV (N=143) test
Gender (% male farmers) 82 78
Age farmer (years) 52.47 (16.3) 51.02 (16.0)
Literacy rate (% farmers) 69 80 *
Formal education (years) 5.39 (4.5) 6.41 (4.2)
Maize area (ha) 1.00 (1.0) 1.01 (0.9)
Farming experience (years) 30.9 (18.1) 27.0 (16.5)
Percentage maize sold 13.65 (25.7) 16.53 (40.6)
Intercropping (% farmers) 98 89
Fertilizing (% farmers) 46 61 *
Recycling (% farmers) 48 50
Standard deviation in parentheses; *significant at 10%; **significant at 5%; ***significant at 1%
Test: t-test for continuous variables; chi2 test for categorical variables
Table 15: Comparison of farmer characteristics in the dry transitional zone in 2010
Local(N=25) IMV (N=178) test
Gender (% male farmers) 82 82
Age farmer (years) 65.6 (20.2) 54.3 (15.6) **
Literacy rate (% farmers) 70 86
Formal education (years) 5.77 (4.4) 7.64 (4.3) *
Maize area (ha) 0.59 (0.5) 0.85 (0.9) **
Farming experience (years) 39.1 (21.0) 28.2 (16.9) **
Percentage maize sold 6.04 (18.7) 15.76 (27.7) **
Intercropping (% farmers) 91 91
Fertilizing (% farmers) 53 87 ***
Recycling (% farmers) 83 26 ***
Standard deviation in parentheses; *significant at 10%; **significant at 5%; ***significant at 1%
Test: t-test for continuous variables; chi2 test for categorical variables
Similarly, the difference between adopting and non-adopting farmers is very clear in the high poten-
tial areas (Table 16 and 17). In the moist transitional zone, adopters were younger, had less farming
experience but had enjoyed a longer formal education and had a higher literacy rate. Furthermore,
41

4 RESULTS AND DISCUSSION 4.3 Effect of the liberalization
adopters had larger areas in maize production and marketed a higher proportion of their production.
Where adopting farmers used more fresh materials, the percentage of farmers who intercrop was
statistically not different between the adopters and non-adopters. The same results were observed
in the high tropics in 2010 where the maize area, percentage maize sold and percentage farmers
who recycle, literacy rate and education level were higher amongst adopters (Table 17). There was
no difference in gender, age, farming experience or percentage intercropping.
Table 16: Comparison of farmer characteristics in the moist transitional zone in 2010
Local(N=44) IMV (N=309) test
Gender (% male farmers) 80 87
Age farmer (years) 57.32 (14.5) 51.42 (13.9) ***
Literacy rate (% farmers) 66 89 ***
Formal education (years) 4.66 (4.2) 7.98 (4.2) ***
Maize area (ha) 0.36 (0.3) 0.74 (1.2) ***
Farming experience (years) 33.5 (14.8) 25.3 (14.1) ***
Percentage maize sold 11.8 (26.1) 26.61 (39.6) ***
Intercropping (% farmers) 91 89
Fertilizing (% farmers) 61 87 ***
Recycling (% farmers) 95 9 ***
Standard deviation in parentheses; *significant at 10%; **significant at 5%; ***significant at 1%
Test: t-test for continuous variables; chi2 test for categorical variables
Farmers in the moist midaltitude in 2010 who adopted IMVs were also younger but there was only a
small difference in farming experience (Table 18). They enjoyed a longer formal education but the
literacy rate did not differ. The planting strategy was different in terms of fertilizing and recycling
but not in terms of intercropping, and they sold more maize.
42

4.3 Effect of the liberalization 4 RESULTS AND DISCUSSION
Table 17: Comparison of farmer characteristics in the high tropics in 2010
Local(N=31) IMV (N=209) test
Gender (% male farmers) 74 84
Age farmer (years) 54.19 (17.1) 51.11 (13.7)
Literacy rate (% farmers) 74 87 *
Formal education (years) 5.77 (4.4) 7.25 (4.1) *
Maize area (ha) 0.31 (0.3) 0.88 (1.4) ***
Farming experience (years) 28.87 (17.9) 24.77 (13.7)
Percentage maize sold 4.71 (19.3) 21.91 (39.8) ***
Intercropping (% farmers) 76 82
Fertilizing (% farmers) 74 88 **
Recycling (% farmers) 77 9 ***
Standard deviation in parentheses; *significant at 10%; **significant at 5%; ***significant at 1%
Test: t-test for continuous variables; chi2 test for categorical variables
Table 18: Comparison of farmer characteristics in the moist midaltitude zone in 2010
Local(N=140) IMV (N=100) test
Gender (% male farmers) 73 77
Age farmer (years) 53.71 (15.8) 49.52 (15.7) **
Literacy rate (% farmers) 78 86
Formal education (years) 6.37 (4.3) 7.68 (4.2) **
Maize area (ha) 0.61 (0.5) 0.67 (0.6)
Farming experience (years) 25.76 (15.4) 22.19 (14.8) *
Percentage maize sold 11.68 (23.8) 21.37 (33.0) **
Intercropping (% farmers) 96 91 *
Fertilizing (% farmers) 44 64 ***
Recycling (% farmers) 88 21 ***
Standard deviation in parentheses; *significant at 10%; **significant at 5%; ***significant at 1%
Test: t-test for continuous variables; chi2 test for categorical variables
43

4 RESULTS AND DISCUSSION 4.3 Effect of the liberalization
4.3.5 Logistic model estimates
Factors influencing the adoption of improved maize varieties were analyzed using maximum likeli-
hood estimation of a logistic regression model. The model has a correct prediction rate of 83.6%,
correctly predicting adopters at 92%, and non-adopters at 58% (Table 19). Factors that influenced
adoption were AEZ, experience, use of fertilizer, and recycling. The reference AEZ is the moist
midaltitude zone. Other variables, such as gender, age, literacy rate, education, maize area, per-
centage maize sold, and intercropping, which were expected to influence adoption of IMVs were
not significant.
Table 19: The logit analysis for adoption of IMVs
Variable Coefficient estimate (B) Exp(B)
Low tropics 1.382 (0.33) *** 3.982
Dry midaltitude 1.527 (0.26) *** 4.603
Dry transitional 2.608 (0.33) *** 13.571
Moist transitional 1.692 (0.26) *** 5.430
High tropics 1.527 (0.29) *** 4.603
Gender (1=female, 0=male) 0.449 (0.23) 1.566
Age (years) 0.009 (0.01) 1.009
Literacy rate (1=yes, 0=no) -0.005 (0.31) 0.995
Education (years) 0.025 (0.03) 1.025
Maize area (ha) 0.073 (0.10) 1.076
Farming experience (years) -0.028 (0.01) ** 0.973
Percentage maize sold 0.769 (0.32) 2.159
Intercropping (1=yes, 0=no) -0.185 (0.30) 0.831
Fertilizing (1=yes, 0=no) 0.780 (0.18) *** 2.181
Recycling (1=yes, 0=no) -2.476 (0.18) *** 0.084
Intercept 0.620 (0.596) 1.858
Model Chi-square 507.688 ***
Overall cases correctly predicted (%) 83.8
Correctly predicted adopters (%) 92.2
Correctly predicted non-adopters (%) 57.8 Sample size (no.) 1342
Standard deviation in parentheses; *significant at 10%; **significant at 5%; ***significant at 1%
44
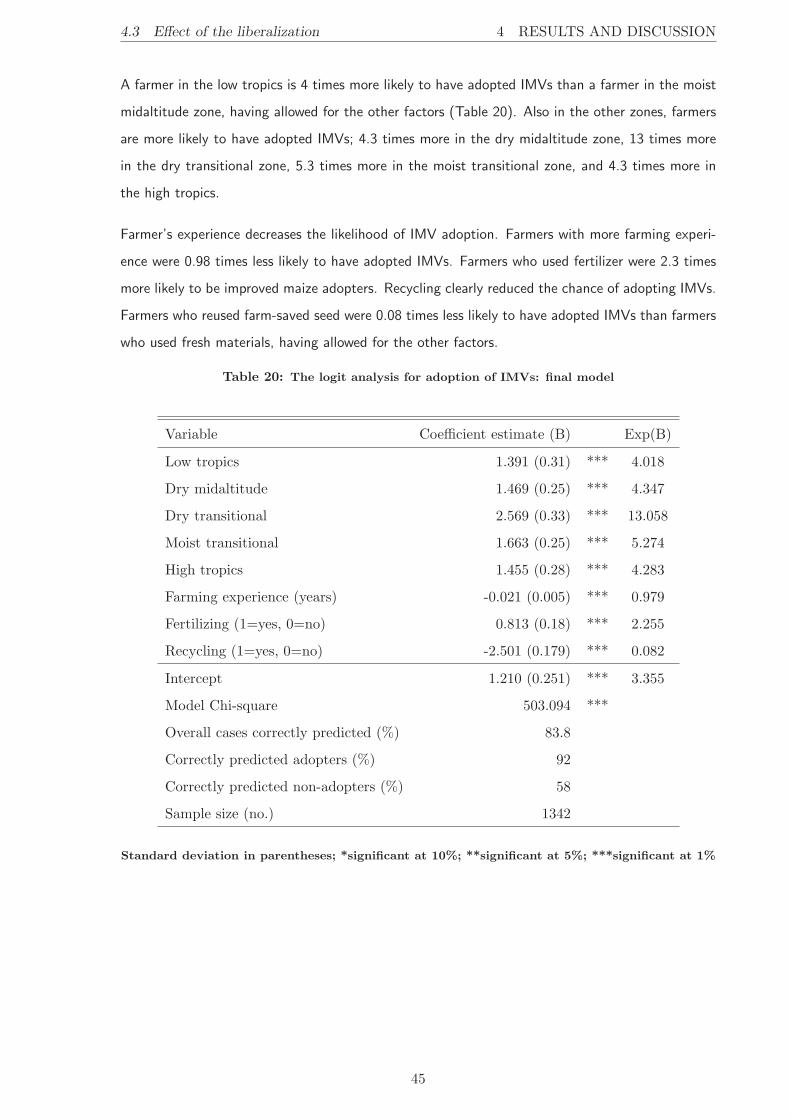
4.3 Effect of the liberalization 4 RESULTS AND DISCUSSION
A farmer in the low tropics is 4 times more likely to have adopted IMVs than a farmer in the moist
midaltitude zone, having allowed for the other factors (Table 20). Also in the other zones, farmers
are more likely to have adopted IMVs; 4.3 times more in the dry midaltitude zone, 13 times more
in the dry transitional zone, 5.3 times more in the moist transitional zone, and 4.3 times more in
the high tropics.
Farmer’s experience decreases the likelihood of IMV adoption. Farmers with more farming experi-
ence were 0.98 times less likely to have adopted IMVs. Farmers who used fertilizer were 2.3 times
more likely to be improved maize adopters. Recycling clearly reduced the chance of adopting IMVs.
Farmers who reused farm-saved seed were 0.08 times less likely to have adopted IMVs than farmers
who used fresh materials, having allowed for the other factors.
Table 20: The logit analysis for adoption of IMVs: final model
Variable Coefficient estimate (B) Exp(B)
Low tropics 1.391 (0.31) *** 4.018
Dry midaltitude 1.469 (0.25) *** 4.347
Dry transitional 2.569 (0.33) *** 13.058
Moist transitional 1.663 (0.25) *** 5.274
High tropics 1.455 (0.28) *** 4.283
Farming experience (years) -0.021 (0.005) *** 0.979
Fertilizing (1=yes, 0=no) 0.813 (0.18) *** 2.255
Recycling (1=yes, 0=no) -2.501 (0.179) *** 0.082
Intercept 1.210 (0.251) *** 3.355
Model Chi-square 503.094 ***
Overall cases correctly predicted (%) 83.8
Correctly predicted adopters (%) 92
Correctly predicted non-adopters (%) 58
Sample size (no.) 1342
Standard deviation in parentheses; *significant at 10%; **significant at 5%; ***significant at 1%
45
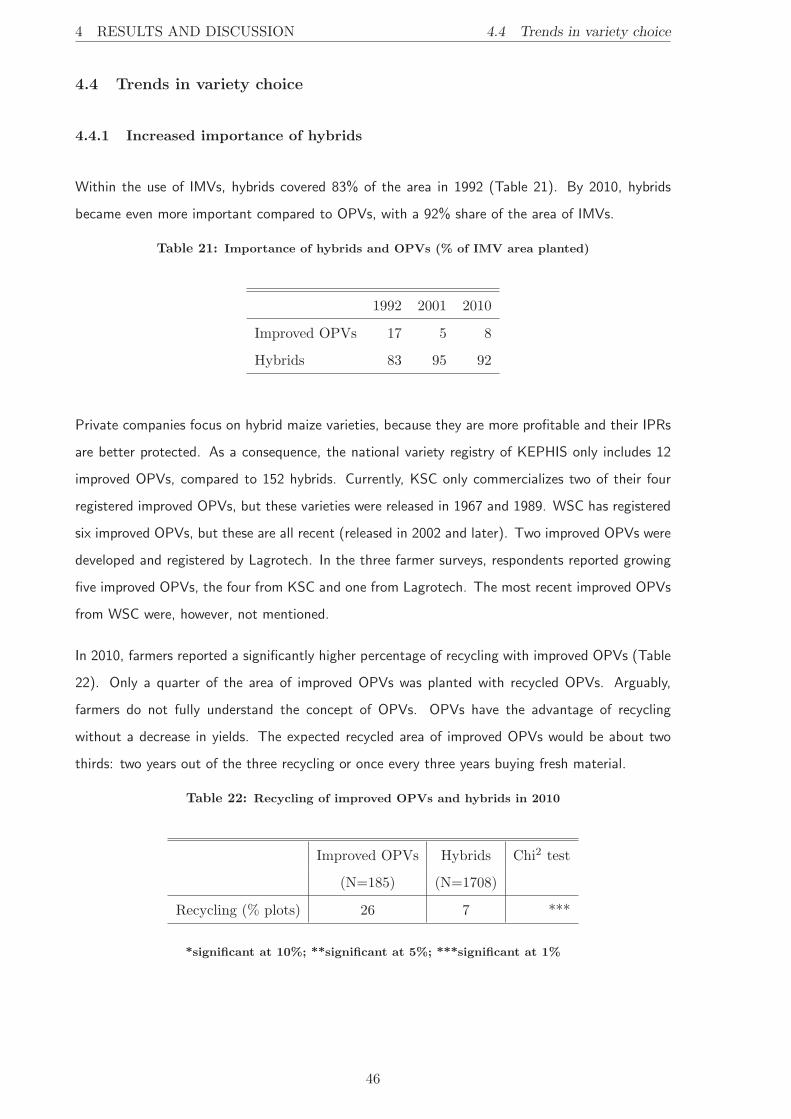
4 RESULTS AND DISCUSSION 4.4 Trends in variety choice
4.4 Trends in variety choice
4.4.1 Increased importance of hybrids
Within the use of IMVs, hybrids covered 83% of the area in 1992 (Table 21). By 2010, hybrids
became even more important compared to OPVs, with a 92% share of the area of IMVs.
Table 21: Importance of hybrids and OPVs (% of IMV area planted)
1992 2001 2010
Improved OPVs 17 5 8
Hybrids 83 95 92
Private companies focus on hybrid maize varieties, because they are more profitable and their IPRs
are better protected. As a consequence, the national variety registry of KEPHIS only includes 12
improved OPVs, compared to 152 hybrids. Currently, KSC only commercializes two of their four
registered improved OPVs, but these varieties were released in 1967 and 1989. WSC has registered
six improved OPVs, but these are all recent (released in 2002 and later). Two improved OPVs were
developed and registered by Lagrotech. In the three farmer surveys, respondents reported growing
five improved OPVs, the four from KSC and one from Lagrotech. The most recent improved OPVs
from WSC were, however, not mentioned.
In 2010, farmers reported a significantly higher percentage of recycling with improved OPVs (Table
22). Only a quarter of the area of improved OPVs was planted with recycled OPVs. Arguably,
farmers do not fully understand the concept of OPVs. OPVs have the advantage of recycling
without a decrease in yields. The expected recycled area of improved OPVs would be about two
thirds: two years out of the three recycling or once every three years buying fresh material.
Table 22: Recycling of improved OPVs and hybrids in 2010
Improved OPVs Hybrids Chi2 test
(N=185) (N=1708)
Recycling (% plots) 26 7 ***
*significant at 10%; **significant at 5%; ***significant at 1%
46

4.4 Trends in variety choice 4 RESULTS AND DISCUSSION
4.4.2 Increased importance of early and medium maturing varieties
Farmers’ preference in maize varieties showed a clear shift from the dominance of the late maturing
varieties in 1992 (89%) to a mixture of late (44%), medium (14%), and early (42%) maturing
varieties in 2010 (Table 23). The percentage of the area planted with late maturing maize varieties
relative to the area planted with all IMVs has decreased by half. In 2010, early maturing varieties
became as important as late maturing varieties.
Table 23: Changes in maturity (% of the IMV area weighted by AEZ)
1992 2001 2010
Early 3 31 42
Medium 8 6 14
Late 89 63 44
Given the differences in growing conditions, the shifts in maturity differ over the AEZ. In 1992, 80%
of the area in IMVs in the low tropics and dry midaltitude was planted with early maturing varieties
(Figure 14). In the dry transitional zone, medium maturing varieties covered most of the IMV area.
In the high potential zones and moist midaltitude, late maturing IMVs dominated. Early maturing
varieties, such as Katumani and PH1 suited the low tropics and dry midaltitude. Medium maturing
varieties, such as H511 and H512 were the best options for the dry transitional zone. Late maturing
varieties, such as H614 have been bred for the high potential zones.
Figure 14: Maturity of IMVs in 1992
47
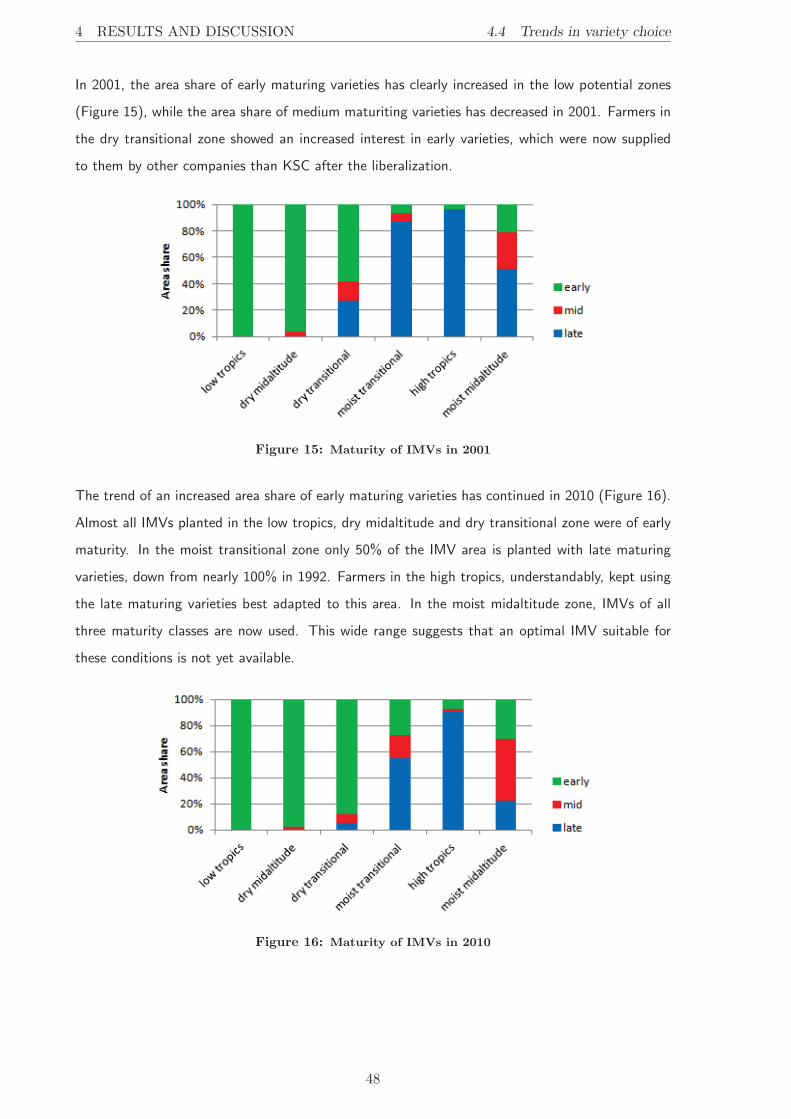
4 RESULTS AND DISCUSSION 4.4 Trends in variety choice
In 2001, the area share of early maturing varieties has clearly increased in the low potential zones
(Figure 15), while the area share of medium maturiting varieties has decreased in 2001. Farmers in
the dry transitional zone showed an increased interest in early varieties, which were now supplied
to them by other companies than KSC after the liberalization.
Figure 15: Maturity of IMVs in 2001
The trend of an increased area share of early maturing varieties has continued in 2010 (Figure 16).
Almost all IMVs planted in the low tropics, dry midaltitude and dry transitional zone were of early
maturity. In the moist transitional zone only 50% of the IMV area is planted with late maturing
varieties, down from nearly 100% in 1992. Farmers in the high tropics, understandably, kept using
the late maturing varieties best adapted to this area. In the moist midaltitude zone, IMVs of all
three maturity classes are now used. This wide range suggests that an optimal IMV suitable for
these conditions is not yet available.
Figure 16: Maturity of IMVs in 2010
48
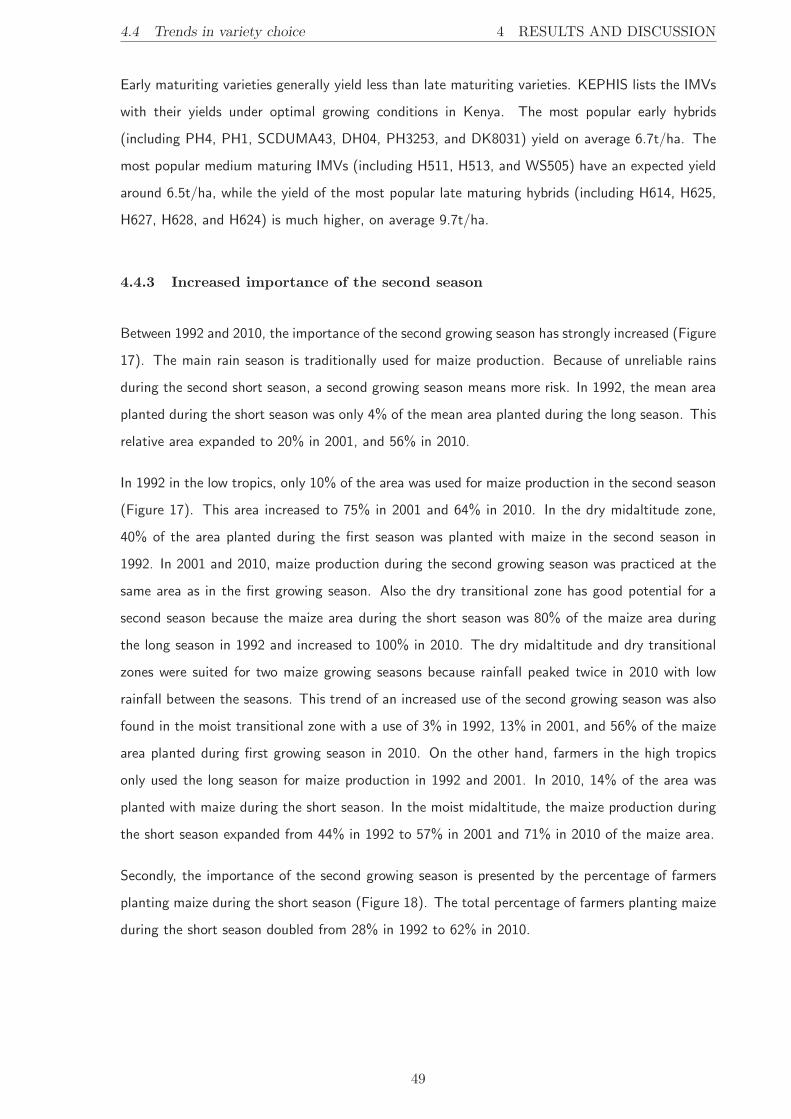
4.4 Trends in variety choice 4 RESULTS AND DISCUSSION
Early maturiting varieties generally yield less than late maturiting varieties. KEPHIS lists the IMVs
with their yields under optimal growing conditions in Kenya. The most popular early hybrids
(including PH4, PH1, SCDUMA43, DH04, PH3253, and DK8031) yield on average 6.7t/ha. The
most popular medium maturing IMVs (including H511, H513, and WS505) have an expected yield
around 6.5t/ha, while the yield of the most popular late maturing hybrids (including H614, H625,
H627, H628, and H624) is much higher, on average 9.7t/ha.
4.4.3 Increased importance of the second season
Between 1992 and 2010, the importance of the second growing season has strongly increased (Figure
17). The main rain season is traditionally used for maize production. Because of unreliable rains
during the second short season, a second growing season means more risk. In 1992, the mean area
planted during the short season was only 4% of the mean area planted during the long season. This
relative area expanded to 20% in 2001, and 56% in 2010.
In 1992 in the low tropics, only 10% of the area was used for maize production in the second season
(Figure 17). This area increased to 75% in 2001 and 64% in 2010. In the dry midaltitude zone,
40% of the area planted during the first season was planted with maize in the second season in
1992. In 2001 and 2010, maize production during the second growing season was practiced at the
same area as in the first growing season. Also the dry transitional zone has good potential for a
second season because the maize area during the short season was 80% of the maize area during
the long season in 1992 and increased to 100% in 2010. The dry midaltitude and dry transitional
zones were suited for two maize growing seasons because rainfall peaked twice in 2010 with low
rainfall between the seasons. This trend of an increased use of the second growing season was also
found in the moist transitional zone with a use of 3% in 1992, 13% in 2001, and 56% of the maize
area planted during first growing season in 2010. On the other hand, farmers in the high tropics
only used the long season for maize production in 1992 and 2001. In 2010, 14% of the area was
planted with maize during the short season. In the moist midaltitude, the maize production during
the short season expanded from 44% in 1992 to 57% in 2001 and 71% in 2010 of the maize area.
Secondly, the importance of the second growing season is presented by the percentage of farmers
planting maize during the short season (Figure 18). The total percentage of farmers planting maize
during the short season doubled from 28% in 1992 to 62% in 2010.
49

4 RESULTS AND DISCUSSION 4.4 Trends in variety choice
Figure 17: Relative share of the second maize growing season based on area
In the low tropics, the percentage farmers using the short season for maize production increased
from 24% in 1992 to 53% in 2001 and 72% in 2010. The highest increase was measured in the
drylands. The percentage farmers using the second season increased from 36% in 1992 to 95% in
2010 in the dry midaltitude zone. Similarly in the dry transitional zone, the percentage farmers
increased from 25% in 1992 to 91% in 2010. In the high potential zones, twice as much farmers
planted maize during the short season. In the moist transitional zone, the percentage farmers
increased from 31% in 1992 to 62% in 2010, and in the high tropics, an increase from 13% in 1992
to 27% in 2010 was measured. In the moist midaltitude, the percentage of farmers planting maize
during the short season increased from 40% in 1992 to 78% in 2010.
Figure 18: Percentage farmers having two maize growing seasons
However, there seems to be no difference between the long and short season according to maturity
of IMVs when farmers plant maize in both seasons (Table 24). In both seasons, early maturing
IMVs were most common.
50
4.4 Trends in variety choice 4 RESULTS AND DISCUSSION
Table 24: Maturity of IMVs used by farmers who produce maize during both the long and short
season in 2010: Comparison between the two seasons
Long season Short season t-test
(N=566) (N=566)
Area early IMVs (ha) 2.60 (5.5) 2.68 (5.4)
Area medium IMVs (ha) 0.59 (2.1) 0.51 (1.7)
Area late IMVs (ha) 0.77 (2.9) 0.59 (2.3)
Standard deviation in parentheses; *significant at 10%; **significant at 5%; ***significant at 1%
The areas are calculated weighted by AEZ
Because there were no differences between long and short season for farmers who produced maize
during both seasons, the average area planted in each maturity class in both seasons can be com-
pared with the farmers who only plant maize in one of the seasons.
The area planted with late maturing IMVs is on average 3.51 ha when only one season is used for
maize production (Table 25). When two maize growing seasons are used, this average area is only
0.68 ha. On the other hand, farmers who use both seasons for maize production plant twice as
much early maturing IMVs (1.43 ha if one season, 2.64 ha if two seasons).
Table 25: Maturity of IMVs in 2010: Comparison between farmers who have one growing season
and farmers who have both seasons
1 season 2 seasons t-test
(N=443) (N=566)
Area early IMVs (ha) 1.43 (3.5) 2.64 (5.3) ***
Area medium IMVs (ha) 0.34 (1.7) 0.55 (1.8) *
Area late IMVs (ha) 3.51 (7.0) 0.68 (2.5) ***
Standard deviation in parentheses; *significant at 10%; **significant at 5%; ***significant at 1%
The areas are calculated weighted by AEZ
51
5 CONCLUSION
5 Conclusion
Increased competition after the maize seed market liberalization has brought about a positive change
for farmers in terms of options of varieties they are able to choose from. New companies could
reach the farmers with more recent IMVs as shown by the average weighted age in the subsample
with only IMVs from KSC which was higher than in the sample for other IMV adopters. Overall,
the adoption of improved maize varieties by Kenyan farmers has stagnated around 77% between
the first survey in 1992 and the most recent one in 2010 but some differences between the AEZs
are remarkable.
Farmers in the low tropics seem not to have benefitted much from the market liberalization, mainly
because new companies were not interested in the region. This is also reflected in the age of varieties
which is the same in the subsample with only varieties from KSC and the overall situation. KSC
tried to convince the farmers with coastal hybrids, leading to a higher adoption in 2001. Farmers
in the dry midaltitude zone are lagging behind in every indicator of IMV use discussed. In the dry
transitional zone, the increased competition on the maize seed market has led to a decreased use
of local varieties. Yet, this region accounts for only 5% of the total maize area in Kenya. In the
high potential zones, the adoption rate was already high prior to liberalization. KSC remains a
strong competitor for new companies, but KSC has a hard time replacing its own, old varieties. In
the moist midaltitude region, there is room for production increase if farmers would start to adopt
better yielding varieties.
A comparative analysis between adopters and non-adopters of IMVs was done. The head of the
farm, who is the decision maker in most cases, was on average between 50 and 55 years old in the
group of adopters. Non-adopters were on average between 55 and 65 years old. In the AEZs with
a significantly difference in literacy rate and education, these characteristics were higher amongst
adopters. The average maize area that adopters used for maize production was significantly higher
in the moist transitional zone and high tropics. Adopting farmers had less farming experience in
the low tropics, and the dry and moist transitional zones, but were not beginners.
In the high potential zones, market infrastructure and roads are more developed, whereby the
percentage maize sold was also an indicator of IMV adoption. Maize production strategies in the
high potential zones differed in levels of fertilizing and recycling. The percentage of adopting
farmers who used fertilizers was significantly higher, and only a small percentage adopters reused
own maize seed. The last production characteristic, intercropping, was not different in the high
potential zones. A high percentage farmers, both adopters and non-adopters combined maize
production with another crop.
52

5 CONCLUSION
A logit model was used to analyze factors affecting IMV adoption. AEZ, farming experience,
fertilizer use, and recycling were statistically significant in explaining adoption of IMVs. Other
variables, such as gender, age, literacy rate, and education of household head, maize area, level of
marketing, and intercropping, which were expected to influence IMV adoption were not significant.
In the low potential zones, where adoption of IMVs is still low, improved OPVs can be a solution to
enhance productivity gains. Although recent improved OPVs are available on the market, farmers
only reported the older improved OPV. The advantage of OPVs for farmers in comparison with
hybrids is the fact that these seeds can be reused without a decrease in yields. Only one fourth of
the improved OPV plots were recycled. On the other hand, local varieties, which are also OPVs,
were recycled by 86% of the farmers in the low tropics. In the high potential zones, hybrids can
reach their yield potential if farmers apply fertilizers.
New private companies focus on early maturing hybrids. Hybrids are more profitable and their IPRs
are better protected. This is reflected in the increased use of hybrids and the increased use of early
maturing IMVs. Early maturing varieties can be grown twice a year in the AEZs with two rainfall
peaks such as the dry midaltitude and dry transitional zone. In these zones, a second maize growing
season was already present in 1992, and became as important as the first maize growing season in
2010. Also other AEZs followed a simular trend, except for the high tropics were the long season
is very suitable for a continuous long maize growing season. The link between the increased use of
early maturing maize varieties and the increased use of a second maize growing season was clear
with a higher use of early maturing varieties when two seasons were used for maize production.
Theoretically, early maturing maize varieties yield less than late maturing maize varieties. The
use of a second maize growing season increases the yield per year. Yield potentials are measured
by KEPHIS but can differ from the actual yields. Since productivity gains from IMVs depend on
simultaneous use of other inputs, the level of these inputs used by adopters and non-adopters need
to be determined. There is also need to undertake studies on the economics of seed recycling and
intercropping to define whether there is justification for farmers practicing these techniques. Given
the challenges ahead of increased climate disruption (in particular the increased threat of drought),
and continuous increase of food needs by a growing (urban) population, adoption of higher yielding
and more climate-resilient IMVs need to be stimulated.
Companies should include, and better communicate, these maize production strategies in their
breeding program to convince more farmers to switch to IMVs. Whether the government should
intervene by extension, research investments or public support to target the farmers in the low
potential zones is a matter of future research. The most important goal is to achieve and maintain
a stable liberalized market with a good interaction between the public and private sector.
53

REFERENCES
References
Almekinders, C. J. M. and Elings, A. (2001). Collaboration of farmers and breeders: Participatory crop
improvement in perspective. Euphytica, 122(3):425–438.
Badu-Apraku, B. and Akinwale, R. O. (2011). Cultivar evaluation and trait analysis of tropical early
maturing maize under striga-infested and striga-free environments. Field Crops Research,
121(1):186–194.
Berlan, J. (2002). Sciences sous influence : le mais hybride et les mythes du progres technique. Technical
report, PUF.
Brouwer, J., Fussell, L. K., and Herrmann, L. (1993). Soil and crop growth microvariability in the
west-african semiarid tropics - a possible risk-reducing factor for subsistence farmers. Agriculture
Ecosystems and Environment, 45(3-4):229–238.
Byerlee, D. and Eicher, C. K. (1997). Africa’s emerging maize revolution. Lynne Rienner Publishers.
Byerlee, D. and Heisey, P. W. (1996). Past and potential impacts of maize research in sub-saharan africa:
A critical assessment. Food Policy, 21(3):255–277.
Byerlee, D., Spielman, D. J., Alemu, D., and Gautam, M. (2007). Policies to promote cereal intensification
in ethiopia: A review of evidence and experience. ifpri discussion paper 00707. Technical report.
Corbett, J. (1998). Classifying maize production zones in kenya through multivariate cluster analysis. In
Hassan, R., editor, Maize Technology Development and Transfer. A GIS Application for Research
Planning in Kenya, pages 15–25. CAB International, Oxon, UK.
De Groote, H., Kimenju, S. C., and Morawetz, U. B. (2011). Estimating consumer willingness to pay for
food quality with experimental auctions: the case of yellow versus fortified maize meal in kenya.
Agricultural Economics, 42(1):1–16.
De Groote, H., Owuor, G., Doss, C., Ouma, J., Muhammad, L., and Danda, K. (2005a). The maize green
revolution in kenya revisited. electronic Journal of Agricultural and Development Economics (eJADE), 2
(1):32–49.
De Groote, H., Vanlauwe, B., Rutto, E., Odhiambo, G. D., Kanampiu, F., and Khan, Z. R. (2010).
Economic analysis of different options in integrated pest and soil fertility management in maize systems
of western kenya. Agricultural Economics, 41(5):471–482.
De Groote, H., Wangare, L., Kanampiu, F., Odendo, M., Diallo, A., and Friesen, D. (2005b). Potential
markets for herbicide resistant maize seed for Striga control in Africa. Poster paper presented at the
European Association of Agricultural Economists Congress, Copenhagen, Denmark, 23-27 August 2005.
De Groote, H., Wangare, L., Kanampiu, F., Odendo, M., Diallo, A., Karaya, H., and Friesen, D. (2008).
The potential of a herbicide resistant maize technology for striga control in africa. Agricultural Systems,
97(1-2):83–94.
54

REFERENCES
Denning, G., Kabambe, P., Sanchez, P., Malik, A., Flor, R., Harawa, R., Nkhoma, P., Zamba, C., Banda,
C., Magombo, C., Keating, M., Wangila, J., and Sachs, J. (2009). Input subsidies to improve
smallholder maize productivity in malawi: Toward an african green revolution. PLoS Biol, 7(1):e1000023.
Doss, C. R. (2006). Analyzing technology adoption using microstudies: limitations, challenges, and
opportunities for improvement. Agricultural Economics, 34(3):207–219.
Eicher, C. K. (1995). Zimbabwe’s maize-based green revolution: Preconditions for replication. World
Development, 23(5):805–818.
Ellis, F. (2000). Rural livelihoods and diversity in developing countries. Oxford University Press.
Evenson, R. E. and Gollin, D. (2003). Assessing the impact of the green revolution, 1960 to 2000. Science,
300(5620):758–762.
FAO (2011). Fao statistical databases (faostat), agricultural data (http://faostat.fao.org).
Fukunaga, K., Hill, J., Vigouroux, Y., Matsuoka, Y., Sanchez, J., Liu, K. J., Buckler, E. S., and Doebley, J.
(2005). Genetic diversity and population structure of teosinte. Genetics, 169(4):2241–2254.
Gisselquist, D. and Grether, J. (2000). An argument for deregulating the transfer of agricultural
technologies to developing countries. World Bank Economic Review, 14:111–127.
Gisselquist, D., Nash, J., and Pray, C. (2002). Deregulating the transfer of agricultural technology: Lessons
from bangladesh, india, turkey, and zimbabwe. ,. The World Bank Research Observer, 17(2):237–265.
Gujarati, D. N. (2003). Basic econometrics. McGraw Hill, 4th edition.
Hallauer, A. (1987). Macmillan.
Harrison, M. N. (1970). Maize improvement in east africa. In Leakey, C. L. A., editor, Crop improvement in
East Africa, pages 27–36. Commonwealth Agricultural Bureaux.
Hassan, R., Njoroge, K., Otsyula, R., and Laboso, A. (1998). Adoption patterns and performance of
improved maize in kenya. In Hassan, R., editor, Maize Technology Development and Transfer. A GIS
Application for Research Planning in Kenya, pages 107–136. CAB International, Oxon, UK.
Hassan, R. M. (1996). Planting strategies of maize farmers in kenya: A simultaneous equations analysis in
the presence of discrete dependent variables. Agricultural Economics, 15(2):137–149.
Heisey, P. W. and Brennan, J. P. (1991). An analytical model of farmers demand for replacement seed.
American Journal of Agricultural Economics, 73(4):1044–1052.
Howard, J. and Mungoma, C. (1996). Zambia’s Stop-and-go Revolution: The Impact of Policies and
Organizations on the Development and Spread of Maize Technology. Working paper (Michigan State
University. Dept. of Agricultural Economics). Michigan State University, Department of Agricultural
Economics, East Lansing.
55
REFERENCES
Jayne, T. S. and Argwings-Kodhek, G. (1997). Consumer response to maize market liberalization in urban
kenya. Food Policy, 22(5):447–458.
Kloppenburg, J. R. (1990). Heterosis and the social division of labor. In First the Seed: The Political
Economy of Plant Biotechnology, 1492-2000, pages 91–129. Cambridge University Press.
Kutka, F. (2011). Open-pollinated vs. hybrid maize cultivars. Sustainability, 3(9):1531–1554.
Langyintuo, A., Mwangi, W., Diallo, A., MacRobert, J., Dixon, J., and Banziger, M. (2008). An analysis of
the bottlenecks affecting the production and deployment of maize seed in eastern and southern africa.
Technical report, CIMMYT.
Langyintuo, A. S., Mwangi, W., Diallo, A. O., MacRobert, J., Dixon, J., and Banziger, M. (2010).
Challenges of the maize seed industry in eastern and southern africa: A compelling case for
private-public intervention to promote growth. Food Policy, 35:323–331.
Lewa, P. M. and Hubbard, M. (1995). Kenya’s cereal sector reform programme: managing the politics of
reform. Food Policy, 20(6):573–584.
Louette, D., Charrier, A., and Berthaud, J. (1997). In situ conservation of maize in mexico: Genetic
diversity and maize seed management in a traditional community. Economic Botany, 51(1):20–38.
Lutz, C., Kuiper, W. E., and van Tilburg, A. (2007). Maize market liberalisation in benin: A case of
hysteresis. Journal of African Economies, 16(1):102–133.
McCann, J. C. (2005). Africa and the world ecology of maize. In Maize and Grace: Africa’s Encounter with
a New World Crop, 1500-2000, pages 1–22. Harvard University Press, Cambridge.
Miracle, M. P. (1965). The introduction and spread of maize in africa. The Journal of African History,
6(1):39–55.
Morris, M. L. (1998a). Maize seed industries: A conceptual framework. In Morris, M. L., editor, Maize
Seed Industries in Developing Countries, pages 35–54. Lynne Rienner Publishers, Inc., Boulder.
Morris, M. L. (1998b). Overview of the world maize economy. In Morris, M. L., editor, Maize Seed
Industries in Developing Countries, pages 13–34. Lynne Rienner Publishers, Inc., Boulder.
Morris, M. L. and Heisey, P. W. (2003). Estimating the benefits of plant breeding research: methodological
issues and practical challenges. Agricultural Economics, 29(3):241–252.
Mwabu, G., Mwangi, W., and Nyangito, H. (2006). Does adoption of improved maize varieties reduce
poverty? evidence from kenya.
Nyangito, H. O. and Karugia, J. T. (2002). The impact of recent policy changes on the agricultural secort
and public agricultural research in kenya. In Bigman, D., editor, Globalization and the developing
countries: emerging strategies for rural development and poverty alleviation, pages 135–153. CABI
Publishing in association with the International Service for National Agricultural Research.
56
REFERENCES
Omamo, S. W. and Mose, L. O. (2001). Fertilizer trade under market liberalization: preliminary evidence
from kenya. Food Policy, 26(1):1–10.
Onduru, D. D. and Du Preez, C. C. (2007). Ecological and agro-economic study of small farms in
sub-saharan africa. Agronomy for Sustainable Development, 27(3):197–208.
Ongaro, W. A. (1988). Adoption of new farming technology: a case study of maize production in Western
Kenya. Goteborgs universitet.
Pixley, K. (2004). Quality protein maize: Overview and breeding strategies. In Friesen, D. K. and Palmer,
A. F. E., editors, Integrated approaches to higher maize productivity in the new millennium: proceedings
of the Seventh Eastern and Southern Africa Regional Maize Conference, Nairobi, Kenya, 11-15 February
2002. CIMMYT, Mexico, D.F.
Poehlman, J. M. and Sleper, D. A. (2006). Breeding field crops. pages 307–310. Blackwell Pub.
Smale, M. (1995). ”maize is life”: Malawi’s delayed green revolution. World Development, 23(5):819–831.
Smale, M., Byerlee, D., and Jayne, T. (2011). Maize revolutions in sub-saharan africa. (5659).
Smale, M. and Jayne, T. (2003). Maize in eastern and southern africa: ”seeds” of success in retrospect.
eptd discussion paper no. 97. Technical report, IFPRI, Washington, D.C.
Smith, B. (1995). The Emergence of Agriculture. Scientific American Library.
Tripp, R. (2000). Strategies for seed system development in Sub-Saharan Africa: A study of Kenya,
Malawi, Zambia, and Zimbabwe. International Crops Research Institute for the Semi-Arid Tropics
(ICRISAT), Bulawayo, Zimbabwe.
Tripp, R. (2001). Seed Provisions and Agricultural Development, the Institutions of Rural Change.
Overseas Development Institute, London.
Tripp, R. and Louwaars, N. (1997). Seed regulation: choices on the road to reform. Food Policy,
22(5):433–446.
Tripp, R., Louwaars, N., and Eaton, D. (2007). Plant variety protection in developing countries. a report
from the field. Food Policy, 32(3):354–371.
Tripp, R. and Rohrbach, D. (2001). Policies for african seed enterprise development. Food Policy,
26(147-161).
Wangia, C., Wangia, S., and De Groote, H. (2004). Review of maize marketing in kenya: implementation
and impact of liberalisation, 1989-1999. In Friesen, D. and Palmer, A. F. E., editors, Integrated
Approaches to Higher Maize Productivity in the New Millenium. Proceedings of the 7th Eastern and
Southern Africa Regional Maize Conference, Nairobi, Kenya, 11 - 15 February 2002., pages 12–21.
CIMMYT, Mexico, D. F.
Zerbe, N. (2001). Seeds of hope, seeds of despair: towards a political economy of the seed industry in
southern africa. Third World Quarterly, 22(4):657–673.
57


A INTERVIEWEES
Appendices
A Interviewees
Table 26: Interviewees seed companies
DATE COMPANY PLACE INTERVIEWEE
July 25, 2011 Kenya Seed Company Kitale Manager Mr. Francis M. Ndambuki
Western Seed Company Kitale CEO & breeder Mr. Saleem Esmail
Commercial director Mr. Syed O. Bokhari
July 27, 2011 KARI Kitale Kitale Director Dr. Omari M. Odongo
July 28, 2011 Lagrotech Kisumu Director Dr. Moses Onim
August 2, 2011 SeedCo Nairobi Director Mr. Kassim Owino
Monsanto Nairobi Director Mr. Kinyua Mbijjewe
August 9, 2011 Pioneer Nairobi Director Mr. James Mburu
KEPHIS Nairobi Mr. James Muthee
i
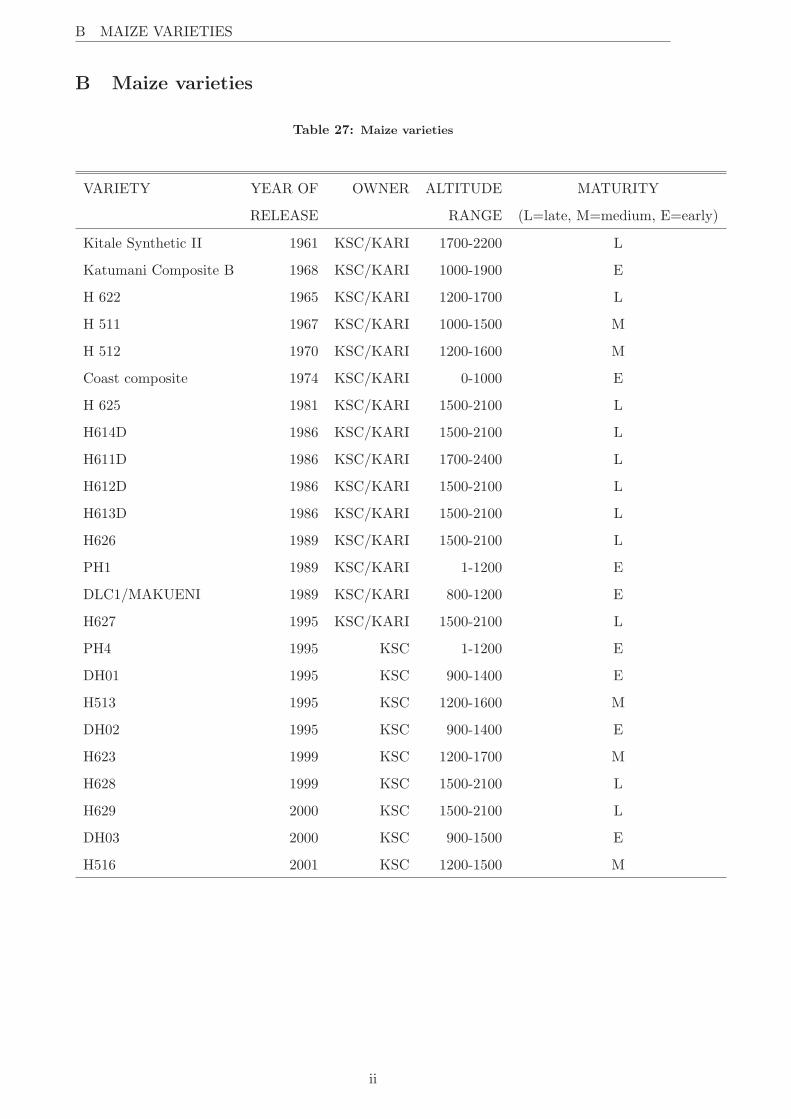
B MAIZE VARIETIES
B Maize varieties
Table 27: Maize varieties
VARIETY YEAR OF OWNER ALTITUDE MATURITY
RELEASE RANGE (L=late, M=medium, E=early)
Kitale Synthetic II 1961 KSC/KARI 1700-2200 L
Katumani Composite B 1968 KSC/KARI 1000-1900 E
H 622 1965 KSC/KARI 1200-1700 L
H 511 1967 KSC/KARI 1000-1500 M
H 512 1970 KSC/KARI 1200-1600 M
Coast composite 1974 KSC/KARI 0-1000 E
H 625 1981 KSC/KARI 1500-2100 L
H614D 1986 KSC/KARI 1500-2100 L
H611D 1986 KSC/KARI 1700-2400 L
H612D 1986 KSC/KARI 1500-2100 L
H613D 1986 KSC/KARI 1500-2100 L
H626 1989 KSC/KARI 1500-2100 L
PH1 1989 KSC/KARI 1-1200 E
DLC1/MAKUENI 1989 KSC/KARI 800-1200 E
H627 1995 KSC/KARI 1500-2100 L
PH4 1995 KSC 1-1200 E
DH01 1995 KSC 900-1400 E
H513 1995 KSC 1200-1600 M
DH02 1995 KSC 900-1400 E
H623 1999 KSC 1200-1700 M
H628 1999 KSC 1500-2100 L
H629 2000 KSC 1500-2100 L
DH03 2000 KSC 900-1500 E
H516 2001 KSC 1200-1500 M
ii
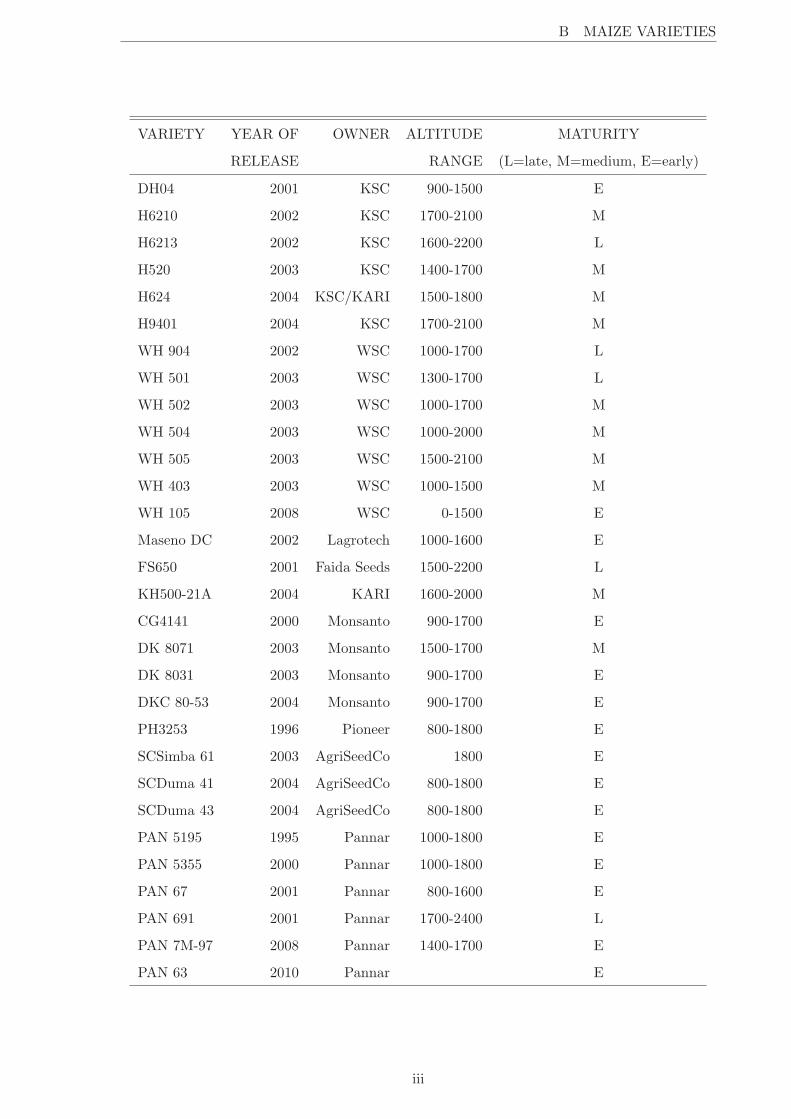
B MAIZE VARIETIES
VARIETY YEAR OF OWNER ALTITUDE MATURITY
RELEASE RANGE (L=late, M=medium, E=early)
DH04 2001 KSC 900-1500 E
H6210 2002 KSC 1700-2100 M
H6213 2002 KSC 1600-2200 L
H520 2003 KSC 1400-1700 M
H624 2004 KSC/KARI 1500-1800 M
H9401 2004 KSC 1700-2100 M
WH 904 2002 WSC 1000-1700 L
WH 501 2003 WSC 1300-1700 L
WH 502 2003 WSC 1000-1700 M
WH 504 2003 WSC 1000-2000 M
WH 505 2003 WSC 1500-2100 M
WH 403 2003 WSC 1000-1500 M
WH 105 2008 WSC 0-1500 E
Maseno DC 2002 Lagrotech 1000-1600 E
FS650 2001 Faida Seeds 1500-2200 L
KH500-21A 2004 KARI 1600-2000 M
CG4141 2000 Monsanto 900-1700 E
DK 8071 2003 Monsanto 1500-1700 M
DK 8031 2003 Monsanto 900-1700 E
DKC 80-53 2004 Monsanto 900-1700 E
PH3253 1996 Pioneer 800-1800 E
SCSimba 61 2003 AgriSeedCo 1800 E
SCDuma 41 2004 AgriSeedCo 800-1800 E
SCDuma 43 2004 AgriSeedCo 800-1800 E
PAN 5195 1995 Pannar 1000-1800 E
PAN 5355 2000 Pannar 1000-1800 E
PAN 67 2001 Pannar 800-1600 E
PAN 691 2001 Pannar 1700-2400 L
PAN 7M-97 2008 Pannar 1400-1700 E
PAN 63 2010 Pannar E
iii