EECS 470 Power and ArchitecturePower and...
62
EECS 470 Power and Architecture Power and Architecture on Slides taken from Prof. David Brooks, Harvard University (2004), Modified by Mark Brehob & Thomas Wenisch. Introductio Thanks to Prof. Brooks for kindly sending his slides! I
Transcript of EECS 470 Power and ArchitecturePower and...

EECS 470Power and ArchitecturePower and Architecture
on
Slides taken from Prof. David Brooks, Harvard University (2004), Modified by Mark Brehob & Thomas Wenisch.
Intr
oduc
tio
Thanks to Prof. Brooks for kindly sending his slides!
I

Announcements
• HW 6 Posted, due 12/7
• Project due 12/10j• In-class presentations (~8 minutes + questions)
2

Outline• Why is power a problem?• What uses power in a chip?• What uses power in a chip?• How can we reduce power?
onIn
trod
uctio
I
3
Outline• Why is power a problem?• What uses power in a chip?• What uses power in a chip?• Relationship between power and
fon performance.• How can we reduce power?In
trod
uctio
pI
4

Why is power a problem in a μP?• Power used by the μP, vs. system power• Dissipating Heat
• Melting (very bad)• Packaging (to cool $)
on • Heat leads to poorer performance.• Providing Power
B ttIntr
oduc
tio
• Battery• Cost of electricity
I
5
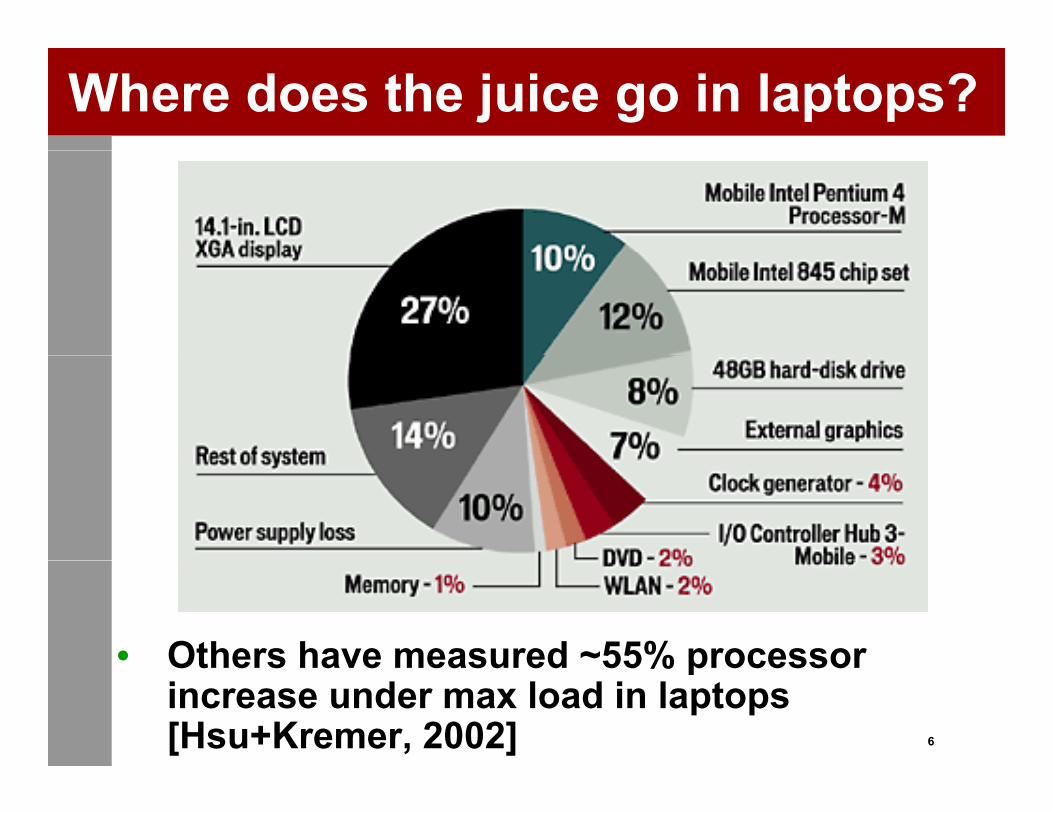
Where does the juice go in laptops?
• Others have measured ~55% processor
6
Others have measured 55% processor increase under max load in laptops [Hsu+Kremer, 2002]

Why worry about power dissipation?
Batteryblem
?
Thermal issues: affect
Batterylife
wer
a p
rob
Thermal issues: affect cooling, packaging, reliability, timing
Why
is p
ow
Environment
W
7

Total Power Dissipation Trends
1000
2 )
100
(W/c
m Nuclear Reactor
Pentium 4 (Prescott)blem
?
10ensi
ty (
Hot Plate
Pentium 2
Pentium 3
( )Pentium 4
wer
a p
rob
10
ower
D
486Pentium
Pentium Pro
Why
is p
ow
11980 1990 2000 2010
P 386486W
8

Spot Heat Issues in Microprocessorsbl
em?
wer
a p
rob
Why
is p
owW
9

Packaging costFrom Cray (local power generator and refrigeration)…
blem
?w
er a
pro
bW
hy is
pow
W
10Source: Gordon Bell, “A Seymour Cray perspective”http://www.research.microsoft.com/users/gbell/craytalk/

Packaging costT t dTo today…• IBM S/390: refrigeration:
• Provides performance (2% perf for 10ºC) andProvides performance (2% perf for 10 C) and reliability
blem
?w
er a
pro
bW
hy is
pow
W
11Source: R. R. Schmidt, B. D. Notohardjono “High-end server low temperature cooling”IBM Journal of R&D

Intel Itanium packaging
Complex and expensive (note heatpipe)
blem
?w
er a
pro
bW
hy is
pow
W
12
Source: H. Xie et al. “Packaging the Itanium Microprocessor”Electronic Components and Technology Conference 2002

P4 packaging
• Simpler, but still…40
30
-Rel
ated
Cos
t ($
)
blem
?
10
20
otal
Pow
erP
C S
yste
m
wer
a p
rob
00 10 20 30 40
To P
Why
is p
ow
Source: Intel web site
Power (Watts)
From Tiwari, et al., DAC98
W
13
Source: Intel web site


Cooking Aware Computingbl
em?
wer
a p
rob
Why
is p
owW
15

The Battery Gap
Diverging Gap Between Actual Battery Capacities and Energy Needs
500010kbps 64kbps 384kbps 2Mbps
Mobile video-Interactiveblem
?
3000
4000
Batterycapacity
Video email,Voice recognition,Mobile commerce
Conferencing,Collaboration
Downlink
Interactive
mA
h)
wer
a p
rob
2000
capacity(mAh)
Energyrequirement(mAh)
PIM, SMS,Voice
Mobile commerceDownlink dominated Fuel Cells
Web browser,MMS, Video clipsEn
ergy
(m
Why
is p
ow
0
1000( )
Lithium Ion
Lithium Polymer
E
Source:Anand
W
16
02000 2001 2002 2003 2004 2005 2006 2007 Raghunathan,
NEC Labs

Power-Aware Computing Applicationsst
rain
ed-d
t-Con
sat
ure/
di-
Tem
pera
17
Energy-Constrained Computing

Server Farms• Internet data centers are like heavy-duty
factories• e g small Datacenter 25 000 sq feet 8000• e.g. small Datacenter 25,000 sq.feet, 8000
servers, 2MegaWatts• Intergate Datacenter, Tukwila, WA: 1.5 Mill. Sq.Ft,
blem
?
~500 MW• Wants lowest net cost per server per sq foot of
data center spacewer
a p
rob
data center space• Cost driven by:
• Racking heightWhy
is p
ow
ac g e g t• Cooling air flow• Power delivery
W
18
• Maintenance ease (access, weight)• 25% of total cost due to power

Environment• Environment Protection Agency (EPA): computers
consume 10% of commercial electricity consumptionp
• This incl. peripherals, possibly also manufacturing• A DOE report suggested this percentage is much lower
(3.0-3.5%)blem
?
(3.0 3.5%)• No consensus, but it’s still a lot• Interesting to look at the numbers:
htt // d lbl / j t /i f t h ht lwer
a p
rob
– http://enduse.lbl.gov/projects/infotech.html• Data center growth was cited as a contribution to the
2000/2001 California Energy CrisisWhy
is p
ow
• Equivalent power (with only 30% efficiency) for AC• CFCs used for refrigeration
W
19
• Lap burn• Fan noise

Power-Aware Needed across all computing platforms
• Mobile/portable (cell phones, laptops, PDA)• Battery life is critical
• Desktops/Set-Top (PCs and game machines)
P k i t i iti lblem
?
• Packaging cost is critical• Servers (Mainframes and compute-farms)
Packaging limitswer
a p
rob
• Packaging limits• Volumetric (performance density)
Why
is p
owW
20

Outline• Why is power a problem?• What uses power in a chip?• What uses power in a chip?• Relationship between power and
fperformance.• How can we reduce power?p
In order to tackle this one, we need to learn a bit about circuits, power, and energy.
21

How CMOS Transistors Worka
chip
?po
wer
in a
Wha
t use
s W
22

MOS Transistors are Switchesa
chip
?po
wer
in a
Wha
t use
s W
23

Static CMOSa
chip
?po
wer
in a
Wha
t use
s W
24

Basic Logic Gatesa
chip
?po
wer
in a
Wha
t use
s W
25

CMOS Water Analogy
Electron: water moleculeCharge: weight of waterVoltage: heighta
chip
?
g gCurrent: flow rateCapacitance: container cross-sectionpo
wer
in a
p
(Think of power-plants that store energy inWha
t use
s
(Think of power plants that store energy in water towers)
W
26

Liquid Inverter• Capacitance at input
• Gates of NMOS, PMOSMetal interconnect• Metal interconnect
• Capacitance at output• Fanout (# connections) to a
chip
?
( )other gates
• “Diffusion” capacitance of tx• Metal Interconnectpo
wer
in a
NMOS conducts when water level is above switchingW
hat u
ses
level is above switching threshold
PMOS conducts below
W
27
No conduction after container full

Inverter Signal Propagation (1)a
chip
?po
wer
in a
Wha
t use
s W
28

Inverter Signal Propagation (2)a
chip
?po
wer
in a
Wha
t use
s W
29

Delay and Energy Definitions• Propagation Delay
• Time to fill output container to 50%• Time to charge output capacitor to 50%
• Switching Energy
a ch
ip?
• Weight * height of water moved• Charge * voltage of charge transferred
pow
er in
aW
hat u
ses
W
30

Delay and Power Observations• Load capacitance increases delay
• High fanout (gates attached to output)• Interconnection
• Higher current can increase speed
a ch
ip?
• Increasing transistor width raises currents but also raises capacitance
• Energy per switching event independent ofpow
er in
a
• Energy per switching event independent of current
• Depends on amount of charge moved, not rateWha
t use
s
gW
31

Feedback-based Latcha
chip
?po
wer
in a
• Pros:• Holds data as long as power applied
( f )Wha
t use
s
• Actively drives output: (can be fast)• Con: Fairly big (5 transistors)
C b d f l h SRAM ll
W
32
• Can be used for latches or SRAM cells
Charge-based Latcha
chip
?po
wer
in a
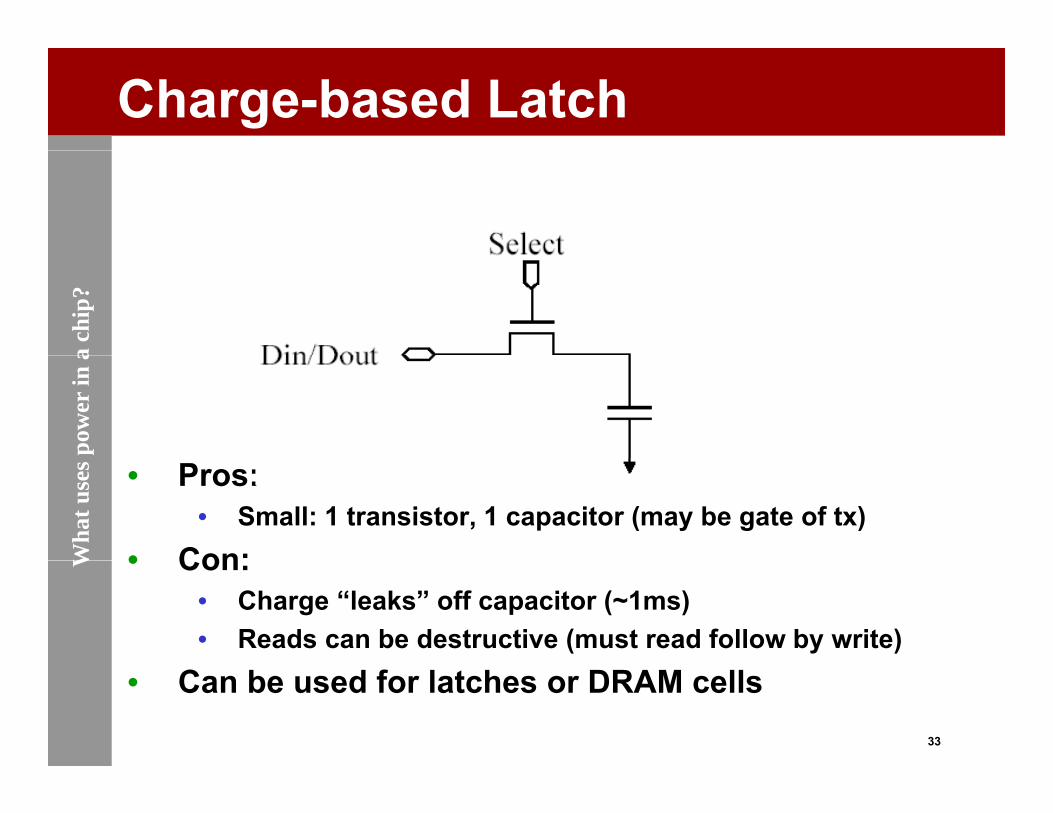
• Pros:• Small: 1 transistor, 1 capacitor (may be gate of tx)
• Con:Wha
t use
s
• Con:• Charge “leaks” off capacitor (~1ms)• Reads can be destructive (must read follow by write)
W
33
• Can be used for latches or DRAM cells

Power: The Basics• Dynamic power vs. Static power
• Dynamic: “switching” powerSt ti “l k ”• Static: “leakage” power
• Dynamic power dominates, but static power increasing in importance
a ch
ip?
• Trends in each• Static power: steady, per-cycle energy cost• Dynamic power: capacitive and short-circuitpo
wer
in a
• Dynamic power: capacitive and short-circuit• Capacitive power: charging/discharging at
transitions from 0 1 and 1 0
Wha
t use
s
• Short-circuit power: power due to brief short-circuit current during transitions.
• Most research focuses on capacitive but recent
W
34
• Most research focuses on capacitive, but recent work on others

Dynamic (Capacitive) Power Dissipation
I
VOUT
I
VIN
a ch
ip?
CL
pow
er in
a
• Data dependent – a function of switchingti itW
hat u
ses
activityW
35

Capacitive Power dissipation
Capacitance:Function of wire length transistor size
Supply Voltage:Has been dropping with successive faba
chip
?
P ½ CV2Af
length, transistor size with successive fab generations
pow
er in
a
Power ~ ½ CV2AfClock frequency:W
hat u
ses
Clock frequency:Increasing…Activity factor:
How often, on average, d i i h?
W
36
do wires switch?

Lowering Dynamic Power• Reducing Vdd has a quadratic effect
• Has a negative (~linear) effect on performance howeverhowever
• Lowering CL• May improve performance as wella
chip
?
• May improve performance as well• Keep transistors small (keeps intrinsic
capacitance (gate and diffusion) small)pow
er in
a
• Reduce switching activity• A function of signal transition stats and clock
tWha
t use
s
rate• Clock Gating idle units• Impacted by logic and architecture decisions
W
37
• Impacted by logic and architecture decisions

Short-Circuit Power Dissipation
ISC
VOUT
ISC
VIN
a ch
ip?
CL
pow
er in
a
• Short-Circuit Current caused by finite-slope Wha
t use
s
y pinput signals
• Direct Current Path between VDD and GND when both NMOS and PMOS transistors are
W
38
when both NMOS and PMOS transistors are conducting

Short-Circuit Power Dissipation
PowerSC ~ tscVIpeak
• Power determined by• Duration and slope of input signal, tsca
chip
?
• Ipeak determined by transistor sizes, process technology, CL
Sh t i it b i i i dpow
er in
a
• Short circuit power can be minimized• Try to match rise/fall times of input and output
signalsWha
t use
s
signals• Have not seen many architectural solutions here• Good news: relatively, PowerSC is shrinking
W
39

Leakage Currents
Vq T⋅−
I t
VOUT
CLISub
VIN TkaDSub aekI ⋅⋅⋅=
a ch
ip?
• Subthreshold currents grow exponentially with increases in t t d i th h ld lt
Igate
pow
er in
a
temperature, decreases in threshold voltage• But threshold voltage scaling is key to circuit performance!
• Gate leakage primarily dependent on gate oxide thickness, biasesW
hat u
ses
biases• Both type of leakage heavily dependent on stacking and input
pattern• More on leakage later in the semester
W
40
More on leakage later in the semester

Gate vs. Subthreshold Leakage TrendsTrends
a ch
ip?
pow
er in
aW
hat u
ses
W
41From Mukhopadhyay, et al. TVLSI ‘03

Lowering Static Power• Design-time Decisions
• Use fewer, smaller transistors -- stack when possible to minimize contacts with Vdd/Gndpossible to minimize contacts with Vdd/Gnd
• Multithreshold process technology (multiple oxides too!)
a ch
ip?
– Use “high-Vt” slow transistors whenever possible
Dynamic Techniquespow
er in
a
• Dynamic Techniques• Reverse-Body Bias (dynamically adjust threshold)
– Low-leakage sleep mode (maintain state) e gWha
t use
s
– Low-leakage sleep mode (maintain state), e.g. XScale
• Vdd-gating (Cut voltage/gnd connection to circuits)
W
42
– Zero-leakage sleep mode– Lose state, overheads to enable/disable

What do we mean by Power?a
chip
?po
wer
in a
• Max Power: Artificial code generating max CPU activity
Wha
t use
s
• Worst-case App Trace: Practical applications worst-case• Thermal Power: Running average of worst-case app power over a
time period corresponding to thermal time constant
W
43
• Average Power: Long-term average of typical apps (minutes)• Transient Power: Variability in power consumption for supply net

Power vs. Energy• Power consumption in Watts
• Determines battery life in hours• Sets packaging limits
• Energy efficiency in joules
a ch
ip?
• Rate at which energy is consumed over time• Energy = power * delay (joules = watts *
seconds)pow
er in
a
seconds)• Lower energy number means less power to
perform a computation at same frequency
Wha
t use
s W
44

Power vs. Energya
chip
?po
wer
in a
Wha
t use
s W
45

Power vs. Energy• Power-delay Product (PDP) = Pavg * t
• PDP is the average energy consumed per it hi tswitching event
• Energy-delay Product (EDP) = PDP * t• Takes into account that one can tradea
chip
?
• Takes into account that one can trade increased delay for lower energy/operation
• Energy-delay2 Product (EDDP) = EDP * tpow
er in
a
gy y ( )• Why do we need so many formulas?!!?• We want a voltage-invariant efficiency
Wha
t use
s
metric! Why?• Power ~ ½ CV2Af, Performance ~ f (and V)
W
46

E vs. EDP vs. ED2P• Power ~ CV2f ~ V3 (fixed microarch/design)• Performance ~ f ~ V (fixed
microarch/design)• (For the nominal voltage range, f varies
appro linearl ith V)a ch
ip?
approx. linearly with V)
C i th t l
pow
er in
a
• Comparing processors that can only use freq/voltage scaling as the primary method of power control:W
hat u
ses
of power control:• (perf)3 / power, or MIPS3 / W or SPEC3 /W is a
fair metric to compare energy efficiencies.
W
47
• This is an ED2 P metric. We could also use: (CPI)3 * W for a given application

E vs. EDP vs. ED2P• Currently have a processor design:
• 80W, 1 BIPS, 1.5V, 1GHz• Want to reduce power, willing to lose some
performance• Cache Optimization:a
chip
?
• Cache Optimization:– IPC decreases by 10%, reduces power by
20% => Final Processor: 900 MIPS, 64Wpow
er in
a
–Relative E = MIPS/W (higher is better) = 14/12.5 = 1.125x
• Energy is better but is this a “better”Wha
t use
s
• Energy is better, but is this a better processor?
W
48

Not necessarily• 80W, 1 BIPS, 1.5V, 1GHz
• Cache Optimization:– IPC decreases by 10% reduces power by 20% =>– IPC decreases by 10%, reduces power by 20% =>
Final Processor: 900 MIPS, 64W– Relative E = MIPS/W (higher is better) = 14/12.5 =
1.125xa ch
ip?
1.125x– Relative EDP = MIPS2/W = 1.01x– Relative ED2P = MIPS3/W = .911x
Wh t if j t dj t f / ltpow
er in
a
• What if we just adjust frequency/voltage on processor?
• How to reduce power by 20%?Wha
t use
s
• P = CV2F = CV3 => Drop voltage by 7% (and also Freq) => .93*.93*.93 = .8x
• So for equal power (64W)
W
49
– Cache Optimization = 900MIPS– Simple Voltage/Frequency Scaling = 930MIPS

Power vs. SPECint2K Performance
140 AMD Athlon
Performance
100
120
(W)
oAMD OpteronPentium 3Pentium 4Apple PowerPCa
chip
?
60
80
100
Dis
sipa
tion
ppItaniumIBM PowerPCUltraSPARC III
pow
er in
a
20
40
60
Pow
er
Wha
t use
s
0
20
0500100015002000
W
50
SPECINT2000

Analysis Abstraction Levels
Abstraction Analysis Analysis Analysis Analysis EnergyLevel Capacity Accuracy Speed Resources Savings
Most Worst Fastest Least MostMost Worst Fastest Least MostApplicationBehavioralArchitectural (RTL)Logic (Gate)T i t (Ci it)Transistor (Circuit)
Least Best Slowest Most Least
51

Modeling Hierarchy and Tool Flow
set of workloadsEnergy Models PerformanceTest Cases
Early analytical performance modelsTrace/exec-driven, cycle-accurate simulation models
microarchlevel
Test Cases
edit/debug
refineMicroarchparms/specs
RTL MODEL (VHDL) RTLRTL
Sim Test Cases(Architectural)
edit/debug
refine,update
RTL MODEL (VHDL)sim
gate-level model (if synthesized)
level
gate-levelBitvectortest cases
Circuit-level (hierarchical) netlist model ckt-level cktextract
test cases
edit/tune/debug
Design rules
sim,
52
Layout-level physical design modellayout-levelCapextract,sim
Design rules
design rulecheck,validate

Power/Performance abstractions• Low-level:
• Hspice• PowerMill• PowerMill
• Medium-Level: • RTL Models
• Architecture-level:• PennState SimplePower• Intel Tempest• Intel Tempest• Princeton Wattch• IBM PowerTimer• Umich/Colorado PowerAnalyzer
53

Low-level models: Hspice• Extracted netlists from circuit/layout
descriptionsDiff i t d i i it i• Diffusion, gate, and wiring capacitance is modeled
• Analog simulation performedAnalog simulation performed• Detailed device models used• Large systems of equations are solvedg y q• Can estimate dynamic and leakage power
dissipation within a few percentSl l ti l f 10 100K t i t• Slow, only practical for 10-100K transistors
• PowerMill (Synopsys) is similar but about 10x faster
54
10x faster
Medium-level models: RTL• Logic simulation obtains switching events
for every signalSt t l VHDL il ith it• Structural VHDL or verilog with zero or unit-delay timing models
• Capacitance estimates performed• Capacitance estimates performed• Device Capacitance
–Gate sizing estimates performed similar toGate sizing estimates performed, similar to synthesis
• Wiring Capacitance–Wire load estimates performed, similar to
placement and routing• Switching event and capacitance estimates
55
• Switching event and capacitance estimates provide dynamic power estimates

Architecture level models• Two major classes:
• Cycle/Event-Based: Arch. Level power models interfaced with cycle-driven performance simulationy p
• Instruction-Based: Measurement/Characterization based on instruction usage and interactions
• Components of Arch Level power modelComponents of Arch. Level power model• Could be based on ckt schematic
measurements/extrapolationOrOr…• Capacitance modelsBoth may need to consider…• Circuit design styles• Clock gating styles & Unit usage statistics• Signal transition statistics
56
g

Architecture level modelsPower ~ ½ CV2Af
• Analytical Approach: • Estimate “CV2f” via analytical models
T l W tt h P A l T t ( i d• Tools: Wattch, PowerAnalyzer, Tempest (mixed-mode)
• Empirical ApproachEmpirical Approach• Estimate “CV2f” via empirical measurements• Tools: PowerTimer, AccuPower, Internal Industrial , ,
Tools
E ti t “A” i t ti ti f hit t l57
• Estimate “A” via statistics from architectural-performance simulators

Analytical Modeling Tools:Modeling CapacitanceModeling Capacitance• Requires modeling wire length and
estimating transistor sizes• Related to RC Delay analysis for speed
along critical pathBut capacitance estimates require summing up• But capacitance estimates require summing up all wire lengths, rather than only an accurate estimate of the longest one.
58

Register File: Capacitance AnalysisAnalysis
Pre-ChargeBit
Cell Access Transistors (N1)
BitD
ecod
ers
Wordlines Cell
D (Number of Entries)
S A Number of Number of
Bitlines(Data Width of Entries)
Sense Amps Number of Ports
Number of Ports
metal
gatecapNrdlineDrivediffcapWorwordline
CngthWordlineleCinesNumberBitlCC
** 1++=
59metal
diffcapNgdiffcapPchbitline
CgthBitlinelenClinesNumberWordCC
** 1
++=

Register File Model: ValidationE rror R ates G ate D iff In terC onn. Tota l W ordline(r) 1 .11 0 .79 15 .06 8 .02 W ordline(w ) -6 .37 0 .79 -10.68 -7 .99( )B itline(r) 2 .82 -10 .58 -19 .59 -10 .91 B itline(w ) -10 .96 -10 .60 7 .98 -5 .96 (N b i P t)• Validated against a register file schematic
used in Intel’s Merced design
(Numbers in Percent)
• Compared capacitance values with estimates from a layout-level Intel tool
• Interconnect capacitance had largest errors
Model currently neglects poly connections
60
• Model currently neglects poly connections• Differences in wire lengths -- difficult to tell
wire distances of schematic nodes

Architecture level models:Signal Transition Statistics• Dynamic power is proportional to switching• How to collect signal transition statistics in
architectural-level simulation?• Many signals are available, but do we want to
use all of them?use all of them?• One solution (register file):
–Collect statistics on the important ones p(bitlines)
– Infer where possible (wordlines)A i b biliti f l i t t–Assign probabilities for less important ones (decoders)
61

Architecture level models:Clock Gating: What, why, when?
Clock Gated Clock
• Dynamic Power is dissipated on clockGate
Dynamic Power is dissipated on clock transitions
• Gating off clock lines when they are g yunneeded reduces activity factor
• But putting extra gate delays into clock lines increases clock skew
• End results:
62
• Clock gating complicates design analysis but saves power.


![EECS 470 Lecture 20 Binary Translationweb.eecs.umich.edu/~twenisch/470_F07/lectures/20.pdfst ata, [%y] ldp%r31 [%x] …. ld %r31, [%x] aliasing, …. stam%data, [%y] use %r31 ….](https://static.fdocuments.us/doc/165x107/603c448500631f53dc1365ff/eecs-470-lecture-20-binary-twenisch470f07lectures20pdf-st-ata-y-ldpr31.jpg)