EEA Survey on Research Funding in Economics in … Survey on Research Funding in Economics in Europe...
49
EEA Survey on Research Funding in Economics in Europe: Preliminary Results Ramon Marimon, European University Institute & UPF‐BarcelonaGSE Igor Guardiancich, Mike Mariathasan and Eva Rossi, European University Institute 25 th Meeting of the European Economic Association Glasgow, August 26 th 2010
Transcript of EEA Survey on Research Funding in Economics in … Survey on Research Funding in Economics in Europe...

EEASurveyonResearchFundinginEconomicsinEurope:PreliminaryResults
RamonMarimon,EuropeanUniversityInstitute&UPF‐BarcelonaGSE
IgorGuardiancich,MikeMariathasanandEvaRossi,EuropeanUniversityInstitute
25thMeetingoftheEuropeanEconomicAssociation
Glasgow,August26th2010

Theinitiative
EuropeanEconomicAssociationStandingCommitteesonResearch
&AcademicCareersObservatory,MaxWeberProgramme(EUI)

Thesample
Theunionoftwosamples(May2009):1. RePEcEuropeaneconomists:top12.5%union
top25%ofeveryEuropeancountry.2. EEAmembers.
Totalnumberofeconomistsinvited: 5416Totalnumberofvalidresponses: 2385Websupport:LimeServicePeriod:June21sttoJuly15th,2010

Theresponserates
Response rates
48.5%
39.4%
53.4%
44.0%
0 1000 2000 3000 4000 5000 6000
EEA
REPEC
REPEC-EEA
Total
0.0% 10.0% 20.0% 30.0% 40.0% 50.0% 60.0%
Total Valid responses
Valid responses 902 1172 311 2385
Total 1861 2973 582 5416
Percentage 48.5% 39.4% 53.4% 44.0%
EEA REPEC REPEC-EEA Total

TherespondentsResidents
Applicants
GE 414 17.4 410 17.2
IT 336 14.1 314 13.2
UK 327 13.7 317 13.2
FR 238 10.0 247 10.4
SP 228 9.6 221 9.3
Other Cont. 224 9.4 242 10.1
Other An-Sa 218 9.1 221 9.3
Scandinavia 176 7.4 186 7.8
CEE 137 5.7 134 5.6
Other 47 2.0 55 2.3
TK 40 1.7 38 1.6
Total 2385 100.0 2385 100.0

Thegroupingofcountries

Theexperience

Theprofessionalpro[ile
byageandgender
Age profile of respondents
28.8
32.6
40.4
36.0
36.0
42.1
43.6
50.2
41.8
0.0 10.0 20.0 30.0 40.0 50.0 60.0
PhD
Post-doc
Researcher
AssProf
TenAssProf
AscProf
TenAscProf
Full Prof
Total
Gender profile of respondents
40.1%
36.1%
23.0%
27.4%
26.3%
22.9%
30.1%
13.5%
23.6%
59.9%
63.9%
77.0%
72.6%
73.7%
77.1%
69.9%
86.5%
76.4%
0% 10% 20% 30% 40% 50% 60% 70% 80% 90% 100%
PhD
Post-doc
Researcher
AssProf
TenAssProf
AscProf
TenAscProf
Full Prof
Total
Women Men

Theprofessionalpro[ilebyyearsfromPhD
Years from PhD graduation
0% 20% 40% 60% 80% 100%
PhD
Post-doc
Researcher
AssProf
TenAssProf
AscProf
TenAscProf
Full Prof
Total
Unfinished/not relevant <5 5-9 10-20 >20

Theagedistribution
0.0%
5.0%
10.0%
15.0%
20.0%
25.0%
30.0%
35.0%
40.0%
22-30 31-37 38-44 45-51 52-58 59-65 >65
Age class
CEE FR GE IT Other Anglo-Sax
Other Continent Scandinavian SP TK UK

Thejobenvironment
Occupational profile
0%
10%
20%
30%
40%
50%
60%
70%
80%
90%
100%
CEE
Fran
ce
German
yItaly
Anglo-
Saxo
n
Cont
inen
tal
Scan
dina
vian
Spain
Turkey U
K
Total
University Research Institute Central Bank Government International Organization Private Sector EU Other
Research environment
0%
10%
20%
30%
40%
50%
60%
70%
80%
90%
100%
CEE
Turkey
Italy
Cont
inen
tal
Fran
ce
German
y
Spain
Scan
dina
vian
Anglo-
Saxo
n UK
Total
Integrated research Single effort Some individual research Sporadic

TheresearchenvironmentbypositionandtimefromPhD
Research environment on graduation year
0% 10% 20% 30% 40% 50% 60% 70% 80% 90% 100%
Unfinished
<5
5-9
10-20
>20
Total
Integrated research Single effort Some individual research Sporadic
Research environment on position
0% 10% 20% 30% 40% 50% 60% 70% 80% 90% 100%
AssProf
TenAscProf
AscProf
TenAssProf
Researcher
PhD
Full Prof
Post-doc
Total
Integrated research Single effort Some individual research Sporadic

Theworkingtime
Distribution of working time
0% 20% 40% 60% 80% 100%
PhD
Post-doc
Researcher
AssProf
TenAssProf
AscProf
TenAscProf
Full Prof
Total
Research Act Teaching/Advising Admin Tasks Fund-raising Consulting Act Residual

Theworkingtimebygenderandage
Working time and age profile
0% 20% 40% 60% 80% 100%
22-30
31-37
38-44
45-51
52-58
59-65
>65
Total
Research Act Teaching/Advising Admin Tasks Fund-raising Consulting Act Residual
Working time and gender
0% 10% 20% 30% 40% 50% 60% 70% 80% 90% 100%
Women
Men
Total
Research Act Teaching/Advising Admin Tasks Fund-raising Consulting Act Residual

Thefundingsources
Sources of budget funding by country of residence
0.0 10.0 20.0 30.0 40.0 50.0 60.0 70.0 80.0 90.0 100.0
Anglo-Saxon
Germany
Scandinavian
France
UK
Total
Italy
CEE
Continental
Turkey
Spain
OwnInst NatPublic NatPrivate RegPublic RegPrivate ERC FP Prizes Consultancy

Thefunding[lowsApplication inflows (>1% of total who applied at least once) N=784
.0%
.0%
.0%
6.4%
9.1%
9.1%
12.0%
13.0%
16.7%
16.7%
18.2%
18.6%
26.5%
26.7%
28.2%
48.0%
56.0%
69.2%
.0% 10.0% 20.0% 30.0% 40.0% 50.0% 60.0% 70.0% 80.0%
IE
TK
RO
IT
GR
PT
SP
GE
DK
SW
FI
UK
NL
CH
FR
BE
AT
US
% of applicants who work in a different country
Application outflows (>1% of people who applied at least once) N=784
.0%
9.1%
9.1%
10.0%
12.5%
13.0%
14.7%
16.7%
17.6%
19.4%
20.6%
21.4%
21.4%
22.1%
23.3%
43.5%
50.0%
69.2%
.0% 10.0% 20.0% 30.0% 40.0% 50.0% 60.0% 70.0% 80.0%
DK
GR
SW
FI
TK
PT
GE
RO
FR
NL
SP
CH
AT
IT
UK
BE
IE
US
% of resident applicants who apply to a different country
Funding outflows (>1% of those whose budget source is national funding) N=669
.0%
7.0%
11.1%
12.0%
12.5%
14.3%
14.3%
17.4%
17.6%
20.0%
23.1%
25.0%
30.3%
30.8%
46.2%
54.5%
62.5%
.0% 10.0% 20.0% 30.0% 40.0% 50.0% 60.0% 70.0%
RO
IT
SP
GE
GR
DK
PT
SW
UK
FI
CH
IE
FR
NL
BE
AT
US
% of funded applicants who work in a different country
Funding inflows (>1% of those whose budget source is national funding) N=669
.0%
9.5%
10.0%
11.1%
12.5%
15.1%
19.2%
19.3%
21.6%
23.1%
23.5%
25.0%
27.8%
28.6%
33.3%
57.1%
60.0%
.0% 10.0% 20.0% 30.0% 40.0% 50.0% 60.0% 70.0%
DK
SW
PT
FI
GR
GE
SP
FR
IT
CH
RO
NL
UK
AT
BE
IE
US
% of funded resident applicants who get funds from a different country

The reportedfundingsizedistributions
Annual Budget: National Public
0
5
10
15
20
25
30
35
4,00
12,00
30,00
70,00
200,00
800,00
2000,00
3500,00
4500,00
5500,00
7500,00
9000,00
12350,00
15000,00
19000,00
25000,00
40000,00
60000,00
80000,00
100000,00
140000,00
200000,00
1000000,00
4000000,00
Annual Budget FP (not ERC)
0
2
4
6
8
10
12
10,00
30,00
100,00
500,00
2000,00
3000,00
5000,00
7000,00
10000,00
15000,00
24000,00
28000,00
34500,00
40000,00
51000,00
70000,00
85000,00
120000,00
200000,00
375000,00
800000,00
Annual Budget ERC
0
1
2
3
4
5
10,00
150,00
800,00
2500,00
5000,00
7600,00
15000,00
24000,00
70000,00
95000,00
150000,00
260000,00
4000000,00
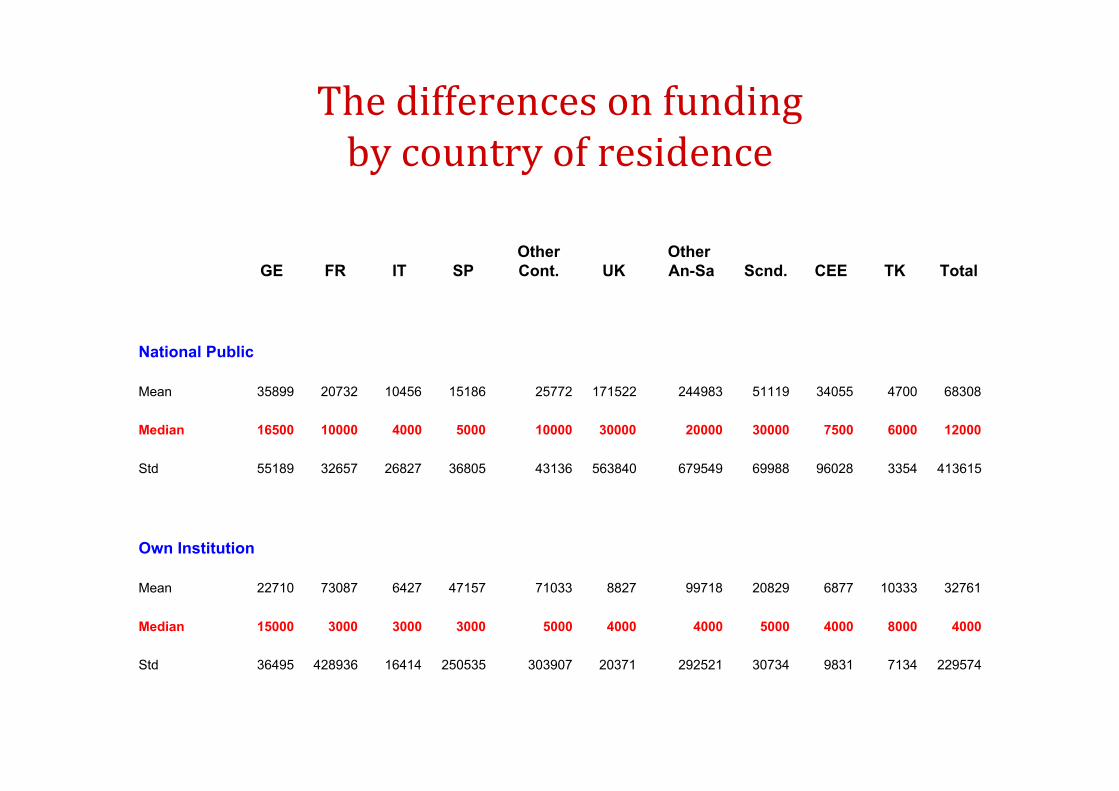
Thedifferencesonfundingbycountryofresidence
GE FR IT SPOtherCont. UK
Other An-Sa Scnd. CEE TK Total
National Public
Mean 35899 20732 10456 15186 25772 171522 244983 51119 34055 4700 68308
Median 16500 10000 4000 5000 10000 30000 20000 30000 7500 6000 12000
Std 55189 32657 26827 36805 43136 563840 679549 69988 96028 3354 413615
Own Institution
Mean 22710 73087 6427 47157 71033 8827 99718 20829 6877 10333 32761
Median 15000 3000 3000 3000 5000 4000 4000 5000 4000 8000 4000
Std 36495 428936 16414 250535 303907 20371 292521 30734 9831 7134 229574

Theallocationofresearchfunds:Nationalpublic
0% 10% 20% 30% 40% 50% 60% 70% 80% 90% 100%
CEE
FR
GE
IT
Other Anglo-Saxon
Other Continental
Scandinavian
SP
TK
UK
NatPu
Free usage Free if necessity is proven Difficult to allocate freely Fixed usage

Theallocationofresearchfunds:FrameworkProgramme(notERC)
0% 10% 20% 30% 40% 50% 60% 70% 80% 90% 100%
CEE
FR
GE
IT
Other Anglo-Saxon
Other Continental
Scandinavian
SP
TK
UK
FP
Free usage Free if necessity is proven Difficult to allocate freely Fixed usage

Theallocationofresearchfunds:ERC
0% 10% 20% 30% 40% 50% 60% 70% 80% 90% 100%
CEE
FR
GE
IT
Other Anglo-Saxon
Other Continental
Scandinavian
SP
TK
UK
ERC
Free usage Free if necessity is proven Difficult to allocate freely Fixed usage

Theperceptionsofstability:Nationalpublic
0% 10% 20% 30% 40% 50% 60% 70% 80% 90% 100%
CEE
FR
GE
IT
Other Anglo-Saxon
Other Continental
Scandinavian
SP
TK
UK
NatPu
Calls & Grants are stable and predictable. Calls are infrequent but assigned grants are stable.
Nature of available grants changes frequently. Very unstable & grants might be terminated prematurely.

Theperceptionsofstability:FP(notERC)
0% 10% 20% 30% 40% 50% 60% 70% 80% 90% 100%
CEE
FR
GE
IT
Other Anglo-Saxon
Other Continental
Scandinavian
SP
TK
UK
Framw
Calls & Grants are stable and predictable. Calls are infrequent but assigned grants are stable.
Nature of available grants changes frequently. Very unstable & grants might be terminated prematurely.

Theperceptionsofstability:ERC
0% 10% 20% 30% 40% 50% 60% 70% 80% 90% 100%
CEE
FR
GE
IT
Other Anglo-Saxon
Other Continental
Scandinavian
SP
TK
UK
ERC
Calls & Grants are stable and predictable. Calls are infrequent but assigned grants are stable.
Nature of available grants changes frequently. Very unstable & grants might be terminated prematurely.

Theapplicationtime:Nationalpublic
0% 10% 20% 30% 40% 50% 60% 70% 80% 90% 100%
CEE
FR
GE
IT
Other Anglo-Saxon
Other Continental
Scandinavian
SP
TK
UK
NatPu
Unnecessarily Long Long, but reasonable Appropriate Very Short Never applied

Theapplicationtime:FP(notERC)
0% 10% 20% 30% 40% 50% 60% 70% 80% 90% 100%
CEE
FR
GE
IT
Other Anglo-Saxon
Other Continental
Scandinavian
SP
TK
UK
Framw
Unnecessarily Long Long, but reasonable Appropriate Very Short Never applied

Theapplicationtime:ERC
0% 10% 20% 30% 40% 50% 60% 70% 80% 90% 100%
CEE
FR
GE
IT
Other Anglo-Saxon
Other Continental
Scandinavian
SP
TK
UK
ERC
Unnecessarily Long Long, but reasonable Appropriate Very Short Never applied

Thereasonstoapply:Nationalpublic
0% 10% 20% 30% 40% 50% 60% 70% 80% 90% 100%
CEE
FR
GE
IT
Other Anglo-Saxon
Other Continental
Scandinavian
SP
TK
UK
NatPu
Total size of the grant Very well suited design of the scheme
Very low procedural & logistical costs Specially targeted to my area of research
Other reasons

Thereasonstoapply:ERC
0% 10% 20% 30% 40% 50% 60% 70% 80% 90% 100%
CEE
FR
GE
IT
Other Anglo-Saxon
Other Continental
Scandinavian
SP
TK
UK
ERC
Total size of the grant Very well suited design of the scheme
Very low procedural & logistical costs Specially targeted to my area of research
Other reasons

Thereasonstoapply:FrameworkProgramme(notERC)
0% 10% 20% 30% 40% 50% 60% 70% 80% 90% 100%
CEE
FR
GE
IT
Other Anglo-Saxon
Other Continental
Scandinavian
SP
TK
UK
Framw
Total size of the grant Very well suited design of the scheme
Very low procedural & logistical costs Specially targeted to my area of research
Other reasons

ThereasonsNOTtoapply:Nationalpublic
0% 10% 20% 30% 40% 50% 60% 70% 80% 90% 100%
CEE
FR
GE
IT
Other Anglo-Saxon
Other Continental
Scandinavian
SP
TK
UK
NatPu
No coverage of my research Low success probability of application
Lack of confidence in evaluation procedures Too high procedural & logistical costs
Grant too small or too difficult to use for own research Incompatibility with my existing research funding
Other reasons

ThereasonsNOTtoapply:ERC
0% 10% 20% 30% 40% 50% 60% 70% 80% 90% 100%
CEE
FR
GE
IT
Other Anglo-Saxon
Other Continental
Scandinavian
SP
TK
UK
ERC
No coverage of my research Low success probability of application
Lack of confidence in evaluation procedures Too high procedural & logistical costs
Grant too small or too difficult to use for own research Incompatibility with my existing research funding
Other reasons

ThereasonsNOTtoapply:FrameworkProgramme(notERC)
0% 10% 20% 30% 40% 50% 60% 70% 80% 90% 100%
CEE
FR
GE
IT
Other Anglo-Saxon
Other Continental
Scandinavian
SP
TK
UK
Framw
No coverage of my research Low success probability of application
Lack of confidence in evaluation procedures Too high procedural & logistical costs
Grant too small or too difficult to use for own research Incompatibility with my existing research funding
Other reasons

Theperceivedmanagementofnationalagencies
0% 20% 40% 60% 80% 100%
CEE
FR
GE
IT
Other Anglo-Saxon
Other Continental
Scandinavian
SP
TK
UK
[VeryW] [WellM] [NotW]

Thesatisfactionwithgrantingschemes:Nationalpublic
0% 10% 20% 30% 40% 50% 60% 70% 80% 90% 100%
CEE
FR
GE
IT
Other Anglo-Saxon
Other Continental
Scandinavian
SP
TK
UK
[NatPu] Very much [NatPu] Yes [NatPu] Mostly [NatPu] No

Thesatisfactionwithgrantingschemes:FrameworkProgramme(notERC)
0% 10% 20% 30% 40% 50% 60% 70% 80% 90% 100%
CEE
FR
GE
IT
Other Anglo-Saxon
Other Continental
Scandinavian
SP
TK
UK
[Framw] Very much [Framw] Yes [Framw] Mostly [Framw] No

Thesatisfactionwithgrantingschemes:EuropeanResearchCouncil
0% 10% 20% 30% 40% 50% 60% 70% 80% 90% 100%
CEE
FR
GE
IT
Other Anglo-Saxon
Other Continental
Scandinavian
SP
TK
UK
[ERC] Very much [ERC] Yes [ERC] Mostly [ERC] No

Thesatisfactionwithgrantingschemesconditionalonapplicationsuccess
37 Satisfaction [NatPu]
Very much Yes Mostly No
Mean Row N % Mean Row N % Mean Row N % Mean Row N %
25 App Success Rate [NatPu] 78 4.2% 79 21.6% 70 36.0% 47 38.1%
37 Satisfaction [Framw]
Very much Yes Mostly No
Mean Row N % Mean Row N % Mean Row N % Mean Row N %
25 App Success Rate [Framw] 76 1.0% 61 17.5% 47 38.4% 30 43.1%
37 Satisfaction [ERC]
Very much Yes Mostly No
Mean Row N % Mean Row N % Mean Row N % Mean Row N %
25 App Success Rate [ERC] 70 5.0% 50 18.2% 27 28.9% 9 47.8%

Satisfaction [NatPu]
No. Appl Very much Yes Mostly No
last 10 yrs Count Row N % Count Row N % Count Row N % Count Row N %
Never 0 0.0% 1 8.3% 4 33.3% 7 58.3%
1-2 times 5 2.8% 48 27.0% 63 35.4% 62 34.8%
3-5 times 17 5.6% 66 21.8% 100 33.0% 120 39.6%
6-10 times 3 3.1% 20 20.6% 39 40.2% 35 36.1%
>10 times 3 7.5% 6 15.0% 18 45.0% 13 32.5%
Satisfaction [FP (notERC)]
No. Appl Very much Yes Mostly No
last 10 yrs Count Row N % Count Row N % Count Row N % Count Row N %
Never 0 0.0% 4 11.4% 10 28.6% 21 60.0%
1-2 times 3 1.7% 36 20.6% 66 37.7% 70 40.0%
3-5 times 1 1.0% 20 19.4% 48 46.6% 34 33.0%
6-10 times 0 0.0% 3 15.0% 9 45.0% 8 40.0%
>10 times 0 0.0% 1 8.3% 8 66.7% 3 25.0%
Satisfaction [ERC]
No. Appl Very much Yes Mostly No
last 10 yrs Count Row N % Count Row N % Count Row N % Count Row N %
Never 3 3.9% 16 20.8% 16 20.8% 42 54.5%
1-2 times 11 9.2% 28 23.5% 34 28.6% 46 38.7%
3-5 times 0 0.0% 1 6.7% 8 53.3% 6 40.0%
6-10 times 0 0.0% 1 33.3% 1 33.3% 1 33.3%
>10 times 0 0.0% 0 0.0% 1 50.0% 1 50.0%
Thesatisfactionwithgrantingschemesconditionalonnumberofapplications

37 Satisfaction [NatPu]
Very much Yes Mostly No
Available grants suitable? Count
RowN %
Count
RowN %
Count
RowN %
Count
RowN %
Yes 26 8.6% 107 35.2% 121 39.8% 50 16.4%
No, grants are often insufficient. 1 0.4% 19 7.0% 89 32.7% 163 59.9%
No, the funds are often redundant,given the specific needs of theproject.
0 0.0% 4 19.0% 6 28.6% 11 52.4%
37 Satisfaction [Framw]
Very much Yes Mostly No
Available grants suitable? Count
RowN %
Count
RowN %
Count
RowN %
Count
RowN %
Yes 4 2.5% 47 29.2% 85 52.8% 25 15.5%
No, grants are often insufficient. 0 0.0% 11 10.2% 34 31.5% 63 58.3%
No, the funds are often redundant,given the specific needs of theproject.
0 0.0% 1 5.6% 5 27.8% 12 66.7%
37 Satisfaction [ERC]
Very much Yes Mostly No
Available grants suitable? Count
RowN %
Count
RowN %
Count
RowN %
Count
RowN %
Yes 13 14.1% 31 33.7% 31 33.7% 17 18.5%
No, grants are often insufficient. 0 0.0% 5 10.9% 14 30.4% 27 58.7%
No, the funds are often redundant,given the specific needs of theproject.
0 0.0% 0 0.0% 3 50.0% 3 50.0%
Thesatisfactionwithgrantingschemes
conditionalongrantsatisfaction

The10mostdesirable,oftenmissing,elementsinEuropeanResearchFundinginEconomics1. Flexibility(156outof702comments)2. Competentandtransparentevaluation(85)3. Simpli[icationofapplicationandprocedures(73)4. Adequatefunding(64)5. Stabilityandregularityofcallsandfunding(45)6. Teachingbuyoutsandsalarycomplements(44=27+17)7. Opentopics(44)8. Accentonexcellence(41)9. Grantsforallstagesofthecareer,speciallyforyoung
researchers(20)10. Supporttoinnovativeideas(18)

Thecutsahead
Yes, and it is likely toaffect my fundingpossibilities 66.8%Yes, but it is unlikely toaffect my fundingpossibilities 13.8%No 10.2%Don’t know 9.3%
Doyouexpectbudgetcutsinnational,orregional,researchfundingineconomics?(659resp.)

Theprovisionalconclusions• Auniquesurvey,nothingsimilarinothersciencesinEurope,orineconomicsinotherregions.
• Manythingswekneworsuspected,butneededtobedocumented.
• Andsomesurprises…• Surveyerrordoesnotdisappear,evenwhenresearcheconomistsaretherespondents,butthesampleislarge.
• Aninformationalsourcefor:researcheconomistsapplyingforfunds,fundingagenciesallocatingfunds,researchonresearchcareersandresearchfunding.
• AvaluableinstrumentfortheEEA.

Theprovisionalconclusions• Provisionalandpreliminary:wehavejuststarteddiggingintothisrichdataset(e.g.regionaldatanotstudiedyet).
• InterestingnewdataonthesociologyoftheeconomicsprofessioninEurope.
• Wecanalreadyseethepersistencyof‘thegenderscissorsproblem’,theagingthroughouttheacademiccareer,thepreponderanceofuniversitypositionsandtheirheterogeneityintermsofinternationalization…
• Theallocationoftimeshowshowresearchisadominantactivity,withoutgendergap,butwithdecayingintensitythroughouttheprofession,exceptattheend(someover‐reporting?).

Theprovisionalconclusions• Themainfundingsourceisnational,althoughthebalancebetweenNationalPublic,andOwnInstitutional,fundingisfairlyheterogeneousacrosscountries.Thesumofbothsourcesislessthan60%onlyinItaly,TurkeyandCEE.
• Funding[lowsacrosscountriesarenotverylargebutrelevant,showingopennessofsomenationalsystems(Austria,Netherlands),andalsoaneedtosubstitutedomesticweaknesses(Italy).
• Reportedresearchbudgetsalsoshowtheheterogeneityacrosscountries,butalsoamongbene[iciaries(withfatlowertailsandsomeoutliers(?)intheuppertails).
• Theallocationoffundsisperceivedasbeingmore[lexiblewithNationalandinstitutionalgrants,thanwithFrameworkProgramme(notERC)grants.

Theprovisionalconclusions
• Reasonstoapplyandnottoapplytodifferentgrantinginstitutionsareconsistent,andconsistentwiththeelementsthatareperceivedtobemoredesirable(Suf[icientfunding,lowadministrativecosts,chancesofsuccessand,toalesserextent,grantstargetedtotheresearcharea)
• Lackofcon[idenceintheevaluationprocessisanimportantreasonnottoapplytoNationalPublicgrantsand,toalesserextent,FP(notERC).
• ProceduralcostsareamaindetrimenttoapplytoFP(notERC),butalsotoERC!
• RegardingthestabilityofcallsERCisperceivedasthemoststable,followedbymanypublicnationalschemes.

Theprovisionalconclusions• Intermsof‘applicationtime’FP(notERC)isperceivedasbeingmoreunnecessarilylongthanERCorothernationalgrantingschemes.
• Heterogeneityonhowdifferentnationalagenciesaremanaged(withUK,Scandinavia,GEandTKatthetopandItalyatthebottom)
• Similarheterogeneityamongcountriesintheglobalassessmentofsatisfaction,althoughtherearerelevantdifferenceswiththemanagementranking(UK,Spain,etc.)
• TheFP(notERC)ranksamongthelesssatisfactoryschemes,althoughsatisfactionishigherforresidentsincountrieswithlowsatisfactionfortheiragencies(e.g.Italy).

Theprovisionalconclusions
• Ontheoverallsample,ERCisalsolowinthesatisfactionranking(withsomestrongsupporters).
• ERCsatisfactionissubstantiallyhigheramongsuccessfulcandidates.
• Evenamongsuccessfulcandidates,andthosewhohaveappliedrepeatedly,thereisafairamountofdissatisfactionwithsomenationalschemesandFP(nonERC).
• Ef[iciencyissuesbecomeevenmorepressingintimesof[inancialrestraint…
• Atthetopofthe10mostdesirable,oftenmissing,elementsinEuropeanResearchFundinginEconomicswehave:
“Trusttheresearcher”
Thethankstoall2385respondents!