EEA migration in the UK: Final report - GOV.UK
140
EEA migration in the UK: Final report September 2018
Transcript of EEA migration in the UK: Final report - GOV.UK
EEA migration in the UK: Final report
September 2018

March 2018
Migration Advisory Committee 2nd Floor Peel Building 2 Marsham Street London SW1P 4DF https://www.gov.uk/government/organisations/migration-advisory-committee

EEA migration in the UK: Final report
Migration Advisory Committee
September 2018

Chair’s Foreword
In July 2017, the Home Secretary commissioned the MAC to report on the current and likely future patterns of EEA migration and the impacts of that migration. The intention is to provide an evidence base for the design of a new migration system after the end of the implementation period in 2021. In July 2017, we published a briefing paper outlining the patterns of EEA migration and some of the key issues. In March 2018, we published an Interim Update summarising, in a critical way, the 417 responses to our call for evidence.
Today we are publishing our final report, focusing on our assessment of the impact of EEA migration and our recommendations for the UK’s post-Brexit work immigration system. Alongside it we are publishing six reports we commissioned from external researchers.
We discuss a wide range of impacts - on wages and unemployment, productivity, innovation, training, consumer prices, house prices, public finances, allocation of public resources, public services, crime and subjective well-being. We have tried to provide an assessment of impacts across all sectors and regions of the UK, and of the differing impacts of different types of migration and on the different parts of the resident population.
This has been a huge task and I have an enormous debt of gratitude to the secretariat and members of the MAC for all their work. I do think we have made progress in extending the evidence base on the impacts of migration but it would be foolish to claim that any of these questions are ever settled. Availability and access to data remain serious constraints on our work and we have tried to be clear about where the evidence is inconclusive.
While we do think that EEA migration has had impacts, many of them seem to be small in magnitude when set against other changes. The fall in the value of the Pound after the referendum vote to leave the EU probably raised prices by 1.7 per cent - this is almost certainly a larger impact than the effect on wages and employment opportunities of residents from all the EEA migration since 2004, although over a different time period.
The small overall impacts mean that EEA migration as a whole has had neither the large negative effects claimed by some nor the clear benefits claimed by others. There are ways in which migration policy could be changed to increase the benefits and reduce the costs and our policy recommendations focus on what we believe these changes should be.
If – and this is not a MAC recommendation – immigration is not to be part of the negotiations with the EU and the UK is deciding its future migration system in isolation, we recommend moving to a system in which all migration is managed with no preferential access to EU citizens.
This would mean ending free movement but that would not make the UK unusual – for example, Canada has an open, welcoming approach to migration but no free movement agreement with any other country. The problem with free movement is that

it leaves migration to the UK solely up to migrants and UK residents have no control over the level and mix of migration. With free movement there can be no guarantee that migration is in the interests of UK residents. This does not mean that free movement is guaranteed to cause problems – that likely depends on the level and mix of the migration flows that result. Free movement was not a political issue prior to 2004 when EU migration was relatively low. The flows are now falling sharply and there are some reasons to think those falls will continue in the near future. The UK may find itself in the position of ending free movement just as public concern falls about the migration flows that result from it.
We do not express a view on whether immigration should be part of the EU negotiations. The biggest gainers from migration are often the migrants themselves so preferential access to the UK labour market would be of benefit to EU citizens, potentially something of value to offer in the negotiations. We are not in a position to evaluate what might be on offer in return or to assess how absolute is the commitment of the EU to the principle of free movement. The proposed changes to the Posted Workers Directive and Article 112 in the EEA agreement suggest some degree of flexibility. The problems free movement has caused in the UK could also occur in the future in other EU countries.
If the UK is in a position where it is deciding the main features of its immigration policy our recommendation is that there should be a less restrictive regime for higher-skilled workers than for lower-skilled workers in a system where there is no preference for EEA over non-EEA workers. Higher-skilled workers tend to have higher earnings so make a more positive contribution to the public finances. The estimated labour market impacts, though small, also suggest that higher-skilled workers are of greater benefit as do any impacts on productivity and innovation. A shift towards higher skilled migration aligns with the Government’s industrial strategy published last year.
Our recommendations relate only to work migration though leaving the EU also requires consideration of family and student migration. The existing Tier 2 (General) scheme can provide a useful template but we recommend changes to it. We recommend that the cap is abolished – it creates uncertainty among employers and it makes little sense for a migrant to be perceived as of value one day and not the next which is what inevitably happens when the cap binds. We also recommend that the scheme be extended to workers in medium-skilled jobs recognising that harmful skills shortages might otherwise occur. We do not recommend any changes to the existing salary thresholds – they seem appropriate to ensure that migrants are not putting downward pressure on average earnings in the economy and make a clear positive contribution to the public finances.
For lower-skilled workers, we do not see the need for a work-related scheme with the possible exception of a seasonal agricultural workers scheme; as that labour market is totally distinct from the labour market for resident workers. This does not mean there would be no supply of low-skilled migrant workers – most of the existing stock would remain and there would likely be a continued flow through family migration or the existing youth mobility scheme. We know that some sectors will lobby intensively against this proposal. If there is to be low-skilled work route we do not think it should be based around sectors: an extended youth mobility scheme would be preferable, as is suggested in the Government White Paper published in July. We are seriously concerned about social care but this sector needs a policy wider than just migration

policy to fix its many problems. This is one illustration of a more general point, that the impacts of migration often depend on other government policies and should not be seen in isolation from the wider context.
Although the restrictions we suggest are not intended to affect high-skilled migration, there is a danger that this becomes collateral damage as the system tries to restrict other types of migration. We recommend that the Government does what it can to reduce the bureaucratic burden of the system and engages in a more systematic way with users of the system to ensure it is fit for purpose.
We do not recommend that the public sector should receive special treatment in the migration system. We do not recommend regional variation in salary thresholds – any such variation would be a higher threshold for London and the South East rather than lower thresholds for other countries and regions. The removal of the cap would help employers in lower-wage regions of the UK who find it hard to compete when the cap currently binds.
There is no way to change the migration system without creating winners and losers. But we believe the UK should focus on enabling higher-skilled migration coupled with a more restrictive policy on lower-skilled migration in the design of its post-Brexit system.
Professor Alan Manning

Contents
Executive Summary ................................................................................................... 1
Introduction ................................................................................................................ 8
Chapter 1: Labour Market Impacts ........................................................................... 16
Chapter 2: Productivity, Innovation, Investment and Training Impacts ..................... 50
Chapter 3: Consumer and House Price Impacts ...................................................... 66
Chapter 4: Public Finance Impacts........................................................................... 71
Chapter 5: Public Service Impacts ........................................................................... 82
Chapter 6: Community Impacts ................................................................................ 99
Chapter 7: Conclusions and Policy Recommendations .......................................... 107
Glossary of terms and abbreviations ...................................................................... 128

1
Executive Summary
Introduction
1. In July 2017, the MAC was commissioned by the Home Secretary to set out the current patterns of European Economic Area (EEA) migration into the UK and to assess the impact of EEA migrants on the economy and society of the UK. The commission also asked us to consider how to align the immigration system with a modern industrial strategy1. The intention is to provide an evidence base for the design of a new migration system for the UK after the end of the implementation period on the 1st of January 20212.
2. Following our receipt of the commission we issued a Call for Evidence along with an EEA briefing paper3 which provided some basic information on EEA workers in the labour market. In March 2018 we published our Interim Update4 which summarised stakeholder responses to our Call for Evidence and lay the ground for the Final report.
3. This Final report focuses on assessing the impact of EEA migration on a wide range of possible areas including: the labour market; productivity, innovation and training; prices; public finances; public services and communities. We reviewed existing evidence in these areas and, where helpful, updated and extended it using both external and internal research.
4. The impacts of migration are likely to vary with the type of migrant and with the type of UK resident. The impacts of migration should not be seen in isolation from other government policies. This report tries to bring out, as best we can, these differing impacts. It is very likely that any change to the current system will have both winners and losers.
5. The UK’s post-Brexit immigration system could be decided by the UK on its own or could be part of the negotiations with the EU. We are not in a position to offer a view on what, if anything, might be on offer and how any such benefits might be set against immigration. For that reason, and because there are a very large range of possible scenarios, most of our discussion focuses on what we think might be a desirable migration system for the UK if it was to be set in isolation. This should not be taken as a MAC recommendation that migration should be excluded from negotiations with the EU.
1https://assets.publishing.service.gov.uk/government/uploads/system/uploads/attachment_data/file/664563/industrial-strategy-white-paper-web-ready-version.pdf 2If the UK leaves the EU without an agreement we do not think it desirable or feasible to introduce the
changes we propose on, or very soon after, March 29th 2019. Some form of implementation period
would be needed. 3https://www.gov.uk/government/uploads/system/uploads/attachment_data/file/636286/2017_08_08_MAC_Briefing_paper.pdf 4https://www.gov.uk/government/publications/eea-workers-in-the-uk-labour-market-interim-update

2
Labour market impacts
6. In this report we assessed the impact of migration on the labour market, including on employment and wages.
7. Taking all the new evidence into account we found that migrants have no or little impact on the overall employment and unemployment outcomes of the UK-born workforce. The impact may vary across different UK-born groups with more negative effects for the lower-skilled and more positive effects for the higher-skilled. However, our robustness checks suggest that these findings are subject to uncertainty.
8. In terms of wages the existing evidence and the analysis we present in the report suggests that migration is not a major determinate of the wages of UK-born workers. We found some evidence suggesting that lower-skilled workers face a negative impact while higher-skilled workers benefit, however the magnitude of the impacts are generally small.
9. We do not conclude what, if any, impact immigration has had on the economic prospects of the self-employed but do present some descriptive statistics taken from Self Assessment and National Insurance Number registration datasets. These show that self-employed EEA nationals have lower declared profits than UK nationals on average, likely reflecting differences in the type and duration of work undertaken.
Productivity, innovation, investment and training impacts
10. We reviewed the evidence both on the overall impact on productivity and on what are commonly seen as the most important drivers of productivity: innovation, investment in physical capital and investment in human capital (education and training).
11. Overall the existing literature and the studies we commissioned point towards immigration having a positive impact on productivity but the results are subject to significant uncertainty. While the evidence on overall migration is not entirely conclusive the evidence perhaps unsurprisingly suggests that high-skilled migrants have a more positive impact.
12. On innovation, the available evidence suggests that high-skilled immigrants make a positive contribution to the levels of innovation in the receiving country.
13. The evidence on the impact of immigration on levels of investment is extremely limited and therefore it is not possible to draw robust conclusions.
14. The research we commissioned showed that overall there is no evidence that migration has had a negative impact on the training of the UK-born workforce. Moreover, there is some evidence to suggest that skilled migrants have a positive impact on the quantity of training available to the UK-born workforce. Any potential impact on the quality of training provided is unknown.

3
Consumer and house price impacts
15. Migration may affect prices if it alters the balance between supply and demand of goods and services. In the report we look at the impact of migration on consumer prices and house prices.
16. We found some evidence that migration, particularly from New Member States (NMS) and non-EEA, has reduced prices of personal services, more so in middle and lower-skilled personal services.
17. Our analysis suggests that migration has increased house prices. The impacts of migration on house prices cannot, however, be seen in isolation from other government policies. The evidence points towards a higher impact of migration in areas with more restrictive planning policies in which it is harder for the housing stock to increase in line with demand.
Public finance and public fund impacts
18. Our commissioned research found that EEA migrants pay more in taxes than they receive in benefits. The positive net contribution to the public finances is larger for EU13+ migrants than for NMS migrants.
19. There is, however, a great deal of heterogeneity amongst the fiscal impact of EEA migration. Across all EEA migrants, the average level of household income at which taxes exceed benefits is estimated to be about £30,000, though there is uncertainty about the exact figure. A more selective approach to EEA migration, which is not available under free movement, could provide an even more positive impact of migration on the public finances. Net fiscal contribution is strongly related to age and, more importantly, earnings so that a migration policy that selected on those characteristics could produce even higher gains.
20. We also considered the relationship between immigration and the allocation of public funding to assess whether money flows to the areas where there is increased demand for public services. The existing funding formulae are very complicated but we are not convinced sufficient attention is paid to ensuring that increased immigration brings forth the extra resources needed to manage the consequences of that immigration.
Public service impacts
21. We considered the impact of migrants on four key public services: healthcare, social care, education and social housing.
22. EEA migrants contribute much more to the health service and the provision of social care in financial resources and through work than they consume in services. EEA workers are an increasing share of the health and social care workforces though these sectors employ greater numbers of non-EEA migrants. There is no evidence that migration has reduced the quality of healthcare.
23. Social care is a sector that struggles to recruit and retain workers which is a cause for concern as demand is rising inexorably. Its basic underlying problem

4
is that poor terms and conditions paid to workers in this sector, in turn caused by the difficulty in finding a sustainable funding model. We are concerned that special immigration schemes for social care will struggle to retain enough migrants in the sector if work in it is not made more attractive.
24. In education, migrant children and the children of migrants are a higher fraction of the school population than migrants are of the school workforce. However, we find no evidence that migration has reduced parental choice in schools or the educational attainment of UK-born children. On average, children with English as an additional language outperform native English speakers.
25. Migrants are a small fraction of people in social housing but a rising fraction of new tenants. The share of new tenancies going to migrants from the NMS in particular is rising. Given there is little building of new social housing this is inevitably at the expense of other potential tenants.
Community impacts
26. The impacts of migration on communities are hard to measure owing to their subjective nature which means there is a risk they are ignored.
27. In line with previous research, we found that migration does not impact crime and there is no evidence to suggest that migrants are linked to any increases in crime in England and Wales.
28. We also found no evidence that migration has reduced the average level of subjective well-being in the UK. We found a hint of a positive effect for those with more positive views of migrants and a negative effect for those with negative views.
Policy recommendations
29. Free movement has the virtue of a low bureaucratic burden but at the price of losing control over both the level and type of immigration into the UK. With free movement, the decision to migrate rests solely with the migrant. Ending free movement would not make the UK unusual – for example Canada combines a relatively open policy to migration without any free movement agreement.
30. Ending free movement would not mean that visa-free travel for EEA citizens would end, just that a visa would be needed to settle in the UK for any period of time and to work as is the case for the citizens of some non-EEA countries at the moment.
31. If the UK decides on its new immigration system in isolation from the negotiations about the future relationship with the EU we do not see compelling reasons to offer a different set of rules to EEA and non-EEA citizens. A migrant’s impact depends on factors such as their skills, employment, age and use of public services, and not fundamentally on their nationality.
32. The evidence from this report points in the direction of high-skilled migrants having a clear benefit to existing residents while the same is not true for lower-skilled migrants. As a result, a policy on work migration that provided greater

5
access for higher-skilled migration while restricting access for lower-skilled workers to enter the UK would be consistent with the available evidence.
33. Currently the main scheme for high-skilled workers from outside the EEA with a job offer in the UK is Tier 2. The two most important categories are Tier 2 (Intra-Company Transfer) and Tier 2 (General) – for new recruit coming to work in the UK. We do not propose any change to the way the current Intra-Company Transfer (ICT) scheme works.
34. The existing Tier 2 (General) scheme can provide a useful template for a work permit scheme although criticisms of the administrative burdens the scheme imposes should be taken seriously if it is to be extended to EEA citizens.
High- and medium-skilled workers
35. If free movement ends and if Tier 2 (General) is extended to cover EEA citizens we recommend the following:
• Abolition of the Tier 2 (General) cap.
• Medium-skilled jobs should be eligible for Tier (2) General not just high-skilled jobs as at present.
• The salary threshold at £30,000 should be retained even though we recommend expanding the list of eligible occupations. This would allow employers to hire migrants into medium-skills jobs but would also require employers to pay salaries that place greater upward pressure on earnings in the sector.
• The Immigration Skills Charge should also cover EEA citizens.
• Abolition of the Resident Labour Market Test (RLMT). A robust approach to the salary thresholds and the Immigration Skill Charge are a better way to protect UK workers against the dangers of employers using migrant workers to under-cut UK-born.
• In-country ability to change employers should be made easier for Tier 2 migrants.
Low-skilled workers
36. We do not recommend an explicit work migration route for low-skilled workers with the possible exception of a seasonal agricultural workers schemes. This is likely to be strongly opposed by the affected sectors.
37. If there is to be a route for low-skilled migrant workers we recommend using an expanded youth mobility scheme rather than employer-led sector-based routes.
38. If a seasonal agriculture worker scheme was introduced we recommend that employers pay a higher minimum wage in return for the privileged access to

6
labour this scheme would give the sector in order to encourage increases in productivity.
Self-employment
39. Tier 1 (Exceptional Talent) and Tier 1 (Entrepreneur) visa routes should be better evaluated to gain more clarity on how this may apply to EEA self-employed migrants
Regional variation in the immigration system
40. The current UK immigration system has only very limited regional variation. A number of regions and countries in the UK have expressed the wish to have more regional variation, most commonly in the form of lower salary thresholds. In line with previous MAC reports, including the Interim Update, we do not recommend introducing more regional variations, though abolition of the Tier 2 cap would help some lower-wage regions.
Northern Ireland
41. Northern Ireland has the added complexity of a land border with the EU via the Republic of Ireland. We think there are some grounds for concern in lower-wage sectors especially in the agri-food sector which is relatively large in the Northern Irish economy. Dealing with the problem would require either a different scheme for the whole of the UK or a special scheme for Northern Ireland, neither of which are very attractive.
The public sector
42. There is often a claim for public-sector workers to be treated differently, most commonly on the grounds that the value of the work is not reflected in the salaries paid. The MAC does not think the public sector should be treated differently: it would be better to pay public sector workers salaries that reflect the value of the work.
Managing the consequences of migration and evaluating migration policy
43. There is little attention given by the Government to monitoring or evaluating the impact of migration policy changes. There is a need for much more systematic evaluation of whether labour migration policies are achieving their intended economic goals.
44. This would require much better data, including the development of administrative data sources that would enable us, and others, to understand the economic contributions of migrants admitted to the UK under different policy routes.
Conclusion
45. A managed migration system could benefit the resident population though there would be winners and losers and the size of the benefits are likely to be modest. The evidence shows benefits would be best achieved through shifting the mix

7
of work migration towards higher-skilled workers. If freedom of movement ends, the migration of EEA workers will become harder. Our proposals for changes to the Tier 2 visa system – removing the cap, widening the range of jobs permitted, and reducing bureaucracy - mean that the change would be less for medium-skilled workers than low-skilled workers and less still for high-skilled workers. For non-EEA workers, our Tier 2 proposals would make it easier to hire migrants into high and medium-skilled jobs but make no change for lower-skilled.
8
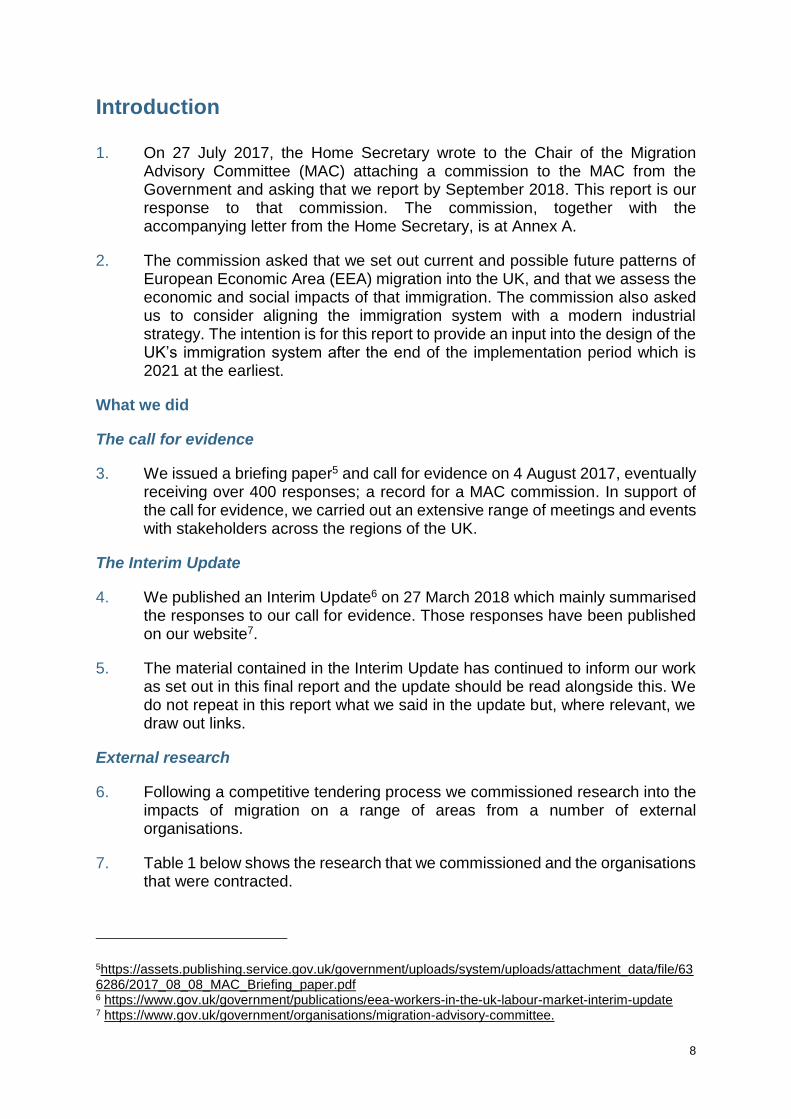
Introduction 1. On 27 July 2017, the Home Secretary wrote to the Chair of the Migration
Advisory Committee (MAC) attaching a commission to the MAC from the Government and asking that we report by September 2018. This report is our response to that commission. The commission, together with the accompanying letter from the Home Secretary, is at Annex A.
2. The commission asked that we set out current and possible future patterns of European Economic Area (EEA) migration into the UK, and that we assess the economic and social impacts of that immigration. The commission also asked us to consider aligning the immigration system with a modern industrial strategy. The intention is for this report to provide an input into the design of the UK’s immigration system after the end of the implementation period which is 2021 at the earliest.
What we did
The call for evidence
3. We issued a briefing paper5 and call for evidence on 4 August 2017, eventually receiving over 400 responses; a record for a MAC commission. In support of the call for evidence, we carried out an extensive range of meetings and events with stakeholders across the regions of the UK.
The Interim Update
4. We published an Interim Update6 on 27 March 2018 which mainly summarised the responses to our call for evidence. Those responses have been published on our website7.
5. The material contained in the Interim Update has continued to inform our work as set out in this final report and the update should be read alongside this. We do not repeat in this report what we said in the update but, where relevant, we draw out links.
External research
6. Following a competitive tendering process we commissioned research into the impacts of migration on a range of areas from a number of external organisations.
7. Table 1 below shows the research that we commissioned and the organisations that were contracted.
5https://assets.publishing.service.gov.uk/government/uploads/system/uploads/attachment_data/file/636286/2017_08_08_MAC_Briefing_paper.pdf 6 https://www.gov.uk/government/publications/eea-workers-in-the-uk-labour-market-interim-update 7 https://www.gov.uk/government/organisations/migration-advisory-committee.
9
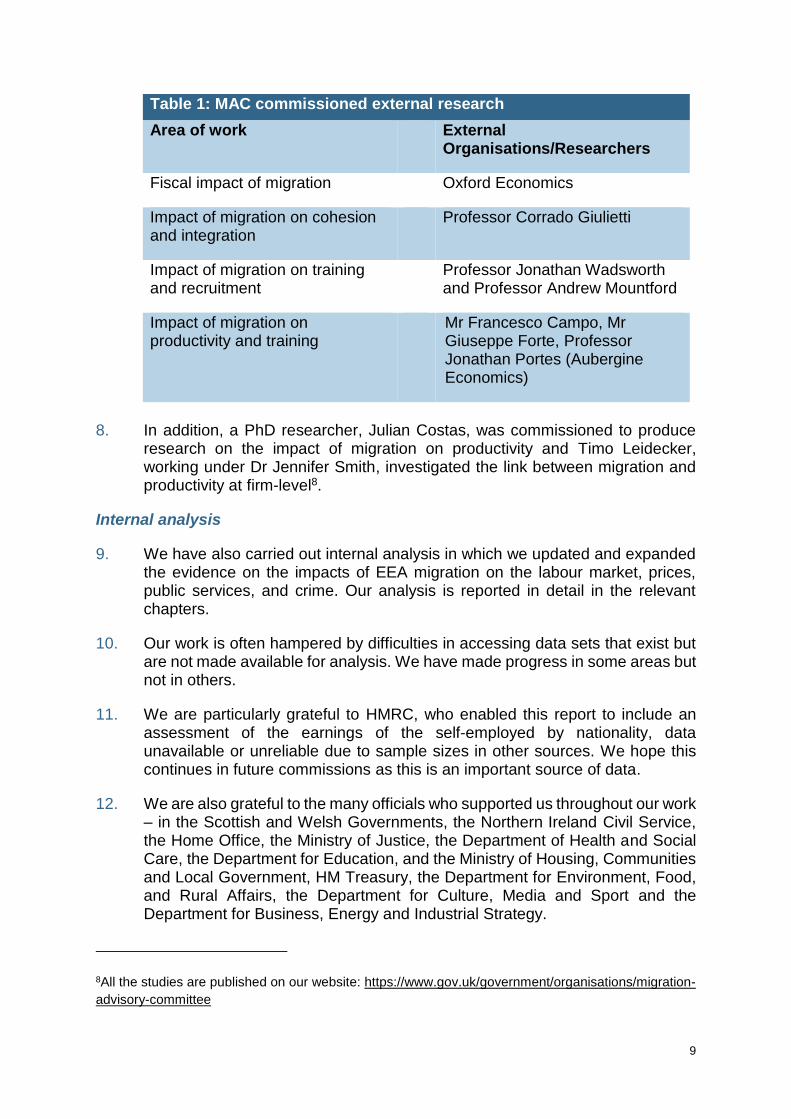
Table 1: MAC commissioned external research
Area of work External Organisations/Researchers
Fiscal impact of migration Oxford Economics
Impact of migration on cohesion and integration
Professor Corrado Giulietti
Impact of migration on training and recruitment
Professor Jonathan Wadsworth and Professor Andrew Mountford
Impact of migration on productivity and training
Mr Francesco Campo, Mr Giuseppe Forte, Professor Jonathan Portes (Aubergine Economics)
8. In addition, a PhD researcher, Julian Costas, was commissioned to produce
research on the impact of migration on productivity and Timo Leidecker, working under Dr Jennifer Smith, investigated the link between migration and productivity at firm-level8.
Internal analysis
9. We have also carried out internal analysis in which we updated and expanded the evidence on the impacts of EEA migration on the labour market, prices, public services, and crime. Our analysis is reported in detail in the relevant chapters.
10. Our work is often hampered by difficulties in accessing data sets that exist but are not made available for analysis. We have made progress in some areas but not in others.
11. We are particularly grateful to HMRC, who enabled this report to include an assessment of the earnings of the self-employed by nationality, data unavailable or unreliable due to sample sizes in other sources. We hope this continues in future commissions as this is an important source of data.
12. We are also grateful to the many officials who supported us throughout our work – in the Scottish and Welsh Governments, the Northern Ireland Civil Service, the Home Office, the Ministry of Justice, the Department of Health and Social Care, the Department for Education, and the Ministry of Housing, Communities and Local Government, HM Treasury, the Department for Environment, Food, and Rural Affairs, the Department for Culture, Media and Sport and the Department for Business, Energy and Industrial Strategy.
8All the studies are published on our website: https://www.gov.uk/government/organisations/migration-
advisory-committee

10
13. We are looking forward to further engaging with the Department for Work and Pensions to gain access to the dataset linking data from the Annual Survey of Hours and Earnings (ASHE) with the Migrant Worker Scan (which would allow us to assess more deeply the earnings of employees by nationality) and statistics on benefit payments to migrants that are very patchy at the moment. Unfortunately we were unable to negotiate access to these data for this report.
Free movement and EEA migration
14. Under free movement there is no control over the number of EEA migrants entering the UK and the mix of those migrants. Prior to the 2004 expansion of the European Union (EU), there was little concern expressed in the UK about free movement, perhaps because the flows were small and relatively balanced. After the expansion of the EU in 2004, the flows became much larger and mostly towards the UK and public concern about immigration also rose. The share of the population who were born in an EEA country (excluding the Republic of Ireland or the UK) increased from around 1.5 per cent in 2004 to around 5.1 per cent in 2017 according to the figures taken from the Annual Population Survey.
9https://www.ons.gov.uk/peoplepopulationandcommunity/populationandmigration/internationalmigratio
n/datasets /longterminternationalmigration200citizenshipuk
Figure 1: Immigration and emigration trends 2000-2017
Source: ONS LTIM Data9

11
15. A high level of net migration in the past does not mean that migration will necessarily continue. Figure 1 above shows the immigration and emigration trends across 4 different migrant groups since 2000. Net migration from the EU15 countries rose after the financial crisis (which hit southern Europe more severely than the UK) but now seems to be falling, though remains positive. Immigration from the EU8 countries rapidly increased following their accession to the EU in 2004 but has been on a downward trend since about 2010. In 2017 the provisional net migration estimates into the UK for EU8 citizens was only 6,000 (+/-16,000), falling to -2,000 (+/-15,000) in the latest (provisional) figures of the year ending March 2018 – a statistically insignificant difference. Immigration from the EU2 countries rose rapidly following their accession to the EU in 2007. If EU2 migration follows a pattern similar to the EU8 it is quite possible that net migration from these countries is close to its peak. Net migration of EU2 citizens has fallen from a peak of +64,000 (+/-15,000) in the year ending September 2016 to +38,000 (+/-15,000) in the latest (provisional) figures for the year ending March 201810.
16. Migration from Eastern Europe to the UK is primarily driven by differences in per capita income but these differences are narrowing. Figure 2, below, shows the narrowing differences in wages between some New Member States (Poland, Romania, and Bulgaria). This is likely to continue reducing the attraction of working in the UK.
Figure 2: Monthly earnings relative to the UK
Source: ILO11 and OECD12
10https://www.ons.gov.uk/peoplepopulationandcommunity/populationandmigration/internationalmigrati
on/datasets/migrationstatisticsquarterlyreportprovisionallongterminternationalmigrationltimestimates 11 http://www.ilo.org/ilostat/faces/oracle/webcenter/portalapp/pagehierarchy/Page3.jspx?MBI_ID=435 12 https://stats.oecd.org/Index.aspx?DataSetCode=AV_AN_WAGE (only German data gathered from OECD)
0
20
40
60
80
100
120
140
160
2000 2001 2002 2003 2004 2005 2006 2007 2008 2009 2010 2011 2012 2013 2014 2015 2016
Monthly Earnings in constant PPP ($)
Base UK=100
Bulgaria Poland Romania Germany

12
17. EU migrants have a choice of destination and the UK may not be that choice. The UK has been one of the existing EU members with a relatively large increase in NMS migrants since 2004. Figure 3 below shows that the increase in the share of NMS migrants in the UK was higher in the period 2004 - 2016 than most other EU countries though, interestingly, lower than in Ireland. For much of this period, the UK had more robust economic growth than much of Europe. Following the Brexit referendum in June 2016, UK growth has fallen from being one of the fastest in the Group of 7 (G7) nations to one of the slowest13, suggesting there may be greater economic opportunities for NMS migrants in other parts of the EU. As shown in Figure 2 average monthly wages in the UK are lower than in Germany, potentially making other destinations a more attractive place to work. The fall in the value of the pound after the referendum led to a fall in UK wages expressed in euros. This may have reduced the incentive for migrants to work in the UK, especially in areas such as seasonal agriculture.
Figure 3: Shares of NMS migrants in employment, 2016 vs 2004
Source: EU Labour Force Survey
18. Another factor limiting migration flows from the NMS is that there are a limited number of people in those countries who are interested in migrating. No large poorer countries are joining the EU in the near future. However, for the moment, the shares of the NMS population working in EU15+ countries continue to rise as shown in Figure 4. 14 per cent of the population born in NMS countries who are aged 25-39 are working in an EU15 country. The UK’s share of this group has remained almost constant at around 25 per cent since 2010.
13 https://fullfact.org/economy/uk-economic-growth-within-g7/
AT
BE CH
DE
DK
ES
FI
FR
GR
IE
ISIT
NL
NO
PT
SE
UK
0%
1%
2%
3%
4%
5%
6%
7%
8%
0.0% 0.5% 1.0% 1.5% 2.0% 2.5% 3.0% 3.5% 4.0%
NMS share of employment 2016
NMS share of employment 2004

13
Figure 4: Fraction of NMS-born population in other EU countries, by age group
Source: EU Labour Force Survey
19. Taken together, it is possible that future flows would fall further even without a policy change and that concern about free movement would recede as a result14. The UK may have ended free movement from the EU just as it stops being perceived as a problem.
Assessing the impact of EEA migration
20. The individual chapters of this report summarise the evidence on the impact of EEA migration across a range of outcomes. There are some common issues that are useful to discuss here.
21. The main effect of EEA migration has been an increase in population. Net migration, both EEA and non-EEA, of 250,000 a year means adding a city of the size of Birmingham to the UK population every four years. This sounds dramatic, but another way of imagining that same statistic is to picture a street with 100 people living in it. In 5 years’ time, the current levels of net migration mean that street will have 102 people living in it, this sounds less dramatic.
22. Is higher population a good or bad thing? Higher population may lead to increased congestion but there is also evidence that high population density is associated with higher productivity through what are called agglomeration effects: population tends to concentrate in congested cities for this reason. There is no evidence of higher or lower prosperity being associated with a higher or lower population – we discussed this point in Chapter 2 of our Interim Update.
14 There is some evidence of a more positive view of immigration since the referendum. See, for
example, the discussion in https://medium.com/@robfordmancs/taking-back-control-fcd9f209c7ff.
0%
2%
4%
6%
8%
10%
12%
14%
16%
2004 2005 2006 2007 2008 2009 2010 2011 2012 2013 2014 2015 2016
NMS population share
15-24 25-39 40-59

14
23. An increase in population does not inevitably add to pressures on the labour market or public services because the extra population contributes to both supply and demand. Migrants increase the supply of labour but also the demand as they spend their income. They increase the demand for health services but also the supply as migrant workers pay taxes to finance those services and can also be employed providing these services. Migrants do not simply replicate the existing resident population, they have a different age and skills distribution. It is likely that migrants add more to demand than supply in parts of the economy: in others, the opposite. The chapters that follow outline where we think migrants alter the balance between demand and supply in the economy.
24. The impacts of migration cannot be seen in isolation from other policies. This is a recurring theme in the chapters that follow. One example that illustrates the point: if there is an increase in the population as a result of higher migration, then any impact on house prices is likely to depend on house-building policies. Fail to build more houses and net migration may cause house prices to rise. Build more houses, possibly using migrant construction workers, and house prices might not change.
25. The impacts of migration will depend on the type of the migrant, in particular their age and skills. Additionally, the impacts can be experienced differently by different parts of the resident population. It often makes little sense to discuss the impact of migration without asking about the type of migration and the impact on whom.
26. In an ideal world, one would be able to assess the impact of every type of migrant on every type of resident. That is never possible so the best one can hope for is an assessment of the impact of broad categories of migration on broad categories of residents. Sometimes it is not possible to provide an assessment of the separate impact of EEA and non-EEA migration.
27. In many cases the estimated impacts of migration are not significantly different from zero. This should not necessarily be taken to mean that the impacts are zero, rather that the evidence is inconclusive. We try to be open about the limitations of the evidence we present but remain strongly committed to the validity of the data-based approach to the questions we are asked. Migration is an area of strongly-held opinions but one should always look to the evidence for those opinions and not pay attention to how loudly the views are expressed.
28. Outcomes are affected by many factors other than migration and it is important to try to isolate the impact of migration from other relevant factors. There are a variety of methodological approaches to this problem and we try to apply them wherever possible. Care needs to be taken not to ascribe to migration an outcome that has other causes.
29. This report considers the impact of EEA migration on a wide range of possible outcomes: on labour market opportunities (employment, unemployment and wages); productivity, innovation and training; prices; the public finances; public services and communities. In many cases we are updating and extending earlier MAC reports that have considered similar issues.

15
Structure of this report
30. Chapter 1 looks at the impact of migration on the labour market. It sets out a summary of the current available evidence; analysis of the impact of migrants on wages, employment and recruitment; and some analysis of the self-employed.
31. Chapter 2 considers the impact of migrants on productivity, innovation, investment and training.
32. Chapter 3 looks at the impact on consumer and house prices.
33. Chapter 4 describes the impact of migrants on the public finances.
34. Chapter 5 looks at the impact on the provision of public services, namely health, social care, education and social housing.
35. Chapter 6 covers the impact on communities measured through the impact on crime and well-being.
36. Chapter 7 sets out our conclusions and recommendations for policy. As usual, in making recommendations about migration policy, the MAC’s objective is to maximise the total welfare of the resident population whilst considering that impacts may differ across individuals, regions, occupations and sectors.
37. Throughout the report we define migrants as those who were born outside the UK and not on nationality as some other studies do. Our reason for this was reported in the methodology section of Annex E of the MAC Interim Update. We include those born in Ireland with the UK-born on the assumption that the Common Travel Area will continue; so any future restrictions on EEA migration will not apply to the Irish. Sometimes we refer to the group of UK and Irish as simply the UK-born to make the report more readable.
38. We often distinguish between a group we call EU13+ which are the 13 pre-2004 EU members (excluding UK and Ireland) plus the members of the EEA (Norway, Iceland and Liechtenstein) plus Switzerland (which is not technically a member of the EEA). We call NMS migrants those who were born in countries that joined the EU in or after 200415.
15 New members states include: Bulgaria, Croatia, Cyprus, Czech Republic, Estonia, Hungary, Latvia,
Lithuania, Malta, Poland, Romania, Slovakia, Slovenia.

16
Chapter 1: Labour Market Impacts
Key messages
• There is little evidence of substantial impacts of EEA immigration on the overall employment opportunities of UK-born workers. Where some effect is found, lower-skilled UK-born workers are more likely to lose out while higher-skilled workers tend to benefit.
• There is little evidence of substantial impacts of EEA immigration on aggregate wages. Again, there is some evidence that lower-skilled workers face a negative impact while higher-skilled workers benefit, however the magnitude of the impacts are generally small.
• The earnings of the self-employed, regardless of nationality, are lower than for employees and the gap is larger now than in the past. Further research is required to ascertain what role, if any, immigration has played in this.
Introduction
1.1. This is not the first time the MAC has provided an analysis of the impact of immigration on the labour market, including on employment and wages. Our 2012 report “Analysis of the Impact of Migration”16 provided a summary of existing studies as well as our own estimates of the impact on the labour market outcomes of UK-born workers. We revisited the literature again in 2014 for our “Migrants in Low-Skilled Work”17 report.
1.2. In both reports we concluded, on the basis of existing studies, that migrants had only a modest impact on average wages and that migrants likely modestly increased earnings at the top of the wage distribution while reducing them at the bottom end. We also reported that the majority of academic studies found no impact of immigration on the employment or unemployment outcomes of UK-born workers.
1.3. Since those reports the migrant share has increased further and the wider UK labour market has changed. In this chapter, we provide some background to these labour market trends, offer an updated assessment of the findings from the literature and also report the findings of some new analysis.
The context
Wages
16 https://www.gov.uk/government/publications/analysis-of-the-impacts-of-migration 17 https://www.gov.uk/government/publications/migrants-in-low-skilled-work

17
1.4. Figure 1.1 presents real hourly wages for our four country of birth groups from 1997 to 2017. As discussed in our Interim Update, EU13+ migrants have the highest earnings while NMS migrants the lowest18. In our Interim Update, we reported the pay differentials between migrant and UK-born workers controlling for a number of characteristics19. This exercise showed that a significant part of these differentials can be explained by differences in age, region and the jobs that people do. For example, we found that overall NMS migrants were only paid around 5 per cent less on average than similar UK-born workers, a much smaller differential than in Figure 1.1.
“The wide differences in the type of work that EU migrants undertake depending on their nationality and skill levels, and the extent to which EU nationals are overqualified for the job they do, also help explain the considerable variation in pay between different EU migrant workers…The typically high educational attainment levels of EU14 migrants also partly explain why they have the highest median hourly rate of pay.”
Chartered Institute of Personnel and Development (CIPD) response to MAC call for evidence
1.5. Real wages for all groups grew before the financial crisis but then fell and are
still around 6 per cent below their pre-recession peak20. Some have argued this has been the worst decade for real wage growth in 200 years21. Figure 1.2 shows real wages for the UK-born by skill group. All groups have done badly since the financial crisis. If anything the lower-skilled have done slightly less badly, possibly because the minimum wage has increased more than median earnings.
“For too long, bad employers have been able to use migrants, as well as UK workers on precarious contracts, to drive down pay and conditions in certain sectors. Free movement in the single market only functions properly when there is a level playing field in the labour market.”
TUC response to MAC call for evidence
1.6. Our Interim Update argued that the timing of the fall in real wages is more
closely aligned with the financial crisis than with the accession of the NMS and that the lower end of the skill distribution has done slightly better than the higher end since the recession even though this is the group which saw the largest increase in EEA migration (see Figure 1.2 below). This gives some reason to think that if there is any impact of EEA migrants on UK-born wages then that
18 https://www.gov.uk/government/publications/eea-workers-in-the-uk-labour-market-interim-update 19 Figure 1.7 “EEA-workers in the UK labour market: Interim Update”, page 35. 20 Average total pay (2015 prices) in May 2018 compared to February 2008, ONS “UK labour market:
July 2018” 21 Resolution foundation analysis of ONS, OBR and BoE data.

18
effect is likely to be small compared to other factors. Later in this chapter we conduct a more formal analysis of this claim.
Figure 1.1: Median real hourly pay by migrant group, 1997-2017
Source: Labour Force Survey and Annual Population Survey (*NMS series starts in 2004)
Figure 1.2: UK-born median gross hourly wage by occupational skill level, 2016 prices (2004=100)
Source: Labour Force Survey and Annual Population Survey (*NMS series starts in 2004)
£5
£6
£7
£8
£9
£10
£11
£12
£13
£14
£15
1997 1999 2001 2003 2005 2007 2009 2011 2013 2015 2017
Median Gross Hourly Pay (CPI
adjusted, 2016 prices)
UK + Ireland EU13+ NMS* Non-EEA
75
80
85
90
95
100
105
1997 1999 2001 2003 2005 2007 2009 2011 2013 2015 2017
Median hourly wage (2004=100)
Low skilled (RQF Lv1-Lv2)
Medium skilled (RQF Lv3-Lv4)
High skilled (RQF Lv6+)

19
“There is very little evidence that immigration has reduced UK wages…it is important to remember that the change in the rate of pay in lower-paying roles is dwarfed by the pace at which the National Minimum Wage and latterly the National Living Wage have increased.”
Confederation of British Industry response to MAC call for evidence
Employment and unemployment
1.7. Figure 1.3 presents employment rates for our four country of birth groups over the period 1997 to 2017. Non-EEA migrants have consistently had the lowest employment rates; this is in large part due to lower female labour market participation among some groups. For example, the employment rate of female workers from Bangladesh and Pakistan is about one-third that of UK-born women22. Employment rates of the UK-born and EU13+ migrants are very similar while the employment rates of NMS migrants are markedly higher.
1.8. All groups show similar trends. The financial crisis and ensuing recession unsurprisingly led to a fall in employment rates but the recovery has been strong so that the employment rate of 75.8 per cent in early 2018 is the highest since records began in 1971.
Figure 1.3: Proportion of those aged 16-64 in employment by country of birth
Source: Labour Force Survey and Annual Population Survey (*NMS series starts in 2004)
22 Migration Observatory, “Characteristics and Outcomes of Migrants in the UK Labour Market”,
analysis of 2015 Labour Force Survey

20
Figure 1.4: Adjusted and unadjusted ppt difference in employment rates compared to UK-born in 2017
Source: 2017 Annual Population Survey
1.9. Figure 1.4 above presents the difference between the employment rates of our three migrant groups compared to UK-born workers. It shows that, for EU13+ and NMS migrants, most of the difference in employment rates compared to the UK-born can be accounted for by age, sex, region and age left full-time education.
1.10. Employment rates have evolved differently for different UK-born groups. Figure 1.5 below presents the evolution of the UK-born employment rate by highest level of education obtained.
Figure 1.5: UK+ROI born 16-64 employment rate by level of education
Source: Labour Force Survey (1997-2003) and Annual Population Survey (2004-2017)
30%
40%
50%
60%
70%
80%
90%
1997 1999 2001 2003 2005 2007 2009 2011 2013 2015 2017
Employment rate
Degree/Higher Education A Level / GCSE or equivalents No qualifications

21
1.11. It shows how the employment rates of UK-born workers are much higher for
those with more education, though it should be noted that some of these differences stem from differences in age not education. The employment rate of those with degrees has remained largely stable over time, while those with lower levels of education experienced declines after the financial crisis and these have yet to fully recover.
1.12. Related outcomes, such as unemployment and inactivity rates, follow a similar pattern. Both unemployment and inactivity rates have fallen for all country of birth groups with the EEA-born, particularly those from the NMS, doing somewhat better than the UK-born, and those from outside the EEA doing somewhat worse.
1.13. Understanding the combination of strong employment outcomes and weak real wage growth has puzzled economists and policy-makers in recent years. We do not attempt an explanation for this but we do assess the impact that EEA migration has had on the UK labour market.
Theory
1.14. Discussions of immigration often focus on labour market impacts of immigration, though from our perspective not all of that discussion is well-informed. A common misunderstanding is the ‘lump of labour’ fallacy. This assumes the number of jobs in an economy is fixed, so that increases in immigration must necessarily reduce labour market opportunities for existing residents. Our Interim Update explained why both theory and evidence strongly reject this. It is better to see labour market outcomes as being influenced by the interaction of the demand for labour from employers and supply of labour from workers with both being affected by immigration.
1.15. The migration economics literature offers a useful framework for analysing the impact of immigration on the labour market. The key concept in this theoretical framework is whether a migrant is a complement or a substitute to residents. The labour market opportunities of residents will be improved by migrants who are complementary to them, for example complementary migrants might raise the productivity of resident workers perhaps by working with them or filling shortages that would otherwise restrict the growth of some sectors. On the other hand, if migrants are substitutes, they can be used instead of resident workers thereby reducing the demand for resident labour.

22
“Attracting…international jobs to the UK increases the proportion that are filled by British workers. For example, many firms operate international graduate schemes from the UK. Having them here rather than elsewhere in Europe makes these opportunities more accessible to British workers. The viability of UK-based international schemes rests on being able to bring workers to the UK. Far from immigration reducing employment opportunities for British workers, CBI members are clear that being open to companies assembling global teams here increases the opportunities for UK workers.”
Confederation of British Industry response to MAC call for evidence
1.16. The patterns of complementarity and substitutability between migrants and
resident workers are likely to be complex. They are most apparent when migrants work alongside residents or instead of them. However, a migrant spending their income and creating jobs for residents in a wide range of sectors can also be thought of as an indirect complement to resident workers. It is likely that the extent of complementarity and substitutability varies with the type of migrant and the type of resident worker. A key idea is that immigration of one type of worker is likely to worsen outcomes for resident workers who are similar but improve them for other types of resident workers. Ultimately, we need an empirical assessment of the impact of migration on the labour market opportunities of existing residents. A more extensive, though still relatively accessible, summary of the theoretical and empirical issues can be found in a 2017 report from the US National Academies23 and this is discussed in Box 1 below.
23 https://www.nap.edu/catalog/23550/the-economic-and-fiscal-consequences-of-immigration

23
Box 1: Measuring the impact of immigration on the labour market Wages and employment may change after an increase or decrease in immigration; the challenge researchers face is being able to establish a counterfactual i.e. “what the employment or wage level would have been if immigration had not occurred?”.
A number of different approaches have been taken in an attempt to overcome this challenge. They all generally rely on dividing up the labour market into segments. This segmentation allows for the exploitation of differences in the extent of immigration within different parts of the labour market, controlling for a range of additional factors.
A 2017 US National Academies report groups studies under three labels. There are spatial studies, which segment the labour market by geography. There are skill cell studies, which group and compare workers by characteristics such as education and skill level. Finally, there are structural studies which use the skill cell approach but within the framework of structural equations drawn from economic theory in an attempt to model the linkages between labour markets.
Each of these approaches has advantages and disadvantages. The spatial approach is potentially affected by how the movement of capital, goods or native labour can diffuse the impact of local increases of immigration across the national economy. To the extent these mechanisms are important, spatial estimates may underestimate the impact of immigration at the national level. The skill cell approach can overcome these concerns but at the cost of being unable to generate estimates of the impact of immigration on native born workers with dissimilar skills to migrant workers. Finally, while structural studies allow for more interactions between labour markets, they can require the imposition of strong assumptions, such as over the extent of to which firms can substitute different inputs for one another.
Beyond the particular trade-offs between approaches there are also some common issues which affect most approaches. The first of these is data quality. A reliance of survey data, combined with the relatively small proportion of the UKs population that are non-UK-born, means that researchers are not always able to investigate the impact of immigration on certain sub groups due to small sample sizes. This means the average effects reported may mask differences in the magnitude and direction of impacts across different types of migrants and natives.
A second common challenge is being able to distinguish the impact of immigration on wages and employment from the impact of wages and employment on immigration. If migrants are attracted to areas with high wages and employment this could lead to spurious conclusions about the direction of the effect. This endogeneity problem is often addressed by exploiting variation in migrant settlement patterns that are uncorrelated with labour market conditions, such as proximity to existing migrant communities. However, such solutions require that the economic characteristics that may have influenced historic settlement patterns have not persisted over time.

24
Employment and unemployment
Current evidence
1.17. Most of the existing literature finds little evidence of any substantial impact of immigration on employment or unemployment prospects of UK-born workers. Where an effect is found, it tends to be small in magnitude relative to other factors. In addition, the impact differs in direction and size depending on the types of workers considered, the state of the economy at the time and whether the short or the long run is being considered. Table 1.1 below provides a brief summary of the key results from the existing literature on the UK.
Table 1.1: Summary of existing UK literature examining the impact of immigration on employment and unemployment
Result Description Supporting paper(s) Little or no overall impact of immigration on the level of employment or unemployment of existing workers
Much of the literature concludes that, at least on average, there is little or no impact of immigration on the employment or unemployment of existing workers.
Dustmann, Fabbri, Preston and Wadsworth (2003)24, Dustmann, Fabbri and Preston (2005)25, Portes and French (2005)26, Gilpin, Henty, Lemos, Portes and Bullen (2006)27, Lemos and Portes (2008)28, Reed and Latorre (2009)29, Migration Advisory Committee (2012)30, Lucchino, Rosazza-Bondibene and Portes (2012)31, Lemos (2013)32, Becker and Fetzer (2018)33
24 Dustmann, C., Fabbri, F., Preston, I. and Wadsworth, J. (2003). The local labour market effects of
immigration in the UK. Home Office Report. 25 Dustmann, C., Fabbri, F. and Preston, I. (2005). The Impact of Immigration on the British Labour
Market. The Economic Journal, 115(507), pp.F324-F341. 26 Portes, J. and French, S. (2005). The impact of free movement of workers from central and eastern
Europe on the UK labour market:early evidence. DWP Working Paper, 18. 27 Gilpin, N., Hent, M., Lemos, S., Portes, J. and Bullen, C. (2006). The impact of free movement of
workers from Central and Eastern Europe on the UK labour market. DWP Working Paper, 29. 28 Lemos, S. and Portes, J. (2008). The impact of migration from the new European Union Member
States on native workers. 29 Reed, H. and Latorre, M. (2009). The Economic Impacts of Migration on the UK Labour Market.
IPPR Economics of Migration Working Paper 3. 30 Migration Advisory Committee (2012). Analysis of the impacts of migration. 31 Lucchino, P., Rosazza-Bondibene, C. and Portes, J. (2012). Examining the relationship between
immigration and unemployment using National Insurance Number registration data. NIESR
Discussion Paper, (386). 32 Lemos, S. (2013). Labour Market Effects of Eastern European Migration in Wales. The Manchester
School, 82(5), pp.524-548. 33 O. Becker, S. and Fetzer, T. (2018). Has Eastern European Migration Impacted British Workers?.
The Warwick Economics Research Paper Series (TWERPS), (1165).

25
Where an impact is found it tends to be concentrated among certain groups
Some papers find the employment impact on existing workers differs by level of education/skill. Typically finding a negative employment effect for those with lower levels of education/skill and a positive effect for those with higher levels of education/skill.
Dustmann, Fabbri and Preston (2005), Dustmann, Fabbri, Preston and Wadsworth (2003), Nathan (2011)34
Impact differs depending on the economic cycle
Some studies conclude that while immigration has little effect on employment in normal times it potentially has a negative effect during downturns. However other studies find the “no impact” result is robust to economic conditions.
Migration Advisory Committee (2012), Lucchino, Rosazza-Bondibene and Portes (2012), Devlin et al (2014)35
1.18. The findings are broadly in line with the predictions of the theoretical framework discussed earlier. For example, the finding that the impact on resident workers depends on the skill mix of migrants relates directly the issue of whether migrants act as complements or substitutes. Generally, the estimated magnitude of the impact of immigration on the employment and unemployment rates of the UK-born is small or not identifiable at an aggregate level across the majority of existing studies, although some meaningful effects are found for particular sub-groups.
1.19. For example, Dustmann, Fabbri and Preston (2005) found no statistically significant impact on employment or unemployment overall (using data covering the period 1983-2000). However, they did find that a one percentage point increase in the nonUK-born/ UK-born ratio for working-aged individuals reduced the employment rate of the UK-born with intermediate qualifications by 0.2 percentage points, and increased the unemployment rate of the same group by 0.1 percentage points.
1.20. Since our last major review of the literature covering this topic in 2014 there have only been a small number of new studies into the impacts on employment and unemployment. One of these is Becker and Fetzer (2018), which focuses on the impact associated with the increase in immigration from the NMS
34 Nathan, M. (2011). The Long Term Impacts of Migration in British Cities: Diversity, Wages,
Employment and Prices. SERC Discussion Paper, (67). 35 Department for Business, Innovation and Skills & Home Office (2014). Impacts of migration on UK
native employment: An analytical review of the evidence.

26
countries on labour market outcomes, amongst other variables. They find that
for a local authority experiencing the median “migration shock” 36 between 2001
and 2011 there is an associated 0.3 percentage point rise in the share of the total UK-born working age population that are long-term unemployed over the 10-year period. Equally they find a significant impact on the share of the UK-born working age population that are not participating in the labour market, estimating that this group grew their share of the total UK-born working age population by around 3.6 percentage points in local authorities experiencing the median “migration shock”.
1.21. Studies from other developed economies tend to reach similar conclusions on the impact of immigration on employment/unemployment as the UK focused literature. One of the most recent, and comprehensive, evidence reviews comes from the previously mentioned 2017 National Academies of Sciences, Engineering, Medicine report which covers the economic and fiscal consequences of immigration in the US.
1.22. They summarised their findings on the impact of immigration on employment by saying that the “literature on employment impacts finds little evidence that immigration significantly affects the overall employment levels of native-born workers.” However, they do note that there is some evidence that immigration can impact the number of hours worked by teenage “natives”, although with no impact on their employment rate. Equally, they also point to a number of studies which have found a positive impact of high-skilled immigration on the employment of college and non-college educated “natives”.
New analysis conducted for this report
1.23. Given the relatively few new pieces of evidence since 2014, we carried out an update to the existing Dustmann, Fabbri and Preston (2005) paper. The original study used data between 1983 and 2000 to estimate the impact of immigration on employment. We update this to include the most recent data and to separately estimate the impact of EU immigrants. Details of this analysis can be found in Annex C.
1.24. Table 1.2 below reports the updated estimates. The estimated impacts can be interpreted as the percentage point change in the dependent variable for the UK-born working age population in response to an increase in immigration equivalent to one per cent of the UK-born working age population.
1.25. In trying to interpret how economically significant the magnitude of any individual study’s estimates are it is useful to consider not just the marginal effect but also the implied total effect given the realised change in the measure of immigration used. This exercise should be interpreted with caution as the
36 An inflow from accession member states between 2001 and 2011 equivalent to 1.2 per cent of the
2001 population.

27
model only estimates the short-run response to migration and there is some theory and evidence to argue that the long-run response is smaller.37
1.26. Between 1983 and 2017 the ratio of working age EU immigrants to the working age UK-born population increased from 1.3 per cent to 7.9 per cent, a growth of 6.6 percentage points. Combining this with the estimates in Table 1.2 results in the suggestion that the EU immigration over this 34 year period has reduced the employment rate of the UK-born working aged population by around 2 percentage points, increased the unemployment rate by around 0.6 percentage points and also decreased the participation rate by 1.8 percentage points compared to a scenario with no EU immigration.38
Table 1.2: Updated estimates using Dustmann, Fabbri and Preston (2005) (DFP) approach
Dependent variable
Impact on UK-born group
All Adv. Education
Inter. Education
Low. Education
16-24 yrs
25-64 yrs
DFP specification - Updated Estimates (1983-2017)
All immigrants
Employment rate
-0.094*** -0.031 -0.280*** -0.086 -0.346*** -0.029
Unemployment rate
0.042** 0.016 0.080*** -0.05 0.106 0.037**
Participation rate
-0.072*** -0.02 -0.240*** -0.117 -0.316*** -0.007
EU immigrants
Employment rate
-0.311*** -0.207*** -0.562*** -0.337*** -0.956*** -0.171***
Unemployment rate
0.089*** 0.086*** 0.195*** -0.246*** 0.386*** 0.076***
Participation rate
-0.275*** -0.146*** -0.471*** -0.522*** -0.869*** -0.136***
37 See, for example http://www.nber.org/papers/w24285. 38 Coefficients, -0.311 employment rate, 0.089 unemployment rate, -0.275 participation rate (bottom
three estimates in column 3 of table 1.2)

28
Robustness specification (1983-2017)
EU immigrants
Employment rate
0.362 0.104 0.351 0.242 0.874*** 0.277
Unemployment rate
-0.654*** -0.361*** -0.809*** -1.028*** -1.145*** -0.525***
Participation rate
-0.121 -0.217 -0.311 -0.459 0.013 -0.108
All rows use Labour Force Survey data for those aged 16-64. Regressions include time dummies, the average age of immigrants and UK-born workers, and the relative UK-born worker skill supplies. Low education refers to no formal qualification; intermediate education to O-levels (or equivalent); and advanced education to A-levels or college/ university degrees. "Robustness specification" is specification (7) from Annex C. This differs from original DFP model by including region fixed effects and region trends. Estimates use 1991 immigrant shares as instruments. Statistical significance: *** 1%, ** 5%, * 10%
1.27. It is also useful to place these estimates in context: over this same period the employment rate for the working age UK-born population increased from 63.9 per cent to 74.8 per cent while the unemployment rate fell from 11 per cent to 4.3 per cent. Of course, in between these dates labour market outcomes fluctuated significantly in response to wider macroeconomic conditions. Currently the employment rate is at a historic high and the unemployment rate close to a historic low, including if we just consider the UK-born, so we should be cautious in suggesting these outcomes could be much better than they already are.
1.28. We also subject the original Dustmann, Fabbri and Preston (2005) specification to a series of additional robustness checks. A full explanation of these additional checks can be found in Annex C. The robustness estimates reported above in Table 1.2 follow the original specification but estimates the model in levels rather than first differences, allowing for the inclusion of region fixed effects and region trends. It also utilises a time varying version of the 1991 immigrant share instrument. When adjusting the model in this way a number of the previously statistically significant estimates become insignificant. In fact, almost all of the estimates measuring the impact of EU migrants on UK-born employment and participation rates become insignificant, with the exception of the employment rate for those aged 16 to 24 years old - which changes sign to indicate a positive impact. However, under this new specification, the coefficients measuring the impact of EU migrants on UK-born unemployment rates remain statistically significant and all become negative with increased magnitude.
1.29. These checks demonstrate how sensitive conclusions from individual studies can be to differences in methodology and how difficult it can be to estimate the impact of immigration on sub-groups of the population with precision. It is

29
therefore important not to overemphasise the point estimates of a single study, but rather to consider the literature as a whole.
Conclusion
1.30. Taking all the relevant new evidence into account it remains the case that the majority of studies find no or little impact of immigration on the employment and unemployment outcomes of the UK-born workforce.
1.31. There is evidence of differential impacts across different UK-born groups, with more negative effects for those with lower levels of education and more positive effects for those with higher levels of education. However, as our robustness checks show, these findings are subject to a significant degree of uncertainty.
Wages of employees
Current evidence
1.32. The evidence on the impact of migrants on the wages of the UK-born is very similar to the evidence on employment effects. In general, the existing literature finds migrants only have a very small impact on the wages of UK-born workers on average. Where a significant impact is found the direction of the impact tends to differ along the wage distribution. We summarise these, and other, high level findings in Table 1.3 below.
1.33. There have been relatively few new UK-focused studies on the wages of employees since our last review of the evidence in 2014. One key exception is an update to the Nickell and Saleheen (2008)39 paper. In the updated 2015 study40, Nickell and Saleheen re-estimated these relationships using an improved methodology and included data up to 2014. The updated estimate of the impact of immigrants on the average wage within occupations is not much changed compared to the earlier study. However, the new estimate for the impact within semi/unskilled services is considerably smaller. The 2015 paper estimated that a 10 percentage point rise in the proportion of migrants in this occupation group leads to a 1.9 per cent reduction in pay, compared to the earlier estimate of a 5.2 per cent fall. The Nickell and Saleheen studies are interested in the impact on the average wage across immigrants and UK workers. They capture both the change in UK-born pay as a result of immigration and the compositional impact of an increasing share of immigrants though they try to deal with the latter point by using estimates of within-occupation pay differentials between migrants and UK-born workers. They estimate the compositional impact of migrants within the semi/unskilled services occupations is to reduce average wages by around 0.5 per cent, or around one quarter of the overall estimated impact.
39 Nickell, S. and Saleheen, J. (2008). The Impact of Immigration on Occupational Wages: Evidence
from Britain. SSRN Electronic Journal. 40 Nickell, S. and Saleheen, J. (2015). The Impact of Immigration On Occupational Wages: Evidence
from Britain. SSRN Electronic Journal.

30
1.34. In addition to Nickell and Saleheen (2015), the previously mentioned 2018 study by Becker and Fetzer also touches on the topic of the impact of immigration on wages. They find that for a local authority experiencing the median “immigration shock”41 from the new EU member states there is an associated reduction in average wages of around 0.5 per cent, with modestly larger impacts at the lower end of the wage distribution. As with the Nickel and Saleheen approach, this study also considered the impact on the wages of immigrants and UK workers, not just of UK workers, and so the estimated effects also capture a compositional component.
Table 1.3: Summary of existing literature examining the impact of immigration on wages
Result Description Supporting paper(s) Little impact of immigration on the wages of UK-born workers overall
Nickell and Saleheen (2015) find that a 1 percentage point increase in the proportion of migrants relative to UK workers will lower average wages by just under 0.1 per cent. Other studies, such as Dustmann, Frattini and Preston (2013), find positive average effects of a similar magnitude. Studies differ on the direction of the effect but tend to agree it is small.
Dustmann, Fabbri, Preston & Wadsworth (2003), Dustmann, Fabbri & Preston (2005), Manacorda, Manning & Wadsworth (2006)42, Lemos & Portes (2008), Nickell & Saleheen (2008) Reed & Latorre (2009), Nathan (2011), Dustmann, Frattini & Preston (2012)43, Nickell & Saleheen (2015), Becker & Fetzer (2018)
Greatest effects tend to be concentrated on lower waged workers
Dustmann, Frattini and Preston (2013) find that a 1 percentage point increase in the migrant/non-migrant ratio leads to a 0.6 per cent decrease at the 5th wage percentile and a 0.5 per cent at the 10th percentile but beyond these the impact is positive. Nickell and Saleheen (2015) similarly found that a 1 percentage point increase in themigrant/non-migrant ratio in the semi/unskilled service occupation group led to a reduction of wages for those in that group of around 0.2 per cent, larger than can be accounted for purely by compositional changes.
Dustmann, Frattini & Preston (2013), Nickell & Saleheen (2015)
41 A flow of new member state migrants equivalent to 1.2 per cent of the 2001 population. 42 Manacorda, M., Manning, A. and Wadsworth, J. (2006). The Impact of Immigration on the Structure
of Male Wages: Theory and Evidence from Britain. CEP Discussion Paper, (754). 43 Dustmann, C., Frattini, T. and Preston, I. (2012). The Effect of Immigration along the Distribution of
Wages. The Review of Economic Studies, 80(1), pp.145-173.

31
Wage effects are likely to be greatest for resident workers who are themselves migrants
Manacorda, Manning and Wadsworth (2012) find that recent immigrants are particularly sensitive to new immigrant inflows but that overtime they become less sensitive with longer-term migrants being closer substitutes to UK workers.
Manacorda, Manning & Wadsworth (2012)44
1.35. International evidence, broadly mirrors the results from the UK literature. The
National Academies report concluded that, when measured over a period of more than 10 years, the impact of immigration on the wages of “natives” was “overall very small” but that estimates for particular sub-groups spanned a wider range. Where negative wage effects did exist, it was prior immigrants who were most likely to experience them, followed by native high school dropouts. They also highlighted the possibility of positive wage impacts for some sub-groups of workers in response to inflows of skilled immigrants.
New analysis conducted for this report
1.36. As with employment we have replicated and updated a key paper from the literature on the impact of immigration on UK-born wages, in this case Dustmann, Frattini and Preston (2012). We updated this to take advantage of the latest set of data; while the original study used the Labour Force Survey between 1997 and 2005, we included data for the period 1993-2017. The original paper found that a 1 per cent increase in the immigrant-native working age population ratio led to a 0.5 per cent decrease in wages in the 1st decile, and a 0.6 per cent and 0.4 per cent increase in wages at the median and 9th decile respectively over the period 1997 to 200545. The sizes of the estimates are sensitive to the choice of instrument, but the pattern across the wage distribution remains.
1.37. Our replication of these results yielded very similar estimates (see Annex C). Table 1.4. below presents our updated results. The table sets out the results generated when using 1991 immigrant shares as an instrument due to the coefficients being more precisely estimated.
1.38. The new updated results show the same pattern of effects across the UK-born wage distribution as in the original study, with negative impacts at the bottom of the distribution and positive impacts at the top. In terms of magnitude, the estimates for all immigrants are similar to those from the original paper. These suggest that for a 1 percentage point increase in the EU-born working age population ratio there is an associated 0.8 per cent decrease in UK-born wages at the 5th percentile, a 0.7 per cent fall at the 10th percentile, a 0.2 per cent reduction at the 25th percentile, a 0.2 per cent rise at the 50th percentile, 0.3 per
44 Manacorda, M., Manning, A. and Wadsworth, J. (2011). The Impact Of Immigration on the Structure
of Wages: Theory and Evidence from Britain. Journal of the European Economic Association, 10(1),
pp.120-151. 45 Table 4 of Dustmann, Frattini and Preston (2013), IV results using four-period lag.

32
cent increase at the 75th percentile and a 0.7 per cent and 0.5 percent increase at the 90th and 95th percentiles respectively.
1.39. Given the 6.7 percentage point increase in the EU-born working age population ratio between 1993 and 2017 the implied total effect on UK-born nominal wages of EU immigration is of the order of a 5.2 per cent reduction to the 5th percentile a 4.9 per cent reduction at the 10th percentile, a 1.6 per cent reduction to the 25th percentile, a 1.6 per cent increase at the median, a 2.2 per cent increase at the 75th percentile and a 4.4 and 3.1 per cent increase at the 90th and 95th percentiles respectively. As previously stated this type exercise should be interpreted with caution as the model only estimates the short-run response to migration. Economic theory, and evidence, suggests that any short-run impact is likely to dissipate overtime.
Table 1.4: Updated estimates of the impact of immigration on UK-born wages using Dustmann, Frattini and Preston (2012) approach
UK-born wage
UK-born sample
DFP specification Robustness specification
All EU All EU
Updated Estimates (1993-2017)
Mean
All 0.045 0.040 -1.131** -2.480***
High-ed 0.149*** 0.279** -0.332 -2.032***
Inter-ed -0.062 -0.269 -1.609 -3.384***
Low-ed -0.617*** -1.378*** -4.758*** -2.391
25-64 yrs -0.002 -0.087 -1.028* -2.220***
16-24 yrs -0.249*** -0.595*** -2.853*** -1.884*
5th
All
-0.287*** -0.780*** 0.178 0.797
10th -0.252*** -0.731*** -0.192 -0.478
25th -0.045 -0.233*** -0.692** -1.945***
50th 0.122*** 0.236*** -0.068 -1.573***
75th 0.154*** 0.322*** -0.442** -1.743***
90th 0.274*** 0.656*** -0.163 -1.276**
95th 0.211*** 0.469*** 0.012 -2.231**
All rows use Labour Force Survey data for those aged 16-64. Regressions include time dummies, the average age of immigrants and UK-born workers, and the relative UK-born worker skill supplies. Low education refers to no formal qualification; intermediate education to O-levels (or equivalent); and advanced education to A-levels or college/ university degrees. "Robustness specification" is specification (7) from Annex C. This differs from original DFP including region fixed effects and region trends. Estimates use 1991 immigrant shares as instruments. Statistical significance - *** 1%, ** 5%, * 10%

33
1.40. Again, it is useful to place these estimates in context. Over this whole period (1993-2017), hourly real wages for UK-born workers increased by 55 per cent and 46 per cent at the 5th and 10th percentile respectively, 37 per cent at the 25th percentile, 34 per cent at the median, 33 per cent at the 75th and 32 per cent at the 90th percentiles and finally 39 per cent at the 95th percentile. These estimates therefore suggest that EU immigration had a relatively small impact on overall wage growth.
1.41. As with the analysis carried out on employment/unemployed we again apply some robustness checks to our replication and extension exercise (full details can be found in Annex C). The addition of regional trends again causes a number of previous statistically significant estimates to become insignificant, notably those coefficients estimating the impact of all migrants on percentiles of the UK-born wage distribution. However, the alterative specification also causes some coefficients to become negative and larger in magnitude, notably those estimating the impact of EU migrants on UK-born wage percentiles.
1.42. This demonstrates the sensitivity of these empirical results to different modelling choices. Once again highlighting the caution with which anyone point estimate should be treated.
Conclusion
1.43. Taken altogether the existing evidence and the analysis we presented here suggests that immigration is not a major determinant of the wage growth experienced by existing residents. There is some suggestion that the impact on lower skilled groups may be more negative than for higher-skilled groups, but again these estimates are imprecise and subject to uncertainty.
Earnings of the self-employed
Current evidence
1.44. We are not aware of any published empirical studies investigating the impact of immigration on the earnings of the self-employed in the UK. Given the rise in the importance of self-employment among the UK-born and the over-representation of migrants in self-employment, as well as the lack of some of the institutional protections afforded to employees (e.g. the minimum wage), this may be an important omission. Self-employment has grown as a share of total employment, up from around 12 per cent in 2001 to just over 15 per cent in 2017 and has also contributed around one third of all net employment growth since 200746.
1.45. Figure 1.6 below shows the evolution of the self-employment share of total working age employment by country of birth47. It highlights that migrant groups, both EEA and non-EEA, are more likely to be self-employed than UK-born
46 “Trends in self-employment in the UK” ONS (2018) 47 The figures for the migrant groups are more variable because the sample sizes are small.

34
workers (conditional on being in employment) and that self-employment has become more prevalent for most country of birth groups since the mid 2000’s, with the expectation of the EU13+ grouping.
Figure 1.6: Self-employed share of total employment (16-64)
Source: Labour Force Survey and Annual Population Survey (*NMS series starts in 2004)
1.46. Overall growth in self-employment since 2001 has been strongest amongst older workers (65+ year old), younger workers (16-24 years old) and by those with higher levels of education42.
1.47. According to the latest data (APS 2017) the EEA share (EU13+ and NMS) of self-employment, at 7.8 per cent (8.5 per cent 16-64 years old), is slightly higher than their share of employees, 7.0 per cent (7.4 per cent 16-64 year olds).
1.48. Perhaps more importantly self-employed EEA immigrants are particularly concentrated in certain sectors and occupations. For example, according to the 2017 APS around 40 per cent of self-employed EEA workers can be found in just three sectors (Construction of buildings; Specialised construction activities; and Services to buildings and landscape) and around one third are concentrated in just five occupations (Construction and building traders; Cleaners and domestics; Carpenters and joiners; Elementary construction occupations; and Painters and decorators).
10%
11%
12%
13%
14%
15%
16%
17%
18%
19%
1997 1999 2001 2003 2005 2007 2009 2011 2013 2015 2017
Share of total employment (16-64)
UK + ROI EU13+ NMS* Non-EEA

35
“CITB research…revealed that migrants value the increased flexibility self-employment offers, as it enables the workers to pick up extra work to earn more, move from site to site as opportunities arise, or periodically travel to their country of origin.”
CITB response to MAC call for evidence
1.49. The self-employed earn less, on average, than employees. Median weekly self-employment income in the financial year 2015/16 was around £240 compared to £400 for employees48. Analysis of the Family Resources Survey by the Resolution Foundation in 2016 found that median self-employment earnings were lower in 2014/15 than in 1994/95 in real terms49.
1.50. The lack of existing evidence stems from the absence of information on self-employment earnings in large-scale surveys, such as the Annual Survey of Hours and Earnings, the Annual Population Survey and the Labour Force Survey. While the Family Resources Survey does capture information of both self-employment earnings and country of origin of respondents, it’s relatively small sample size (around 20,000 observations) makes it potentially unsuited to the types of analysis needed to make causal inferences.
1.51. We are not able to fill this evidence gap here, however, in the section that follows we present some descriptive statistics on the earnings of the self-employed by nationality using the combination of two administrative datasets.
Evidence on the earnings of the self-employed from HMRC self-assessment data
1.52. In this section we present analysis generated by combining two administrative datasets. The first are the data collected by HMRC from Self-Assessment (SA) tax returns and the second are data collected by the Department for Work and Pensions (DWP) which provides the nationality of individuals at the point they register as an adult for a National Insurance number (NINo), also known as the Migrant Worker Scan (MWS). When used in conjunction, these datasets allow us to investigate the earnings of the self-employed by nationality50. We provide a more detailed description and discussion of these datasets in Annex C.
1.53. The analysis described in this section is not designed to establish anything about the impact of immigration on the prospects of the UK-born self-employed. We only present descriptive statistics generated from these administrative
48 Department for Work and Pensions, Family Resource Survey 49 https://www.resolutionfoundation.org/media/press-releases/typical-earnings-of-the-self-employed-
lower-than-20-years-ago/ 50 The same groupings are used here as elsewhere in the report (i.e. UK + Ireland, EU13+, NMS and non-EEA). In line with the rest of the report where we refer to “UK nationals” we are referring to a group that contains both UK and Irish nationals, this is done for convenience.

36
datasets. Given inherent limitations of the underlying data, which we discuss later, caution should be applied when interpreting these statistics.
1.54. There are a number of ways an individual can be self-employed51. The definition of self-employment available to us is those individuals who submit an SA return, in paper or online, and who are structured either as a sole-trader or as a partner in a Business Partnership52. This definition misses those individuals who work for themselves through a limited company and distribute profits to themselves either as an employee or through issuing dividends. There is some evidence that this has been an increasing trend in recent years (see Annex C for more details) and so care should be taken when interpreting changes in figures presented due to potential compositional changes in the group of self-employed workers captured.
1.55. There are also limitations associated with the Migrant Worker Scan (MWS). This dataset captures the self-reported nationality of adult migrants at the point of registering for a National Insurance Number (NINo). As discussed previously nationality is not our preferred definition of whether an individual is a migrant or not. In addition, the dataset does not include those migrants who did not need to register as an adult for a NINo, for example because they were automatically assigned one at the age of 16. In line with the rest of the report where we refer to UK nationals we are actually referring to a group that contains of UK and Irish nationals – this is done for convenience.
1.56. With these limitations in mind, and others discussed in Annex C, we set out in Figure 1.7 a time series of the median working age self-employment earnings53 by nationality for the tax years 1996/97 to 2016/17 adjusted by CPI. As we are interested in individuals whose main activity is self-employment we subset our sample to only include those individuals who earn more through self-employment54 than employment55. Approximately one quarter of individuals across the whole sample have some employment income as well as self-employment earnings. Restricting our sample in this way increases the median self-employment to employment earnings ratio (for those individuals with both) from around 0.3 to 3.0. We also remove observations in the top and bottom 0.5 per cent of the earnings distribution to remove extreme values56. We apply this set of filters to all the earnings data presented in this section.
1.57. The earnings of the self-employed (all nationalities) in 2016/17 (generated from being a Sole Trader or partner in a Business Partnership) were between 15 and
51 https://www.gov.uk/working-for-yourself 52 Self-employment pages are excluded if profit, loss, turnover and allowable expenses are all equal to zero. Partnership pages are excluded if the individuals share of the business profit or loss is zero. Short tax returns are excluded if the profit or loss is zero. 53 Declared self-employment profit/loss and/or share of business partnership profit/loss. 54 As measured by declared pre-tax profit 55 Taken as taxable earnings which are net of pension contribution (and other non-taxable payments) 56 For the subset of individuals selected (16-64 years old, greater self-employment than employment
earnings) this means we exclude those with self-employment earnings less than -£17k and greater
than £320k (approximately).

37
25 per cent below where they were in 1996/97 in real terms. Some of this reduction may reflect changes in the composition of the types of people engaged in self-employment or changes in the type of work undertaken by the self-employed (such as hours worked).
Figure 1.7: Median working aged (16-64) self-employment earnings by nationality adjusted by CPI57
Source: Analysis of Self Assessment and NINo registration data
1.58. Interestingly, and in contrast to employment earnings, NMS nationals have higher median earnings than other immigrant groups – at least by the end of the period. However, this is not true for mean earnings, indicating other migrant groups have higher earning top ends to their self-employment income distributions58. Figure 1.8 below present the differential in mean earnings between nationality groups in 2016/17, showing a negative differential for all nationality groups compared to the approximate £18,400 mean for UK nationals. This negative difference remains after controlling for sex, age, travel-to-work area, industry59, whether an individual also has employment income,
57 For those individuals whose main source of income is from self-employment. 58 The distribution of self-employment income, as with most earnings distributions, exhibits a rightward
skew and heavier tales than a standard normal distribution. The income variable used (after the filters
described earlier have been applied and once adjusted for CPI) has a skewness of 4.3 and excess
Kurtosis of 25.1 when measured over the whole sample period (1996/7-2016/17). 59 Generated from the self-reported “business description”, relying on an Automated Classification
Text Recognition tool to match descriptions to a 5 digit SIC 2007 code. Where an individual returns
both an self-employment and business partnership return, the business description from the return
reporting the highest earnings is used.
£0
£2,000
£4,000
£6,000
£8,000
£10,000
£12,000
£14,000
£16,000
1996/9
7
1997/9
8
1998/9
9
1999/0
0
2000/0
1
2001/0
2
2002/0
3
2003/0
4
2004/0
5
2005/0
6
2006/0
7
2007/0
8
2008/0
9
2009/1
0
2010/1
1
2011/1
2
2012/1
3
2013/1
4
2014/1
5
2015/1
6
2016/1
7
Median self-employment income
UK + ROI EU13+ NMS Non-EEA

38
whether an individual has positive employee costs or not60, the year they first appeared in the data set and the number of times they have appeared in the dataset (to somewhat capture the impact of business age)61. The proportion of the variation in earnings that can be accounted for by nationality alone is just 0.5 per cent, after including these additional characteristics the variation accounted for by the regression model increases to around 21 per cent. While NMS nationals have the largest raw differential, the adjusted differentials for each of the migrant groups are of a very similar magnitude.
Figure 1.8: Adjusted62 and unadjusted difference in average working aged self-employment earnings compared to UK nationals in 2016/17
Source: Analysis of Self Assessment and NINo registration data HMRC and DWP data
1.59. As with the other like-for-like comparison exercises we present in this report, the presence of statistically significant differentials between migrant and non-migrant groups does not establish that migrants earn less for the same work. We can only control for the characteristics we can observe, unobserved characteristics may explain any differential that remains.
1.60. This concern over unobserved characteristics is even greater in this case. Unlike in the case of survey data the use of tax returns data means we are unable to standardise earnings for the amount of time worked, both in terms of hours per week and number of weeks per year. Differences in self-employment earnings between groups (such as those presented above in Figure 1.8) will, at
60 Based on whether an individual reports positive employee costs in the self employment pages of
their tax return or not. This information is not required from business below the VAT threshold. 61 All variables are estimated as a series of dummy variables. 62 Covariates include sex, age, travel to work area, industry, dummy variable indicating whether an
individual also has employment income and a dummy variable indicating whether an individual has
declared positive employee costs.

39
least in part, reflect differences in the length of time worked during a tax year. Another key determinate of earnings is an individual’s occupation. Tax returns do not provide any detail about occupation and therefore we cannot “control” for its influence when measuring differences between groups. Given the absence of key control variables, as well as the sensitivity of the adjusted coefficients to model specification, we do not believe it is possible to conclude with any certainty the existence or the extent of earnings differentials between self-employed migrant and non-migrant groups.
1.61. Self-employed individuals may supplement the income they generate from their business with income from other sources. Figure 1.9 presents the average (mean) total income broken down by source for each nationality group in the tax year 2016/17. Applying the same filters to the data as described earlier but with the addition that sources with negative values are treated as zeros63. The numbers presented in Figure 1.9 do not necessarily reflect the experience of the ‘typical’ individual but instead presents an imaginary ‘average’ person. For example in 2016/17 only around 2 per cent of individuals indicated they had both income from being a Sole Trader and income from a Business Partnership.
Figure 1.9: Mean total income by source of income for primarily self-employed working aged individuals in 2016/17 by nationality64
Source: Analysis of Self Assessment and NINo registration data
1.62. It shows that in the sample of individuals we are looking at, the majority of their
income comes from earnings generated as a Sole Trader, followed by income from a share in a Business Partnership. As we are only considering working-aged individuals the dominance of labour income is unsurprising. The only striking difference between the nationality groups is that NMS nationals appear
63 This is a reflection of the way the data is recorded. 64 “Other” income includes income from property, shares, dividends, trusts, interest, pensions, foreign
income, life policy gains and other income.

40
to have much lower levels of income from sources other than being a Sole Trader.
1.63. Lower levels of Business Partnership income amongst NMS nationals primarily reflects lower levels of use of that method of self-employment. In 2016/17 under 2 per cent of the identified self-employed NMS nationals submitted a return indicating they were part of a Business Partnership, compared to 17 per cent for UK nationals, 10 per cent for Non-EEA nationals and 8 per cent for EU13+ nationals. This may reflect that Business Partnerships are more frequently used for higher-skilled forms of self-employment compared to Sole Trader businesses. We can see this in the higher earnings declared for Business Partnerships compared to Sole Trader ventures, with a difference in mean income of around 150 per cent (2.5 times) in 2016/17.
1.64. A significant advantage of this dataset is that it covers the population of filers rather than a sample, which allows for more disaggregated findings to be presented (subject to satisfying disclosure concerns). For example, the data tell us that the number of NMS migrants submitting SA returns that indicate they worked in the Construction industry in London in 2016/17 was larger than the number of UK nationals’ returns that suggested the same. This was the only sector with substantial numbers of self-employed individuals were this was true and hence is potentially an interesting case study.
1.65. NMS nationals represented around 55 per cent per cent of all self-employed workers in this industry/region combination (according to this dataset) with UK nationals representing only around 30 per cent (down from 80 per cent in 2001/02 but with total numbers of individuals broadly flat). Figure 1.10 presents the mean and median earnings of self-employed UK nationals working in the London Construction sector relative to the overall mean and median self-employment income for UK nationals as a whole65. Against this the NMS share of SA filers in the same region industry combination is also plotted.
1.66. It shows that over a period in which the NMS share increased from less than 10 per cent to over 50 per cent, the real earnings for self-employed UK nationals in the Construction sector in London improved compared to the overall average for UK nationals (across all regions and sectors). Real mean real earnings of UK nationals in the London Construction sector fell by less than 4 per cent again compared to over 20 per cent overall, resulting in mean earnings in the sector overtaking the overall average in 2013/14.
1.67. The relative high performance (although poor performance in absolute terms) of self-employment earnings for UK nationals in a sector with rapidly rising immigrant concentration does not causally establish anything about the impact of migrants on UK national’s earnings. Earnings in the London Construction sector almost certainly benefited from greater growth in demand over this
65 Median = (Median profit of UK nationals in London Construction sector / Median profit of UK
nationals overall) x 100; Mean = (Mean profit of UK nationals in London Construction sector / Mean
profit of UK nationals overall) x 100.
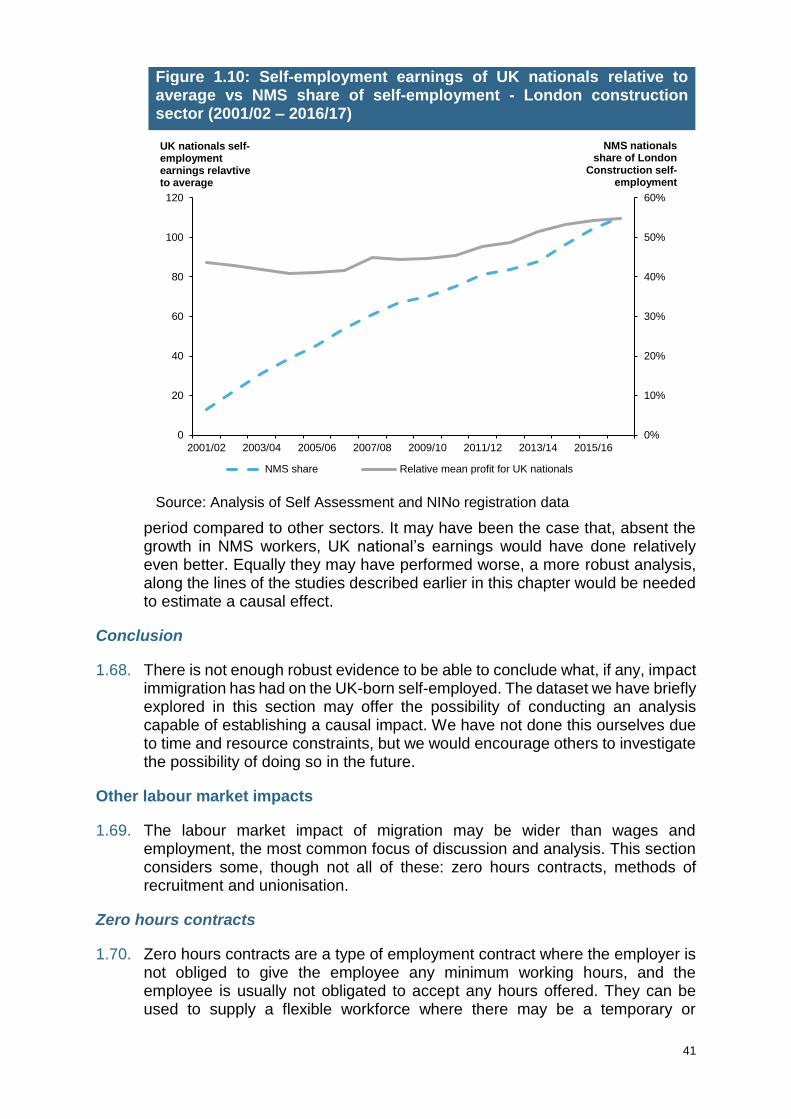
41
period compared to other sectors. It may have been the case that, absent the growth in NMS workers, UK national’s earnings would have done relatively even better. Equally they may have performed worse, a more robust analysis, along the lines of the studies described earlier in this chapter would be needed to estimate a causal effect.
Conclusion
1.68. There is not enough robust evidence to be able to conclude what, if any, impact immigration has had on the UK-born self-employed. The dataset we have briefly explored in this section may offer the possibility of conducting an analysis capable of establishing a causal impact. We have not done this ourselves due to time and resource constraints, but we would encourage others to investigate the possibility of doing so in the future.
Other labour market impacts
1.69. The labour market impact of migration may be wider than wages and employment, the most common focus of discussion and analysis. This section considers some, though not all of these: zero hours contracts, methods of recruitment and unionisation.
Zero hours contracts
1.70. Zero hours contracts are a type of employment contract where the employer is not obliged to give the employee any minimum working hours, and the employee is usually not obligated to accept any hours offered. They can be used to supply a flexible workforce where there may be a temporary or
Figure 1.10: Self-employment earnings of UK nationals relative to average vs NMS share of self-employment - London construction sector (2001/02 – 2016/17)
Source: Analysis of Self Assessment and NINo registration data
0
20
40
60
80
100
120
0%
10%
20%
30%
40%
50%
60%
2001/02 2003/04 2005/06 2007/08 2009/10 2011/12 2013/14 2015/16
NMS nationals share of London
Construction self-employment
UK nationals self-employment earnings relavtive to average
NMS share Relative mean profit for UK nationals

42
changeable need for staff66 but have also come to represent a precarious labour market for workers in which the employer reaps the benefits of the flexibility, whilst the employee may not be able to get the hours they need to earn a sufficient income.
“Significant numbers of EEA migrants are employed in the sectors that make the most use of zero hours contracts, namely accommodation/food and health and social care. Those on zero hours contracts often miss out on key employment rights, including family friendly rights, redundancy pay and sick pay as they are classified in law as ‘workers’ rather than ‘employees’. Workers on zero hours contracts are also likely to be lower paid: the median hourly rate for zero hours workers is £7.25 whereas it is £11.23 for permanent workers.”
TUC response to the MAC call for evidence.
1.71. Zero hours contracts are concentrated in low paid occupations, with 60 per cent of zero hours contracts classified as low, or unskilled67. Figure 1.11 shows the proportion of workers in each migrant group that are on zero hours contracts. The share of EU13+ born workers on a zero hour contract is statistically insignificantly different from the proportion of UK-born in the same position (at around 2.1 per cent), while NMS and non-EEA migrants have the a higher share of workers on such contracts (around 1.5ppts and 1ppts higher than the UK-born).
Figure 1.11: Percentage point difference in the proportion of migrant workers on zero hours contracts relative to UK-born workers
Source: Aggregated Q2 and Q4 2017 Labour Force Survey
66 http://www.acas.org.uk/index.aspx?articleid=4468 67 http://www2.cipd.co.uk/community/blogs/b/policy_at_work/archive/2016/09/21/new-statistics-on-
zero- hours-contracts
-1.0
-0.5
0.0
0.5
1.0
1.5
2.0
EU13+ NMS Non-EEA
percetnage point difference from UK-born
Insignificant Unadjusted

43
1.72. When these differentials are adjusted for a range of characteristics68 in an attempt to compare like for like workers, these differences become statistically insignificant. This suggests that when industry and other characteristics are considered, migrants workers are no more likely than the UK-born to be on zero hour contracts.
Union representation
1.73. Figure 1.12 below shows the union representation compared with UK-born workers average representation. The unadjusted values show that average union representation is over 15 percentage points lower in NMS workers than UK workers, and 8 and 6 percentage points lower for EU13+ and Non-EEA workers respectively. This is likely due to union representation being most prevalent in the public sector where proportions of migrant workers are lower. After adjusting for similar characteristics69 union representation is still lower amongst all migrant groups, but by a smaller amount. It seems likely that EEA migration has reduced average unionization by a small amount through a compositional effect.
Figure 1.12: Union representation by migrant group
Source: Labour Force Survey
Labour market flexibility
1.74. Labour market flexibility is generally thought of as desirable but is not so easy to define. One definition70 is that it is the efficiency of the labour market in
68 Variables used for adjusted regression: age (and age2), sex, region, level of education, tenure with
employer, occupation and industry. 69 Characteristics controlled for are age, sex, qualification level, industry, occupation and tenure with employer. 70 Robert Solow “What Is Labour Market Flexibility: What is it good for?” https://www.britac.ac.uk/pubs/proc/files/97p189.pdf
-18
-16
-14
-12
-10
-8
-6
-4
-2
0
EU13+ NMS Non-EEA
percentage point difference from UK-born
Adjusted Unadjusted

44
matching the unemployed and vacancies. The inverse relationship between unemployment and vacancies is called the Beveridge Curve with unemployment high and vacancies low in recessions and vice versa in booms. The position of this relationship tells us the level of unemployment for a given level of vacancies: a more flexible labour market will have a lower level of unemployment for a given level of vacancies.
1.75. A recent study by the Bank of England71 found that matching efficiency declined from 1995 to 2010 but then recovered to 2015 though remained lower at the end than the beginning of the period. We are not aware of any evidence linking changes in this measure of efficiency to EEA migration.
1.76. Labour market flexibility is also thought to facilitate the reallocation of labour from declining to growing sectors. Using the 2-quarter Labour Force Survey it is possible to identify when respondents have changed occupations or industries, or have re-joined the labour market after unemployment. Figure 1.13 shows ppt differences in the fraction of workers of different migrant groups that changed industry from one quarter to the next compared to the UK-born.
1.77. This data tell us that around 4.1 per cent of UK-born workers changed industries between quarters. The proportions of EU13+ and non-EEA migrants that did the same are statistically insignificantly different from this, while the NMS migrants appear more likely to move. However, after adjusting for a number characteristics72 this differential also becomes statistically insignificant.
Figure 1.13: Labour inflow to industries by skill level
Source: 2-quarter Labour Force Survey73
71 Carlo Pizzinelli and Bradley Speigner “Matching efficiency and labour market heterogeneity in the
United Kingdom” https://www.bankofengland.co.uk/-/media/boe/files/working-paper/2017/matching-
efficiency-and-labour-market-heterogeneity-in-the-uk 72 Variables used to adjust values are: sex, age, tenure with employer, region, industry and
occupation 73 Five datasets pooled to increase the sample size – January-March 2016 to January-March 2017
-1.4
-0.9
-0.4
0.1
0.6
1.1
1.6
EU13+ NMS Non-EEA
percentage point difference from UK-born
Adjusted Unadjusted Insignificant

45
Exploitation
1.78. A number of stakeholders told us of concerns that migrant workers may be subject to exploitation in the UK economy. For instance, the TUC, Usdaw and UNISON said that gaps in the law on employment rights, combined with weak enforcement of employment rules and low collective bargaining coverage, had meant significant numbers of workers were at risk of exploitation and that UK workers employed on insecure contracts were also at risk. Prospect told us that offshoring of work to non-EEA nationals in IT and telecoms had had some impact both at entry level and in reducing opportunities for progression.
1.79. We received a report on labour exploitation74 which highlighted that the nature of the work that many migrant workers do in the UK was often insecure and low-paid, requiring workers to have multiple jobs and work long hours in order to live, and that many could fall into illegal employment where they would be at even higher risk of exploitation.
“In sectors where there is low collective bargaining coverage and less union visibility such as outsourced public services, or where agency workers used, migrant workers as well as all other workers are at risk of being exploited due to inadequate enforcement of employment rules.”
UNISON response to the MAC call for evidence.
1.80. The Migrants’ Rights Network told us that many EEA migrants working in the
UK relied on the flexibility that free movement allowed them to manage the disadvantaged position they found themselves in as migrant workers in the UK’s flexible labour market. Such workers were said to be at risk of being in more precarious work, and the instability of the work often meant they found themselves in a disadvantaged position.
1.81. We received specific examples of exploitation and undercutting in areas such as construction, hospitality, logistics, manufacturing and food production and these are detailed in the evidence published alongside our Interim Update. The Salvation Army told us that their research indicated that EEA victims of labour exploitation were most likely to work in a carwash, with a significant proportion also exploited in factory work, construction and cleaning.
Methods of recruitment
1.82. The methods by which migrants are recruited to work in the UK has been a source of some controversy. The anxiety expressed is that some employers make use of recruitment methods that either completely exclude or significantly disadvantage the UK-born from accessing employment opportunities.
74 “Lost in Transition: Brexit and Labour Exploitation”, Labour Exploitation Advisory Group and Focus on Labour Exploitation, August 2017

46
“One in five (20 per cent) [of recruitment agencies] stated that they sometimes encountered construction employers who expressed a preference for non-UK workers, with 4 per cent saying that this occurred frequently. More than half of agencies (54 per cent), however, said that construction employers sometimes (34 per cent) or frequently (20 per cent) express a preference for workers who are UK passport holders.”
CITB response to MAC call for evidence
“Many…employers use agencies to a greater or lesser extent. In health and social care, agencies are used continuously because of chronic labour and skills shortages in the sector. Most case study employers using agencies do so from within the UK, but a small number use agencies located in Eastern Europe…The use of agencies…seems to be most prevalent in warehouses, where EU nationals often make up the majority of the workforce for elementary roles such as packers. The prevalence of recruitment agencies for low-skilled work is especially high in some of the regions, particularly in the East Midlands and Wales. These patterns are explained by the requirement for high volumes of workers, fluctuating demand, high levels of turnover in addition to the local shortages of labour supply.”
CIPD response to MAC call for evidence
1.83. In August 2015, the Equality and Human Rights Commission75 conducted
research into employer and employee practices, perceptions and experiences in relation to recruitment. The aim was to understand whether there was any evidence of differential treatment between UK-born and foreign-born workers with a right to work in the UK; the extent of discrimination on the basis of nationality, and what may be causing it.
1.84. The report concluded that in most circumstances, employers appointed workers on their ability to do their job, rather than where they came from. The commission found a small number of examples of approaches by employers and recruitment agencies that may lead to potentially discriminatory recruitment practices. There was also evidence of a lack of knowledge about the law, which could also lead to unlawful discrimination.
1.85. Some stakeholders stressed the relevance of continuing to be able to access skilled migrant workers as a key element of delivering the Government’s industrial strategy.
75https://www.equalityhumanrights.com/sites/default/files/research-report-104-recruitment-in-britain-final.pdf

47
“Highly-skilled migrants make irreplaceable contributions to the UK and should be welcomed, not restricted…We face critical skills shortages across numerous sectors and professions which is holding the economy back. Immigration plays a vital role by supplementing skills and plugging these gaps, which is critical for success of the industrial strategy. EEA migrants are also key in filling critical ‘lynchpin’ roles which underpin entire supply chains.”
CBI response to MAC call for evidence
1.86. Other stakeholders suggested that employers have a preference for recruiting
locally
“Businesses use a wide variety of recruitment methods to source skills and labour, with word-of-mouth advertising (50 per cent) and advertising on job search websites (30 per cent) being the most preferred routes. Generally, employers prefer to recruit skills from the local area, broadening this to a national search for more highly skilled candidates. EEA workers are less likely to be recruited where there is a ready supply of UK labour with the skills and attributes required for the role.”
British Chambers of Commerce response to MAC call for evidence
1.87. Data on the reach of job adverts collected by Indeed show that the most
internationally reaching adverts76 are those from high-skill STEM industries. Software technology receives 11.6 per cent of advert clicks from non-UK IP addresses, with non-EEA countries making up the largest portion of these clicks, followed by Poland, France and Italy. The most internationally reaching sectors are software technology, civil engineering, mechanical engineering, mathematics and science. Construction, retail, care and warehousing all receive a very low number of international clicks, despite being sectors with high proportions of migrant workers.
1.88. Table 1.5 below identifies how people obtained their job by different migrant groups. The baseline percentages show the share of UK-born workers recruited by each method. The unadjusted figures show the percentage point difference from the UK-born baseline and the adjusted figures show the percentage point difference after controlling for worker and location characteristics77.
76 Clicks into the adverts by non-UK IP addresses are being used as a proxy for internationally reaching adverts 77 Characteristics controlled for are age (and age2), age left full time education, industry, occupation,
highest qualification and region

48
Table 1.5: Method of obtaining job by migrant group
UK +
Ireland EU13+ NMS Non-EEA
Baseline Unadjusted Adjusted Unadjusted Adjusted Unadjusted Adjusted
Direct application
55.3% -0.3x 1.5x -7.9*** -0.7x -2.8* -0.9x
Agency 9.0% 0.2x -1.5x 7.2*** 3.1** 1.2x -0.8x
Word of mouth
23.9% -2.1x -0.5x 4.6** -1.1x 0.7x 1.0x
Some other method
11.8% 2.2x 0.5x -3.9*** -1.4x 0.9x 0.7x
Statistical significance: x (not significant), * (10%), ** (5%), *** (1%) Source: Annual Population Survey 201778
1.89. The table shows that generally it is not possible to distinguish between EU13+
and Non-EEA workers and UK-born workers when it comes to the method by which they obtained their job. NMS migrants however appear more reliant on agency and word-of-mouth methods and less on direct applications. However, once observable characteristics are controlled for, only the greater reliance on agencies remains statistically significant.
“It is apparent that many employers rely on the relatively informal recruitment practices of word of mouth and, to a lesser degree, speculative applications. They are aware that these methods tend to favour migrants but, since they are very satisfied with the results, have little incentive to change.”
CIPD response to MAC call for evidence
1.90. These patterns were also found in the previous MAC report on low-skilled work.
What is not clear from this data is whether migrant workers are recruited abroad or in the UK.
Conclusion
1.91. We are not able to conclude anything about the causal impact of migrants on the non-wage terms and conditions of UK-born workers. The evidence we have presented suggests that on a like-for-like basis there is no evidence that migrants more likely to be working under a zero hours contract than the UK-born, nor is there evidence that they more likely to switch industries between two given quarters. There is some evidence that migrants are slightly less likely to be a part of a union and that NMS migrants are somewhat more reliant of agencies for finding jobs.
1.92. The “quality” of work is in harder to objectively assess and quantify than the quantity (employment) or price (wage). More qualitative assessments, such as
78 Figures do not sum due to rounding

49
that conducted by the aforementioned Equality and Human Rights Commission, may ultimately offer greater insights than can be extracted from survey sources like the Labour Force Survey.

50
Chapter 2: Productivity, Innovation, Investment and Training Impacts
Key messages
• There is a lot of uncertainty about the impact of immigration on productivity, although most studies conclude there is a positive impact. There is also some evidence to suggest that high-skilled migrants have a more positive effect.
• There is a significant body of evidence which suggest that high-skilled immigrants make a positive contribution to the levels of innovation in their receiving country.
• There is very little evidence on the impact of immigration on investment.
• There is no evidence that migration has reduced the training of UK-born workers.
Introduction
2.1. Productivity is very important. As the economist Paul Krugman put it, “Productivity isn't everything, but, in the long run, it is almost everything. A country’s ability to improve its standard of living over time depends almost entirely on its ability to raise its output per worker.” 79 UK productivity levels compare unfavourably with our competitors and productivity growth has been dismal in the decade since the financial crisis but there are many factors that might be responsible for this.
2.2. Any impact of migration, from inside or outside the EEA, on the level or growth of productivity would be important for us to consider. The problem is that it is very hard to provide clear-cut evidence on these effects. This chapter reviews the evidence both on the overall impact on productivity and what are commonly seen as the most important drivers of productivity: innovation, investment in physical capital and investment in human capital (education and training).
2.3. The Government’s industrial strategy puts productivity front and centre, describing it as seeking to create an economy that boosts productivity and earning power throughout the UK. It identifies five foundations that align to the Government’s vision for a transformed economy and sets four grand challenges to put the UK at the forefront of future industries. We describe at relevant points in this chapter how migration policy can interact with some of these.
79 _https://mitpress.mit.edu/books/age-diminished-expectations-third-edition

51
The context
2.4. It has been widely noted that the UK has suffered from weak productivity growth in recent years compared to historic trends, a problem known as the “productivity puzzle”, and from lower productivity levels compared to other developed nations, an issue known as the “productivity gap”.
2.5. Figure 2.1 below shows the emergence of the so called “productivity puzzle” from 2008 onwards in the UK, with productivity 16.4 per cent below its pre-downturn trend. Other advanced economies have also had a slowdown in productivity growth but it is particularly pronounced in the UK. For example, the comparable level of productivity across the G7 economies (excluding the UK) was some 8.7 per cent below trend in 2016, while in the UK it was 15.6 per cent below.
2.6. Figure 2.2 highlights the gap in productivity levels between the UK and other advanced economies. Germany had a level of productivity around 35 per cent higher than the UK in 2016, meaning the average German worker could produce almost as much output in 3.5 days as a UK worker could in 5.
Figure 2.1: Output per hour (actual and trend)
Source. ONS
Figure 2.2: 2016 Current price gross domestic product per hour worked relative to the UK
Source. International Comparisons of Productivity ONS
60
70
80
90
100
110
120
130
1994 Q1 1997 Q1 2000 Q1 2003 Q1 2006 Q1 2009 Q1 2012 Q1 2015 Q1
(2007=100)
Output per hour Output per hour (trend)

52
2.7. This gap between the UK and other developed countries is a long-term feature of the UK economy and is generally thought to represent differences in economic fundamentals such as levels of investment, quality of education and training, effectiveness of management, as well other structural factors like higher labour market participation compared to economies like France. For example, as Figure 2.3 below shows, the UK has had consistently lower levels of investment than other developed economies. This clearly predates the increase in EEA immigration seen from 2004 onwards.
Figure 2.3: Investment as per cent of GDP
Source: OECD
2.8. There is also evidence to suggest that UK employers have been investing less in training over time and less than employers in other countries. As Figure 2.4 below shows, there have been sharp declines in the percentage of employees reporting that they were engaged in job related training or education in the last 3 months. Additionally, evidence from the Continuous Vocational Training Survey shows that the UK is below the European Union average for the proportion of employees engaged in employer-sponsored vocational training (Figure 2.5).

53
Figure 2.4: Share of workers receiving job related training or education in the last 3 months
Source: Labour Force Survey
Figure 2.5: Per cent of employees engaged in employer-sponsored vocational training
Source: Continuous Vocational Training Survey 2015, Eurostat
17%
19%
21%
23%
25%
27%
29%
31%
1997 1999 2001 2003 2005 2007 2009 2011 2013 2015 2017
Working aged (16-64) employed recieving training
UK + ROI EU13+ NMS Non-EEA

54
2.9. The UK’s innovation performance is perhaps better, although with some relative decline in recent years. In terms of research outputs, as Figure 2.6 shows below, the UK punches above its weight with only 0.9 per cent of the world’s population but over 15 per cent of highly-cited articles in 2014. The UK also had a higher field-weighted citation impact, an indicator of research impact, in 2014 than any other large research-intensive countries (Canada, China, France, Germany, Italy, Japan, US).
2.10. However, growth in a number of research performances metrics has slowed in the UK in more recent years, while it has picked up in other competitor economies. For example, China has seen a 20 per cent annual growth in its share of highly cited articles since 2010 compared to just 0.4 per cent growth in the UK. As a result, China overtook the UK on this metric in 2013.
2.11. Despite the increased competition coming from nations like China, the UK still has an effective research base with more articles and citations per million dollars of R&D expenditure than most comparator countries and above the averages for the G8, EU28 and OECD. The UK does however spend less on R&D as a percentage of GDP than many other comparator economies80.
2.12. While performing well on research measures the UK does worse when it comes to more direct measures of innovation such as share of patents. The UK’s share of global patent applications decreased between 2010 and 2014 by 0.5ppts to 2.0 per cent, while its share of patents granted remained stable at 1.8 per cent. This places the UK below comparator economies such as France and Germany. However around 9 per cent of patents globally cite UK research, a higher proportion that for many comparator nations.
Figure 2.6: UK share of population vs UK share of global innovation output measures, 2014 and 2010
Source: “International Comparative Performance of the UK Research Base 2016”, Report by Elsevier produced for the Department for Business, Energy and Industrial Strategy (BEIS)
80 1.7 per cent compared to 2.3 per cent for the OECD average in 2016 -
https://data.oecd.org/chart/5fDh

55
2.13. In the sections that follow we outline the possible mechanisms by which immigration may impact productivity, and a number of its underlying drivers, as well as outlining the existing empirical evidence. We also present several new pieces of evidence.
Productivity
Theory
2.14. There are multiple ways by which migrants might affect productivity. First, the productivity of the individual migrant might be higher or lower than average leading to a rise or fall in average productivity – what is sometimes called the ‘batting-average’ or composition effect. Second, there might be spill-overs: migrants might affect the productivity of other workers either positively or negatively.
2.15. These spill-overs might materialise in different ways. For example, migrants might speed innovation. Or, migrants might have skills that complement UK workers or may encourage UK workers to acquire higher levels of human capital, allowing UK workers to further specialise. Firms may also react to a ready supply of migrant labour by changing their decisions to invest in physical and human capital, both of which have implications for productivity.
Current evidence
2.16. The existing evidence on the impact of migration on productivity is limited compared to the evidence on the impacts on jobs and wages. Much of the most substantial research to date exploits differences across countries. For example, Ortega and Peri (2014)81, using data on 146 countries, finds a positive and statistically significant impact of migrant share on a countries GDP per capita. The magnitude of the impact is very large, with a 10 percentage point difference in migrant share between two countries being associated with an almost doubling of GDP per capita82. This magnitude of effect stretches credulity: it implies, for example, that living standards in countries like Canada and Australia would only be half the current level if those countries had a similar share of migrants as the UK.
2.17. Boubtane et al. (2016)83, looking at differences across OECD countries between 1986 and 2006, also finds positive impacts of immigration on productivity. In the UK’s case they find a 1 percentage point increase in the foreign-born share of the workforce is associated with a 0.4-0.5 per cent increase in productivity. The paper also finds that an increase in the skills composition of net migration flows also has a positive impact on productivity.
81 Ortega, F. and Peri, G. (2012). The Effect of Trade and Migration on Income. NBER Working
Paper, (18193). 82 Factor of 1.87 – page 21 of Ortega and Peri (2014) 83 Boubtane, E., Dumont, J. and Rault, C. (2016). Immigration and economic growth in the OECD
countries 1986–2006. Oxford Economic Papers, 68(2), pp.340-360.

56
2.18. Jaumotte et al. (2016)84, again using cross-country evidence, finds that 1 per cent increase in the migrant share of the adult population results in an increase in productivity of around 2 per cent. This is substantially larger than found in Boubtane et al. (2016) and, if true, would represent a very significant effect. Interestingly the authors also found no statistically significant difference between the impact of high and low-skilled immigration.
2.19. In contrast De Michelis, Estevão, and Wilson (2013)85 find a negative relationship between productivity growth and employment growth (of which migration is an important part in the UK in recent years), arguably because the growth in capital per worker is slower when the labour force is growing more rapidly. This study does not, however, distinguish between the impact of migrants and existing residents.
2.20. There are a small number of studies that look at evidence within particular countries. Looking at the UK services sector in 2001-2007, Ottaviano, Peri and Wright (2018)86 find that immigrants increase service firm productivity, with immigration inflows equalling 1 percentage point of local employment being associated with a 2-3 per cent rise in labour productivity. Rolfe et al. (2013)87 similarly find a positive association between immigration and productivity at a local level in the UK, but does not attempt to make a causal estimation of the impact.
2.21. The results of these UK studies are mirrored in studies focusing on other advance economies. For example, Peri (2012)88, analysing US state-level data, also found a positive impact of immigration on productivity. Similarly, Trax and Sudekum (2013)89 found a positive impact of diversity by nationality on firm and regional productivity.
New analysis conducted for this report
2.22. Given the relatively limited number of existing UK focused studies in this area we commissioned three new pieces of work for this report.
84 Jaumotte, F., Koloskova, K. and Chaman Saxena, S. (2016). Impact of Migration on Income Levels
in Advanced Economies. International Monetary Fund. 85 De Michelis, Andrea, Estevão, Marcello and Wilson, Beth Anne, (2013), Productivity or
Employment: Is It a Choice?, International Productivity Monitor, 25, issue , p. 41-60. 86 Ottaviano, G., Peri, G. and Wright, G. (2018). Immigration, trade and productivity in services:
Evidence from U.K. firms. Journal of International Economics, 112, pp.88-108. 87 Rolfe, Heather et al. (2013). “Migration and Productivity: Employers’ Practices, Public Attitudes and
Statistical Evidence”. National Institute of Economic and Social Research. 88 Peri, Giovanni (2012). “The Effect of Immigration on Productivity: Evidence from US States”.
Review of Economics and Statistics 94.1, pp. 348–358. 89 Trax, Michaela, Stephan Brunow, and Jens Suedekum (2015). “Cultural Diversity and Plantlevel
Productivity”. Regional Science and Urban Economics 53, pp. 85–96

57
Campo, Forte, Portes (2018)90
2.23. This study follows a very similar approach to many of the studies we discussed in the previous chapter on wages and employment. The authors exploit regional and sectoral differences in the migrant share of the workforce, using an instrumental variable approach, to estimate the impact of immigration on productivity.
2.24. Using data covering the period 2004-2015 they find that a 1 percentage point increase in the share of immigrants within a Local Authority over one year is significantly associated with a 2.95 percentage point increase in productivity (measured as the growth in gross value output per head over the period considered). When long-period changes are considered91, a 1 percentage point increase in the migrant share is associated with an almost identical 2.96 percentage point increase in productivity. When estimated at the more granular Travel-to-work Area level the central estimates are of a similar magnitude and statistical insignificantly different from those estimated at the Local Authority level.
2.25. When disaggregating between immigrants with different education levels the results show that the positive association is being driven by immigrants with at least tertiary education. In both the short and long-term analysis the coefficients on the share of immigrants with less than tertiary education are negative (and statistically insignificant in the long-term analysis), whilst those for skilled immigrants are positive and significant. The authors note however that it is also the case that the instrument performs best for high-skilled migrants.
2.26. When disaggregating estimates by the occupational skill level of migrants the authors found positive and statistically significant results for migrants in higher- skilled occupations. Unlike migrants with lower education, migrants in lower skilled occupations also appear to contribute positively to productivity. However, once again, the authors note that the instrument performs less well for migrants in low-skilled occupations and so the results should be treated with caution.
2.27. The authors were unable to reliably disaggregate the impact of EU and non-EU migration due to weak first stage instrumental variables results.
2.28. A number of robustness checks were carried out. For example, the authors construct and estimate the same models using an alternative measure of migration flows taken from National Insurance numbers. This does not significantly impact the results.
2.29. In line with many of the international studies reported above these estimates are large, arguably too large to be plausible. But they do suggest that the
90 Campo, F., Forte, G. and Portes, J. (2018). The Impact of Migration on Productivity and Native-born
Workers’ Training. 91 Growth in productivity over the full 11 year sample.

58
impact of migration on productivity may be positive, and especially that of high-skilled migrants.
Costas-Fernández (2018)92
2.30. This study takes a different approach from that of Campo, Forte, Portes (2018). It estimates the parameters of a pre-specified production function, which mathematically describes how firms combine inputs to produce outputs, using Labour Force Survey and national accounts data between 1998 and 2014. This allows the author to make inferences about the relative productivity of immigrants versus UK-born workers. The study finds that both migrants in high and low-skilled occupations are, at the margin, more productive their UK-born counterparts.
2.31. The central estimates suggest that the marginal migrant is around 2.5 times as productive as UK-born workers93, with the magnitude being similar for those in high and low-skilled occupations. However, these estimates are subject to a considerable degree of uncertainty, with the 95 per cent confidence interval for the relative productivity of migrants to UK-born workers ranging from 25 per cent more productive to over 500 per cent. Ultimately, we consider some of these values implausible but they do at the very least suggest that there is little evidence that immigrants are less productive than UK-born workers. It was not possible for the author to produce reliable estimates separately for EEA and non-EEA migrants.
Smith (2018)94
2.32. Smith (2018) focuses on the relationship between changes in migrant shares across regions and the Total Factor Productivity (TFP) exhibited by firms in those regions. TFP is a measure of how efficiently labour and capital are combined to produce output and captures aspects of production such as technology and management quality but can also include things like the degree of factor utilisation and the margins firms can charge. Measuring TFP requires the author to specify and estimate a production function, much like in Costas (2018).
2.33. Where this study differs from Costas (2018) is the focus on TFP, rather than labour productivity, and the use of firm level data compared to national accounts data.
2.34. The study finds that higher migrant shares are associated with higher firm productivity, with a 1 percentage point increase in the migrant share resulting in 1.6 per cent increase in TFP.
92 Costas-Fernandez, J. (2018). Examining the Link between Migration and Productivity. 93 i.e. employing one additional migrant will generate 2.5 time more additional output than one
additional “native” worker. 94 Smith, J. (2018). Migration Productivity and Firm Performance A Report for the Migration Advisory
Committee.

59
Conclusion
2.35. Most of the studies we have considered, find that immigration raises productivity. However these estimates are subject to a lot of uncertainty. In many cases the implied magnitude of the effects are implausibly large95 even though there is no obvious methodological flaw to the studies. One common problem is that it is often hard to distinguish the share of migrants from a simple trend at industry or regional level so that other trends are ascribed to migrants or the estimates become very imprecise. This is clearly an area where more work is needed.
2.36. In addition, while the evidence on the differential impact of high versus low-skilled immigration is not entirely conclusive, it seems likely that high-skilled migrants have a positive, and larger, impact on productivity than lower skilled migrants. This is, of course, as we would expect.
Innovation
Theory
2.37. Innovation in product or process is one of the most important drivers of productivity growth. Innovation is referred to 371 times in the Governments recent Industrial Strategy and high-skilled migrants’ contribution to the innovation process was a key theme of a number of the responses we received to our call for evidence. Organisations in sectors generally considered to be more reliant on generating innovations, such as the pharmaceutical sector, told us that recruiting high-skilled migrants helped them fill skills gaps and enabled them to remain globally competitive.
2.38. Survey evidence tends to corroborate the claims of individual organisations who cite a lack of skilled staff as a constraint on innovation. The latest UK Innovation Survey96 found that 10 per cent of enterprises engaged in innovation said that lack of qualified personnel was the most important barrier to innovation and that firms engaged in innovation are much more likely to have a higher share of employees who are graduates and STEM graduates than firms not engaged in innovation. This is all as we would expect. More innovative firms tend to be more reliant on skilled and highly educated employees. Of course, migrants are not exclusively highly-skilled STEM graduates and reliance on high-skilled individuals does not automatically mean a reliance on immigration.
2.39. Other respondents to our call for evidence emphasised the role migrants have played in contributing to, or founding, fast growing and highly innovative “start-ups” in the UK. It has been argued that, given the self-selection among migrant groups, migrants tend to be greater risk-takers and more entrepreneurial97. The
95 If we take some of the estimates seriously they would imply that immigration into the UK since 2004
is responsible for more than 100 per cent of productivity growth over this period, implying falls in
productivity levels among the UK-born. We do not consider this to be plausible. 96 https://www.gov.uk/government/statistics/uk-innovation-survey-2017-headline-findings 97 Borjas, G.J. 1999. The Economic Analysis of Immigration, In: O. Ashenfelter and D. Card eds
Handbook of Labor Economics, North Holland, 1697-1760.

60
founding of new firms can contribute to a dynamic firm growth distribution, which can make an important contribution to productivity growth. “Start-ups” have been a key source of breakthrough innovations, rather than just incremental ones. Therefore it may be the case that immigration contributes to innovation output through greater entrepreneurialism
2.40. Other respondents highlighted the disproportionate numbers of migrants in STEM focused PhD programmes and other research positions in the UK. Migrants might simply contribute to innovation directly as researchers and inventors.
2.41. Finally, not only may migrants directly contribute to the levels of innovation they may also enable UK workers to become more innovative, by bringing with them complementary skills and ideas.
2.42. Ultimately, as with the other impacts we have considered so far, we need to turn to some empirical tests of the impact of migrants on innovation to conclude whether these sorts of channels, and others, are meaningfully important.
Current evidence
2.43. There is a relatively recent body of literature covering the impact of immigration on measures of innovation performance, although those with a focus on the UK are limited in number.
2.44. A notable UK paper is that by Gagliardi (2014)98. Using data covering the periods 2002-2004 and 2005-2007 the author finds a positive association between the employment of highly-skilled immigrants in a local area and the share of firms in that area engaged in product and process innovation. Also in the UK context Lee (2014)99, using data for 2004/05, finds that firms with more owners/partners born outside the UK were more likely to be engaged in innovation. In both studies the effects found were relatively small. For example Lee (2014) found that a 10 percentage point increase in the share of migrant owners/partners was associated with a 1 per cent increase in the predicted probability of a firm introducing a new product innovation.
2.45. Similar results are found in other contexts. For example Bosetti et al (2015)100 found a significant relationship between foreign skilled labour and the number of patents and citations across European countries. Hunt and Gauthier-Loiselle
98 Gagliardi, L. (2014). Does skilled migration foster innovative performance? Evidence from British local areas. Papers in Regional Science, 94(4), pp.773-794. 99 Lee, N. (2014). Migrant and ethnic diversity, cities and innovation: Firm effects or city effects?.
Journal of Economic Geography, 15(4), pp.769-796. 100 Bosetti, Valentina, Cattaneo, Cristina and Verdolini, Elena, (2015), Migration of skilled workers and
innovation: A European Perspective, Journal of International Economics, 96, issue 2, p. 311-322.

61
(2010)101 estimate that a 1 percentage point increase in the immigrant share of college graduates’ increased patents per capita by 9-18 per cent in US states.
2.46. A contrasting study, by Bratti and Conti (2014)102, found a negative association between the immigrant share of the population and patent applications in the context of Italy between 2003 and 2008. The authors note that immigration into Italy over this period was predominately low-skilled in nature, separately estimating that while low-skilled immigrants had a statistically significant negative effect, high-skilled immigrants had no effect.
2.47. In addition to measures of immigrant share a significant component of the literature also considers the impact of the diversity amongst migrant groups on innovation outcomes. In the UK context Lee and Nathan (2010)103 found that ethnic diversity within a firm’s workforce was positively associated with the introduction of new equipment and/or new working practices. Nathan (2014)104 also found that greater diversity in terms of geographic origin among inventors in a local area was associated with higher patenting activity. These results are again corroborated by international evidence, such as Ozgen et al (2011)105 which found diversity among immigrant populations in European regions was positively associated with patents per capita.
2.48. The above studies capture the combined effects of immigration/diversity on innovation through composition (i.e. immigrants being more/less innovative than “natives”) and the indirect effect immigration may have on the levels of innovation carried out by “natives”. On the first of these effects Breschi et al (2014)106 found that inventors of a foreign origin in the UK (based on an analysis of names) were between 1.2 and 1.8 times more likely that “natives” to fall into the top 5 per cent of the distribution by number of patents, with this differential being larger for more recent immigrants. In fact Romanian inventors in the UK were the most likely to fall into this group of top inventors, being over 3 times more likely to do so than UK-born.
101 Hunt, Jennifer, and Marjolaine Gauthier-Loiselle. 2010. "How Much Does Immigration Boost
Innovation?" American Economic Journal: Macroeconomics, 2 (2): 31-56. 102 Bratti, Massimiliano and Conti, Chiara, (2014), The Effect of (Mostly Unskilled) Immigration on the
Innovation of Italian Regions, ERSA conference papers, European Regional Science Association. 103 Nathan, M. and Lee, N. (2013). Cultural Diversity, Innovation, and Entrepreneurship: Firm-level
Evidence from London. Economic Geography, 89(4), pp.367-394. 104 Max Nathan; Same difference? Minority ethnic inventors, diversity and innovation in the UK,
Journal of Economic Geography, Volume 15, Issue 1, 1 January 2015, Pages 129–168, 105 Ozgen, C., Nijkamp, P. and Poot, J. (2011). Immigration and Innovation in European Regions.
SSRN Electronic Journal. 106 Breschi, S., Lissoni, F. and Tarasconi, G. (2014). Inventor Data for Research on Migration &
Innovation: A Survey and a Pilot. WIPO Economics & Statistics Series Economic Research Working
Paper, (17).

62
2.49. Evidence on the indirect effect is much more limited and primarily from the US. For example Borjas and Doran (2012)107 found that Soviet mathematicians who came to the US after the Cold War reduced American mathematicians’ research while Moser et al (2014)108 found that German Jews who came to the US after World War Two increased native patenting in chemical fields.
Conclusion
2.50. There is an abundance of evidence from many contexts which suggest that high-skilled immigrants make a positive contribution to the levels of innovation in the receiving country; this is, perhaps, unsurprising.
Investment
Theory
2.51. Investment by firms in new machinery and technologies is a key driver of productivity improvements. A higher level of capital intensity (i.e. a higher capital to labour ratio) is associated with higher levels of labour productivity. Additionally, investment in intangible capital (e.g. branding, intellectual property, organisational capability, software etc.) can also have positive impacts on productivity, particularly when we consider TFP. In the UK investment in intangible assets is similar in size to investment in physical assets109.
2.52. Immigration can increase the supply of labour potential making it easier for employers to expand output by increasing employment rather than investing in machinery and equipment to improve the productivity of existing labour.
2.53. As we noted in our Interim Update, some respondents to our call for evidence emphasised the need to invest in technologies such as automation, while others suggested that there was less scope for doing so given a lack of effective technologies to achieve greater automation in their business.
107 George J. Borjas & Kirk B. Doran, 2012. "The Collapse of the Soviet Union and the Productivity of
American Mathematicians," The Quarterly Journal of Economics, Oxford University Press, vol. 127(3),
pages 1143-1203 108 Moser, Petra, Alessandra Voena, and Fabian Waldinger. 2014. "German Jewish Émigrés and US
Invention." American Economic Review, 104 (10): 3222-55. 109https://www.ons.gov.uk/economy/economicoutputandproductivity/productivitymeasures/articles/exp
erimentalestimatesofinvestmentinintangibleassetsintheuk2015/2018-02-07

63
“In many services sectors the opportunity to substitute labour with technology is simply not possible. This limitation ranges from low-skilled jobs such as waiting or cleaning hotel rooms in the hospitality and tourism sector; right through to large accountancy companies who regularly move teams of accountants, auditors and consultants across the all-island economy to work on projects. Given that the services sector accounts for over 70 per cent of the local economy, the opportunity to close the skills gap with technology would require a quantum leap in terms the technical potential for replacing certain jobs.”
CBI Northern Ireland response to MAC call for evidence
Current evidence
2.54. The evidence on the impact of immigration on levels of investment is extremely limited. To our knowledge there are no UK-focused studies. One US study which sheds some light on this question is Lewis (2011)110. The study attempts to exploit the wave of low-skilled immigration in the United States during the 1980s and 1990s, which was clustered in certain areas, to investigate the impact of the ratio of high school dropouts to graduates in regional labour markets on the adoption of automation technologies in manufacturing plants.
2.55. The author finds that between 1988 and 1993, in those areas where immigration induced the ratio of high school dropouts to graduates to grow more quickly, plants added technology more slowly than in other areas. This finding is consistent with the theoretical discussion above which posits that increases in the supply of lower-skilled labour results in lower levels of investment and hence lower capital-labour ratios.
Conclusion
2.56. It is not possible to draw robust conclusions for the UK in 2018 on the basis of a single study for the US covering a period almost thirty years ago. As such we do not come to a conclusion on the impact of immigration on investment either way. Instead we see this as an area in need of greater study and will reserve judgement until more relevant evidence is available.
Training
Theory
2.57. Investment in human capital is also an important driver of productivity growth. This investment occurs in our educational institutions but also in workplaces. The impact of migration on educational outcomes in primary and secondary education is discussed in Chapter 5 of this report and the impact on tertiary
110 Lewis, E. (2011). Immigration, Skill Mix, and Capital Skill Complementarity. The Quarterly Journal
of Economics, 126(2), pp.1029-1069.

64
education is discussed in our report on international students. This section discusses any impact on employer-provided training.
2.58. It has long been felt that the UK has a particular weakness in the provision of vocational education. As we noted earlier in Fig 2.5, the UK ranked relatively low against other EU countries in the per cent of employees engaged in employer sponsored vocational training in 2015. The same survey also reports that of those employees who did receive some vocational training, the cost (or investment) per participant was much less in the UK than the EU average, at €721 compared to €1,418 (at purchasing power parity). Successive governments have introduced policies designed to address this, such as the introduction of the Apprenticeship levy, and it is stated as an important element of the Government’s Industrial Strategy.
“The TUC is concerned that employers and government have cut funding for skills and are using migration too often as a substitute for long-term investment in training.”
TUC response to MAC call for evidence
2.59. Migrants might lead to a rise or fall in the training of existing residents. They
might lead to a rise if they facilitate expansion of sectors which then require other skilled workers or they might train residents themselves. The incentives of existing residents to train may also be affected by any effect that migrants have on labour markets. On the other hand, it may be more attractive for an employer to hire a ready-trained migrant than to train up an existing resident.
New analysis conducted for this report
2.60. We are not aware of any empirical research into the relationship between immigration and training, both on and off-the-job. Given the lack of existing evidence we commissioned two new pieces of work to inform this report. Both study the impact of immigration on whether UK-born employees have been in receipt of employer-sponsored training over the previous three months.
Campo, Forte, Portes (2018)
2.61. In addition to productivity this study also investigates the impact of immigration of UK-born worker training using variation in migrant share across regions, industries and over time.
2.62. They find consistently positive and generally statistically significant impacts of migration on the training of UK-born workers. For example a one percentage point increase in the migrant share within a Local Authority over the eleven years of the study is associated with around a one percentage point increase in the share “native” workers training. Disaggregating by education or occupational skill level does not generally produce statistically significant estimates.

65
Mountford and Wadsworth (2018)111
2.63. This study also uses the Labour Force Survey (2001-2017) and the same measure of training. The authors find that after adjusting for occupation, demographics and job characteristics, immigrants are slightly less likely to be in receipt of training than UK-born workers (a gap of -0.6 percentage points). The differential for immigrants who arrived as adults with more than a high school education is larger, at between 1-2ppts. These statistically significant like-for-like differentials appear to be driven by non-EEA workers rather than EEA workers. EEA adult migrants, skilled or otherwise, appear to have training rates comparable or lower to those of UK-born workers. This seems to hold when EEA migrants are split into EU13 countries of origin and elsewhere from within the EEA.
2.64. The authors then attempt to exploit the differences in the share of the adult skilled immigrant workforce across sectors to estimate the impact of immigration on the probability of UK-born workers receiving training. They find that the rise in the adult skilled immigrant workforce cannot explain very much of the fall in the training incidence of UK-born workers over this period.
Conclusion
2.65. Overall the research provides no evidence that migration has had a negative impact on the training of the UK-born workforce. Moreover, there is some evidence to suggest that skilled migrants have a positive impact on the quantity of training available to the UK-born workforce. Any potential impact on the quality of training provided is unknown.
111 Mountford, A. and Wadsworth, J. (2018). Jumping Someone Else’s Train? Does Immigration Affect
the Training and Hiring of Native-Born Workers?.

66
Chapter 3: Consumer and House Price Impacts
Key messages
• Migration may affect prices if it alters the balance between supply and demand of goods and services.
• There is some evidence that the prices of some personal services have been reduced by migration, particularly NMS and non-EEA migration.
• There is some evidence that migration has increased house prices. This impact is higher in areas with more restrictive planning policies where it is harder for the housing stock to increase in line with demand.
3.1. Just as immigration can affect the demand and supply for different types of labour, so it may affect the demand and supply for goods and services. If demand is affected more than supply then prices might be expected to rise, while if supply is affected more than demand then prices might be expected to fall.
3.2. In markets where supply can respond easily to changes in demand, prices should reflect costs. Immigration may affect costs through an impact on wages and/or productivity. If these impacts are small – and chapter one suggests they are for wages - then the price effect is also likely to be small. But in markets where supply is restricted and cannot easily respond to changes in demand – housing being a prominent example - prices are likely to reflect demand more than costs.
Consumer prices
3.1. The existing literature on the impact of immigration on consumer prices is small and inconclusive. The 2014 MAC report on low skilled work112 commissioned research on prices which found evidence that immigration had reduced the price of non-traded services in the period 1997-2007 but not afterwards113. No effect was found on the prices of traded goods and services. A study of the United States114 found that an increase in low-skilled immigration decreased the price of personal services, suggesting that the impact was probably through wages. This does not necessarily imply a reduction in the wages of existing residents: if the share of immigrants in personal services rises and immigrants
112https://assets.publishing.service.gov.uk/government/uploads/system/uploads/attachment_data/file/3
33083/MAC-Migrants_in_low-skilled_work__Full_report_2014.pdf 113https://assets.publishing.service.gov.uk/government/uploads/system/uploads/attachment_data/file/3
28006/Impact_of_migration_on_UK_consumer_prices__2014.pdf 114 Patricia Cortes “The Effect of Low‐Skilled Immigration on U.S. Prices: Evidence from CPI Data”,
Journal of Political Economy, 2008

67
earn less than existing residents then prices may fall without those existing residents working in these sectors being harmed.
3.2. To give some idea of trends in the data, Figure 3.1 presents the hourly price of selected personal services over the period 1997-2017 measured relative to median hourly earnings. In the period prior to 2004, the price of many of these services rose relative to median hourly earnings but then remained constant or, in some cases, fell. This is perhaps consistent with the data presented in Chapter 2 showing that the earnings of the self-employed have fallen relative to the earnings of employees though the price of an hour of personal services does not all flow as income to the worker.
Figure 3.1: The price of selected personal services relative to median hourly earnings
Notes: Each line is the median price for the service computed from the CPI Price Quote data divided by median hourly earnings computed from ASHE. For the price quote data, the underlying cell sizes range from 1,512 to 4,255 and for the ASHE data from 131,229 to 317,325.
3.3. Given the lack of existing evidence, we carried out some research ourselves.
One problem with researching the impact of migration on prices is that it is difficult to link the prices of specific goods and services to the importance of migrants in producing them. There are some parts of the Consumer Price Index (CPI) where this is easier than others and we focus on those.
3.4. One part of the research focused on the price of personal services and sought to link this to the share of migrants in the occupations linked to those services. This research exploited the fact that the rise in the share of migrants has been larger in some regions than others, and so essentially compares price changes in regions and occupations with larger and smaller changes in the share of migrants.
3.5. The results, reported in Annex F, find some evidence that migration, particularly NMS and non-EEA migration, has reduced prices, and more so in middle and lower-skilled personal services. The size of the impact is that a 1 percentage

68
point increase in the share of NMS and non-EEA migrants reduces the price of the services by 0.5 per cent. This does not mean that the earnings of, for example, British plumbers are reduced. It may be that, as suggested in our work on the earnings of the self-employed, migrant plumbers are cheaper so more migrants means, on average, a lower cost of plumbing services. There may also be effects on quality of service, though we cannot measure these.
3.6. We performed a similar analysis, also reported in Annex F, that linked some elements of the CPI to industry rather than occupation and this produced similar results. One limitation was that it was not possible to assess the impact of migration on the overall level of consumer prices as only a small fraction of items in the overall index can be linked to specific occupations and/or industries. Additionally, it is hard to know where traded goods are produced as these may be produced in one area but consumed elsewhere. This remains an area where the evidence base is limited.
House prices
3.7. Housing is the largest single item in many household budgets so any impact of immigration on housing costs is important. House prices have risen faster than earnings – the ONS report115 that the ratio of the house price of existing dwellings to annual earnings in England and Wales rose from 3.4 in 1997 to 7.6 in 2017, with most of the rise occurring before 2005 (Figure 3.2 below).
Figure 3.2: Housing affordability ratio116 for newly-built and existing dwellings
Source: ONS
115https://www.ons.gov.uk/peoplepopulationandcommunity/housing/bulletins/housingaffordabilityinengl
andandwales/2017 116 Ratio of median price paid for residential property to the median workplace-based gross annual
full-time earnings.
0
2
4
6
8
10
12
1997 1999 2001 2003 2005 2007 2009 2011 2013 2015 2017
Affordability ratio
New Existing

69
3.8. Migration might affect house prices because the resulting increase in population leads to an increase in the demand for housing.
3.9. Recently, the Ministry of Housing, Communities and Local Government (MHCLG) produced a short document117 on the impact of a number of factors, including immigration, on housing price growth. For immigration, MHCLG estimated the increase in the number of households over the period 1991-2016 due to immigration and then used a prediction of their housing model that a 1 per cent increase in the number of households leads to a 2 per cent increase in prices. They found that the increase in demand from immigration had raised house prices by 20 per cent.
3.10. There are a number of limitations to the MHCLG analysis. The analysis focuses on the impact of immigration on housing demand alone while assuming that the time path for housing supply has been unaffected by immigration, even though some migrants work in construction. It also assumed that migrants form households at the same rate as UK-born and consume housing services in the same quantity as UK-born when there is evidence against both these assumptions.
3.11. The Office for Budgetary Responsibility’s (OBR) house price model118 does not explicitly investigate the impact of migration on house prices but does provide estimates of how the number of households affects prices, given supply. This model also predicts that a rise in migration raises house prices.
3.12. For the UK, the best-known existing academic study that focuses explicitly on the impact of migration on house prices is Sa (2015)119. This study found that an increase in immigration reduced housing prices at the local authority level. Sa suggested this was because existing residents moved away from areas experiencing an increase in migration reducing their demand for housing in that area even as demand from migrants rose. This might suggest that immigration has spill over effects on house prices in areas to which existing residents move: the study found no effect at the regional level.
3.13. We expanded Sa’s study to include more local authorities and a longer time period. Our analysis and results, reported in Annex E, are different from Sa’s. We found that migrants put upward pressure on house prices with smaller estimates than the MHCLG model – we estimate that a 1 percentage point increase in the population due to migration leads to a 1 per cent rise in house prices. But these results should be interpreted with caution as they are sensitive to specification, as in many empirical investigations of the impact of migration in the UK, the results are not reliable if local authority trends are also included in the model.
117 https://www.gov.uk/government/publications/analysis-of-the-determinants-of-house-price-changes 118 http://obr.uk/docs/dlm_uploads/WP06-final-v2.pdf 119 Filipa Sa ‘Immigration and House Prices in the UK’, Economic Journal, 2016,
https://onlinelibrary.wiley.com/doi/abs/10.1111/ecoj.12158

70
3.14. The impact of immigration on the housing market is very likely to depend on policy towards releasing land for residential use. If immigration causes the demand for housing to increase but the supply is restricted, it is not surprising if house prices rise as a result. But increases in housing supply, made possible in part by migrant construction workers, would have militated those effects. The problem the UK has had with housing construction is well-known120 and it is not in our remit to suggest solutions. Our research, described in more detail in Annex E, does suggest that the impact of migrants on house prices is larger in local authorities with a higher refusal rate on major developments, this is one measure of the difficulty of expanding supply. The impacts of migration on house prices cannot be seen in isolation from other government policies on house-building.
120 See for example House of Commons ‘Tackling the Under-Supply of Housing in England’ May 2018
http://researchbriefings.files.parliament.uk/documents/CBP-7671/CBP-7671.pdf

71
Chapter 4: Public Finance Impacts
Key messages
• EEA migrants pay more in taxes than they receive in benefits.
• The positive net contribution to the public finances is larger for EU13+ migrants than for NMS migrants.
• A more selective migration policy could increase the net positive contribution to the public finances – the average level of household income for current EEA migrants at which taxes exceed benefits for EEA is in the region of £30,000.
• The funding formulae used across government are very complicate, and do not always use the most recent population estimates. It is unclear if the extra fiscal contribution of migrants is carried through into funding of public services.
4.1. One area of popular concern about migration is that migrants are a drain on the
public finances, that they consume more in welfare payments and public services than they contribute in taxation. A survey from 2014 found that 43 per cent of the UK population felt that immigrants take out more as services than they put in as taxes; only 31 per cent felt immigrants pay more in taxes121.
4.2. There are a number of existing studies of the fiscal impact of migration in the UK which have varying results, stemming from different assumptions they make. The 2014 MAC report “Migrants in Low-Skilled Work: The growth of EU and non-EU labour in low-skilled jobs and its impact on the UK”122 reviewed these studies in detail. We do not repeat that summary here as these studies are now quite old.
4.3. We commissioned Oxford Economics to assess the fiscal impact of immigration both from inside and outside the EU. We provide a summary of the report below123.
4.4. Even if migrants pay more in taxes than they consume in public services and so provide the resources needed to fund the services they consume, there needs to be some allocation mechanism to ensure that the money flows to the areas where there is increased demand for public services. This chapter also discusses that allocation mechanism.
121 Source: European Social Survey, 2014 122https://assets.publishing.service.gov.uk/government/uploads/system/uploads/attachment_data/file/333083/MAC-Migrants_in_low-skilled_work__Full_report_2014.pdf, 123 The full report can be found on our website, https://www.gov.uk/government/organisations/migration-advisory-committee

72
The fiscal impact of migrants
4.5. Oxford Economics (OE) first provide a static model of the impact of immigration on the public finances for the tax year 2016/17. This is an assessment of the contribution of migrants to the public finances in that year alone
4.6. While a static model is useful in providing an assessment of the short-run current net fiscal contribution, it can be misleading as a picture of the net contribution over the longer-run. This distinction is clearest in the case of expenditures on education. The education of children (whether migrant or not) is an investment for the future (and most studies suggest it is a good investment) providing returns in the form of higher earnings and tax receipts in the future. The costs and benefits accrue over very different time horizons and a static analysis cannot capture this.
4.7. For this reason, the OE report also presents a dynamic model for the 2016 cohort of migrants, assessing the expected costs and benefits over the life-cycle.
4.8. OE use several sources of publicly available data to estimate a wide variety of components of public expenditure and revenue associated with every individual in a representative sample of the population. These are estimates often based on an imputation procedure. For some components of taxes and benefits (e.g. income tax), we had hoped to have real data from HMRC and DWP but we were unable to access this. Later in the chapter we summarise some publicly-available information from these bodies on actual tax and benefit payments though these are only partial pictures. There are many aspects of revenue and expenditure (e.g. VAT payments) where there is no conceivable source of information on actual payments by migrant group.
Static analysis
4.9. Any assessment of the contribution of migrants to the public finances requires some assumptions to be made, some of which are judgment calls. Two important assumptions made in the OE’s static analysis are:
a. The costs of dependent children are assigned to their parents. The expenditure on a UK-born child of a migrant will be assigned to a migrant group on the basis that they would not have been in the UK if their parents had not migrated.
b. Public goods (including, importantly, debt interest) are allocated evenly across the entire population. This assumption makes it harder for migrants to have a positive net fiscal position and the existing public debt would still exist even if the migrants were no longer in the UK.
4.10. Another important assumption is that migration does not affect any other outcomes such as the earnings and employment rates of residents that would impact the public finances. As previous chapters have argued, most of these effects seem small.

73
4.11. In 2016/17, EEA migrants as a whole are estimated to have paid £4.7bn more in taxes than they received in welfare payments and public services. This sounds a very large number but averaged across the adult UK-born population it amounts to £1.70 per week.124 This contrasts with the UK-born population who had a deficit of £41.4bn and non-EEA migrants who had a deficit of £9bn. Within the EEA migrant group, there is a significant difference in net contribution between EU13+ migrants (referred to as OMS migrants by OE) who had a total surplus of £4.4bn compared to £0.3bn for NMS migrants125. There is no doubt that EEA migrants are paying more in taxes than they receive in benefits, even in a fiscal year where the overall deficit is £46bn. If the public finances were healthier, it is likely that the contribution would be even larger.
4.12. To have a comparison that is not dependent on the overall state of the public finances and because total contributions are related to the size of the population, it is helpful to consider per capita contributions on a relative basis as shown in Figure 4.1. The average adult migrant from the European Economic Area (EEA) contributed approximately £2,300 more to the UK public finances than the average adult resident in the UK126. The average non-EEA migrant contributed around £840 less than the average adult resident in the UK. EU13+ migrants contributed just over £3,700 per capita more to the public finances in 2016/17 than the average UK adult: for NMS migrants this figure is £1,040. The average UK-born adult contributed around £70 less than the average adult UK resident.
Figure 4.1: Average annual net fiscal contribution of each migrant and native, relative to the average resident UK adult, 2016/17 (£ per “accountable adult”)
124 Based on adults aged over 16, 2016 figures, taken from:
https://www.ons.gov.uk/peoplepopulationandcommunity/populationandmigration/populationestimates/
articles/overviewoftheukpopulation/july2017 125 Oxford Economics do not include Croatia in their NMS grouping. 126 Both UK born and non-UK born

74
4.13. The most important causes of these differences in fiscal impacts are that EEA migrants tend to have high employment rates (especially NMS migrants – see Figure 1.3) and high earnings (especially EU13+ migrants – see Figure 1.1). This means that they pay a relatively large amount in income tax and NI. They also tend to be younger so that health expenditures and pensions are much lower for them. The non-EEA relative contribution might be found surprising but most non-EEA migrants are not coming to the UK through the work route (when they have to be relatively highly paid) and, as Figure 1.3 shows, they have much lower employment rates.
4.14. All migrant groups are heterogeneous in terms of age, work and family structure so the differences in net contributions within groups are much larger than the differences between groups we have discussed so far. To illustrate this, Figure 4.2 shows, for four stylised households, how the net contribution varied with total household income in 2016/17. For a young single adult (HH1), consumption of public services is low so a household income of just over £10,000 per year is sufficient to “break even” in the sense that taxes paid equal benefits and public services received. This “break-even” income rises to around £45,000 per year for a working couple with two dependent children (HH2) though, as noted earlier, the costs of educating the children should be thought of as investment for the future. As the couple ages and their children leave home (HH3), the break-even point falls to around £25,000 per year (HH3). But as they age and retire (HH4) the break-even point rises to £90,000, reflecting rising pension and health costs.
Figure 4.2: Stylised fiscal “break-even” analysis for specimen migrant households, 2016/17
4.15. For all household types the level of income has a very strong impact on the net fiscal contribution. For each extra pound earned by the household,

75
approximately half flows to the government once all taxes and benefits paid are taken into account127.
4.16. One implication of this is that a selective migration policy in which income and age play an important role has the potential to improve the public finances. Figure 4.3 shows how, averaging across all household types, the net fiscal contribution of EEA and non-EEA migrants varies with annual household income. The “break-even” point seems to be about £30,000 for EEA migrants and UK-born and nearer to £38,000 for non-EEA migrants. The “break-even” point is higher for non-EEA migrants than EEA because non-EEA migrants are more likely to have dependent children and non-working adults in part because family migration is more important. These “break-even” points should be interpreted with caution – a selective migration policy might well alter the mix of households among the migrant flow causing the “break-even” point to change.
Figure 4.3: ‘Break-even’ income levels, 2016/17 (household net contribution by income level of the household’s highest earner, aged 16-64)
Dynamic lifecycle analysis
4.17. While the static analysis is useful as a snapshot of the net fiscal contribution of migrants in the current fiscal year it can be misleading as a measure of the net contribution over the lifecycle. For most individuals their net fiscal contribution is negative while children, positive while of working age and turning negative
127 https://www.ifs.org.uk/publications/8329, Section 4.2, estimates the median effective marginal tax
rate under a 2010/11 tax and benefit system at 49.6 per cent.

76
again in old age. A lifecycle perspective offers an assessment of the longer-term net fiscal contribution. The OE report does this for the 2016 migrant cohort.
4.18. A lifecycle analysis requires making some assumptions about the future. Whether there is an overall deficit or surplus in the public finances matters, as does the emigration rate of migrants, and the earnings progression of those who remain in the UK. The OE report makes reasonable assumptions about the future but it is important to be aware of the considerable uncertainty that inevitably is attached to those assumptions. One other difference from the static analysis is the children of migrants are considered as individuals in their own right.
Figure 4.4: Annual average net fiscal contribution over lifecycle of 2016 cohort, discounted and smoothed (age cohorts, 2016 prices)
4.19. Figure 4.4 shows the annual average fiscal contribution over the lifecycle for the 2016 cohort of arrivals, shown by age of migrant. The lifecycle can be seen clearly: those arriving as working-age adults start with a positive net fiscal contribution which eventually turns negative as they age. Those arriving as children have a negative net contribution initially which then becomes positive as they start to work.
4.20. The 515,000 migrants who arrived in 2016 are expected to make a discounted net contribution of £26.9bn over their lifetime in the UK. We estimate that each additional migrant from the EEA will make a total discounted fiscal contribution of approximately £78,000 over his or her lifetime in 2017 prices. Non-EEA migrants, who had a negative net fiscal contribution in the static analysis, are estimated to have a positive lifetime contribution of £28,000 per head.
Skill level
4.21. Migrants to the UK tend to have a higher level of educational attainment than the UK-born. OE estimated that 63 per cent of adult migrants from EU13+ countries have completed a qualification in higher education or equivalent,

77
while the proportion is 55 per cent of those from non-EEA countries (Fig. 4.5). The level is lower for adult migrants from NMS, at 41 per cent. UK-born are lower than both with only 36 per cent of the adult population having completed higher education or equivalent.
Figure 4.5: Proportion of population by skill level, 2016/17* (Population of migrants in the workforce with and without higher education)
4.22. These higher skill levels amongst migrants may account, with other factors, for their higher average wages. Migrants from EU13+, the highest-skilled group, earn more per hour on average than the other groups while migrants from NMS, the least skilled migrant group, earn the least per hour, as discussed in the Interim Update. Although NMS employees, while relatively well-qualified for the jobs they do, are typically younger and so may have less workplace experience than equivalent UK-born employees.
4.23. Although skill levels don’t have a direct correlation with salaries they do have a significant impact. Migrants are also sometimes employed in roles where their skill levels are not fully utilised and therefore we are unable to study jobs by skills level to fully justify whether skills and fiscal contribution are directly correlated.
4.24. Whilst we recognise skills are important and there is a consensus in the UK-born population that skilled migrants are welcome in the UK, finding a level of skill at which this consensus, mainly based on perception, holds is difficult. Also, although higher skill levels are often perceived as beneficial, those migrants with a lower level of skill also make a net positive fiscal contribution if they come to the UK with no dependents as long as they earn over the £10,000 threshold seen in Figure 4.2.
OBR estimates of the fiscal impacts of migration
4.25. The briefing note we published alongside the Call for Evidence in July 2017 contained a discussion of the work done by the Office of Budget Responsibility
36%
55% 51%63%
41%
64%
45% 49%37%
59%
Native Non-EEA EEA EEA : OMS EEA : NMS
0%
20%
40%
60%
80%
100%
High-skilled Low-skilled
Source: LFS; HESA; Oxford Economics* Note that this only covers individuals who have left full-time education

78
(OBR) on how different migration scenarios affect the public finances. Their work makes the assumption that net inward migrants would have broadly the same age and gender specific characteristics on average as the UK-born population, with the same employment rates, productivity and net contributions to the public finances. The OBR recognised that this assumption might no longer be reasonable if changes in migration policy affected the composition as well as the total number of migrants.
4.26. In contrast, the OE study pays more attention to differences in the characteristics of migrants and the UK-born.
DWP estimates of benefit claims by migrants
4.27. In spite of the widespread belief that migrants are more dependent on benefits than the UK-born, DWP does not routinely produce statistics on this128. There is an annual publication “Nationality at point of National Insurance number registration of DWP working age benefit recipients” which shows the percentage of claimants who had a non-British nationality when given a NINO. The latest statistics Department of Work and Pensions (DWP) statistics129 show that as a percentage of claimants of working age benefit recipients, non-UK nationals make up 13.2 per cent of the working age benefit caseload in November 2017. Of this 13.2 per cent, 4.8 per cent of the total is made up of EU member migrants (lower than their 5.5-5.8 per cent share of the UK population in 2017) and 8.4 per cent were from non-EU countries (very similar to their population share of 8.5-8.9 per cent).
4.28. This publication only contains figures on numbers of claimants and not total expenditure. There are ad hoc statistical releases that contain some information on this130 but nothing systematic. We have been unable to access the data necessary to use actual benefit payments to assess whether migrants are more or less likely to be in receipt of benefits or tax credits.
Conclusion
4.29. Overall EEA migration has a positive impact on the public finances. However, there is a great deal of heterogeneity within this group and it could be even more positive if there was a selective approach to EEA migration which is not available under free movement. Net fiscal contribution is strongly related to earnings and, less importantly, age so that a migration policy that selected on those characteristics could produce even higher gains.
128 See the summary on available statistics at
http://researchbriefings.files.parliament.uk/documents/CBP-7445/CBP-7445.pdf 129 https://www.gov.uk/government/statistics/nationality-at-point-of-national-insurance-number-
registration-of-dwp-working-age-benefit-recipients-data-to-november-2017, Table 1A. 130 For example https://www.gov.uk/government/statistics/analysis-of-migrants-access-to-income-
related-benefits

79
The allocation of public resources
4.30. Even if, as the OE report suggests, EEA migrants provide more than enough revenue to fund the public services they consume, there still has to be a mechanism to ensure those resources flow to where they are needed. This section assesses the adequacy of that resource allocation to manage the consequences of migration.
4.31. The allocation mechanism varies across public services (delivered by local authorities, education, and health authorities) and across the devolved administrations. The intention is to try to equalise the real resources across areas. We are grateful to many public officials who helped us try to understand the funding formulae, but a two-word summary would be that they are “very complicated”.
4.32. We are interested in how an increase in migration changes the flow of resources to reflect a change in the demand for public services. Migration might increase or reduce the demand for public services so a failure of the funding mechanism need not imply that areas of high migration are under-funded.
4.33. At present, migration only makes a direct appearance in funding formulae in a few cases. For example, a variable considering the country of birth composition of a local authority is included in the MHCLG deprivation top up allowance but is only one factor among many. DfE include an English as an Additional Language (EAL) factor in their school funding formula131, which contributed to 1.2 per cent of the total formula spend in 2017-18132.
4.34. MHCLG set up the Controlling Migration Fund in April 2016 which followed on from the earlier Migrant Impacts Fund. The budget for this is modest and it is unclear whether it is sufficient to meet all needs.
4.35. Migration affects most of the various funding formulae indirectly. The single biggest impact is through population and the age structure of that population that are, unsurprisingly, a very important driver of the demand for public services. There are different population forecasts used in different parts of the allocation system but some issues arise with all of them. The estimates of the population currently living in an area may be inaccurate, the future forecasts may be inaccurate and they may not be updated frequently enough.
4.36. National level estimates are predominantly based on ONS population estimates and projections. The MHCLG formula uses the 2012-based ONS population projection data for its current estimates133, whereas NHS England uses
131 Further discussed in Chapter 5 132 This is constrained by departmental expenditure limits (DEL). This means that increased funding is not an automatic response to higher proportions of pupils with EAL. new methodology that this consultation feeds into, will be implemented from 2020. 133MHCLG funding formulae are currently under review, with the aim of seeking expert advice to modernise and simplify the current process of its local authority funding allocations in England. The new methodology that this consultation feeds into, will be implemented from 2020.

80
annually updated GP registration data. The level of inaccuracy is relatively small at the national level, but increases at the local level134.
4.37. Figure 4.6 below shows the ONS projected population growth for 2015-2016 using 2012-based estimates against the ONS estimate of actual population growth for 2015-2016. Each point is a local authority in England. Points above the line represent local authorities where the actual population growth rate exceeded the projected growth rates, those points below the line represent local authorities where actual population growth was less than projected. The differences between actual and projected population increase are quite large in some cases and this affects how well the resources given to local authorities reflect need.
Figure 4.6: Growth rates: projected and actual135
Source: ONS136
4.38. Funding in the Devolved Administrations follow very similar processes to England. Wales also uses 2014-based ONS population projections for their estimates, whilst Scotland uses annual data from the National Records of Scotland (NRS) and Northern Ireland uses annually updated data from the Northern Irish Statistics and Research Agencies (NISRA).
4.39. It is not clear to us how much thought has been given to the possibility that migration might influence the local demand for public services, and how this
134https://www.ons.gov.uk/peoplepopulationandcommunity/populationandmigration/populationestimates/methodologies/annualmidyearpopulationestimatesqmi 135 Isles of Scilly and City of London omitted 136Projections 2012-based available: https://www.ons.gov.uk/peoplepopulationandcommunity/populationandmigration/populationprojections/datasets/localauthoritiesinenglandtable2. Population estimates available: https://www.ons.gov.uk/peoplepopulationandcommunity/populationandmigration/populationestimates/datasets/populationestimatesforukenglandandwalesscotlandandnorthernireland
-0.01
0.00
0.01
0.02
0.03
0.04
-0.01 0.00 0.01 0.02 0.03 0.04
Actual population growth
Projected population growth

81
may increase costs through other means than population growth in most cases. There is a need to simplify and modernise many of the formulae used.
Conclusion
4.40. It is important to manage the consequences of migration and an effective, timely allocation of public funds is an important part of that. We are not convinced that sufficient thought has been given to this in the various funding formulae currently used. Use of the most recent and accurate measures of population (and associated demographics) would help to ensure that funds flow to where they are needed.

82
Chapter 5: Public Service Impacts
Key Messages:
• EEA migrants contribute much more to the health service and the provision of social care in financial resources and work than they consume in services.
• EEA workers are an increasing share of the health and social care workforces though these sectors employ greater numbers of non-EEA migrants.
• There is no evidence that migration has reduced the quality of healthcare.
• Social care is a sector that struggles to recruit and retain workers which is a cause for concern as demand is rising inexorably. Its underlying problem is a failure to find a funding policy that allows the payment of higher wages.
• In education, migrant children and the children of migrants are a higher fraction of the school population than of the school workforce.
• There is no evidence that migration has reduced parental choice in schools or the educational attainment of UK-born children. On average children with English as an additional language out-perform native English speakers.
• Migrants are a small fraction of people in social housing but a rising fraction of new tenants. The share of new tenancies going to migrants from the NMS in particular is rising. Given there is little building of new social housing this is inevitably at the expense of other potential tenants.
5.1. In a 2017 Ipsos opinion poll137 58 per cent of people in the UK agreed with the view that immigration placed pressure on public services. Increases in population do lead to heightened demand for public services, but migrants also pay taxes to fund those services and may also be employed in jobs that deliver these services. This chapter sets out our findings on how migration has affected public services.
5.2. The consumption of public services differs from consumption of other goods and services in that the consumer is not necessarily the taxpayer who is paying for the provision of the service. The impact of migration on public services depends significantly on the fiscal impact of migration which was considered in Chapter 4 as the fiscal impact determines the resources available. In this chapter, we provide some extra details on how public services are used by migrants as well as examine the degree to which migrants deliver public
137 https://www.ipsos.com/sites/default/files/ct/news/documents/2017-09/ipsos-global-advisor-
immigration-refugee-crisis-slides_0.pdf

83
services through work. We also attempt to assess the evidence for an impact of migration on the quality of public services.
5.3. In this chapter, we consider four key public services: healthcare, social care, education and social housing.
Healthcare
5.4. The demand for healthcare has risen in the UK as the population has increased and grown older and because of advances in technology. UK spending on health in real terms has grown at an average of 4 per cent per year between 1955/56 and 2015/16138. Spending on the NHS accounted for just over 7 per cent of national income in 2015/16 compared to under 3 per cent in 1955.
5.5. There are some indications that the supply of healthcare has not kept pace with rising demand in recent years causing stresses on the NHS. Throughout the 2000’s the number of people very or quite satisfied with the NHS steadily increased but since 2010 there has been a fall in satisfaction with under 70 per cent of respondents very or quite satisfied with the NHS in 2017, down from a peak of just under 80 per cent in 2009139. A poll by Ipsos MORI140 conducted in May 2018 found that 39 per cent of people thought the NHS was an important issue facing Britain compared to 26 per cent mentioning immigration.
“Considering rising life expectancy, population structural changes (significant increases in those aged 85 and over) as well as increases in the number of people living with one or more long term conditions, there are significant demand implications for the health and social care workforce.”
Department of Health response to MAC call for evidence
5.6. These trends in subjective satisfaction are mirrored in some more objective indicators: the proportion of A&E attendees seen and discharged within 4 hours has fallen from 98 per cent in 2008/09 to 88 per cent in 2017/18141. Survey results from Ipsos MORI142 show that 77.9 per cent of respondents found it easy to get through to someone at their GP surgery on the phone in June 2012 falling to 68 per cent who found it easy to do so in July 2017.
The contribution of migrants to the healthcare workforce
5.7. The annex to our Interim Update provided an overview of the share of migrants working in the health sector. Overall, the sector employs many migrants but
138 IFS, 2017, https://www.ifs.org.uk/publications/9186 139 https://www.kingsfund.org.uk/publications/public-satisfaction-nhs-2017, Figure 3 140 https://www.ipsos.com/sites/default/files/ct/news/documents/2018-06/www-may-2018.pdf 141 https://www.england.nhs.uk/statistics/statistical-work-areas/ae-waiting-times-and-activity/ae-attendances-and-emergency-admissions-2018-19/ 142 https://gp-patient.co.uk/surveysandreports

84
historically they were mostly from outside the EEA. The proportion of healthcare workers from EU13+ and NMS countries has steadily grown from 1997 to 2017. Recent employment figures from NHS Digital for March 2018 show that NMS workers make up 1.6 per cent of the NHS workforce, EU13+ nationals comprise 2.6 per cent of the workforce and 6.6 per cent of the workforce are nationals from non-EEA countries.
5.8. In relation to the industrial strategy, the main issue that stakeholders who mentioned the strategy raised with us in relation to healthcare recruitment was the time lag between determining how many additional recruits were needed and the time to recruit and train them. We were told that while this time lag existed there would be a continuing need to recruit staff from overseas.
“The recent increase in medical school places is welcome, but will have a delayed affect as it takes around 13 years to train a doctor. Recruiting skills and expertise from overseas is crucial to the sustainability of the NHS in the interim.”
Royal College of Physicians response to MAC call for evidence
5.9. As shown in the Annex F.18. to our Interim Update the proportion of nurses and midwives on the register from EU/EEA countries has increased in recent years. In 2010/11, 1.8 per cent of nurses and midwives on the register were initially registered in the EU/EEA. By 2016/17 this number had increased to 5.5 per cent. However, most recent data from the Nursing and Midwifery Council143 show a fall in the share of EU/EEA nurses and midwives on the register in 2017/18 to 5.1 per cent.
“European Economic Area (EEA) staff make a vital contribution to the UK’s health and care system and services. They work in every role across the NHS and social care sectors delivering high quality care to patients and utilising their skills for the benefit of the UK population.”
Department of Health response to MAC call for evidence
Migrants and the demand for healthcare
5.10. The country-of-birth of people who use the NHS is not recorded when services are used, thus making it difficult to assess the extent to which those from the EU use NHS services.
5.11. Health expenditure is heavily concentrated on the elderly so the relative youth of EEA migrants means that their share of health expenditures will be much less than their total share in the economy. An Office for Budget Responsibility (OBR) report144 from September 2016 estimated the total health care spending
143 https://www.nmc.org.uk/about-us/reports-and-accounts/registration-statistics/ 144 http://obr.uk/docs/dlm_uploads/Health-FSAP.pdf, chart 2.3.

85
per person based on age. The report found that about £4,000 a year is spent on a 70-year-old, in comparison to the £1,100 a year spent on a 25-year-old.
5.12. Using these estimates from the OBR and population age demographics from the APS we calculate the health expenditure shares on different migrant groups. We estimate that 89 per cent of expenditure is spent on those born in the UK and Ireland. Both EU13+ and NMS migrants represent a 2 per cent share of health expenditure. The share of health expenditure on UK and Ireland citizens is higher than their 86 per cent share in the population because they are, on average, older. The share of expenditure estimated to be on EEA migrants is much less than their share of the healthcare workforce so that they contribute more to the supply of healthcare than the demand.
5.13. One exception to this is maternity services. The OBR estimate that about £3,300 p.a. is spent on each baby under 1 year old. The percentage of live births to UK-born mothers has fallen from 83.5 per cent in 2001 to 71.8 per cent in 2016, while over the same period there has been an increase in the proportion of births to mothers from the NMS from 0.6 per cent to 7.5 per cent. Between 2001 and 2016 the shares of births to EU13+145 mothers has risen from 2.5 per cent to 2.8 per cent and that for non-EEA from 13.4 per cent to 17.8 per cent. The change in live birth shares is much greater for mothers from the NMS than EU13+ or non-EEA countries.
5.14. There is some evidence that migrants use the NHS less than existing residents of the same age and gender. A study by Steventon and Bardsley146 (2011) found that migrants (identified as those who first registered with a GP after they were 15) were about half as likely to have a hospital admission as the general population after controlling for age and gender.
5.15. One possible reason for this is the ‘healthy migrant’ effect, that those who migrate tend to be in better health than the general population. Domnich147 et al. (2012) conclude the evidence for this is mixed, though do find that migrants tend to converge in their health towards the native population over time.
5.16. Figure 5.1 presents the adjusted and unadjusted differences in self-reported good health148 between different migrant groups compared to the UK-born. The adjusted results are controlling age (and age2), sex and whether or not the individual is in employment. It shows that most of the raw differential between the self reported good health of migrant and UK-born groups can be explained by just these limited number of characteristics. However ultimately the migrant groups do report somewhat higher levels of good health than the UK-born. Further details can be found in Annex F.
145 Due to different ONS groupings, EU13+ here includes Ireland but does not include Liechtenstein,
Norway or Switzerland. 146 A. Steventon, M. Bardsley; Use of secondary care in England by international immigrants; 2011 147 A. Domnich, D. Panatto, R. Gasparini, D.Amicizia; The “healthy immigrant” effect: does it exist in Europe today?; 2012; https://ijphjournal.it/article/view/7532 148 Good health measured as variable “QHEALTH” from the APS being equal to values 1,2 or 3.
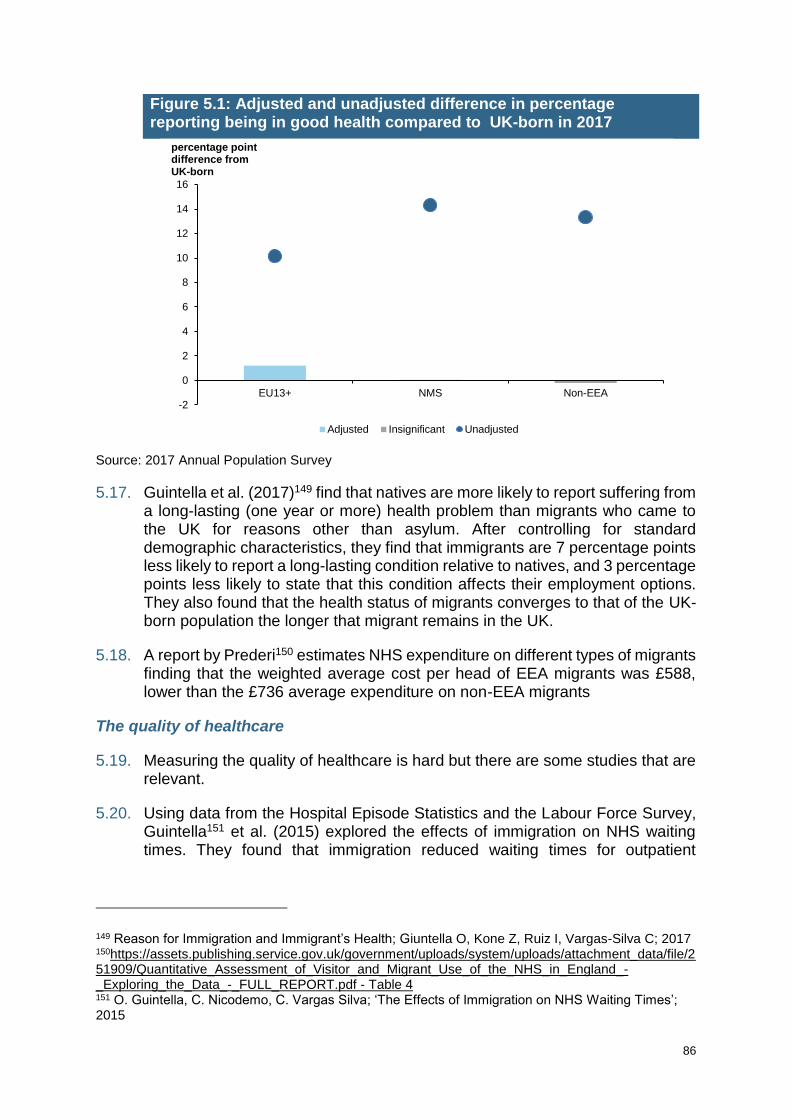
86
Figure 5.1: Adjusted and unadjusted difference in percentage reporting being in good health compared to UK-born in 2017
Source: 2017 Annual Population Survey
5.17. Guintella et al. (2017)149 find that natives are more likely to report suffering from a long-lasting (one year or more) health problem than migrants who came to the UK for reasons other than asylum. After controlling for standard demographic characteristics, they find that immigrants are 7 percentage points less likely to report a long-lasting condition relative to natives, and 3 percentage points less likely to state that this condition affects their employment options. They also found that the health status of migrants converges to that of the UK-born population the longer that migrant remains in the UK.
5.18. A report by Prederi150 estimates NHS expenditure on different types of migrants finding that the weighted average cost per head of EEA migrants was £588, lower than the £736 average expenditure on non-EEA migrants
The quality of healthcare
5.19. Measuring the quality of healthcare is hard but there are some studies that are relevant.
5.20. Using data from the Hospital Episode Statistics and the Labour Force Survey, Guintella151 et al. (2015) explored the effects of immigration on NHS waiting times. They found that immigration reduced waiting times for outpatient
149 Reason for Immigration and Immigrant’s Health; Giuntella O, Kone Z, Ruiz I, Vargas-Silva C; 2017 150https://assets.publishing.service.gov.uk/government/uploads/system/uploads/attachment_data/file/251909/Quantitative_Assessment_of_Visitor_and_Migrant_Use_of_the_NHS_in_England_-_Exploring_the_Data_-_FULL_REPORT.pdf - Table 4 151 O. Guintella, C. Nicodemo, C. Vargas Silva; ‘The Effects of Immigration on NHS Waiting Times’; 2015
-2
0
2
4
6
8
10
12
14
16
EU13+ NMS Non-EEA
percentage point difference from UK-born
Adjusted Insignificant Unadjusted

87
referrals and did not have significant effects on waiting times in A&E and elective care.
5.21. Using data for 2009-2017 from NHS England on GP satisfaction and overall care survey results at primary care trust level, we investigated the relationship between satisfaction with GP and migrant share. Details of this empirical exercise are in Annex F but we find little evidence for any effect of migrants on GP satisfaction with the possible exception of EU13+ migrants where the impact seems to be positive.
Conclusion
5.22. There is no doubt that EEA migrants contribute more to the health workforce than they consume in healthcare. This can be explained by their age profiles, they tend to be younger than the make-up of the resident population. They also tend to consider themselves to be healthier than the UK-born population. Furthermore, there is no evidence that increased migration has led to a decrease in the quality of health care services in the UK.
Social care
5.23. The proportion of the UK population aged 65 and over is increasing and will continue to grow over the next few decades. In 2016 18 per cent of the population were aged 65 and above and this is expected to rise to 24 per cent by 2036 according to the ONS152. The OBR in their fiscal sustainability report from July 2018153 project that 1.46 million adults will be receiving publicly funded adult social care services in 2067/68, which will equate to 2.7 per cent of the adult population; of which around two thirds will be older people. They also predict that adult social care spending is set to rise from 1.1 per cent of GDP in 2016/17 to 1.9 per cent in 2067/68. In spite of rising demand the Institute for Fiscal Studies154 reported spending on social care in England fell 8 per cent in real terms between 2009/10 and 2016/17.
“Health and Social Care faces a precarious future in the UK. The challenges of funding are well documented with no tangible solutions on offer. The short-term injections of funds coming through national government are not the answer to a decade of underinvestment set amid projections of an ageing UK population. We will see the over 65’s increase by 60 per cent over the next 25 years, this is five times the growth of the working age population. By 2035 an additional 190,000 additional people will require residential care.”
National Care Association response to MAC call for evidence
152https://www.ons.gov.uk/peoplepopulationandcommunity/populationandmigration/populationestimates/articles/overviewoftheukpopulation/july2017 153 http://cdn.obr.uk/FSR-July-2018-1.pdf 154 https://www.ifs.org.uk/uploads/publications/bns/BN200.pdf

88
EEA migrant contribution to the social care workforce
5.24. Annex F to our Interim Update provided an overview of migrants in the social care workforce. The EEA employment share increased from 1.2 per cent in 1997 to 5.9 per cent in 2017. Non-EEA workers make the largest proportion of social and residential care workers, excluding those from the UK and Ireland, with 12.0 per cent of social care workers in 2017 being from outside the EEA. However, those from the NMS have started to make an increasing contribution to the workforce, increasing from 0.5 per cent in 2004 to 3.7 per cent in 2016. Presently, there are more non-EEA than EEA workers in the care sector though the share of non-EEA has been constant in recent years while the share of EEA has been rising.
“EU staff represent the single fastest growing pool of new care assistants according to our analysis. In 2010 there were 735 carers recruited form the EU and this grew to 6304 in 2016. This represents an increase of 758 per cent. This compares to an increase of 300 per cent in the number of British recruits over the same time period. Importantly, as reported later on there is significant regional variation in these figures across the country.”
Care Association Alliance response to MAC call for evidence
5.25. There are signs that the sector is struggling to recruit and retain workers at the moment. Numbers from Skills for Care show that vacancy rates for social workers have increased from 7.6 per cent in 2012/13 to 10.8 per cent in 2016/17. Vacancy rates have also increased for care workers from 7.1 per cent in 2012/13 to 7.7 per cent in 2016/17. These vacancy rates are much higher than the national average of 2.7 per cent in July 2018. With record levels of employment in the UK, increasing vacancy rates and an expanding and ageing population, the social care sector could come under tremendous pressure if these positions cannot be filled.
“The social care sector is facing significant challenges in retaining and recruiting Registered Nurses particularly as a consequence of competition with the NHS. Recent data from Skills for Care show a 16 per cent decrease in the number of registered nurses within the social care sector since 2012, and these shortfalls are adding further and increasing pressures upon both providers and commissioners in supporting a sustainable market going forward.”
Care England response to MAC call for evidence

89
5.26. These problems are likely to worsen. Independent Age155 consider a number of scenarios, including a zero-net migration scenario which they fear could create a social care workforce gap of 1.1 million workers by 2037. In a low-migration scenario, where the sector remains as attractive as it is today, they still predict a social care workforce gap of more than 750,000.
5.27. The combination of rising demand, downward pressure on public spending leading to relatively low wages making many jobs relatively unattractive to resident workers and the absence of a non-EEA work-related route for the lower-skilled roles in the sector mean that this is a sector that could face even more serious problems if EEA migration was restricted.
“With a growing proportion of care workers coming each and every year from Europe, whatever new approach to migration policy the government adopts will have a particularly acute effect on this vital sector of the UK workforce. It is a workforce that has been growing – and will no doubt need to continue growing – as our population ages.”
Independent Age response to MAC call for evidence
5.28. Other countries face similar issues. Canada ran a Live-in Caregiver Program
which enabled migrants working in the social care sector to eventually gain permanent resident status, something that was unique within Canada’s Temporary Foreign Worker Program. This has recently been closed to new entrants. Germany has a program to train Vietnamese as geriatric nurses.
EEA migrant use of social care services
5.29. Given the young age profiles of EEA migrants (particularly NMS migrants) there is little evidence of extensive EEA migrant use of social care service in the UK currently. However, as evident from Figure 4.4 in Chapter 4, migrants will eventually become older resulting in greater proportions beginning to receive more in benefits than they contribute through taxation – largely due to increased health and social care consumption. Oxford Economics, in their report detailed in Chapter 4, also make an assessment of the attrition rate of migrants to forecast how long different age groups of migrants will remain in the UK. They assume approximately 60 per cent of migrants aged 20 to 49 on arrival will remain in the UK for another 10 years, rising to over 70 per cent for those aged 50 and over.
Conclusion
5.30. Migrants, particularly non-EEA but increasingly those from the EU, contribute significantly to the social care workforce. Social care wages are low, which
155 Independent Age; Brexit and the future of migrants in the social care workforce;
http://www.ilcuk.org.uk/images/uploads/publication-
pdfs/Brexit_and_the_future_of_migrants_in_the_social_care_workforce.pdf

90
makes this an unattractive industry for UK-born workers to work in leading to a dependence on migrants who may have fewer better work opportunities.
5.31. With an ageing and expanding population, social care needs will grow in the UK. The sector’s problems are not primarily migration-related. A sustainable funding model, paying competitive wages to UK residents, would alleviate many of the recruitment and retention issues. Unless working in social care becomes more desirable to UK workers, chiefly through higher wages, migrant workers will be necessary to continue delivering these services. The factors that make working in social care unattractive for UK residents are also likely to make it unattractive to migrants who may look to change sector at the first opportunity even if hired to work in social care. A scheme to make it easier to hire migrants into social care would not necessarily make it easier to retain them in the sector.
Education
5.32. In this section, we consider primary and secondary education: our recent report on international students contains information on the tertiary sector.
Migration and the demand for education
5.33. In 2017, there were 5.7 million children of primary school age in the UK and 4.3 million of secondary school age in the UK156. Some of these children will be born outside the UK, others will be born in the UK to migrant parents. Other children have one UK-born and one migrant born parent. Table 5.1 summarises the parental country of birth of school aged pupils living in the UK. Out of all primary and secondary school aged children 72 per cent are UK-born and living in a household with UK-born parents. The second most frequent family composition are children born in the UK to non-EEA-born parents who comprise 9.9 per cent of all school children. Nine per cent of children have one migrant and one UK-born parent. The proportion of migrant children in education is likely to rise given the higher fraction of children born to migrant parents, as reported in paragraph 5.13.
156 Source: 2017 Annual Population Survey. Primary school age has been defined as aged 4-10, whilst secondary school age has been defined as 11-16.

91
Table 5.1: Family composition of school aged children in the UK, per cent157
Parental Country of Birth Child's Country of Birth
UK-Born Non-UK-born
UK-born only* 72.0 0.6
EEA-born only* 2.8 2.3
Non-EEA-born only * 9.9 3.5
Mixed UK-born and EEA-born 2.0 0.2
Mixed UK-born and Non-EEA-born 5.5 0.4
Mixed EEA-born and Non-EEA-born 0.6 0.3
*Includes lone parent households who cannot be in the mixed categories as there is only one parent in the household. Source: 2017 Annual Population Survey
EEA contribution to the supply
5.34. In the annexe to our Interim Update we found that there are more non-EEA than EEA migrants working in the education sector. The share of EEA migrants in the education sector has been increasing over the last twenty years, but still comprises less than five per cent of the total sector and these are concentrated in higher education where EEA workers are 17 per cent of academic staff at higher education institutions.
5.35. There are currently around 11,400 and 13,100 EEA-born primary and secondary school teachers, respectively, working in the UK158. This accounts for 2.6 per cent and 3.0 per cent of the total number of teachers for each profession.
5.36. As the share of EEA migrants among the primary and secondary education sector workforce is lower than the share of pupils, EEA migration has increased the demand for primary and secondary education more than the supply of workers. In higher education the share of EEA workers is higher than the share of students.
Educational outcomes
5.37. There are a number of ways in which children who are migrants or the children of migrants might affect the experience of education for the resident population. There may be an effect on school choice. If school places are not expanded in line with changes in the number of pupils this could increase competition for
157 The guardians whom the children live with are used as a proxy for parents. Percentages do not
sum due to missing parental country of birth data. 158 Data from the 3-year APS (2014-2016)

92
school places and potentially lead to a reduction in the number of resident children being allocated to their preferred school. Children without English as a first language may affect the education of other children and migrant children may have greater turnover that causes greater disruption in the classroom.
5.38. There is existing evidence on some of this and we also conducted some of our own analysis.
Existing evidence
5.39. Research commissioned by the MAC in 2011 investigates the impact of migrants on education159. One of the key findings of the paper is that, as the school funding formulae are determined at the onset of the school year, any changes within the school year will not be reflected in funding. This makes it more difficult to manage the consequences of migration when children may arrive part-way through the academic year.
5.40. Geay, McNally and Telhaj (2013)160 investigate whether the increase in the number of children who do not speak English as a first language has had any impact on the educational outcomes of native English speakers at the end of primary school. Using the National Pupil Database for 2003-2009, the authors find that there are no effects of the number of children who do not speak English as a first language on educational outcomes for UK-born pupils. This coincides with Dustmann, Machin and Schonberg’s (2008)161 study which show that most ethnic groups progress through primary school at a faster rate than white British students, so are unlikely to impede the progress of their native-speaking peers.
5.41. These results are similar to those found in other countries. For example, Hunt (2012)162 finds that immigration in the United States increases high school completion rates for U.S. natives and Ohinata and van Ours (2013)163 find similar results for the Netherlands. Brunello and De Paola (2017)164 provides a summary on the literature in Europe and conversely find that both natives and immigrants benefit from a lower immigrant share in the class or school.
New evidence
5.42. In the 2016-17 academic year there were 4,804,157 primary school places and 3,811,284 secondary school places in state-funded schools in England165. For this period, 9.4 per cent and 16.7 per cent of places in primary and secondary schools respectively were unfilled. But even though there are enough places in schools for all pupils in total, some schools in all regions are operating at excess
159 https://www.gov.uk/government/publications/impact-of-migration-on-the-consumption-of-education-
and-childrens-services 160 Geay, C., McNally, S and Telhaj, S. (2013) ‘Non-native speakers of English in the classroom: what
are the effects on pupil performance?’ Economic Journal, 123 (570). F281F307. ISSN 00130133 161 http://www.ucl.ac.uk/~uctpb21/Cpapers/DustmannMachinSchoenberg2011.pdf 162 http://ftp.iza.org/dp6904.pdf 163 http://ftp.iza.org/dp7720.pdf 164 http://ftp.iza.org/dp9836.pdf 165 https://www.gov.uk/government/statistics/school-capacity-academic-year-2016-to-2017

93
capacity and some parents who would like to send their children to these schools do not get their first choice.
5.43. We investigated whether higher migration levels are correlated with the fraction of parents receiving their first choice of school using a panel of English Local Education Authorities (LEAs) for the period 2006-2017. As a measure of the migrant share we use the fraction of pupils with English as an additional language (EAL) which is the best proxy for migrants in the education data. Details of this analysis are in Annex F. We found no statistically significant relationship between a higher migrant share and the percentage of parents getting their first preference of school.
5.44. Children whose first language is not English may also affect educational outcomes. For example, they could conceivably use up resources within schools which could have otherwise been used for other purposes. As detailed in Chapter 4 extra funding is allocated to schools with high numbers of pupils with EAL through DfEs school funding to support pupils who are not yet fluent in English.
5.45. Overall children with EAL perform better than native English speakers at secondary school level: this is the case in 113 out of the 150 local education authorities that have pupils with EAL166.
5.46. We investigated the correlation between the share of EAL pupils and the attainment of non-EAL pupils at both the primary school and the secondary school level167. An increase in EAL pupils that equates to a one percentage point rise in the EAL to non-EAL ratio is correlated with a 5.8 percentage point increase in the percentage of non-EAL pupils achieving their target level in SATS scores. A similar increase to the EAL to non-EAL ratio at GCSE level is correlated with a 3.8 percentage point increase in the percentage of non-EAL pupils achieving at least five A*-C grades.
Conclusion
5.47. Both EEA and non-EEA migrants contribute more to demand than supply for primary and secondary education. The opposite is true in higher education.
5.48. There is no evidence that migration has reduced school choice or the educational attainment of UK-born pupils.
166 The Isles of Scilly and the City of London do not have any pupils with EAL. Data:
https://www.gov.uk/government/statistics/revised-gcse-and-equivalent-results-in-england-2016-to-
2017 167 Using a panel of outcomes at the Local Education Authority (LEA) level over the period 2006 to
2015 and using year and LEA fixed effects.

94
Social housing
5.49. Social housing, provided by local authorities and private registered providers (housing associations), offers subsidised rents (40 per cent lower than market rents on average, lower still in London168) and greater security of tenure than the private rented sector.
Figure 5.2. The composition of the UK housing stock, 1981-2016
Source: MHCLG169
5.50. Figure 5.2. shows that the social housing sector has declined in both absolute and relative size because of the UK’s policy of selling off the social housing stock and a low level of new construction.
5.51. There is currently an excess demand for social housing in the UK. There were 1.2 million households on a waiting list for social housing in England on 1 April 2017. Although these figures may contain some who are no longer interested in social housing, it is clear that there are more people who would like social housing than there are places available.
Access to social housing
5.52. According to a 2014 summary by the House of Commons Library, ‘the rules on eligibility for housing assistance in relation to migrants are extremely complex’. However, EEA migrants will generally be eligible if they have the right to reside
168 Battiston, Diego and Dickens, Richard and Manning, Alan and Wadsworth, Jonathan (2014)
‘Immigration and the access to social housing in the UK’. CEP Discussion Papers. 169 Table 102 at: https://www.gov.uk/government/statistical-data-sets/live-tables-on-dwelling-stock-including-vacants

95
in the UK, which most of them will. Non-EEA migrants are ineligible to apply if they are subject to immigration controls, unless they fall within a class of persons prescribed in subject 3170 (eligibility to go on the housing register) or 5 (eligibility for assistance as a homeless person). But some migrants who are ineligible to apply as individuals may be in a household with someone who is eligible in which case they can live in social housing with the eligible person. Manning et al. (2014)171 estimates that over 90 per cent of immigrants in the UK are in households that are not excluded from social housing on the basis of their immigration status.
5.53. Those who are eligible to apply and would like social housing are placed on a waiting list and migrants and UK-born will then be considered on the same basis. The criteria for allocating social housing vary by provider but within the constraints of legislation which require priority to certain groups such as households with children, the elderly, the sick and homeless etc. Since the Localism Act 2011, councils are given the right to decide who is, or is not, eligible to go on the waiting list for social housing and legislation is put in place to ensure certain groups be given reasonable preference.
5.54. Manning et al. (2014)172 finds that there seems to be equal treatment of natives and immigrants in the allocation of new tenancies and that once one controls for factors such as demographics, area of residence and economic circumstances, immigrant households are significantly less likely to be in social housing than equivalent native households. Similarly, they find although immigrants are more likely than native households to demand social housing, they are less likely to be allocated to social housing, a finding which coincides with other studies (Wilson, 2016173; Rutter and Latorre, 2009174). There is therefore no evidence of migrants having preferential access to social housing though this is not always the public perception. Manning et al. (2014) report that over 20 per cent of white Britons think that they are treated worse than people of other races by social landlords, while this figure is only 5 per cent for private landlords.
Availability of social housing
5.55. Immigration will naturally increase the demand for social housing. If the supply of social housing is not very responsive to changes in demand, this could reduce the access to social housing for the UK-born. In a market excess demand would be likely to increase the price but given social housing rents are not determined by market forces, this is unlikely. If migration has a positive net fiscal impact (as reported in Chapter 4) then migration could also increase the
170 See the Allocation of Housing and Homelessness Regulations, 2006 171 Battiston, Diego and Dickens, Richard and Manning, Alan and Wadsworth, Jonathan (2014)
Immigration and the access to social housing in the UK. CEP Discussion Papers. 172 ibid 173 Wilson, Wendy (2016) EEA migrants: access to social housing (England). House of Commons
Library Briefing Paper 174 Rutter, Jill and Maria Latorre (2009) Social housing allocation and immigrant communities. Equality
and Human Rights Commission research Report.

96
supply of social housing if the additional government revenue is spent on social housing.
5.56. Figure 5.3 shows the fraction of adults in social housing for our different migrant groups defined by country of birth. As shown, the proportion of EU13+ migrants in social housing stayed relatively constant until 2011, before steadily falling by 5.6 percentage points from 2011 to 2017. The proportion of NMS migrants in social housing on the other hand has increased by 3.6 percentage points between 2005 and 2017.
Figure 5.3: Proportion of migrants in social housing
Source: Labour Force Survey
5.57. Although some migrant groups are as likely to be in social housing as the UK-born, migrants make up a relatively small proportion of all those living in social housing because their share in the population is small. The UK-born share of social housing has decreased by 7.9 percentage points in the period 1997 to 2017, while the proportion of EU13 migrants and NMS migrants has increased by 0.2 and 2.2 percentage points respectively in the same period. Although this has happened, EEA migrants still only make up 3.4 per cent of the total number of people in social housing in 2017, while UK-born make up 86.1 per cent in the same year.
5.58. This discussion has been about the stock. For the flow of new lettings one useful source of data, though only for England, is the “continuous recording of lettings and sales in social housing in England” (known as CORE). This contains information on nationality of the main tenant175.
175 As the CORE data records nationality rather than country-of-birth, the fraction of lettings to British
citizens is higher than it would be on a country-of-birth definition as many non-EEA migrants will have
British citizenship when they obtain a letting.
0%
5%
10%
15%
20%
25%
1992 1994 1996 1998 2000 2002 2004 2006 2008 2010 2012 2014 2016
Proportion of population in social
housing
UK + Ireland EU13+ NMS Non-EEA

97
Figure 5.4 Share of new social housing lettings by migrant group in England
Source: CORE
5.59. The proportion of new lettings going to UK-born renters has fallen from 94.5 per cent in 2007 to 91.5 per cent in 2016176. Figure 5.4 shows that this fall in the share of lettings to British citizens is mostly the result as a rising share of EU migrants in general and NMS (A8 and A2) migrants in particular.
EEA contribution to the supply of social housing
5.60. As the supply of social housing has fallen, shown in Figure 5.2, as a result of sales and low construction, it is likely that EEA migrants have not significantly affected supply. It is possible that as EEA migrants have had a positive net fiscal impact (see Chapter 4) then the supply of social housing would have fallen by a larger amount without the existence of EEA migrants. Inevitably though, the increase in demand from EEA migrants combined with a falling supply leads to a reduction in the availability of social housing for the UK-born.
5.61. The increase in the number of migrants applying for social housing and the falling supply has meant that migration has reduced the probability of UK-born being allocated to social housing. Manning et al. (2014) conclude that immigration can explain one-third of the reduction in the probability of a UK citizen being in social housing but the reduction in the social housing stock itself has had by far the largest impact on UK-born households, explaining the remaining two-thirds of the reduction in the probability of a UK citizen being in social housing.
176 CORE
0.0%
0.5%
1.0%
1.5%
2.0%
2.5%
3.0%
3.5%
4.0%
4.5%
2007 2008 2009 2010 2011 2012 2013 2014 2015 2016
% of all new social housing lettings
NMS (A8+A2) Other EU Non-EEA

98
Conclusion
5.62. The reduction in the supply of social housing has by far had the most impact on access to social housing for the UK-born and EEA migration plays a relatively small role in comparison, although this has inevitably had an impact through the increased demand. It is noticeable that NMS migrants’ share of social housing is increasing and this may result in a further reduction in the chances of finding social housing for the resident population unless something is done to address the supply issue.

99
Chapter 6: Community Impacts
Key messages
• Migration inevitably means change in some communities and people care about their communities.
• Migration may play a role in enhancing or reducing the feeling of wellbeing in communities. The impacts of migration on communities is hard to measure due to their subjective nature which means there is a risk they are ignored.
• There is no evidence that migration has affected crime.
• There is no evidence that migration has reduced subjective well-being though some suggestion that this varies with attitudes to migration.
• Overall, there is no evidence that people are less satisfied with their neighbourhoods than in the past.
6.1. Migration means that some communities are likely to change in terms of size and character. As people care about their neighbourhoods, this is a potentially important impact of migration in general and EEA migration in particular.
6.2. The community impacts of migration are typically harder to quantify and assess than the economic and fiscal impacts due to their more subjective nature. There is a risk that this leads to neglect of what are, to many people, important impacts of migration. This chapter considers the impact of migration on communities across the UK.
6.3. Previous MAC reports177 that discussed this area considered cohesion and integration and found that at the national level, there is limited scope for either robust quantification or monetisation of the impacts of migration on cohesion and integration. However, it was suggested that analysis at the local level may provide a clearer and detailed picture of how people experience/ feel about migration.
6.4. The share of migrants has risen in most communities across the UK though more in some than others. As context, it is worth noting that the fraction of people saying that they like their neighbourhood is higher now than in the past. Figure 6.1 provides some figures on this, both unadjusted and adjusted for differences in age, gender, ethnicity, education and region.
177 Analysis of the Impacts of Migration, MAC January 2012.
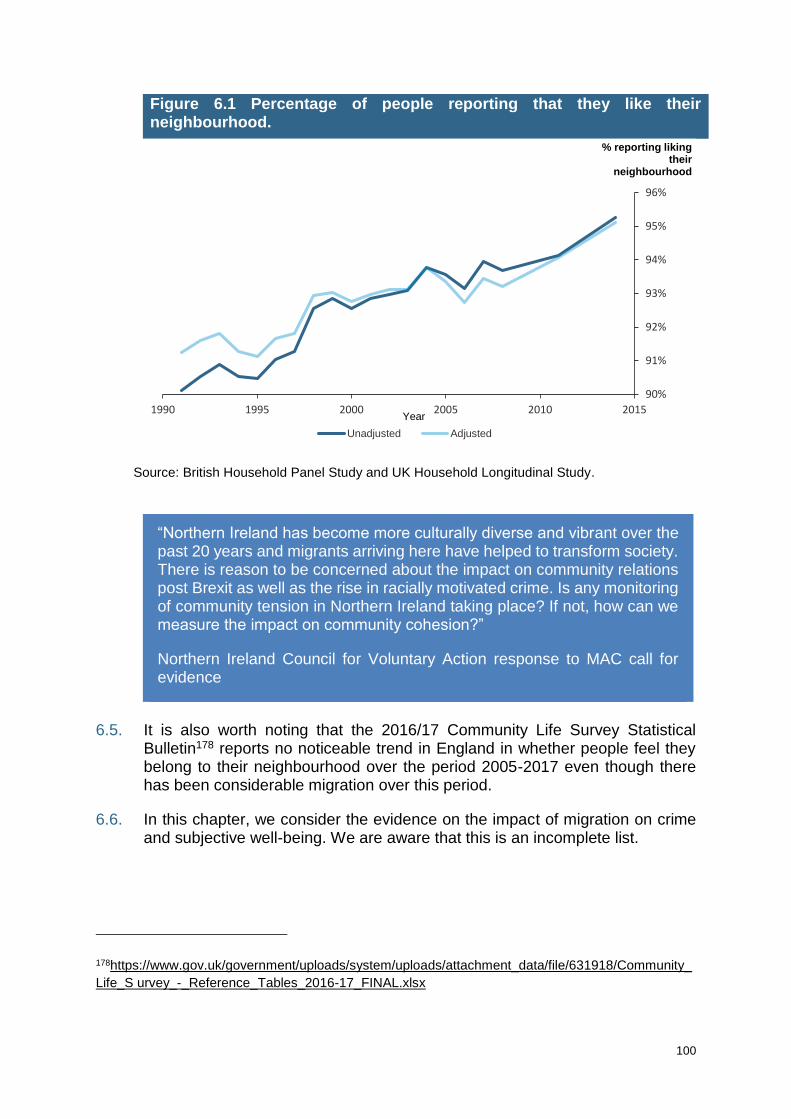
100
Figure 6.1 Percentage of people reporting that they like their neighbourhood.
Source: British Household Panel Study and UK Household Longitudinal Study.
“Northern Ireland has become more culturally diverse and vibrant over the past 20 years and migrants arriving here have helped to transform society. There is reason to be concerned about the impact on community relations post Brexit as well as the rise in racially motivated crime. Is any monitoring of community tension in Northern Ireland taking place? If not, how can we measure the impact on community cohesion?”
Northern Ireland Council for Voluntary Action response to MAC call for evidence
6.5. It is also worth noting that the 2016/17 Community Life Survey Statistical
Bulletin178 reports no noticeable trend in England in whether people feel they belong to their neighbourhood over the period 2005-2017 even though there has been considerable migration over this period.
6.6. In this chapter, we consider the evidence on the impact of migration on crime and subjective well-being. We are aware that this is an incomplete list.
178https://www.gov.uk/government/uploads/system/uploads/attachment_data/file/631918/Community_
Life_S urvey_-_Reference_Tables_2016-17_FINAL.xlsx
90%
91%
92%
93%
94%
95%
96%
1990 1995 2000 2005 2010 2015
% reporting liking their
neighbourhood
Year
Unadjusted Adjusted

101
Crime and the perception of crime
6.7. Crime and the perception of crime is an important factor in determining the quality of life. Overall crime has been declining since the mid 1990’s. (Figure 6.2.) although there has been an increase in some types of serious crime in recent years179.
Figure 6.2 Estimated crime levels for England and Wales.
Source: ONS180.
6.8. Migrants may commit crimes but can also be the victim of crimes. Our report on ‘The impacts of low skilled migrants’ (2014), reported on research findings from Bell, Fasani and Machin (2013)181 (hereafter BFM) which assessed the impacts of two large waves of migration to the UK on crime: EU8 accession country migrants post 2004 and asylum seekers from the 1990’s/2000’s. No link was found with violent crime and migration (for either wave). However, areas with high levels of EU8 migration experienced slightly lower levels of property crime. This was explained by the fact that crimes are much more likely to be committed by individuals who are young, with low education and poor economic opportunities. Since EU8 migrants have both higher employment rates and higher average levels of educational attainment than UK-born, it is not surprising that they reduce the overall crime rate. Migrant victimisation rates were also assessed- but no evidence was found that any crime effects were a result of increased crime against migrants.
179 Home Office Serious Violence Strategy report, April 2018. 180 Statistical bulletin: Crime in England and Wales, report published on 19th July 2018. Data from December 1981 to March 2018 using the Crime Survey England and Wales. 181 http://eprints.lse.ac.uk/59323/?from_serp=1

102
6.9. We updated this research using more recent data. Our updated results are reported in Annex G but, in line with earlier findings, we found no evidence that migration has any effect on crime rates in England and Wales.
6.10. We also used data from the Crime Survey for England and Wales from 2011/12 – 2016/17 to assess any differences in victimisation experienced by migrants in comparison to UK-born. Migrants have a slightly higher probability of being a self-reported victim of crime over the prior 12 months, a slightly lower probability of being a victim of violent crime and a higher probability of being a victim of hate crime (see Annex G). However, after controlling for factors like sex, age and ethnicity, both EEA and non-EEA migrants experience significantly lower victimization rates, except for hate crime where EEA migrants continue to experience higher rates.
6.11. Figure 6.3 shows that recorded hate crimes have increased in recent years with a noticeable spike just after the EU referendum182. It is unclear whether the longer-run trend is due to the improved recording of such crimes by the police or a real increase.
Figure 6.3: Police recorded hate crime (for race) for England and Wales (2013-2017).
Source: Home Office
182 Home Office Hate Crime, England and Wales, 2016/17 report, 17 October 2017.
0
1,000
2,000
3,000
4,000
5,000
6,000
Apr-13 Oct-13 Apr-14 Oct-14 Apr-15 Oct-15 Apr-16 Oct-16
Number of hate crimes
Crime Recorded EU Referendum

103
“A rise in hate crime and hostility post-referendum contributes to a general sense of being unwelcome and makes migrant workers feel like ‘second class citizens’ in the UK. This undermines confidence in rights and makes it more difficult to speak out about poor treatment.”
Labour Exploitation Advisory Group and Focus on Labour Exploitation joint report “Lost In Transition: Brexit and Labour Exploitation”, 2017, sent in response to MAC call for evidence.
6.12. In addition to our findings, we also assessed whether migrants were more likely to commit crimes using the live Police National Computer (PNC) database from 2012-2016. The PNC database is a live operational system which is subject to continuous revision and updating: the data analysed represent annual snapshots of the information contained, which means they may subsequently have been revised. This data relies on self-declared nationalities and only relates to crimes where someone is cautioned or convicted.
6.13. Table 6.1 shows the share of cautions/convictions (for those who have a recorded nationality) by nationality group. Of all the cautions/convictions that were given from 2012-2016, 88.5 per cent were given to UK/Ireland citizens, 6.7 per cent to EEA citizens and 4.7 per cent given to non-EEA citizens. To get a sense of the rate of cautions/convictions, the second row of the Table reports the share of total population (16 and over) that each nationality group represents. If the rate was the same across nationality groups, the first and second rows would be identical. We can see however that EEA citizens (and in particular NMS) are more likely to receive a caution/conviction than their share of the population would suggest.

104
Table 6.1: The share of cautions/convictions from 2012-2016 from the PNC database, per cent.
Source: Annual Population Survey and PNC database. Data averaged for 2012-2016.183
6.14. However, we should to be careful in interpreting such data. We know, for example, that the incidence of criminality is higher for young men than for the population as a whole. So, if migrants are more prevalent among the population of young men, they will have a higher share of cautions/convictions. The third row of the Table shows that this explains a significant amount of the over-representation of EEA citizens. Ideally, we would like to control for all observable characteristics of an individual and test whether nationality differences remain after such characteristics are accounted for. Unfortunately, we cannot do this with the data that we have.
183 Share of population 16+ and share of population 16-29 male averaged figures from 2012-2016.
The Annual Population Survey data uses nationality rather than country of birth for consistency PNC
data. The data on the share of cautions/convictions is from the PNC database.
UK/Ireland EU13+ NMS All EEA Non-EEA
Share of all Cautions/Convictions
88.5 1.1 5.6 6.7 4.7
Share of Pop 16+ 91.5 1.7 2.4 4.1 4.3
Share of Pop 16-29 Male
88.9 1.9 3.6 5.5 5.6
Share of Cautions/Convictions for Violence
91.3 0.9 3.3 4.2 4.5
Share of Cautions/Convictions for Theft
86.4 1.0 9.2 10.2 3.3
Share of Cautions/Convictions for Robbery
89.4 1.7 3.1 4.8 5.7
Share of Cautions/Convictions for Drugs
92 1.2 2.2 3.4 4.6

105
6.15. Figure 6.4 shows the total share of cautions/convictions given to each nationality group for all broad offence types for the year 2016184.
Conclusion
6.16. In line with earlier research, the new evidence suggests that EEA migration does not affect crime in England and Wales.
Life satisfaction
6.17. One way of assessing the overall quality of people’s lives is to ask them about their life satisfaction, what is sometimes called subjective well-being. The OECD include such a measure in their “How’s Life?” Survey185 and conclude that, in the UK, subjective well-being is the most important factor for overall well-being.
184 Summary offences are less serious cases and are completed in the magistrate’s courts. Summary
offences are subdivided into summary motoring which includes offences such as driving whilst
disqualified and summary non- motoring offences which includes offences such as tv license evasion
and minor assaults.
https://assets.publishing.service.gov.uk/government/uploads/system/uploads/attachment_data/file/72
0042/criminal-court-statistics-guide.pdf 185 http://www.oecd.org/statistics/Better-Life-Initiative-country-note-United-Kingdom.pdf
Figure 6.4: Share of total convictions and cautions for each group in the year 2016
Source: PNC database snapshot

106
6.18. We commissioned Corrado Giulietti186 to investigate the possible impact of migration on life satisfaction187. The question analysed is, “How dissatisfied or satisfied are you with your life overall?” with scores varying from 1 (not satisfied at all) to 7 (completely satisfied). His study considers the impact of migration at both the local authority level, and the much smaller lower layer super output area (LSOAs have an average population of 1680188).
6.19. Giulietti’s study has three key research questions. Firstly, what is the impact of migration on the reported life satisfaction of the UK-born? Secondly, whether the impact of migration on the subjective well-being of the UK-born varies depending on the characteristics of UK-born and on the type of migrants. Finally, which well-being dimensions are affected by migration and what mechanisms are at work in this effect?
6.20. The paper suggests that there is a modest but positive effect of migration on the subjective well-being of UK nationals at the local authority level though no effect at the LSOA level. It also finds that the impacts do not seem to vary with the type of migrants, though there is small amount of, albeit statistically insignificant, evidence that the impact is felt differently depending on the characteristics of the UK-born population. There is some evidence that those with more positive attitudes to migrants in general and those areas which voted Remain in the EU Referendum have a more positive effect of migration on well-being.
6.21. The lack of a strong effect of local migration on subjective well-being is consistent with opinion polls suggest that people are more concerned with migration in general than the impact on their community. A 2014 Ipsos Mori survey found 70 per cent of people wanted to reduce migration but only 20 per cent of people felt that migration was an issue in their neighbourhood.
Conclusion
6.22. There is no evidence that migration has reduced the average level of subjective well-being in the UK. This is consistent with the fact that the proportion of people who like their neighbourhood is higher than 25 years ago.
6.23. There is some evidence that the impact of migration on well-being is connected to attitudes to migration with a positive effect for those with more positive views of migrants and a negative effect for those with negative views.
186 Published on our website, https://www.gov.uk/government/organisations/migration-advisory-committee 187 See: Akay et al (2017), Longhi (2014), Ivlevs and Veliziotis (2018) for some other studies on this topic. 188 2016 data available at: https://www.ons.gov.uk/peoplepopulationandcommunity/populationandmigration/populationestimates/datasets/lowersuperoutputareamidyearpopulationestimates

107
Chapter 7: Conclusions and Policy Recommendations
7.1. Our analysis of the impacts of EEA migration has led us to some conclusions about how the immigration system could be designed to better benefit the resident population. These views relate to broad principles more than detailed rules. We also consider how this aligns with the grand challenges as outlined in the Government’s industrial strategy published in November 2017189.
7.2. The UK’s post-Brexit immigration system could be decided by the UK on its own, as is done for example, by most countries outside the EU (except for some relatively minor provisions in trade agreements) or could be part of the negotiations with the EU. Access to the UK labour market is valuable to migrants, especially from lower-income countries. In theory, the UK may therefore be able to trade-off some preferential access for EU citizens to the UK in return for benefits in other areas of the negotiations, such as trade. We are not in a position to offer a view on what, if anything, might be on offer and how any such benefits might be set against immigration. For that reason, and because there are a very large range of possible scenarios, most of our discussion focuses on what we think might be a desirable migration system for the UK if it was to be set in isolation. This should not be taken as a MAC recommendation that migration should be excluded from negotiations with the EU.
7.3. The impacts of migration also cannot be seen in isolation from other government policies outside our remit. We do indicate where we think other policies may need to change but do not suggest detail.
The objective of migration policy
7.4. The MAC makes recommendations about migration policy with the objective of maximising the welfare of the resident population, bearing in mind that the impacts are likely to vary across individuals, sectors and regions.
7.5. The commission explicitly asked us to align migration policy with the Government’s industrial strategy. The industrial strategy has five foundations: Ideas (the world’s most innovative economy), People (good jobs and greater earning power for all), Infrastructure (a major upgrade to the UK’s infrastructure), Business Environment (the best place to start and grow a business) and Places (prosperous communities across the UK). Migration policy potentially affects all of these but, as the industrial strategy exists, for the moment, more as broad principles than specific policies, it is hard to make recommendations to align migration policy with specific aspects of the industrial strategy. We take it that the broad aim of the industrial strategy is to deliver a highly productive, innovative economy providing a higher quality of life for all residents of the UK. That is not very different from the traditional MAC objective.
189https://assets.publishing.service.gov.uk/government/uploads/system/uploads/attachment_data/file/6
64563/industrial-strategy-white-paper-web-ready-version.pdf

108
Impacts of migration
7.6. In our previous Interim Update and this, final, report, we have considered a wide range of impacts of EEA workers using both quantitative and qualitative evidence. In some cases, the evidence on impacts is clear, in others less so. Table 7.1 below provides a very brief summary of our findings on the outcomes we have studied.
Table 7.1: Summary of the impacts of EEA workers
Theme Impacts
Labour Market: Employment and Unemployment
Overall no evidence that EEA migration has reduced employment opportunities for UK-born on average.
Some evidence that migration reduces employment and raises unemployment of some groups (e.g. the young and less well-educated) but subject to significant uncertainty.
Labour Market: Wages
Overall no evidence that EEA migration has reduced wages for UK-born workers on average.
Some evidence that migration has reduced earnings growth for the lower-paid and raised it for the higher-paid, but again these findings are subject to uncertainty.
Productivity Evidence that immigration has, on average, a positive impact on productivity. Some evidence that this impact is larger for high-skilled migrants than lower-skilled migrants.
Innovation High-skilled immigrants increase innovation.
Training No evidence that migration has reduced the training opportunities of the UK-born.
Prices Evidence that migration, especially lower-skilled, has reduced the prices of personal services.
Evidence that migration has raised house prices, more in areas where housebuilding is more restricted.
Public Finances
EEA migrants, especially those from EU13+, pay more in taxes than they receive in welfare benefits and consume in public services.
Net fiscal benefit is strongly related to earnings and to age.

109
Public services: Health
EEA migrants make a larger contribution both in terms of money and work to the NHS than they receive in health services.
No evidence that migration has reduced the quality of healthcare.
Public Services: Social Care
EEA migrants are a small but increasing share of social care workforce. Very few EEA migrants receive social care.
Growing demand for social care but wages and conditions make it hard to recruit and retain UK residents. May also struggle to recruit migrants with other options.
Sector needs a coherent approach to financing.
Public Services: Education
Migrants or the children of migrants make up an increasing proportion of the school-age population. EEA migrants are a smaller proportion of workers than students in primary and secondary education but a higher proportion in higher education.
Children with English as an additional language academically out-perform children with English as first language.
No evidence that migration has reduced the educational attainment of other children or the choice of schools.
Public Services: Social Housing
EEA migrants, especially NMS migrants, are an increasing share of new tenancies. Given low level of new construction of social housing this is very likely to be at the expense of someone else.
Crime No evidence that migration affects the overall level of crime.
Life Satisfaction
Overall, no evidence of an impact of migration on self-reported life satisfaction. Some evidence that positive effect among those with a more favourable view of migration and negative among those with a less favourable view.
e X.X. The share of cautions/convictions from 2012-2016 from the PNC database.

110
Summary of evidence
7.7. The evidence presented in this report suggest that despite the significant scale of migration from EU countries over the past 15 years, the overall economic impacts have been relatively small with the main effect being an increase in population. EEA migration as a whole has not harmed the existing resident population overall, as has been claimed by some, but also has not had the significant benefit claimed by others. This does not mean that the impact of all migrants is the same.
7.8. As we have found throughout the preceding chapters, a general theme emerges from the evidence that the impact of high-skilled migration is more beneficial than lower-skilled. This is clearest in the impact on the public finances and innovation. Additionally, while the evidence for a more beneficial impact of high-skilled migration on productivity is not extensive, we judge it likely. There is also some evidence suggesting that migration has slightly reduced employment opportunities for the UK-born especially for the lower-skilled. Some evidence shows a small negative effect of migration on earnings at the lower end of the wage distribution and a small positive effect at the upper end. The magnitude of these effects should not be exaggerated: they are generally small in the context of wider trends.
7.9. The benefits for existing residents of high-skilled migration seem clear. The evidence is less clear on whether low-skilled migration (perhaps those in the bottom 25 per cent of the earnings distribution) has had costs or been broadly neutral. It seems to us that the scale of low-skilled migration since NMS accession in 2004 has been larger than an evidence-based policy would have chosen in the absence of free movement.
Free movement as a policy choice
7.10. We understand the essence of free movement to be the ability of migrants to come to the UK for work, or other reasons, unrestricted. This is wider than the definition of free movement as defined in EU law.
7.11. Free movement has the virtue of a low bureaucratic burden but at the price of losing control over both the level and type of immigration into the UK. With free movement, the decision to migrate rests solely with the migrant: there is no guarantee that this migration is to the benefit of the resident population. Free movement within the EU has given UK citizens the symmetric freedom to migrate to other EU countries, but since the accession of the lower-income Eastern European countries in 2004 the flows have been asymmetric with greater numbers of EU migrants choosing to come to the UK than UK citizens choosing to migrate to other EU countries. Razin and Wahba (2015) 190 provide some evidence that free movement is associated with more low-skilled migration.
190 http://www.nber.org/papers/w17515

111
7.12. The absence of free movement would not make the UK unusual. Countries outside the EU set their own immigration policy, and none of them unilaterally give freedom of movement to the citizens of other countries. Canada, a country often perceived as being relatively open to migrants, has no free movement agreement with any other country. The few current bilateral agreements that do exist (e.g. between Australia and New Zealand) are between countries at a similar level of economic development.
7.13. Ending free movement would not mean that visa-free travel for EEA citizens would end, just that a visa would be needed to settle in the UK for any period of time and to work, as is the case for the citizens of many non-EEA countries at the moment. It also should not mean restrictions on the supply of services across borders under what is called Mode 4 of the WTO rules.
Should policies be the same for EU and non-EU citizens?
7.14. The current non-EEA system differentiates very little between countries. Tier 5 Youth Mobility is restricted to the citizens of a small number of countries, as was the Seasonal Agricultural Workers Scheme (SAWS) before its closure in 2013. However, the Tier 2 route is equally open to citizens of all non-EEA countries. We do not see compelling reasons to offer a different set of rules to EEA and non-EEA citizens, unless the UK wishes to use migration in negotiations. As this report has explained, a migrant’s economic impact depends on factors such as their skills, employment, age and use of public services, and not fundamentally on their nationality.
Work, family, study
7.15. There are three main types of migration that need to be considered when designing the post-Brexit migration system: work, family and study. Although all these routes are important, this report focuses solely on the work route. The MAC published its report and recommendations on international students, both EEA and non-EEA, last week191. Family migration needs consideration but this enquiry, primarily focused on economic impacts, has not gathered enough evidence to make specific recommendations on family migration. If EEA citizens in the UK were to be brought within the current system for non-EEA family migration, there would potentially be large effects that should be considered.
Policy for work migration
7.16. As discussed earlier, the evidence points in the direction of high-skilled migrants having a clear benefit to existing residents while the same is not true for lower-skilled migrants. As a result, a policy on work migration that provided greater access for higher-skilled migration while restricting access for lower-skilled workers to enter the UK would be consistent with the available evidence.
191The report can be found on our website, https://www.gov.uk/government/organisations/migration-advisory-committee

112
7.17. There is the risk that restrictions intended to control lower-skilled migration impose a higher bureaucratic burden on higher-skilled migration and hence discourages the skilled migration one would like to encourage: we recommend that if a skill-selective migration policy is introduced steps should be taken to reduce those burdens to minimize this risk.
Tier 2
7.18. Currently the main scheme for high-skilled workers from outside the EEA with a job offer in the UK is Tier 2. The two most relevant categories are Tier 2 (Intra-Company Transfer) and Tier 2 (General).
7.19. Tier 2 (ICT) allows multinational employers to transfer key company personnel from overseas to their UK branch. Transferees (other than graduate trainees) must be established employees who have worked for their overseas branch for at least 12 months. The stated aim of this category is to encourage international trade and investment to boost the economy. We do not propose any change to the way the current ICT scheme works. Some of the rules on ICT come under Mode 4 of the WTO rules. We think it important that these flows remain as free as possible after the UK leaves the EU.
7.20. Tier 2 (General) is for new recruits coming to work in the UK. Applicants must have an offer of a graduate level job, paying an appropriate salary, from an employer which has been licensed by the Home Office to sponsor migrant workers. We think that any skill-selective migration policy introduced after Brexit should be based on employer sponsorship because the offer of a job meeting the required salary thresholds is more informative about the skills of the worker than can be obtained by an inspection of educational qualifications and experience on a CV. The existing Tier 2 scheme can provide a useful template for a work permit scheme although criticisms of the administrative burdens the scheme imposes should be taken seriously if it is to be extended to EEA citizens; we discuss this further below.
7.21. There are currently a number of elements to Tier 2(General), including the restriction to jobs above a certain skill level, the minimum salary thresholds, the immigration skills charge, a cap on the total numbers; and the requirement for employers to have a sponsor licence and meet other regulations such as performing a resident labour market test (RLMT).
Restrictions to certain jobs
7.22. Before 2011, Tier 2 (General) was open to all jobs at RQF level 3 and above. In April 2011, the minimum skills threshold increased for Tier 2 (General) and Tier 2 (ICT) from RQF/ NQF level 3 to level 4. This excluded many hospitality, care and retail jobs at RQF/ NQF 3. The skills threshold was then raised to RQF/ NQF 6 in June 2012. These changes were made because it was felt there was a sufficient source of migrants above RQF/NQF level 3 from within the EEA.
7.23. If free movement ends, the skills threshold would need to be reconsidered. As it is possible for shortages to occur in occupations below RQF level 6, we

113
believe that if Tier 2 (General) is extended to cover EEA citizens, it would be sensible to allow any job at RQF/NQF level 3 (SCQF 6 in Scotland) or above to be eligible.
7.24. This would make an additional 142 occupations eligible for Tier 2 (General), and would increase the share of existing employees jobs that meet the baseline criteria by around 5 million or 32 per cent of the full-time employee workforce. However, not all of the jobs would meet the salary threshold as discussed below.
Salary thresholds
7.25. Under T2 (General) jobs must pay at least the maximum of an occupational and a general salary threshold. Since April 2017, the general salary threshold is £30,000 or £20,800 for new entrants. £30,000 is the 25th percentile of the earnings distribution for eligible occupations. These levels were based on MAC advice as laid out in our Review of Tier 2, Analysis of Salary Thresholds in July 2015.192
7.26. We suggest retaining the salary threshold at £30,000 even though we recommend expanding the list of eligible occupations. This salary threshold would be difficult, but not impossible, to meet for medium-skilled jobs. Table 7.2 provides some estimates of the fractions of existing jobs with annual earnings equal to or greater than the 25th earnings percentile of all jobs in the same occupation or £30,000 – whatever is greater. This broadly approximates the proportion of existing jobs, by skill level, that meet the current T2 (General) salary thresholds. For example, 40 per cent of existing Level 3-5 jobs meet the current salary thresholds.
Table 7.2. Approximate proportions of existing full-time employee jobs meeting Tier 2 General salary thresholds by occupational skill level
Occupation skill level
Number of
SOCs
Number of jobs
25th Earnings percentile
Percentage eligible and meeting the
salary threshold
RQF
Level 6+ 95 5,760,000 £31,300 72%
Level 4-5 33 1,200,000 £24,000 51%
Level 3 109 3,890,000 £20,100 37%
< Level 3 125 5,010,000 £16,500 17%
Notes: Calculations using ASHE (2017). SOCs matched to RQF skill levels Immigration Rules Appendix J. Sample restricted to full-time employees on adult rates who have been in the same job for more than one year. Employees who do not have a valid work region, who are less than 16 years old or with missing or zero annual gross salaries are excluded.
192https://assets.publishing.service.gov.uk/government/uploads/system/uploads/attachment_data/file/4
52805/Review_of_Tier_2_-_Analysis_of_salary_thresholds.pdf
114
7.27. The proportion is lower for medium-skilled jobs as expected but it is also clear that these salary thresholds are not unreasonable for many workers in these jobs: Many employers are already paying more. This would allow employers to hire migrants into non-graduate jobs if they are struggling to hire resident workers but require them to pay salaries that place greater upward pressure on earnings. We believe that these salary thresholds are likely to ensure that these migrants raise the level of productivity in the UK, make a clear positive contribution to the public finances and contribute to rising wages which is the appropriate market response to a labour shortage.
Immigration skills charge
7.28. The Immigration Skills Charge (ISC) is disliked by employers especially as the ‘skills’ part of the name is regarded as misleading, there being no clear route by which the revenue raised is directed towards training: it would more accurately be described simply as the ‘Immigration Charge’.
7.29. In the Review of Tier 2 report193 (December 2015) the MAC supported the introduction of the ISC. We agreed with the charge as a way of meeting the Government’s objective to reduce the numbers of migrants sponsored in Tier 2, through a price mechanism rather than a hard quota. In addition, it is expected to increase the net benefit to public finances. The MAC suggested an upfront charge of £1,000 per year of the visa applied for, which is the first-year amount for a medium or large sponsor. The ISC remains at £1,000, though some workers pay a lower charge or are exempt.
7.30. If EEA nationals are brought within the current Tier 2 template the businesses employing EEA migrants would potentially have to pay the ISC. We believe that extending the ISC to cover EEA citizens under any post-Brexit work-permit scheme would, on balance, be appropriate. It is likely to have positive fiscal benefits, though potentially at the expense of deterring some employers from sponsoring skilled workers and raising the costs of those who continue to sponsor them. However, we suggest that the impacts and level of the ISC should be fully evaluated now that it has been in operation for a few years.
7.31. We believe that the ISC should remain as a flat rate so that it is lower in percentage terms for higher-paid workers.
Sponsor licence and the resident labour market test
7.32. Responding to our call for evidence, many employers complained about the red tape associated with the current Tier 2 (General). Problems with the administration of Tier 2 (General) are raised at almost every meeting the MAC has with employers.
7.33. A detailed analysis of the operation of Tier 2 was not within the scope of this enquiry. The MAC has reviewed and made recommendations on Tier 2 in the
193 https://www.gov.uk/government/publications/migration-advisory-committee-mac-review-tier-2-
migration

115
past, but because leaving the EU may significantly change the volumes of applications if free movement is ended we think that the requirements associated with the scheme should be carefully reviewed. This should include consideration as to whether the bureaucratic requirements of the current sponsorship and sponsor licensing processes can be reduced in order to facilitate high-skilled migration.
7.34. The Resident Labour Market Test (RLMT) requires employers to prove that no settled worker could fill the vacancy, meaning that they have advertised the roles in the UK for four weeks. Many countries have a similar provision, designed to provide reassurance to voters that settled workers have the first opportunity to fill any vacancy. We are sceptical about how effective the RLMT is in doing this though evaluation is hard because the criterion is subjective. We think it likely that the bureaucratic costs of the RLMT outweigh any economic benefit, but offer no opinion on its political benefit. We therefore recommend the abolition of the RLMT. However, if it is to be retained we advise that the Government should exempt a larger share of jobs. Currently, those earning more than £159,600, transferring from Tier 4, at PhD level or on the shortage occupation list are exempt. The salary threshold part of this should be reduced substantially, further work would be needed to establish a lower threshold but we would expect it to be below £50,000. The requirement that no settled worker could fill the vacancy should be relaxed for all jobs to allow employers to appoint the best available candidate.
7.35. We do think it important to have protection against employers using migrants to under-cut UK-born workers. The best protection is a robust approach to salary thresholds and the Immigration Skills Charge and not the RLMT.
7.36. The sponsor licensing system should also be reviewed. It is much harder for small and medium-sized businesses to use the current system than it is for large organisation. One possible direction is to involve sector bodies more as ‘umbrella’ sponsors for their members as is done to a small extent in the Tech Nation Visa and the Tier 1 (Graduate Entrepreneur) schemes. However we acknowledge this is a complicated area. An important feature of the sponsorship system is that responsibility for the migrant rests with someone who sees them on a day-to-day basis and the use of umbrella organizations would weaken this.
7.37. The Government should also conduct regular surveys of firms who apply for Tier 2 visas to find out how the system works in practice. At the moment, most of the contacts seem to be with bodies who are not the ultimate users of the system and may have different interests from the firms who will be employing the migrants. The Independent Chief Inspector of Borders and Immigration is currently undertaking an inspection of the Home Office’s charging for services in respect of its asylum, immigration, nationality and customs functions.
The Tier 2 cap
7.38. We believe the Tier 2 cap should be removed. We do not believe that the welfare of existing residents is best served by a cap for two reasons. First, the cap, when it binds, constrains inflows of a group of migrants which the evidence

116
suggests are the most economically beneficial. The Government’s industrial strategy seeks to increase employment of the type of workers that are currently refused a visa when the cap binds. Second, the cap creates unpredictability when it binds as there can be sharp increases in the minimum salary threshold that skilled visa applications face. This uncertainty imposes a cost on employers by preventing them from planning ahead.
7.39. It is not possible to simultaneously set both the criteria under which people are admitted and the number of people who will be admitted. A cap may be viewed as important as part of a political strategy to provide an impression that the system is under control but it is important to recognise that it has an economic and social cost. We believe that if the Government wants to reduce migration numbers it would make more economic sense to do so by varying the other aspects of the scheme criteria e.g. salary thresholds and the level of the ISC. Any such changes should be clearly signalled in advance.
Labour market competition
7.40. One of the features of the current Tier 2 system is that migrant workers cannot easily change employers. Without the ability to change employers for better wages or work conditions the employer has a clear advantage over these non-EEA migrant workers. This contrasts with EEA workers who currently are free to change employers without restrictions. If EEA workers are brought within the Tier 2 system it is important to ensure that this does not reduce competition in the labour market. It is very important that the system does not, by design, have the unintended consequence of holding down wages. In previous reports we have outlined concern that this has been happening with the intra-company transfer route in the IT194 sector and in some NHS trusts in the hiring of non-EEA nurses.195
7.41. There needs to be routine monitoring of the use of the system in order to detect any such concerns as they arise. The Real Time Information data which HMRC hold could perhaps be used for this purpose. In addition, in-country employer switches should be made easier for Tier 2 migrants: this would enable migrants to move employers for better wages and conditions.
Shortage Occupation List
7.42. Currently, the occupations on the Shortage Occupation List (SOL) and Tier 2 (General) visas are only available in occupations skilled to RQF/NQF level 6 and above. The Commission letter asks whether the SOL should be expanded to cover occupations skilled below this level.
194 Migration Advisory Committee (2016). Review of Tier 2 report: balancing migrant selectivity, investment in skills and impacts on UK productivity and competitiveness, Migration Advisory Committee, January, 2016, p211. 195 Migration Advisory Committee (2016). Partial Review of the shortage occupation list and nursing: Migration Advisory Committee, London, March, 2016, page 106.

117
7.43. An occupation is placed on the SOL if it is sufficiently skilled, there is a shortage and it is sensible to think that this shortage could only be resolved in a reasonable period of time through immigration. The shortage criterion is currently assessed using a range of top-down indicators and bottom-up evidence from stakeholders. Occupations on the SOL must still meet the Tier 2 salary thresholds.
7.44. There are several advantages currently of being on the SOL. First, jobs are not subject to the resident labour market test, meaning companies do not have to prove that they have advertised roles in the UK for four weeks before recruiting from abroad. Second, occupations on the SOL get priority for T2 visas if the cap is hit. Third, occupations on the SOL do not need to meet the £35,000 threshold for settlement. If, as we recommend, the Tier 2 cap and RLMT are abolished two of the main advantages of being on the SOL would disappear.
7.45. Our recommendation that Tier 2 (General) be open to a wider range of jobs implies the SOL should also be open to all occupations skilled to RQF 3 and above, as long as they meet an appropriate salary threshold. We expect that some of the newly included occupations might meet the criteria for being placed on the SOL as it is possible for non-graduate occupations to be in shortage and for those shortages not to be quickly resolved by training resident workers. Even where there are no shortages currently, they may emerge if free movement is ended.
7.46. Whilst the MAC has carried out considerable analysis on the methodology of the SOL it is important to understand its limitations. As we have made clear in previous reports, identifying shortages is methodologically and informationally demanding. While the SOL can be a useful mechanism to facilitate migration into certain jobs, it is not realistic to expect the SOL to be continuously a perfect reflection of the current needs of the UK labour market. It would therefore not be sensible to design a policy that is overly reliant on the SOL in determining which workers are eligible for work authorisation. In June 2018 the Home Secretary commissioned the MAC to undertake a full review of the composition of the SOL to report back in Spring 2019. We will return to these issues in more detail in the next report.
Low-skilled workers
7.47. At the moment it is not possible to obtain a work permit for non-EEA workers in low-skilled jobs but that is because there has been sufficient supply from within the EEA. This does not mean there are no non-EEA workers in lower-skilled jobs, just that they have not entered the UK through the work route – our briefing note estimated that 170,000 recent non-EEA migrants are in low-skilled occupations of which a sizeable proportion do not seem to have entered the UK through a work migration route (MAC 2017, EEA Briefing note, Table 2).
7.48. Our proposal that Tier 2 be open to jobs at RQF 3+ means that it cannot be used to fill vacancies in jobs classified at level RQF1,2. As described in our Interim Update much of the EEA migration since 2004 has been into lower-skilled jobs and the ready supply of EEA workers has given a tail-wind to some sectors that they would obviously like to continue.

118
7.49. Undoubtedly some sectors will complain vociferously about being faced with an alleged cliff-edge in their supply of labour. However, even if there was no work route for low-skilled workers, the existing stock of low-skilled migrants would not change much immediately and there is likely to be a continued flow of lower-skilled migrants through the family route. We are not convinced there needs to be a work route for low-skilled workers but, if the Government chooses to go down this route, we do have views on the way it should be implemented. We shall now turn to some of these possibilities.
Sector based routes
7.50. The MAC does not recommend introducing separate employer-led sector-based routes (with the possible exception of seasonal agriculture discussed below) for low-skilled migrants who do not come under our recommended revised Tier 2 process. We believe that workers should have the option to be mobile across sectors and occupations and there is no case for giving privilege to some lower-skilled sectors over others in access to labour. In low-skilled jobs little training is required and thus it should be possible for employers to hire workers from other sectors.
7.51. It is important to encourage sectors and employers to compete on wages and work conditions to make their sector more attractive and sector-based schemes would not do that.
Tier 5 Youth Mobility
7.52. Tier 5 (Youth Mobility) is a cultural exchange scheme for people aged 18 – 30 from the following participating countries: Australia, New Zealand, Canada, Japan, Monaco, Taiwan, South Korea and Hong Kong. Individuals can stay in the UK for up to 2 years to experience life in the UK – they can work and study but are not allowed to bring dependants. The scheme operates on a reciprocal basis with opportunities for young British people to live and work in participating countries. Each country gets an annual allocation of places which is either 1,000 places or an allocation that is equivalent to the last recorded number of visas issued to British nationals under their reciprocal scheme. Tier 5 workers can work in all jobs and, though we have little information on where they currently work, it seems likely that many are in lower-skilled jobs.
7.53. If the Government does want to provide a safety valve for the employers of low-skilled workers then an expanded Youth Mobility route could potentially provide a good option. The benefits of this option are that younger migrants are more likely to be net fiscal contributors (because the scheme does not allow dependants) and workers have freedom of movement between employers, which is likely to reduce the risk that employers will use migrants’ visa status to hold down their wages. This expanded Youth Mobility scheme could potentially be open to EU citizens as is mentioned in the Government White Paper196.
196 https://www.gov.uk/government/publications/the-future-relationship-between-the-united-kingdom-
and-the-european-union

119
7.54. The Youth Mobility scheme allows entry for only two years avoiding permanent increases in the population. It also has the advantage of not requiring small employers to make applications. Currently there is no path to settlement but in-country switches to Tier 2 should be allowed.
7.55. There are risks to relying on a strictly temporary route, especially if it is large-scale. This includes the fact that workers do not have an opportunity to integrate and improve their skills over time (e.g. language ability or country-specific knowledge). Having a cycle of temporary migrants may not be good for communities. As a result, any expanded Youth Mobility scheme should be closely monitored and overall numbers could be restricted if felt it was growing too large.
Seasonal Agricultural Workers Scheme (SAWS)
7.56. The labour market for seasonal agricultural labour is completely separate from the market for resident workers in a way that is unlike any other labour market. According to the ONS, 99 per cent of seasonal agricultural workers are from EU countries197 and it is difficult to imagine a scenario in which this workforce can come from the resident labour market. There is no other sector in which the majority of workers are migrants and very few with a migrant share above 25 per cent. Many other countries, including EU countries, have a version of a seasonal agricultural workers scheme (SAWS). In September 2018, the Government announced a new pilot scheme to allow the hiring of 2,500 non-EU migrant seasonal horticultural workers for up to six months198.
7.57. We think it important to be clear about the advantages and disadvantages of a version of SAWS. If there is no such scheme it is likely that there would be a contraction and even closure of many businesses in the parts of agriculture in the short-run, as they are currently very dependent on this labour. Many of these sectors have grown faster since 2004 primarily using NMS migrants so this would be a reversal of that trend.
7.58. Figure 7.1 shows the change in the hectares planted with some selected labour-intensive crops index to 2004, the year the 8 Accession new member states joined the EU. It shows how the number of hectares dedicated to growing these selected crops was falling prior to this event and either stabilised or expanded afterwards.
197https://www.ons.gov.uk/peoplepopulationandcommunity/populationandmigration/internationalmigration/articles/labourintheagricultureindustry/2018-02-06 198 https://www.gov.uk/government/news/new-pilot-scheme-to-bring-2500-seasonal-workers-to-uk-
farms

120
Figure 7.1: Hectares planted of crops over time (2004=100)
Source: DEFRA199, latest asparagus data for 2015
7.59. While the failure to have some type of SAWS would be bad for the sector it is a small, low-wage, low-productivity sector in the wider UK context so this should not be seen as catastrophic for the economy as a whole. It may lead to modestly higher prices for consumers for certain horticultural products.
7.60. If there is a scheme for seasonal agricultural workers one has to be very clear that it would give privileged access to migrant labour for one sector which is generally low-wage and low-productivity. It is important that this scheme is restricted to genuine seasonal agricultural workers and does not become used by others.
7.61. There is also the risk that the sector would use a SAWS scheme to avoid the need for higher productivity. The MAC Migrant Seasonal Workers report in May 2013200 stated, “a replacement SAWS should only be considered if it would help horticulture thrive in the long run…It is possible that any replacement scheme could be viewed as a transitional measure until the requisite technology – robot apple pickers, for example – comes on-stream.”
7.62. We think that the sector should pay something in return for this privileged access to labour. We propose that employers are required to pay a higher minimum wage in order to encourage increases in productivity, perhaps along the lines of US adverse effect wage rates. Alternatively, or in addition, one could use a form of the ISC for workers on this scheme. These are not features of the proposed pilot.
199 https://www.gov.uk/government/statistics/latest-horticulture-statistics 200 https://www.gov.uk/government/publications/seasonal-migrant-workers

121
7.63. It is important that the newly-announced pilot scheme is properly evaluated to ensure it is not an easy option that allows the agricultural sector access to low-skilled migrant labour on a permanent basis. Ensuring proper compliance is very important as employers would have considerable control over their workers due to their visa status and there would need to be robust mechanisms in place to ensure that this does not lead to abuse
Regional variation in the immigration system
7.64. The devolved administrations in Northern Ireland, Scotland and Wales all expressed a desire for specific, region-focused responses to their needs. Our Interim Update provided a discussion of some of these issues. We do not repeat all the analysis from that document here but do draw links where appropriate. We outline where our recommendations align or differ from the views expressed by the devolved administrations. We also summarise some new information we have received since the publication of the Interim Update.
Northern Ireland
7.65. Northern Ireland is the only part of the UK that has a land border with an EU country. Our Interim Update discussed the consequences of this and we note that any future restrictions of the rights of non-Irish EEA citizens to work in the UK would not require border infrastructure, as rights to work are checked in the workplace and not at the border.
7.66. Following the publication of the Interim Update, the Head of the Northern Ireland Civil Service wrote to the MAC in May 2018 expressing the view that this conclusion did not take account of the economic impact that could follow. The letter further argued that if Northern Ireland was to achieve the goals set out in the “Economy 2030: A consultation on an industrial strategy for Northern Ireland” document, access to labour and skills at all levels was necessary.
“Were Northern Ireland employers to find themselves in a scenario where they had access to skills and labour on a more constrained basis than their Republic of Ireland counterparts there is a very real risk of Northern Ireland employers being forced to relocate activity south of the land border to maintain their competitive advantage.”
Head of the Northern Ireland Civil Service letter to MAC, May 2018
7.67. We agree that the location of economic activity on either side of the Northern Ireland/Ireland border is likely to be more sensitive to relative economic conditions that, say, the location of economic activity on the English/French border. There are already differences in the regulatory environment between Northern Ireland and Ireland e.g. in access to non-EEA labour and in labour regulations. The national minimum wage in Ireland is currently 9.55EUR per hour (approximately £8.50) as opposed to £7.38 in the UK (or £7.83 for those aged 25+). And pound-euro exchange rate movements alter relative prices and

122
costs on both sides of the Irish border in a way that has little to do with local economic conditions.
7.68. Any more restrictive approach to EEA migration in Northern Ireland would be another relevant, potentially large, factor that might cause difficulties for some sectors, especially the important, but low-skill, agri-food sector. What could be done about this? We think it would be better if any difficulties were met with support to increase investment and productivity, an ambition laid out in the Northern Ireland industrial strategy identified above. The alternatives of either having a separate low-skill migration regime for Northern Ireland or letting these issues drive the design of a UK-wide system seem less attractive to us.
7.69. One other concern expressed in Northern Ireland was that the salary thresholds were unreasonable given the generally lower levels of salaries in Northern Ireland. In addition, when the cap binds, the increase in the salary thresholds could squeeze out Northern Irish employers. Our proposal to remove the cap would eliminate the second problem and, as shown in Table 7.3, we do not think salaries for skilled workers in Northern Ireland are sufficiently different from the rest of the UK to justify lower salary thresholds.
7.70. Employers in Northern Ireland (as in the rest of the UK) highlighted their desire to see the existing non-EU workers visa system improved and for employers’ needs to be addressed in a more speedy and cost effective manner. This is in line with our recommendations.
Table 7.3: Percentage of existing employee jobs with salaries greater than or equal to the 25th percentile of their occupation or £30,000 (whatever is greatest) grouped by RQF level of the occupation and region
Region RQF level
6+ 4-5 3 <3 Whole UK 72 51 37 17 Wales 69 39 31 12 Scotland 70 52 36 15 Northern Ireland 69 48 30 10
UK excluding London & South East 67 45 33 15 North East 63 37 32 14 North West 66 46 33 14 Yorkshire and The Humber 65 42 32 14 East Midlands 65 41 33 14 West Midlands 69 45 35 17 South West 66 46 31 15 East 71 50 37 17 London & the South East 79 61 47 24 London 83 67 53 29 South East 73 53 40 18 Notes: Calculations using ASHE (2017). SOCs matched to RQF skill levels Immigration Rules Appendix J. Sample restricted to full-time employees on adult rates who have been in the same job for more than one year. Employees who do not have a valid work region, who are less than 16 years old or with missing or zero annual gross salaries are excluded.

123
Scotland
7.71. In February 2018 the Scottish Government published “Scotland’s Population Needs and Migration Policy”201 laying out its view about the desirable migration system for Scotland. This argued that Scotland had distinct economic needs and that there was an “overwhelming case for Scotland to have the power to tailor its own migration policy”202.
7.72. We do not express a view on whether migration should be a devolved or reserved matter as that is a political decision. We do assess below whether Scotland has distinct economic needs.
7.73. The Scottish Government take the view that EU migration to Scotland is essential for preventing a return to population decline, to offset the ageing of the existing population and to support remote communities. We discussed the evidence for these views in the Interim Update. Although lower migration might lead to population decline, this problem is not something that starts at the Scottish border, some Northern English regions have similar prospects. Migration is much less effective at dealing with a rising old age dependency ratio than increases in the pension age and immigration may not be an effective strategy for sustaining remote communities unless the reasons for locals leaving are addressed. Overall, we were not of the view that Scotland’s economic situation is sufficiently different from that of the rest of the UK to justify a very different migration policy. The one area of current (though small) difference is in the shortage occupation list – we will return to that in our next report.
“The cap on the total number of Tier 2 visas issued each month is intended
to help reduce net inward migration, but we heard evidence that in practice
it prioritises those roles with the very highest salaries to the exclusion of
other criteria—disadvantaging Scottish businesses in favour of those in
London and the South East who offer the highest salaries.”
“Immigration and Scotland” report by House of Commons Scottish Affairs Committee, July 2018
7.74. In July 2018 the House of Commons Scottish Affairs Committee published a
report “Immigration and Scotland”203. The report recommended that the Government review how the visa cap operates to ensure that it does not disproportionately benefit London and the South East at the expense of the rest of the UK. While we do not support having a lower salary threshold for some parts of the UK for the reasons stated above in relation to Northern Ireland, our proposal for the removal of the cap is in line with this recommendation.
201 https://www.gov.scot/Publications/2018/02/5490 202 https://news.gov.scot/news/a-tailored-migration-system-for-scotland 203 https://publications.parliament.uk/pa/cm201719/cmselect/cmscotaf/488/488.pdf

124
7.75. The Scottish Affairs Committee recommended that the UK Government commission a review of all options for increased regional differentiation in the UK immigration system and that this review sets out the impacts this would have on businesses, local employment and communities. This is for the Government to take a view on but we do not consider that there is sufficient evidence to make such a differentiation on economic grounds. This decision would be a political one.
Wales
7.76. The Welsh Government published “Brexit and Fair Movement of People: Securing Wales’ Future”204 in 2017 and submitted this as their response to our call for evidence. This document proposed that the Welsh Government discuss with the UK Government a reform of the wider UK migration policy that recognised that the distinct needs of Wales cannot easily be met by the UK-wide approach currently in place. Their preference is for giving the Welsh Government a stronger role in determining how future migration to Wales be managed in order that Wales’ key sectors can continue to recruit from Europe.
7.77. The Welsh report considered that a future restrictive approach to immigration would not be in Wales’ best interests, and expressed concerns, as in Scotland and Northern Ireland, that the Tier 2 cap and national salary thresholds do not serve Welsh interests. The abolition of the cap would help in ensuring Welsh employers are not crowded-out if salary thresholds rise but we do not think salaries are sufficiently lower in Wales to justify lower thresholds.
7.78. The Welsh report wanted to see vigorous enforcement of the law to cut down on exploitation of workers, and we have pointed out the importance of this in previous MAC reports. The Welsh also stated that tackling exploitation of workers will improve wages and conditions for all workers and that more be done to tackle all exploitation of workers, particularly the low paid.
7.79. Although we do not consider that there is a strong economic case for regional differentiation in migration policy, we do think there are persistent regional inequalities that need to be addressed to ensure that all parts of the UK benefit from economic growth - one of the pillars of the UK industrial strategy. The appropriate regional policy is outside the remit of this present report.
7.80. In previous reports the MAC has recommended against introducing more regional variation for a number of reasons. We have considered it desirable to keep the system as simple as possible and the salary thresholds have been set based on national pay distributions and not by the demands of higher wage regions. Similar arguments have been used against regional variation in setting the national minimum wage.
204https://www.researchonline.org.uk/sds/search/download.do;jsessionid=49B242C2ED6F48EA245A2
C4BBAEF4917?ref=B49161

125
7.81. Many of those who argue in favour of regional variation believe that this would lead to a salary threshold outside of London and the South East that is significantly lower than the UK average. More likely would be an increase in salary thresholds in London and the South East.
Self-employment
7.82. Currently the self-employed worker route is through Tier 1(Entrepreneurs) and Tier 1 (Exceptional Talent) schemes. In addition to doubling the number of visas available on the exceptional talent route to 2000, the Government has recently announced the intention to introduce a ‘start-up’ visa designed to attract the best global talent and encourage innovation in the UK. More could be done to evaluate how the existing routes are working – for example what salaries entrepreneurs are earning within a set number of years of working in the UK. We recommend that some consideration be given to evaluating these schemes. Currently most self-employed workers from within the EEA are in low-skilled roles (MAC 2017 EEA Briefing note chart 14). The self-employed are more difficult to regulate than those employed by companies without imposing greater restrictions.
7.83. It is unclear to us how well the existing scheme works, let alone the new one, and without this clarity we do not feel able to make recommendations on how this scheme should be changed if self-employed workers from the EEA were to be brought within it.
The public sector
7.84. There is often a claim for public-sector workers to be treated differently, most commonly on the grounds that the value of the work is not reflected in the salaries paid. This is then used as an argument for lower salary thresholds in the public sector. We are concerned that this fails to address why public sector workers are paid less than the value of their work. It is tempting for any government to pay public sector workers lower than the market wage especially when public finances are tight and there is a risk that a special case for migrant public sector workers contributes to this temptation. The MAC does not think the public sector should be treated differently. Although we do not recommend special treatment for the public sector the removal of the Tier 2 cap would help the public more than the private sector.
7.85. We are concerned about social care which struggles to recruit and retain workers. The fundamental problem is that these jobs are not attractive to enough UK residents at current terms and conditions, leading to reliance on migrant workers (mostly from outside the EEA). Many care workers are paid the minimum wage and it is not surprising that the sector then struggles to recruit resident workers as other minimum wage jobs are more attractive. Care workers pay is low because social care is mostly publicly-funded and budgets are tight. Our preferred solution would be that the financing of social care is changed to allow higher wages to be paid to workers alleviating recruitment and retention problems. In the absence of such a change it is likely the sector will continue to struggle to recruit resident workers and there will be demands to be allowed to hire migrant workers to plug gaps.

126
Managing the consequences of migration
Evidence-based migration policy and future analysis
7.86. There is insufficient attention given by the Government to monitoring or evaluating the impact of policy changes. We know little about the impact of the immigration skills charge, the health charge or changes to the Tier 2 system. We know almost nothing about the actual earnings of non-EEA migrants with a Tier 2 visa. This is because there is no monitoring or evaluation despite data existing which could be used for this purpose.
7.87. There is a need for much more systematic evaluation of whether labour migration policies are achieving their intended goals. This requires much better use of existing data. The Government has the option to do this by linking HMRC and Home Office records, to give a detailed picture of the employment and earnings trajectories of different groups of migrants over time. Access to such data would greatly improve the ability of the MAC and others to understand the impacts of migration policies, and as such should be a priority if the Government is serious about evidence-based policy-making in the migration area. Better data would also allow a better assessment of the regional variation in the impact of migration.

127
Summary of recommendations for work migration post-Brexit
1. General principle behind migration policy changes should be to make it easier for higher-skilled workers to migrate to the UK than lower-skilled workers.
2. No preference for EU citizens, on the assumption UK immigration policy not included in agreement with EU.
3. Abolish the cap on the number of migrants under Tier 2 (General).
4. Tier 2 (General) to be open to all jobs at RQF3 and above. Shortage Occupation List will be fully reviewed in our next report in response to the SOL Commission.
5. Maintain existing salary thresholds for all migrants in Tier 2.
6. Retain but review the Immigration Skills Charge.
7. Consider abolition of the Resident Labour Market Test. If not abolished, extend the numbers of migrants who are exempt through lowering the salary required for exemption.
8. Review how the current sponsor licensing system works for small and medium-sized businesses.
9. Consult more systematically with users of the visa system to ensure it works as smoothly as possible.
10. For lower-skilled workers avoid Sector-Based Schemes (with the potential exception of a Seasonal Agricultural Workers scheme)
11. If a SAWS scheme is reintroduced, ensure upward pressure on wages via an agricultural minimum wage to encourage increases in productivity.
12. If a “backstop” is considered necessary to fill low-skilled roles extend the Tier 5 Youth Mobility Scheme.
13. Monitor and evaluate the impact of migration policies.
14. Pay more attention to managing the consequences of migration at a local level.

128
Glossary of Terms and Abbreviations
APS
The Annual Population Survey is a continuous household survey, covering the UK, with the aim of providing estimates between censuses of main social and labour market variables at a local area level.
ASHE
Annual Survey of Hours and Earnings is a comprehensive source of information on the structure and distribution of earnings in the UK.
BEIS
Department for Business, Energy, and Industrial Strategy is the government department responsible for business, industrial strategy, science, research and innovation, energy and clean growth, and climate change.
CORE
The continuous recording of lettings and sales in social housing in England is a national information source that records information on the characteristics of both private registered providers and local authority new social housing tenants and the homes they rent.
CPI
Consumer Price Index measures changes over time in the general level of prices of goods and services that a population acquires, uses or pays for consumption.
DEFRA
Department for Environment Food & Rural Affairs is the government department responsible for safeguarding the natural environment, supporting the food and farming industry, and sustaining a thriving rural economy.
DEL
Department Expenditure Limit is the government budget that is allocated to, and spent by, government departments.
DWP
Department for Work and Pensions is the government department responsible for welfare, pensions and child maintenance policy.
EAL
People with English as an additional language.

129
EEA
The EEA includes European Union (EU) countries plus Iceland, Liechtenstein and Norway.
G7
The Group of Seven is an informal forum of countries representing around half of global economic output who are: Canada, France, Germany, Italy, Japan, UK and US.
G8
The Group of Eight is a forum that brings together eight global leaders to address international issues and tackle the most pressing global challenges. The group consists of all G7 countries plus Russia.
GDP
Gross Domestic Product measures the total value of all of the goods made, and services provided, during a specific period of time in a country. It is used to show if and how much the economy is growing.
GVA
Gross Value Added, measures the contribution to the economy of each individual producer, industry or sector in a country.
HMRC
Her Majesty’s Revenue and Customs is a government department responsible for the UK’s tax, payments and customs.
Home Office
The Home Office is the lead government department for immigration and passports, drugs policy, crime, fire, counter-terrorism and police.
ICT
Intra Company Transfers refers to people who work for multi-national companies and are transferred by their employer from an overseas location to a UK branch of the company. Those from non-EEA countries require a visa to enter the UK and are counted in Home Office Control of Immigration statistics.
IHS
Immigration Health Surcharge is a fee paid by non-EEA nationals coming to live in the UK for longer than 6 months to gain access to the NHS.

130
ISC
Immigration Skills Charge is an additional charge for each foreign worker recruited by a UK employer.
LEA
Local Education Authorities are responsible for the local administration of state sector education services in England and Wales.
LFS
The Labour Force Survey is a study of the employment circumstances of the UK population. It is the largest household study in the UK and provides the official measures of employment and unemployment.
LSOA
Lower Level Super Output Area are small areas designed to be of a similar population size, used in surveys to sample the population.
LTIM
Long-term International Migration are the official government statistics on migration to and from the UK, produced by ONS by adjustments to the International Passenger Survey.
MHCLG
Ministry of Housing, Communities and Local Government is the government department responsible for driving up housing supply, increasing home ownership, devolving powers and budgets to boost local growth in England, supporting strong communities with excellent public services.
NHS
The National Health Service is the publicly funded health care system of the UK.
NINo
Unique identifying numbers given to all people born in the UK and to non-UK nationals over 16 who are planning to work and/or claim benefits in the UK (national insurance numbers).
NISRA
Northern Irish Statistics and Research Agencies.
NRS
National Records of Scotland.

131
OBR
The Office for Budget Responsibility gives independent and authoritative analysis of the UK’s public finances. OBR is an executive non-departmental public body, sponsored by HM Treasury.
OECD
Organisation for Economic Co-operation and Development is an international organisation of 33 countries, mostly in North America and Europe. It defines itself as a forum of countries committed to democracy and the market economy.
ONS
Office for National Statistics is the executive office of the UK Statistics Authority, a non-ministerial department which reports directly to Parliament. It produces official statistics on immigration, emigration, and net migration, amongst other areas.
PNC
Police National Computer is a national database of information available to all police forces and law enforcement agencies in the UK.
RLMT
The resident labour market test requires a UK employer to advertise a job domestically for 28 days, before it can be offered to a foreign worker, if it’s not on the shortage occupation list.
SA
Self-assessment tax returns are required to be submitted to HMRC for any income sources which are not taxed at source (such as income from earnings through PAYE).
TFP
Total Factor Productivity, also called multi-factor productivity, measures the proportion of output not explained by traditionally measured inputs of labour and capital used in production.
United Kingdom
England, Wales, Scotland and Northern Ireland.
MAC migrant groupings
EU13+
Countries who were members of the EU before 2004 plus EEA members plus Switzerland; Austria, Belgium, Denmark, Finland, France, Germany, Greece, Italy,

132
Luxembourg, Netherlands, Portugal, Spain, Sweden, Iceland, Liechtenstein, Norway and Switzerland.
UK and Ireland are not part of this group – they are part of the ‘UK and Ireland’ MAC grouping.
NMS
New Member States are all post-2004 countries that joined the EU: Bulgaria, Croatia, Cyprus, Czech Republic, Estonia, Hungary, Latvia, Lithuania, Malta, Poland, Romania, Slovakia, Slovenia.
Non-EEA
Workers from countries not listed in EEA.
UK and Ireland
Other migrant groupings
EU2
The EU2 (formerly known as the A2) are the two countries that joined the EU on 1 January 2007: Bulgaria and Romania.
EU8
The eight central and east European countries that joined the EU on 1 May 2004 (formerly known as A8): Czech Republic, Estonia, Hungary, Latvia, Lithuania, Poland, Slovakia, Slovenia.
EU15
Countries that joined the EU prior to 2004:
Austria, Belgium, Denmark, Finland, France, Germany, Greece, Ireland, Italy, Luxembourg, Netherlands, Portugal, Spain, Sweden, United Kingdom.
EU28
All countries that joined the EU: Austria, Belgium, Bulgaria, Croatia, Cyprus, Czech Republic, Denmark, Estonia, Finland, France, Germany, Greece, Hungary, Ireland, Italy, Latvia, Lithuania, Luxembourg, Malta, Netherlands, Poland, Portugal, Romania, Slovakia, Slovenia, Spain, Sweden and UK.

Migration Advisory Committee report https://www.gov.uk/government/organisations/migration-advisory-committee © Crown copyright. ISBN: 978-1-78655-711-7