EE521 Analog and Digital Communications
38
April 12, 2005 Week 13 1 EE521 Analog and Digital Communications James K. Beard, Ph. D. [email protected] Tuesday, March 29, 2005 http://astro.temple.edu/~jk beard/
-
Upload
griffin-watson -
Category
Documents
-
view
37 -
download
5
description
EE521 Analog and Digital Communications. James K. Beard, Ph. D. [email protected] Tuesday, March 29, 2005 http://astro.temple.edu/~jkbeard/. Attendance. Essentials. Text: Bernard Sklar, Digital Communications , Second Edition SystemView Office E&A 349 - PowerPoint PPT Presentation
Transcript of EE521 Analog and Digital Communications

April 12, 2005 Week 13 1
EE521 Analog and Digital CommunicationsJames K. Beard, Ph. D.
Tuesday, March 29, 2005
http://astro.temple.edu/~jkbeard/
Week 13 2April 12, 2005
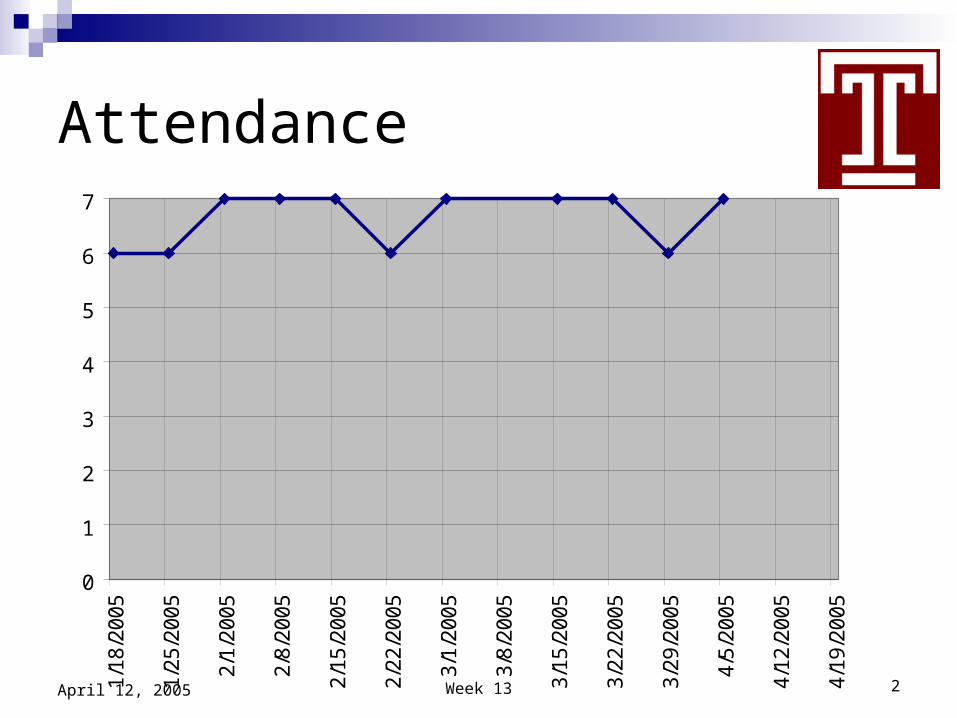
Attendance
0
1
2
3
4
5
6
7
1/18
/200
5
1/25
/200
5
2/1/
2005
2/8/
2005
2/15
/200
5
2/22
/200
5
3/1/
2005
3/8/
2005
3/15
/200
5
3/22
/200
5
3/29
/200
5
4/5/
2005
4/12
/200
5
4/19
/200
5

Week 13 3April 12, 2005
Essentials Text: Bernard Sklar, Digital Communications,
Second Edition SystemView Office
E&A 349 Tuesday afternoons 3:30 PM to 4:30 PM & before class MWF 10:30 AM to 11:30 AM
Term Projects Due April 19 (Next Week) Final Exam Scheduled
Tuesday, May 10, 6:00 PM to 8:00 PM Here in this classroom
Week 13 4April 12, 2005
Today’s Topics
Term Project Quiz
Main Quiz Backup Quiz
Term Project Discussion (as time permits)
Week 13 5April 12, 2005
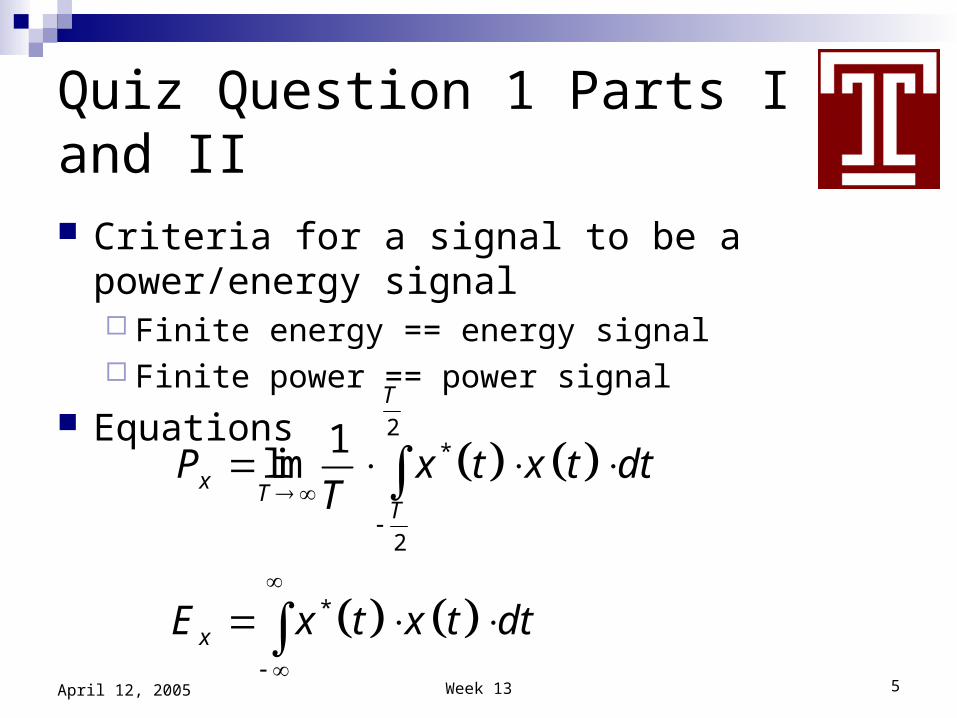
Quiz Question 1 Parts I and II
Criteria for a signal to be a power/energy signal Finite energy == energy signal Finite power == power signal
Equations
2*
2
*
1lim
T
x TT
x
P x t x t dtT
E x t x t dt

Week 13 6April 12, 2005
Question 1 Part III: Power Spectrum of an Energy Signal Energy spectrum is simply magnitude squared of Fourier
transform of energy signal Fourier transform of energy signal not defined Use the Fourier transform of the autocorrelation function
for the power spectrum
2*
2
1lim
exp 2
T
x TT
x x
R x t x t dtT
G f R j f d
Week 13 7April 12, 2005
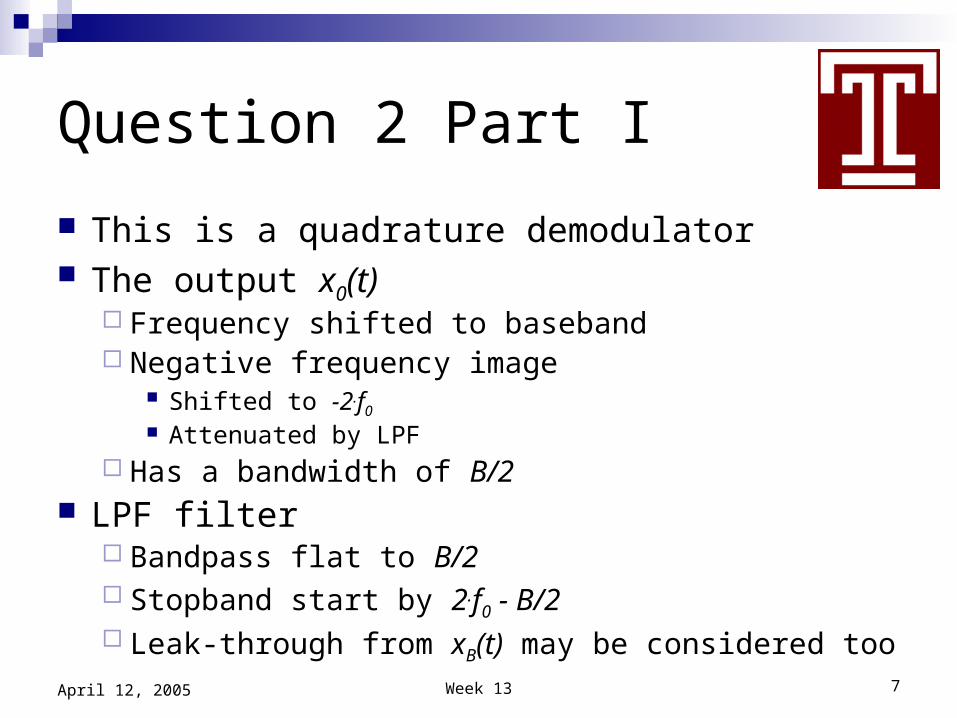
Question 2 Part I
This is a quadrature demodulator The output x0(t)
Frequency shifted to baseband Negative frequency image
Shifted to -2.f0
Attenuated by LPF Has a bandwidth of B/2
LPF filter Bandpass flat to B/2 Stopband start by 2.f0 - B/2 Leak-through from xB(t) may be considered too
Week 13 8April 12, 2005
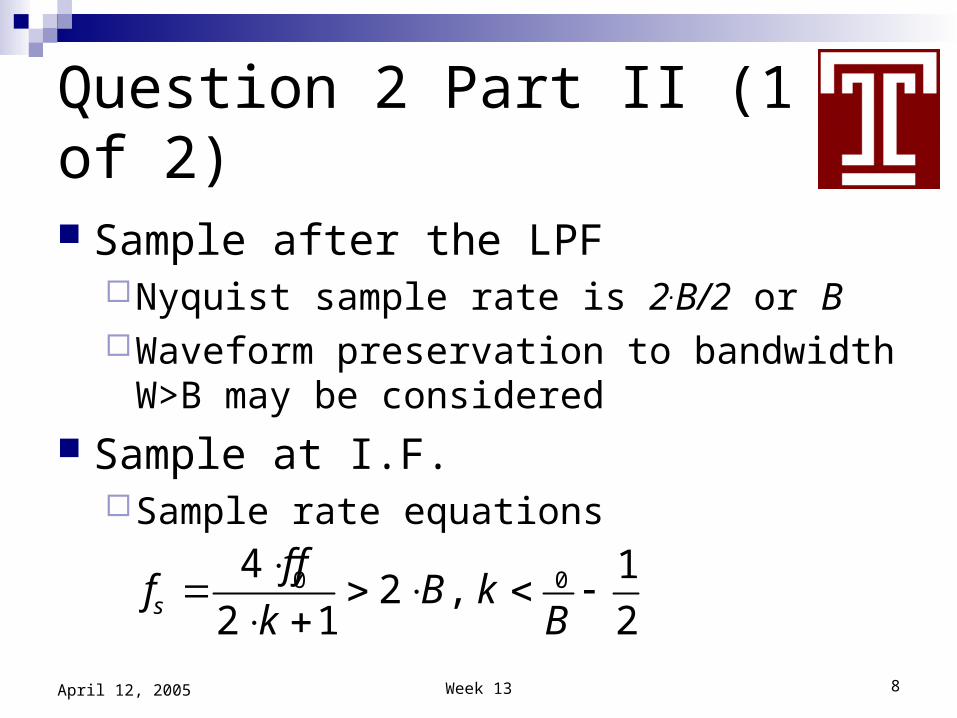
Question 2 Part II (1 of 2)
Sample after the LPFNyquist sample rate is 2.B/2 or BWaveform preservation to bandwidth W>B
may be considered Sample at I.F.
Sample rate equations
0 04 12 ,
2 1 2s
f ff B k
k B
Week 13 9April 12, 2005
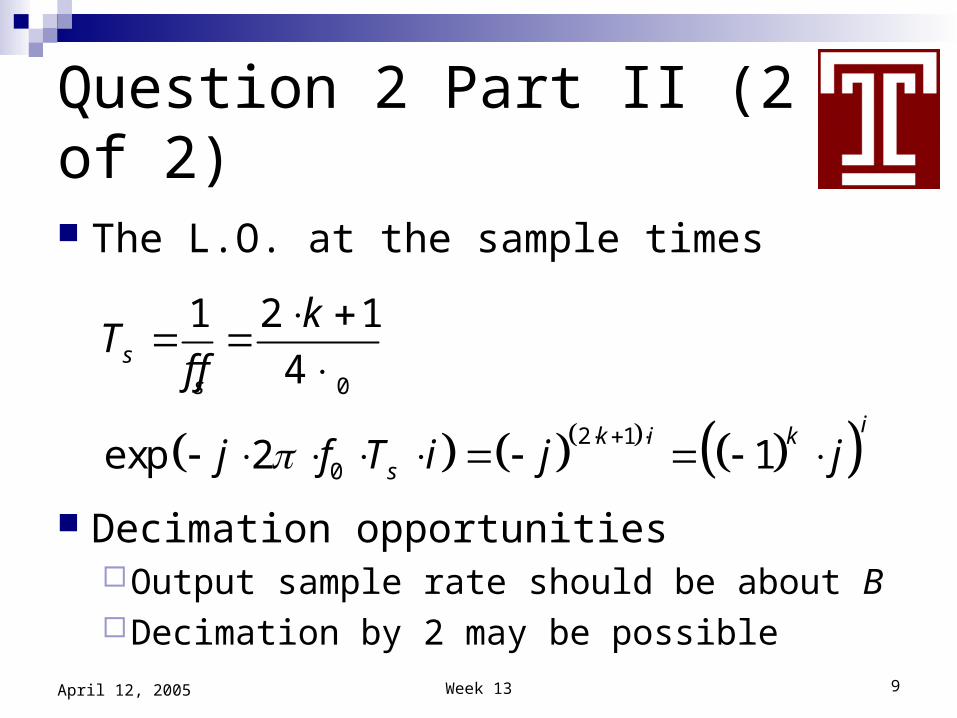
Question 2 Part II (2 of 2)
The L.O. at the sample times
Decimation opportunitiesOutput sample rate should be about BDecimation by 2 may be possible
0
2 1
0
1 2 1
4
exp 2 1
ss
ik i k
s
kT
f f
j f T i j j

Week 13 10April 12, 2005
Question 3
Antipodal pulses Amplitude is 1 volt, duration is T seconds Bandwidth is 1/T, noise PSD is N0
BER is
What is Eb/N0?
0
2 TBER Q
N

Week 13 11April 12, 2005
Question 4 Part I (1 of 2)
Mean number of bit errors per unit time is
BER for four errors per hour at 1 MB/s
ER BER R
96 1
sec1/ 15 min 60
min1.1 10
10 sec
ERBER
R

Week 13 12April 12, 2005
Question 4 Part I (2 of 2)
Using the base equation
The approximation given provides us with
0
2 bEBER Q
N
0 0
25.98, 17.76 12.5 dBb bE E
N N

Week 13 13April 12, 2005
Question 4 Part II
The SNR equation
Bandwidth of 1.2 MHz, bit rate 1 MBPS0
bERSNR
BW N
117.76 14.67 11.66 dB
1.2SNR
Week 13 14April 12, 2005
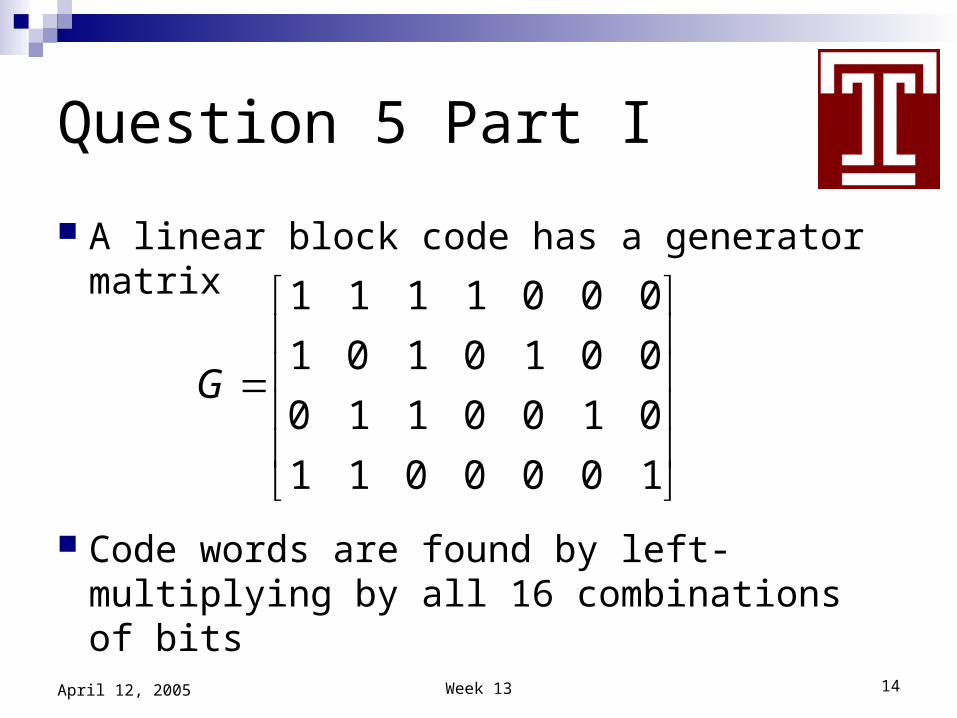
Question 5 Part I
A linear block code has a generator matrix
Code words are found by left-multiplying by all 16 combinations of bits
1 1 1 1 0 0 0
1 0 1 0 1 0 0
0 1 1 0 0 1 0
1 1 0 0 0 0 1
G
Week 13 15April 12, 2005
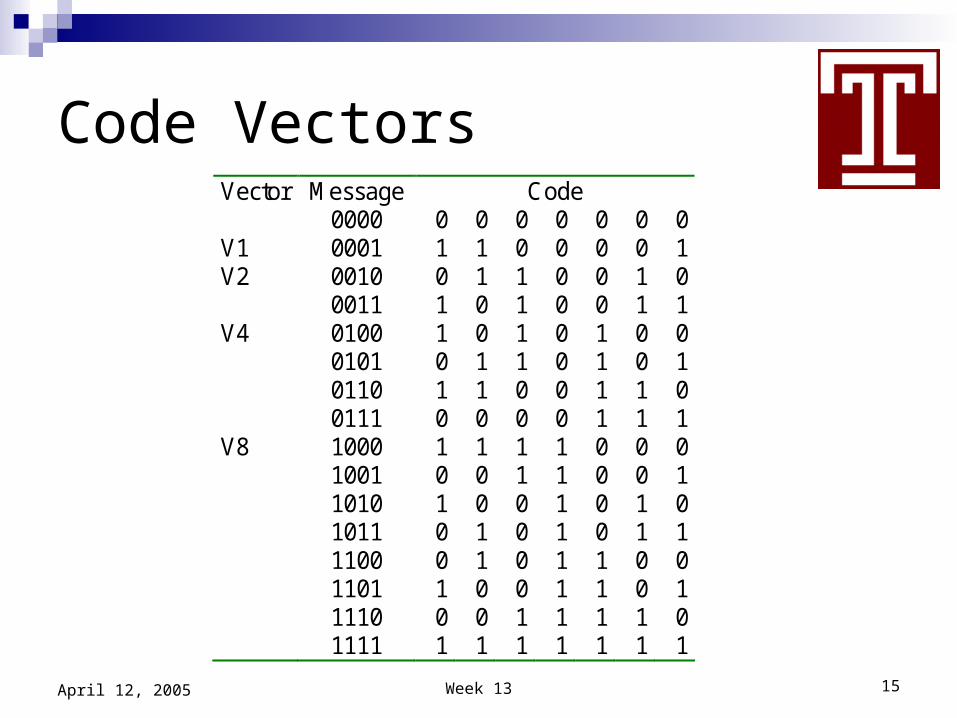
Code VectorsVector Message Code 0000 0 0 0 0 0 0 0 V1 0001 1 1 0 0 0 0 1 V2 0010 0 1 1 0 0 1 0
0011 1 0 1 0 0 1 1 V4 0100 1 0 1 0 1 0 0
0101 0 1 1 0 1 0 1 0110 1 1 0 0 1 1 0 0111 0 0 0 0 1 1 1
V8 1000 1 1 1 1 0 0 0 1001 0 0 1 1 0 0 1 1010 1 0 0 1 0 1 0 1011 0 1 0 1 0 1 1 1100 0 1 0 1 1 0 0 1101 1 0 0 1 1 0 1 1110 0 0 1 1 1 1 0 1111 1 1 1 1 1 1 1

Week 13 16April 12, 2005
Question 5 Part II (1 of 2)
The code is systemic because the last four columns are an identity matrix
The parity array portion of the generator matrix is the first three columns
1 1 1
1 0 1
0 1 1
1 1 0
P

Week 13 17April 12, 2005
Question 5 Part II (2 of 2)
The parity check matrix augments the matrix P along the other index with an identity matrix
3
1 0 0 1 1 0 1
| 0 1 0 1 0 1 1
0 0 1 1 1 1 0
TH I P
Week 13 18April 12, 2005
Question 5 Part III
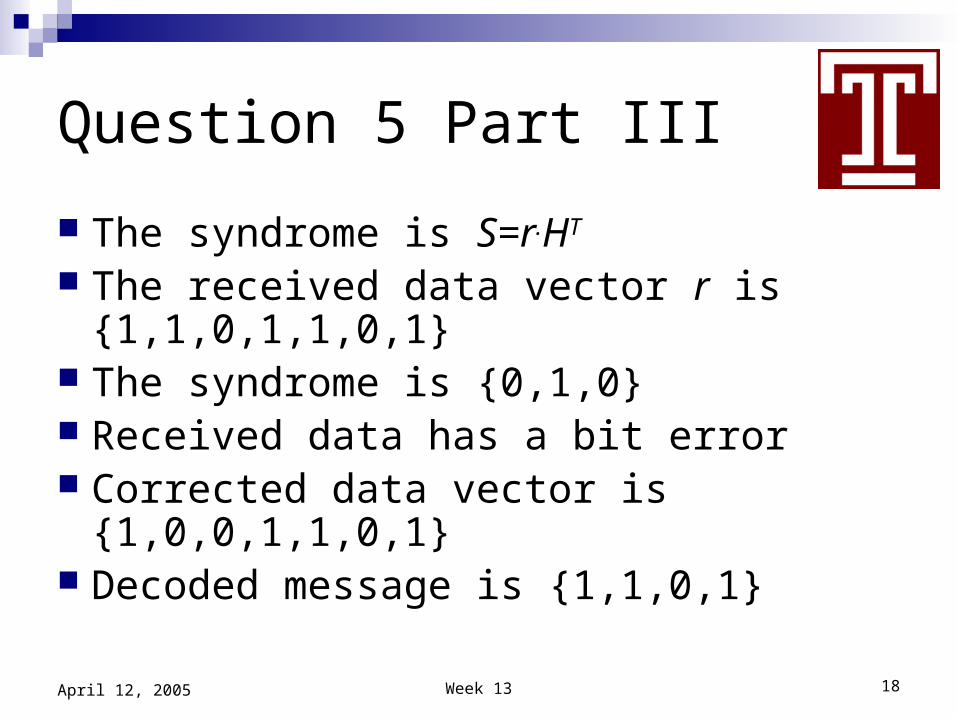
The syndrome is S=r.HT
The received data vector r is {1,1,0,1,1,0,1}
The syndrome is {0,1,0} Received data has a bit error Corrected data vector is {1,0,0,1,1,0,1} Decoded message is {1,1,0,1}

Week 13 19April 12, 2005
Question 5 Part IV
The minimum Hamming distance between codes Hamming distance between codewords == Hamming
weight of their sum Hamming weight of a codeword == Hamming
distance from the all-zeros codeword Closed on subtraction means all differences are equal
to one of the codewords Thus, the smallest Hamming weight is the
minimum Hamming distance For our problem this is 3

Week 13 20April 12, 2005
Question 5 Part V
Error-detecting and correcting capability
For a dmin of 3Correct 1Detect 2
1mind corrected detected

Week 13 21April 12, 2005
Question 6 ( 1 of 3)
Calculate the probability of message error for a (24,12) linear block code using 12-bit data sequences. Assume that the code corrects up to two bit errors per block and that the base BER is 10-3.

Week 13 22April 12, 2005
Question 6 (2 of 3)
Probability of a message error is the probability of 3 or more bit errors out of 24
Binomial distribution
Incomplete beta function
| , 1
, 1
NN ss
B es a
p
NP n a p N p p
s
I a N a
11
0
, 1x
bax
a bI a b t t dt
a b
Week 13 23April 12, 2005
Question 6 (3 of 3)
Probability of 3 errors is 1.98192E-06 Probability of 3 or more errors is
1.99238E-06 Differences is about 0.5% Improvement in BER is a factor of 505

Week 13 24April 12, 2005
Backup Quiz Question 1 Part I
See main quiz Question 2 Equation for the output
LPF Bandpass flat to B/2+Δf Stopband start by 2.f0 - B/2-Δf
Leak-through from xB(t) may be considered too
0 exp 2x t s t j f t

Week 13 25April 12, 2005
Backup Quiz Question I Part IISystemView
0
0
10e+3
10e+3
20e+3
20e+3
-40
-60
-80
-100
-120
Mag in d
B
Frequency in Hz (dF = 762.9e-3 Hz)
Cx FFT: 20 Log | FFT| Output R + jOutput I
UNSAMPLED OUTPUT

Week 13 26April 12, 2005
From Inspection of Output
Use cursor readout in SystemView Spectrum is down 30 dB at about 3700 Hz Passband to 3700 Hz Stopband starts by 16.5 kHz to attenuate image
at 20 kHz Operations
LPF to specifications Sample at two times 3900 Hz

Week 13 27April 12, 2005
System

Week 13 28April 12, 2005
Critical Block Parameters
LPF Parameters: Operator: Linear Sys Butterworth Lowpass IIR 4 Poles Fc = 6e+3 Hz Quant Bits = None Init Cndtn = 0 DSP Mode Disabled Max Rate = 100e+3 Hz
Sampler Parameters: Operator: Sampler Interpolating Rate = 7.8e+3 Hz Aperture = 0 sec Aperture Jitter = 0 sec Max Rate = 7.8e+3 Hz

Week 13 29April 12, 2005
Spectrum of Sampled OutputSystemView
-2e+3
-2e+3
0
0
2e+3
2e+3
-30
-50
-70
-90
Mag in
dB
Frequency in Hz (dF = 762.9e-3 Hz)
Cx FFT : 20 Log |FFT | Out R + jOut I Mixed Radix

Week 13 30April 12, 2005
Backup Quiz Question I Part III
Sample the 10,000 Hz signal. Use the lowest sample rate that preserves the signal.
See main quiz Question 2 Part II
0
0
1 10,000 10.8513
2 7,400 2
13,333 , 14
2 1 40,000 , 0s
fk
B
Hz kff
k Hz k

Week 13 31April 12, 2005
Input Signal at 10,000 HzSystemView
5e+3
5e+3
7.5e+3
7.5e+3
10e+3
10e+3
12.5e+3
12.5e+3
15e+3
15e+3
-30
-50
-70
-90
Mag in
dB
Frequency in Hz (dF = 762.9e-3 Hz)
Cx FFT: 20 Log | FFT | Input R + jInput I

Week 13 32April 12, 2005
Sampled at 13,333 HzSystemView
-5e+3
-5e+3
-2.5e+3
-2.5e+3
0
0
2.5e+3
2.5e+3
5e+3
5e+3
-30
-50
-70
-90
-110
-130
-150
Mag in
dB
Frequency in Hz (dF = 762.9e-3 Hz)
Cx FFT : 20 Log |FFT | Samp R + jSamp I Mixed Radix
WHOOPS
Week 13 33April 12, 2005
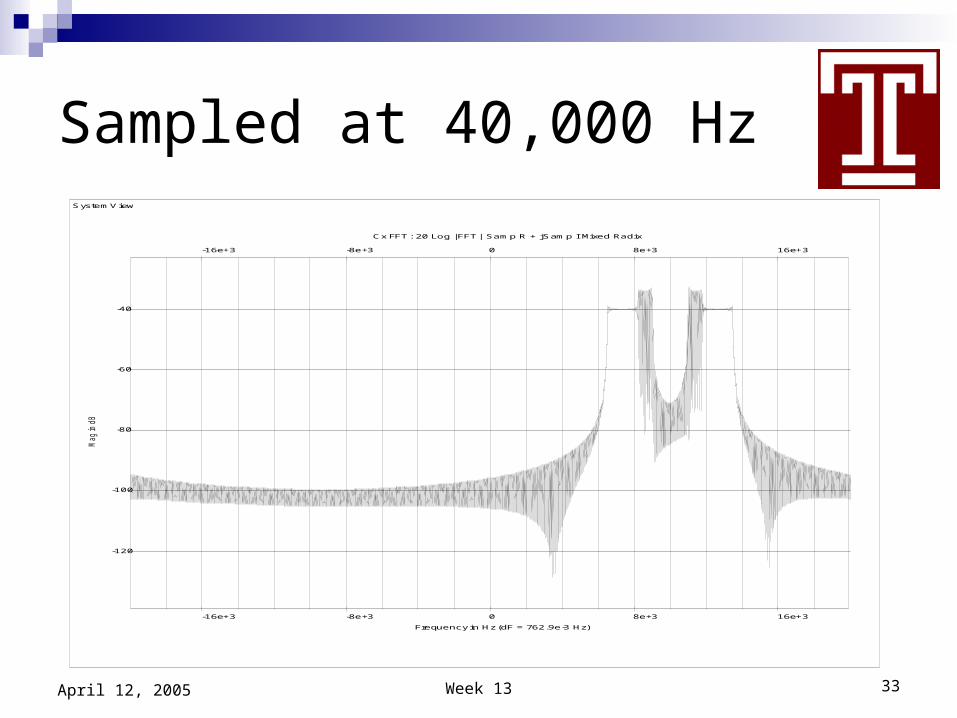
Sampled at 40,000 HzSystemView
-16e+3
-16e+3
-8e+3
-8e+3
0
0
8e+3
8e+3
16e+3
16e+3
-40
-60
-80
-100
-120
Mag in
dB
Frequency in Hz (dF = 762.9e-3 Hz)
Cx FFT : 20 Log |FFT | Samp R + jSamp I Mixed Radix

Week 13 34April 12, 2005
Parameters
Sample at 40,000 Hz Frequency-shift down to baseband
10,000 Hz frequency shiftComplex LO (digital quadrature demodulator)
Downsample to 8,000 Hz complex

Week 13 35April 12, 2005
Output Before DownsamplingSystemView
-16e+3
-16e+3
-8e+3
-8e+3
0
0
8e+3
8e+3
16e+3
16e+3
-40
-60
-80
-100
-120
Mag in
dB
Frequency in Hz (dF = 610.4e-3 Hz)
Cx FFT : 20 Log |FFT | Mixed R + jMixed I

Week 13 36April 12, 2005
Output Downsampled to 8 kHz Complex Without Filtering
SystemView
-2e+3
-2e+3
0
0
2e+3
2e+3
-30
-40
-50
-60
-70
-80
-90
Mag in
dB
Frequency in Hz (dF = 610.3e-3 Hz)
Cx FFT: 20 Log | FFT | Out R + jOut I Mixed Radix

Week 13 37April 12, 2005
Final System Block Diagram

Week 13 38April 12, 2005
Backup Quiz 2 Question 2
See main Quiz 2 Question 5 The received data vector r is
{1,0,1,0,1,1,1} The syndrome is {1,0,1} Received data has a bit error Corrected data vector is {1,0,1,0,0,1,1} Decoded message is {0,0,1,1} Other answers same as those of main quiz