E/e’ Ratio in Patients with Unexplained Dyspnea: Lack of...
36
1 E/e’ Ratio in Patients with Unexplained Dyspnea: Lack of Accuracy in Estimating Left Ventricular Filling Pressure Santos et al: E/e’ in Unexplained Dyspnea Mário Santos, MD 1 ; Jose Rivero, MD, RDCS 2 ; Shane D. McCullough, RDCS 2 ; Erin West, MSc 2 ; Alexander R. Opotowsky, MD, MPH 2,3 ; Aaron B. Waxman, MD, PhD 4 ; David M. Systrom, MD 4 ; Amil M. Shah, MD, MPH 2 1 Department of Physiology and Cardiothoracic Surgery, Cardiovascular R&D Unit, Faculty of Medicine, University of Porto, Portugal 2 Division of Cardiovascular Medicine, Brigham and Women’s Hospital, Boston, MA 3 Department of Cardiology, Boston Children’s Hospital, Boston, MA 4 Division of Pulmonary and Critical Care Medicine, Brigham and Women’s Hospital, Boston, MA Correspondence to Amil M. Shah Division of Cardiovascular Medicine, Brigham and Women’s Hospital 75 Francis Street, Boston, MA 02115 Email: [email protected] DOI: 10.1161/CIRCHEARTFAILURE.115.002161 Journal Subject Codes: [31] Diagnostic testing, Echocardiography; [11] Heart failure, Other heart failure by guest on May 7, 2018 http://circheartfailure.ahajournals.org/ Downloaded from by guest on May 7, 2018 http://circheartfailure.ahajournals.org/ Downloaded from by guest on May 7, 2018 http://circheartfailure.ahajournals.org/ Downloaded from by guest on May 7, 2018 http://circheartfailure.ahajournals.org/ Downloaded from by guest on May 7, 2018 http://circheartfailure.ahajournals.org/ Downloaded from by guest on May 7, 2018 http://circheartfailure.ahajournals.org/ Downloaded from by guest on May 7, 2018 http://circheartfailure.ahajournals.org/ Downloaded from by guest on May 7, 2018 http://circheartfailure.ahajournals.org/ Downloaded from by guest on May 7, 2018 http://circheartfailure.ahajournals.org/ Downloaded from by guest on May 7, 2018 http://circheartfailure.ahajournals.org/ Downloaded from
Transcript of E/e’ Ratio in Patients with Unexplained Dyspnea: Lack of...

1
E/e’ Ratio in Patients with Unexplained Dyspnea: Lack of Accuracy in
Estimating Left Ventricular Filling Pressure
Santos et al: E/e’ in Unexplained Dyspnea
Mário Santos, MD1; Jose Rivero, MD, RDCS2; Shane D. McCullough, RDCS2;
Erin West, MSc2; Alexander R. Opotowsky, MD, MPH2,3; Aaron B. Waxman, MD, PhD4;
David M. Systrom, MD4; Amil M. Shah, MD, MPH2
1Department of Physiology and Cardiothoracic Surgery, Cardiovascular R&D Unit, Faculty
of Medicine, University of Porto, Portugal
2Division of Cardiovascular Medicine, Brigham and Women’s Hospital, Boston, MA
3Department of Cardiology, Boston Children’s Hospital, Boston, MA
4Division of Pulmonary and Critical Care Medicine, Brigham and Women’s Hospital,
Boston, MA
Correspondence to Amil M. Shah Division of Cardiovascular Medicine, Brigham and Women’s Hospital 75 Francis Street, Boston, MA 02115 Email: [email protected] DOI: 10.1161/CIRCHEARTFAILURE.115.002161
Journal Subject Codes: [31] Diagnostic testing, Echocardiography; [11] Heart failure, Other
heart failure
by guest on May 7, 2018
http://circheartfailure.ahajournals.org/D
ownloaded from
by guest on M
ay 7, 2018http://circheartfailure.ahajournals.org/
Dow
nloaded from
by guest on May 7, 2018
http://circheartfailure.ahajournals.org/D
ownloaded from
by guest on M
ay 7, 2018http://circheartfailure.ahajournals.org/
Dow
nloaded from
by guest on May 7, 2018
http://circheartfailure.ahajournals.org/D
ownloaded from
by guest on M
ay 7, 2018http://circheartfailure.ahajournals.org/
Dow
nloaded from
by guest on May 7, 2018
http://circheartfailure.ahajournals.org/D
ownloaded from
by guest on M
ay 7, 2018http://circheartfailure.ahajournals.org/
Dow
nloaded from
by guest on May 7, 2018
http://circheartfailure.ahajournals.org/D
ownloaded from
by guest on M
ay 7, 2018http://circheartfailure.ahajournals.org/
Dow
nloaded from

2
Abstract
Background—Elevated left ventricular filling pressure (LVFP) is a cardinal feature of heart
failure with preserved ejection fraction (HFpEF). Mitral E/e’ ratio has been proposed as a
non-invasive measure of LVFP. We studied the accuracy of E/e' to estimate and track
changes of LVFP in patients with unexplained dyspnea.
Methods and Results—We performed supine and upright transthoracic echocardiography in
118 patients with unexplained dyspnea who underwent right heart catheterization. Supine
E/e’ ratio modestly but significantly correlated with supine pulmonary arterial wedge
pressure (PAWP) (r=0.36; p<0.001) and demonstrated poor agreement with PAWP values
(Bland-Altman limits of agreement of -8.3 to 8.3 mmHg; range: 6.5 to 21.2 mmHg).
Similarly, E/e’ ratio cut-off of 13 performed poorly in identifying patients with elevated
LVFP (sensitivity 6%, specificity 90%). The ROC area of E/e’ was 0.65 (95% CI: 0.50-0.79).
With change from the supine to upright position, PAWP decreased (-5±4 mmHg; p<0.001) as
did both E-wave (-17±15 cm/s; p<0.001) and e’ (-2.7±2.7 cm/s; p<0.001) velocities, while
E/e’ remained stable (+0.2±2.6; p=0.57). Positional change in PAWP correlated modestly
with change in E-wave (r=0.37; p<0.001) velocity. There was no appreciable relationship
between change in PAWP and change in average E/e’ (r=-0.04; p=0.77) and in half the
patients the change in PAWP and E/e’ were directionally opposite.
Conclusions—In patients with unexplained dyspnea, E/e’ ratio neither accurately estimates
PAWP nor identifies patients with elevated PAWP consistent with HFpEF. Positional
changes in E/e’ ratio do not reflect changes in PAWP.
Key Words: heart failure, echocardiography, left ventricular filling pressure, E/e’ ratio,
dyspnea, hemodynamics
by guest on May 7, 2018
http://circheartfailure.ahajournals.org/D
ownloaded from
3
Dyspnea is a common symptom, affecting up to half of patients in the inpatient setting and
one quarter of patients in the ambulatory setting1. Dyspnea may be caused by cardiac,
pulmonary, hematologic, neuropsychiatric or neuromuscular diseases. Among patients with
dyspnea and normal left ventricular ejection fraction (LVEF), pulmonary function, and
oxygen carrying capacity, the diagnosis of heart failure with preserved ejection fraction
(HFpEF) is particularly challenging. Because cardiac structural and functional changes in
HFpEF are more subtle and less specific than in heart failure with reduced LVEF, the
demonstration of increased left ventricular filling pressure (LVFP) is central to establishing
this diagnosis2. The invasive assessment of LVFP is usually done during right heart
catheterization (RHC) by measurement of pulmonary arterial wedge pressure (PAWP).
Transthoracic echocardiography can be used to non-invasively estimate LVFP. Several
echocardiographic measures have been used3, but the ratio of the peak early mitral inflow
velocity (E) over the early diastolic mitral annular velocity (e’) has gained wide acceptability
in routine clinical practice4. Although integration of multiple echocardiographic measures is
always preferred, the E/e’ ratio is often used by itself to appraise LVFP due to the relative
ease of acquisition, calculation, and interpretation. The E/e’ ratio has been endorsed by
professional guidelines as a surrogate parameter of LVFP in the diagnostic work-up of
HFpEF5. In theory, a decrease in LV preload (a major determinant of LVFP) will result in a
lower atrial-to-LV diastolic pressure gradient and lower E wave velocity, without
significantly affecting e’ which is considered to be relatively independent of pressure-flow
gradients6. Despite its widespread use, conflicting data have been reported regarding its
accuracy and its ability to track changes in LVFP 4, 7-10. Therefore, we aimed to study the
accuracy of E/e’ to estimate and track changes in LVFP, as well as to identify elevated LVFP
consistent with HFpEF in patients with unexplained dyspnea and a preserved LVEF.
by guest on May 7, 2018
http://circheartfailure.ahajournals.org/D
ownloaded from
4
Methods
Subjects and Study Design
We studied sequential patients with dyspnea of indeterminate cause referred to the Dyspnea
Clinic at Brigham and Women’s Hospital between May 2013 and June 2014. All patients
underwent resting supine and upright invasive hemodynamic evaluations. Patients with
LVEF < 50%, more than mild valvular disease, prosthetic mitral valve and atrial fibrillation
were excluded from this analysis. The Partners Human Research Committee approved this
study and waived the requirement for informed consent.
Invasive Hemodynamic Study
A flow-directed, balloon-tipped, 4-port pacing pulmonary artery catheter (Edwards
Lifesciences, Irvine, CA) was placed into the pulmonary artery, with ultrasound and
fluoroscopic guidance. A second catheter was inserted into the radial artery using a 20-gauge
IV or 5-French sheath. End expiratory systemic arterial, right atrial (RAP), right ventricular
(RVP), pulmonary artery pressures (PAP) and PAWP were measured using a hemodynamic
monitoring system (Xper Cardio Physiomonitoring System, Philips, Andover, Massachusetts)
calibrated before each study. The pressure transducer was leveled using as references the mid
axillary line (supine) and 5cm below the axillary fold (upright). Cardiac output (CO) was
determined by assumed Fick or thermodilution methods during supine RHC, and true Fick
method with direct measurement of VO2, arterial and mixed venous O2 content, during
upright assessments.
Echocardiography
Supine transthoracic echocardiography was performed before patients underwent RHC (time
interval <1 hour). After catheterization, upright transthoracic echocardiography was
by guest on May 7, 2018
http://circheartfailure.ahajournals.org/D
ownloaded from

5
performed with the patient seated resting on the cycle ergometer simultaneously with the
invasive hemodynamic measurements. All quantitative echocardiographic measurements
were performed by a single reader (M.S.) blinded to invasive hemodynamic data, using a
computerized off-line analysis station as previously described11. Peak early diastolic tissue
velocity (e’) was measured at the septal and lateral mitral annulus. Mitral inflow velocity was
assessed by pulsed wave Doppler from the apical 4-chamber view, positioning the sample
volume at the tip of the mitral leaflets. Deceleration time of the E-wave was measured as the
interval from the peak E-wave to its extrapolation to the baseline. E/e’ ratio was calculated as
E-wave divided by e’ velocities. LV mass was estimated from LV linear dimensions and
indexed to body surface area as recommended by ASE guidelines12. LV hypertrophy (LVH)
was defined as LV mass indexed to body surface area (LV mass index; LVMi) >115 g/m2 in
men or >95 g/m2 in women. LV volumes were estimated by the modified Simpson method
using the apical 4- and 2-chamber views, and LVEF was derived from volumes in the
standard manner. LA volume was estimated by the method of disks using apical 4- and 2-
chamber views at an end-systolic frame preceding mitral valve opening and was indexed to
body surface area to derive LA volume index. Measurements were performed in triplicate
and the average value used for analysis. Intraobserver reproducibility was assessed in 20
studies randomly selected with the following results. E wave: correlation coefficient 0.99,
coefficient of variation 4%; septal e’: correlation coefficient 97%, coefficient of variation
4%; lateral e’: correlation coefficient 98%, coefficient of variation 5%. For the purposes of
generalizability, interobserver reproducibility was assessed in the same 20 studies with the
following results. E wave: correlation coefficient 0.94, coefficient of variation: 6%; septal e’:
correlation coefficient: 0.98, coefficient of variation 7%; lateral e: correlation coefficient
97%, coefficient of variation: 8%.
by guest on May 7, 2018
http://circheartfailure.ahajournals.org/D
ownloaded from

6
Statistical Analysis
Continuous variables are expressed as mean ± standard deviation for normally distributed
variables or median and interquartile range for non-normally distributed variables.
Categorical variables are expressed as number of subjects and proportion [n (%)].
Comparisons between groups were performed using 2-sided parametric or non-parametric
tests (unpaired or paired t or Wilcoxon rank sums) for normally and non-normally distributed
data respectively. Fisher’s exact test was used to compare proportions. Univariate linear
regression analysis was performed to model an equation of the relationship between E/e’ ratio
and PAWP. Univariate logistic regression was used to study the association between E/e’
ratio the dichotomous variable of elevated LVFP (PAWP 15 mmHg). For each analysis,
separate univariate regression models were generated each of the following predictor
variables: lateral E/e’ ratio, septal E/e’ ratio, average E/e’ ratio. To further assess the
potential for E/e’ ratio to identify elevated LVFP, receiver operating characteristic (ROC)
curve analyses were performed. Correlations between those variables were determined using
Pearson or Spearman correlation, as appropriate. Bland-Altman analysis was used to assess
agreement between non-invasive and invasive variables. Two supplemental analyses were
performed. To assess the impact of missing data on our findings, were performed all
analyses restricted to the population of patients with complete data for supine and upright
PAWP and E/e’ ratio. In a second supplemental analysis, to assess the potential impact of an
outlier value, we repeated the analysis excluding this outlier value. A two sided p-value <0.05
was considered significant. Statistical analysis was performed using Stata software Version
12.1 (Stata Corp LP, College Station, TX, USA).
by guest on May 7, 2018
http://circheartfailure.ahajournals.org/D
ownloaded from

7
Results
Studied Sample
Of a total of 140 subjects, we excluded 22 because of: LVEF < 50% (n=3), more than mild
valvular disease (n=13), valvular prosthesis (n=4) and atrial fibrillation (n=2). Of the
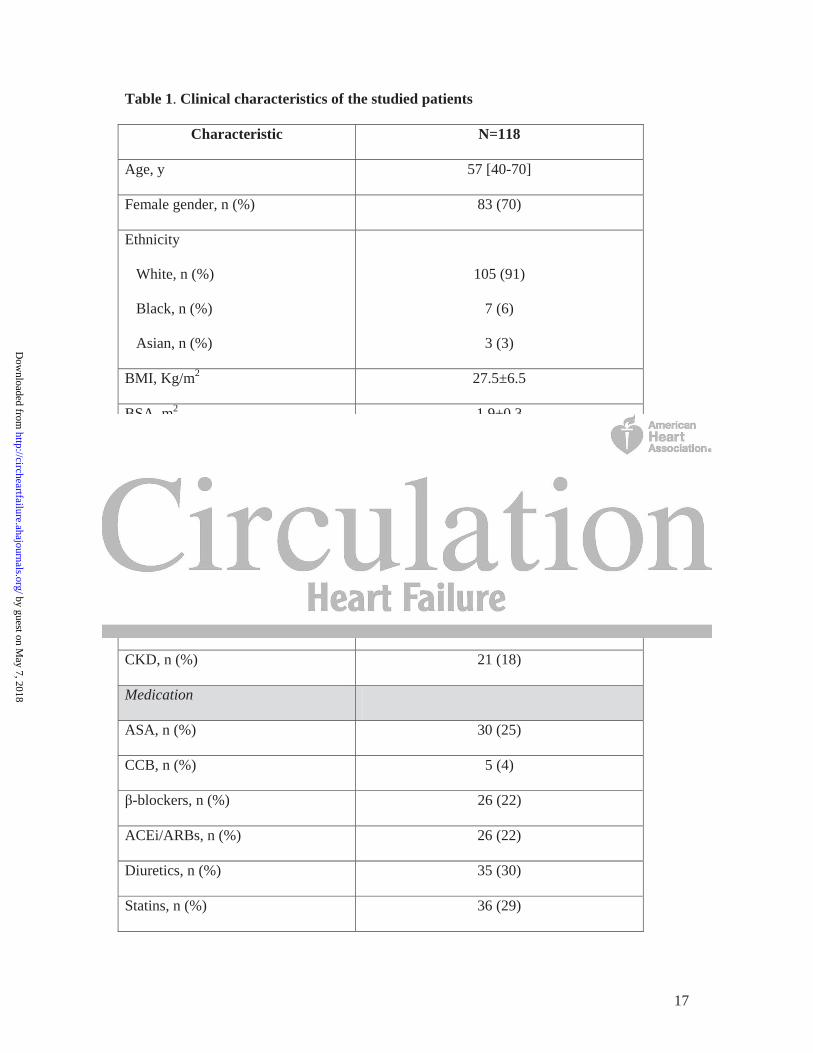
remaining 118 patients included in this analysis, 70% were female and the median age was
57 years (1st-3rd quartile: 40-70 years; Table 1). Mean BMI was 27.5±6.5 Kg/m2, and 25% of
patients were obese (defined as BMI 30 kg/m2). The most prevalent comorbidity was
hypertension (46%). Average LVMi was 64±19 g/m2, and LVH was present in 23% of
patients. LVEF was normal (63±8%) and supine invasive hemodynamics revealed normal
average cardiac index (3.0±0.6 L/min/m2), with a mean PAWP of 12±5 mmHg. 26 (22%) had
a supine PAWP > 15 mmHg. Echocardiographic data are summarized in Tables 1 and 2.
Mean E/A ratio was 1.2±0.5, and e’ septal (8.7±2.8 cm/s) was lower than e’ lateral (11.9±4.3
cm/s; p<0.001).
Supine Hemodynamic And Echocardiographic Data
PAWP modestly correlated with E/e’ septal (r=0.41; p<0.001), lateral (r=0.30; p<0.001) and
average (r=0.36; p<0.001) (Table 3; Figure 1). E/e’ refers to average E/e’ throughout the
remainder of this manuscript unless specifically noted. E/A ratio was even more modestly
correlated with PAWP (r=0.21; p=0.04); no correlation was found between DT and PAWP
(r=-0.06; p=0.57). Using supine average E/e’ to predict supine PAWP, the linear regression
model was: PAWP = 0.44*E/e’ average + 7.2 (N= 88; for the slope: p=0.001, 95%CI for
coefficient for E/e’ was: 0.20-0.68). We computed the predicted PAWP estimated by this
linear regression equation, and used the Bland-Altman method to quantify the agreement of
the predicted PAWP with the invasively measured PAWP. There was no bias (mean 0
by guest on May 7, 2018
http://circheartfailure.ahajournals.org/D
ownloaded from

8
mmHg, 95%CI: -0.8; 0.8), and the limits of agreement were wide (-7.7 to 7.7 mmHg) –
Figure 1.
Twenty-two percent (n=26) of the study cohort has a supine RHC PAWP > 15 mmHg13. In a
logistic regression model, average E/e’ ratio was not significantly predictive of elevated
LVFP (OR=1.09; p=0.22, 95%CI: 0.95-1.27), with a ROC area of 0.65 (95%CI: 0.50-0.79).
While the mean PAWP was higher among those with an average E/e’ 13 compared to <13
(14±6 vs 11±4 mmHg respectively, p=0.001), an E/e’ average 13 had a sensitivity of 6%
and a specificity of 90% to identify elevated LVFP. Similarly, the ROC areas for E/e’ septal
and lateral were 0.67 (95%CI: 0.53-0.81) and 0.62 (95% CI: 0.46-0.78) respectively. An E/e’
septal 15 had a sensitivity of 6% and a specificity of 92%; an E/e’ lateral 12 had a
sensitivity of 13% and a specificity of 92% to discriminate patients with elevated LVFP.
Positional Changes in Hemodynamic and Echocardiographic Measures: Supine to Upright
There was a decrease in cardiac index (-0.3±0.9 L/min/m2) and PAWP (-5±4 mmHg) from
supine to upright position (Table 2). Mean arterial pressure increased modestly (+4±12
mmHg; p<0.001), as did systemic vascular resistance (+372±585 dyne.s.cm-5; p<0.001) and
heart rate (+8±12 bpm; p<0.001). Both LV diastolic and systolic volumes decreased, with a
mild decrease in LVEF (Table 2).
Despite the significant decrease of PAWP, no significant differences were found between
supine and upright E/e’ ratio (Table 2). We found no correlation between change in E/e’
(septal, lateral or average) and PAWP (Table 3; Figure 2). In fact, 46% (23/50) of patients
had a directionally discordant change of E/e’ when compared to PAWP (Table 4). Those with
concordant E/e’ and PAWP with positional change were older (62±16 vs 45±20 years-old;
by guest on May 7, 2018
http://circheartfailure.ahajournals.org/D
ownloaded from

9
p=0.01), more likely to have hypertension (63 vs 22 %; p=0.003), and had lower myocardial
relaxation velocities (e’ average: 8.2±2.5 vs 12.0±3.8 cm/s; p<0.001) and larger left atria
(22±7 vs 17±4 mL/m2; p=0.007) than those with discordant changes.
With positional change, significant reductions in E-wave (-17±15 cm/s; p<0.001), e’ septal (-
1.8±2.3; p<0.001), and e’ lateral (-3.7±3.5; p<0.001) were noted. The change in E wave
velocity significantly correlated with the observed change in PAWP (r=0.41; p<0.001).
Change in PAWP was not significantly associated with the observed change in e’ septal
(r=0.18; p=0.12), change in e’ lateral (r=0.18; p=0.18), and change in e’ average (r=0.21;
p=0.11) – Figure 2.
Discussion
Supine E/e’ ratio had a significant, though modest, correlation with PAWP, but demonstrated
poor accuracy in estimating PAWP evidenced by the wide limits of agreement in Bland-
Altman analysis. Concordantly, the recommended E/e’ ratio cut-offs performed poorly in
identifying elevated LVFP. Furthermore, change in E/e’ ratio from supine to upright position
did not reliably track changes in PAWP, as both E and e’ were significantly affected by
hemodynamic changes. In fact, half of the studied patients had a directionally opposite
change in E/e’ compared to PAWP, indicating the erratic response of this non-invasive index
to load changes associated with the upright position.
Although several previous studies have compared non-invasive (echocardiography-based)
estimates of LVFP with invasive data (RHC), our study is one of the largest and – to our
knowledge – one of the first to investigate this question in a population of patients with
unexplained dyspnea, in whom assessment of LVFP is particularly important for diagnostic
by guest on May 7, 2018
http://circheartfailure.ahajournals.org/D
ownloaded from

10
purposes. Consistent with previous studies using this methodology, we found a significant
correlation between supine E/e’ ratio and PAWP, 14, 15 with a comparable predictive equation
based on linear regression modeling 14, 16, 17. However, correlative measurements provide
little information about the agreement between supine E/e’ ratio and PAWP. Using Bland-
Altman analysis, we found wide limits of agreement between predicted PAWP based on the
supine E/e’ ratio and invasively measured PAWP. This indicates a large, clinically significant
difference in LVFP estimation when done by these 2 methods. In addition, E/e’ ratio did not
accurately identify patients with PAWP > 15 mmHg, and the recommended E/e’ cut-offs had
a very low sensitivity to identify elevated LVFP (Figure 3).
Change in E/e’ ratio did not correlate with change in PAWP. The mean E/e’ ratio was higher
on average in the upright position compared to supine, while PAWP was significantly lower.
This is concordant with a previous study18 and was explained by a more pronounced decrease
of e’ than E-wave from supine to upright. The 17% decrease in E-wave velocity reflects a
reduced transmitral pressure gradient, which may result from either a lower left atrial
pressure and/or a higher proto-diastolic LV pressure. The e’ average demonstrated a 28%
decrease with position change from supine to upright, with comparable reductions in both e’
septal and e’ lateral. Together with previous studies19-21 that used different interventions to
induce changes in LV preload, these findings clearly demonstrate that e’ is not load-
independent. This preload dependence may be more pronounced in patients with a compliant
myocardium, which may be more susceptible to changes in external load than a stiff
myocardium22. There are several mechanisms that may account for this. First, reduced LV
preload due to decreased venous return may influence e’ by decreasing ventricular filling
during proto-diastole (rapid filling phase)23. Decreased LV preload can also result in reduced
LV systolic torsion, leading to less energy release during early diastolic elastic recoil24.
by guest on May 7, 2018
http://circheartfailure.ahajournals.org/D
ownloaded from

11
Second, the increased SVR is associated with an increase of LV afterload that can influence
the myocardial relaxation25. However, given the minor changes in systemic vascular
resistance and mean arterial pressure relative to the preload changes, and the known LV
diastolic tolerance to afterload when LVEF is preserved26, the contribution of increased
afterload to the observed positional changes in e’ appears limited.
The analysis of more than one pair of measurements from each patient allows a better
understanding of the individual utility of E/e’ ratio, which is often overlooked when only
group-derived variables are calculated from measurements at a single time-point. Notably, we
observed that almost half (46%) of patients had a discordant E/e’ ratio change compared to
PAWP. This expresses a wide inter-individual variation in the way E/e’ ratio relates with
PAWP. Some previous studies have reported a significant correlation between change in E/e’
and change in PAWP in decompensated HF, heart transplant and hypertrophic
cardiomyopathy patients14, 15, 17, 27, although this finding has been inconsistent. Bhella et al.16
actively manipulated LVFP of HF patients and healthy controls. The authors described the
inconsistent relation between group- and individual-derived linear regression slopes.
Likewise, Mullens et al.7 did not find a correlation between E/e’ ratio and PAWP changes in
decompensated HF patients. The reasons for the discrepancy among these studies may relate
to differences in patient characteristics as the presence of valvular regurgitation,
interventricular dessynchrony, systolic function, and different degrees of diastolic
dysfunction. Consistent with previous studies that showed a greater preload dependence of e’
in subjects with less impaired myocardial relaxation28, 29, we observed greater myocardial
relaxation velocities in those patients with discordant changes in E/e’ and PCWP.
Differences in the study design as the small sample size of the studied groups, potential
selection and ascertainment bias may also account for that discrepancy. Together, these
by guest on May 7, 2018
http://circheartfailure.ahajournals.org/D
ownloaded from

12
findings seriously question the use of this echocardiographic parameter to track LVFP
changes.
This study has several limitations. TDI measurements in the upright position were missing in
a subset of patients. However, the absence of differences of clinical, echocardiographic and
invasive hemodynamics measurements between patients without versus with TDI missing
values argues against a systematic bias in the ascertainment of those echocardiographic
images (Supplemental material). In addition, sensitivity analyses restricted to participants
without missing data for supine or upright PAWP and E/e’ demonstrated consistent results
with primary analysis (Supplemental material). While upright image acquisition was
simultaneous with invasive measurements, supine TDI parameters were acquired within 1
hour before the PAWP measurement. Although we cannot exclude some error due to the non-
simultaneous measurement, the brief time interval makes large changes in measures unlikely.
In addition, we found better correlation on the supine than upright measurements. We used
change in position (supine to upright) to examine the relationship between E/e’ ratio and
LVFP changes. Although this maneuver evokes a complex cardiovascular response, the
observed changes in heart rate and LV afterload surrogates suggest that the predominant
change was that in LV preload, supporting the extrapolation of our results to LVFP changes
occurring in other clinical scenarios. Finally, correlation analyses can suffer from
disproportionate weighting of extreme outliers. We repeated our analysis excluding the
observed extreme outlier (Supplemental material) and had similar findings to our primary
analysis (Supplemental material). The extrapolation of our results to patients with
unexplained dyspnea should be cautious, as this is a very heterogeneous population
comprising patients presenting a wide spectrum of structural and functional cardiac
abnormalities.
by guest on May 7, 2018
http://circheartfailure.ahajournals.org/D
ownloaded from

13
Despite these limitations, our study is one of largest with E/e’ ratio and related invasive
LVFP measurements. The studied population is heterogeneous and representative of patients
to whom LVFP estimation is commonly done in clinical practice to aid their diagnostic work-
up. We did paired measurements for each patient which allows us to go beyond the group
mean estimates and better understand the individual response of E/e’ ratio to LVFP changes.
Conclusions
In patients with preserved LVEF referred for RHC because of unexplained dyspnea, E/e’
ratio did not accurately estimate PAWP or identify patients with elevated PAWP consistent
with HFpEF. Positional changes in PAWP were not related to changes in the E/e’ ratio
especially in those with better myocardial relaxation. These results argues against using E/e’
ratio as an estimator of PAWP in patients with unexplained dyspnea and a preserved LVEF.
Sources of Funding
Work for this manuscript was supported by grant HMSP-ICJ/0013/2012 from the Portuguese
Foundation for Science and Technology (M.S.), 1K08HL116792-01A1 from the National
Institutes of Health (A.M.S.), and 14CRP20380422 from the American Heart Association
(A.M.S.).
Disclosures
Dr Shah reports receiving research support from Novartis, Actelion Pharmaceuticals Ltd, and
Gilead. The other authors have no disclosures.
by guest on May 7, 2018
http://circheartfailure.ahajournals.org/D
ownloaded from

14
References
1. Parshall MB, Schwartzstein RM, Adams L, Banzett RB, Manning HL, Bourbeau J, Calverley PM, Gift AG, Harver A, Lareau SC, Mahler DA, Meek PM, O'Donnell DE. An official american thoracic society statement: Update on the mechanisms, assessment, and management of dyspnea. Am J Respir Crit Care Med. 2012;185:435-452.
2. Wachter R, Edelmann F. Diagnosis of heart failure with preserved ejection fraction. Heart Fail Clin. 2014;10:399-406.
3. Ommen SR, Nishimura RA, Appleton CP, Miller FA, Oh JK, Redfield MM, Tajik AJ. Clinical utility of doppler echocardiography and tissue doppler imaging in the estimation of left ventricular filling pressures: A comparative simultaneous doppler-catheterization study. Circulation. 2000;102:1788-1794.
4. Nagueh SF, Appleton CP, Gillebert TC, Marino PN, Oh JK, Smiseth OA, Waggoner AD, Flachskampf FA, Pellikka PA, Evangelisa A. Recommendations for the evaluation of left ventricular diastolic function by echocardiography. Eur J Echocardiogr. 2009;10:165-193.
5. Paulus WJ, Tschope C, Sanderson JE, Rusconi C, Flachskampf FA, Rademakers FE, Marino P, Smiseth OA, De Keulenaer G, Leite-Moreira AF, Borbely A, Edes I, Handoko ML, Heymans S, Pezzali N, Pieske B, Dickstein K, Fraser AG, Brutsaert DL. How to diagnose diastolic heart failure: A consensus statement on the diagnosis of heart failure with normal left ventricular ejection fraction by the heart failure and echocardiography associations of the european society of cardiology. Eur Heart J. 2007;28:2539-2550.
6. Wang J, Nagueh SF. Echocardiographic assessment of left ventricular filling pressures. Heart Fail Clin. 2008;4:57-70.
7. Mullens W, Borowski AG, Curtin RJ, Thomas JD, Tang WH. Tissue doppler imaging in the estimation of intracardiac filling pressure in decompensated patients with advanced systolic heart failure. Circulation. 2009;119:62-70.
8. Maeder MT, Thompson BR, Brunner-La Rocca HP, Kaye DM. Hemodynamic basis of exercise limitation in patients with heart failure and normal ejection fraction. J Am Coll Cardiol. 2010;56:855-863.
9. Geske JB, Sorajja P, Nishimura RA, Ommen SR. Evaluation of left ventricular filling pressures by doppler echocardiography in patients with hypertrophic cardiomyopathy: Correlation with direct left atrial pressure measurement at cardiac catheterization. Circulation. 2007;116:2702-2708.
10. Galderisi M, Lancellotti P, Donal E, Cardim N, Edvardsen T, Habib G, Magne J, Maurer G, Popescu BA. European multicentre validation study of the accuracy of e/e' ratio in estimating invasive left ventricular filling pressure: Euro-filling study. EurHeart J Cardiovasc Imaging. 2014;15:810-816.
11. Shah AM, Cheng S, Skali H, Wu J, Mangion JR, Kitzman D, Matsushita K, Konety S, Butler KR, Fox ER, Cook N, Ni H, Coresh J, Mosley TH, Heiss G, Folsom AR, Solomon SD. Rationale and design of a multicenter echocardiographic study to assess the relationship between cardiac structure and function and heart failure risk in a biracial cohort of community-dwelling elderly persons: The atherosclerosis risk in communities study. Circ Cardiovasc Imaging. 2014;7:173-181.
12. Lang RM, Bierig M, Devereux RB, Flachskampf FA, Foster E, Pellikka PA, Picard MH, Roman MJ, Seward J, Shanewise JS, Solomon SD, Spencer KT, Sutton MS, Stewart WJ. Recommendations for chamber quantification: A report from the american society of echocardiography's guidelines and standards committee and the
by guest on May 7, 2018
http://circheartfailure.ahajournals.org/D
ownloaded from

15
chamber quantification writing group, developed in conjunction with the european association of echocardiography, a branch of the european society of cardiology. J Am Soc Echocardiogr. 2005;18:1440-1463.
13. Hoeper MM, Bogaard HJ, Condliffe R, Frantz R, Khanna D, Kurzyna M, Langleben D, Manes A, Satoh T, Torres F, Wilkins MR, Badesch DB. Definitions and diagnosis of pulmonary hypertension. J Am Coll Cardiol. 2013;62:D42-50.
14. Nagueh SF, Middleton KJ, Kopelen HA, Zoghbi WA, Quinones MA. Doppler tissue imaging: A noninvasive technique for evaluation of left ventricular relaxation and estimation of filling pressures. J Am Coll Cardiol. 1997;30:1527-1533.
15. Sundereswaran L, Nagueh SF, Vardan S, Middleton KJ, Zoghbi WA, Quinones MA, Torre-Amione G. Estimation of left and right ventricular filling pressures after heart transplantation by tissue doppler imaging. Am J Cardiol. 1998;82:352-357.
16. Bhella PS, Pacini EL, Prasad A, Hastings JL, Adams-Huet B, Thomas JD, Grayburn PA, Levine BD. Echocardiographic indices do not reliably track changes in left-sided filling pressure in healthy subjects or patients with heart failure with preserved ejection fraction. Circ Cardiovasc Imaging. 2011;4:482-489.
17. Nagueh SF, Lakkis NM, Middleton KJ, Spencer WH, 3rd, Zoghbi WA, Quinones MA. Doppler estimation of left ventricular filling pressures in patients with hypertrophic cardiomyopathy. Circulation. 1999;99:254-261.
18. Rowland T, Unnithan V, Barker P, Guerra M, Roche D, Lindley M. Orthostatic effects on echocardiographic measures of ventricular function. Echocardiography. 2012;29:523-527.
19. Hung KC, Huang HL, Chu CM, Chen CC, Hsieh IC, Chang ST, Fang JT, Wen MS. Evaluating preload dependence of a novel doppler application in assessment of left ventricular diastolic function during hemodialysis. Am J Kidney Dis. 2004;43:1040-1046.
20. Pela G, Regolisti G, Coghi P, Cabassi A, Basile A, Cavatorta A, Manca C, Borghetti A. Effects of the reduction of preload on left and right ventricular myocardial velocities analyzed by doppler tissue echocardiography in healthy subjects. Eur J Echocardiogr. 2004;5:262-271.
21. Jonassen AA, Bjornerheim R, Edvardsen T, Veel T, Kirkeboen KA. Effects of preload alterations on peak early diastolic mitral annulus velocities evaluated by tissue doppler echocardiography. Eur J Anaesthesiol. 2007;24:159-165.
22. Firstenberg MS, Greenberg NL, Main ML, Drinko JK, Odabashian JA, Thomas JD, Garcia MJ. Determinants of diastolic myocardial tissue doppler velocities: Influences of relaxation and preload. Journal of applied physiology. 2001;90:299-307.
23. Hinghofer-Szalkay H. Gravity, the hydrostatic indifference concept and the cardiovascular system. Eur J Appl Physiol. 2011;111:163-174.
24. Weiner RB, Weyman AE, Khan AM, Reingold JS, Chen-Tournoux AA, Scherrer-Crosbie M, Picard MH, Wang TJ, Baggish AL. Preload dependency of left ventricular torsion: The impact of normal saline infusion. Circ Cardiovasc Imaging. 2010;3:672-678.
25. Borlaug BA, Melenovsky V, Redfield MM, Kessler K, Chang HJ, Abraham TP, Kass DA. Impact of arterial load and loading sequence on left ventricular tissue velocities in humans. J Am Coll Cardiol. 2007;50:1570-1577.
26. Leite-Moreira AF, Lourenco AP, Roncon-Albuquerque R, Jr., Henriques-Coelho T, Amorim MJ, Almeida J, Pinho P, Gillebert TC. Diastolic tolerance to systolic pressures closely reflects systolic performance in patients with coronary heart disease. Basic Res Cardiol. 2012;107:251.
by guest on May 7, 2018
http://circheartfailure.ahajournals.org/D
ownloaded from

16
27. Dokainish H, Zoghbi WA, Lakkis NM, Al-Bakshy F, Dhir M, Quinones MA, Nagueh SF. Optimal noninvasive assessment of left ventricular filling pressures: A comparison of tissue doppler echocardiography and b-type natriuretic peptide in patients with pulmonary artery catheters. Circulation. 2004;109:2432-2439.
28. Nagueh SF, Mikati I, Kopelen HA, Middleton KJ, Quinones MA, Zoghbi WA. Doppler estimation of left ventricular filling pressure in sinus tachycardia. A new application of tissue doppler imaging. Circulation. 1998;98:1644-1650.
29. Firstenberg MS, Levine BD, Garcia MJ, Greenberg NL, Cardon L, Morehead AJ, Zuckerman J, Thomas JD. Relationship of echocardiographic indices to pulmonary capillary wedge pressures in healthy volunteers. J Am Coll Cardiol. 2000;36:1664-1669.
by guest on May 7, 2018
http://circheartfailure.ahajournals.org/D
ownloaded from
17
Table 1. Clinical characteristics of the studied patients
Characteristic N=118
Age, y 57 [40-70]
Female gender, n (%) 83 (70)
Ethnicity
White, n (%)
Black, n (%)
Asian, n (%)
105 (91)
7 (6)
3 (3)
BMI, Kg/m2 27.5±6.5
BSA, m2 1.9±0.3
Comorbidities
Hypertension, n (%) 54 (46)
Diabetes, n (%) 14 (12)
Smoking, n (%) 8 (7)
Obesity, n (%) 30 (25)
CAD, n (%) 15 (13)
CKD, n (%) 21 (18)
Medication
ASA, n (%) 30 (25)
CCB, n (%) 5 (4)
-blockers, n (%) 26 (22)
ACEi/ARBs, n (%) 26 (22)
Diuretics, n (%) 35 (30)
Statins, n (%) 36 (29)
by guest on May 7, 2018
http://circheartfailure.ahajournals.org/D
ownloaded from

18
Blood analysis
Hemoglobin, g/dL 13.9±1.5
Creatinine, g/dL 0.9±0.3
eGFR, mL/min/m2 71±12
Echocardiographic parameters
LVEDVi, mL/m2 35±9
LVESVi, mL/m2 14±5
LVEF, % 63±8
Septal wall thickness, cm 0.9±0.2
Posterior wall thickness, cm 0.9±0.2
LV mass index, g/m2 64±19
LVH, n (%) 27 (23)
LAVi, mL/m2 18±6
Abbreviations: ACEi, angiotensin-converting-enzyme inhibitor; ARB, Angiotensin II
receptor blockers; ASA, acetylsalicylic acid; BMI, body mass index; BSA, body surface area;
CAD, coronary artery disease; CCB, calcium-channel blockers; CKD, chronic kidney disease
(eGFR < 60 mL/min/m2); eGFR, estimated glomerular filtration rate (calculated using
Cockcroft-Gault equation); LAVi, left atrium volume index; LV, left ventricular; LVESVi,
left ventricular end-systolic volume index; LVH, left ventricular hypertrophy; LVEDVi, left
ventricular end-diastolic volume index; LVEF, left ventricular ejection fraction.
by guest on M
ay 7, 2018http://circheartfailure.ahajournals.org/
Dow
nloaded from
19
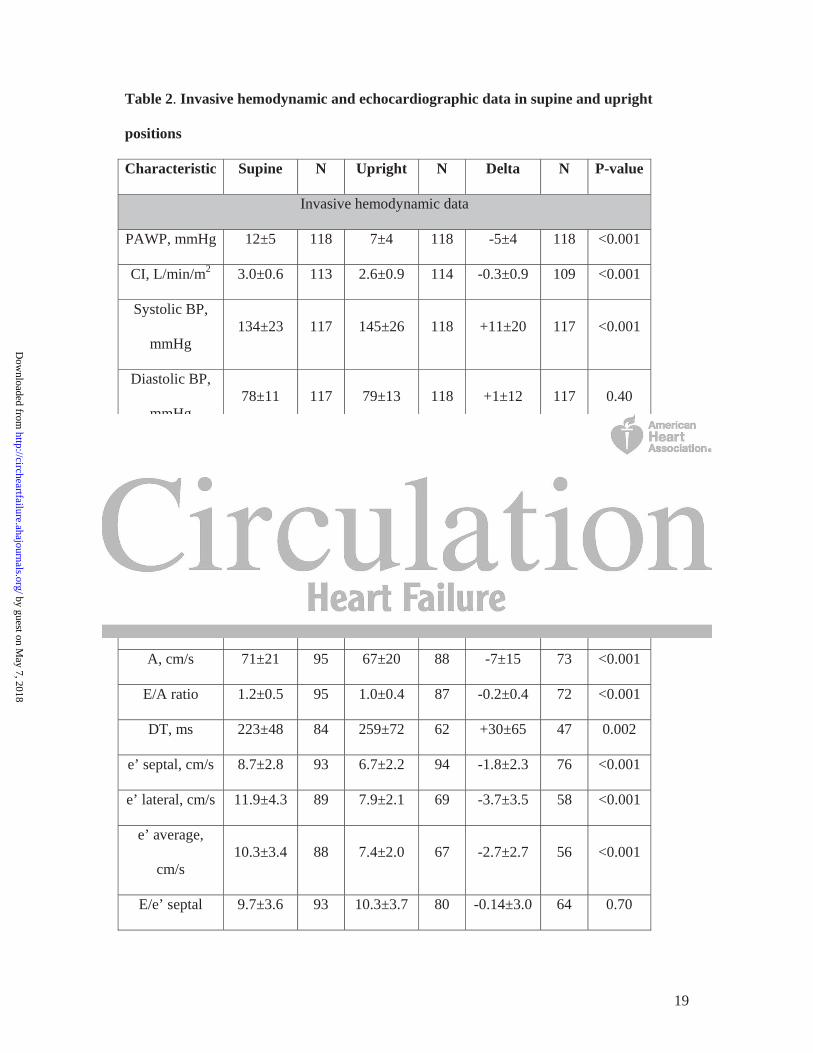
Table 2. Invasive hemodynamic and echocardiographic data in supine and upright
positions
Characteristic Supine N Upright N Delta N P-value
Invasive hemodynamic data
PAWP, mmHg 12±5 118 7±4 118 -5±4 118 <0.001
CI, L/min/m2 3.0±0.6 113 2.6±0.9 114 -0.3±0.9 109 <0.001
Systolic BP,
mmHg 134±23 117 145±26 118 +11±20 117 <0.001
Diastolic BP,
mmHg 78±11 117 79±13 118 +1±12 117 0.40
MAP, mmHg 97±13 117 101±15 118 +4±12 117 <0.001
SVR,
dyne.s.cm-5 1385±368 112 1750±574 112 +372±585 106 <0.001
HR, bpm 72±15 113 81±16 118 +8±12 113 <0.001
Echocardiographic data
E, cm/s 77±17 98 64±16 92 -17±15 75 <0.001
A, cm/s 71±21 95 67±20 88 -7±15 73 <0.001
E/A ratio 1.2±0.5 95 1.0±0.4 87 -0.2±0.4 72 <0.001
DT, ms 223±48 84 259±72 62 +30±65 47 0.002
e’ septal, cm/s 8.7±2.8 93 6.7±2.2 94 -1.8±2.3 76 <0.001
e’ lateral, cm/s 11.9±4.3 89 7.9±2.1 69 -3.7±3.5 58 <0.001
e’ average,
cm/s 10.3±3.4 88 7.4±2.0 67 -2.7±2.7 56 <0.001
E/e’ septal 9.7±3.6 93 10.3±3.7 80 -0.14±3.0 64 0.70
by guest on May 7, 2018
http://circheartfailure.ahajournals.org/D
ownloaded from

20
E/e’ lateral 7.3±3.4 89 8.5±3.2 61 +0.6±2.9 52 0.17
E/e’ average 8.2±3.4 88 9.2±3.3 59 +0.2±2.6 50 0.57
LVEDVi,
mL/m2 35±9 90 29±9 81 -7±8 65 <0.001
LVESVi,
mL/m2 14±5 90 12±5 81 -2±4 65 <0.001
LVEF, % 63±8 90 61±10 81 -2±9 65 0.04
LAVi, mL/m2 18±7 92 13±5 82 -7±4 68 <0.001
Abbreviations: A, peak late mitral inflow velocity; BP, blood pressure; CI, cardiac index; DT,
deceleration time; E, peak early mitral inflow velocity; e’, peak early diastolic mitral annular
velocity; HR, heart rate; LAVi, left atrium volume index; LVEDSi, left ventricular end-
systolic volume index; LVEDVi, left ventricular end-diastolic volume index; LVEF, left
ventricular ejection fraction; MAP, mean arterial pressure; PAWP, pulmonary artery wedge
pressure; SVR, systemic vascular resistance.
by guest on May 7, 2018
http://circheartfailure.ahajournals.org/D
ownloaded from

21
Table 3. Correlation between E wave, E/e’ and PAWP, and their orthostatic-induced
changes
Variable N Correlation
coefficient P-value
Supine
E/e’ septal 93 0.41 <0.001
E/e’ lateral 89 0.30 <0.001
E/e’ average 88 0.36 <0.001
E-wave 98 0.45 <0.001
E/A 95 0.21 0.04
LAVi 92 0.14 0.18
Upright
E/e’ septal 80 0.19 0.09
E/e’ lateral 61 0.03 0.80
E/e’ average 59 0.10 0.45
E-wave 92 0.21 0.05
E/A 87 -0.13 0.23
LAVi 82 0.39 <0.001
Delta
E/e’ septal 64 0.07 0.61
E/e’ lateral 52 -0.07 0.61
E/e’ average 50 -0.04 0.77
E wave 75 0.41 <0.001
e’ septal 76 0.18 0.12
by guest on May 7, 2018
http://circheartfailure.ahajournals.org/D
ownloaded from

22
e’ lateral 58 0.18 0.18
e’ average 56 0.21 0.11
E/A 72 0.20 0.10
LAVi 68 -0.21 0.09
Abbreviations: E, peak early mitral inflow velocity; e’, peak early diastolic mitral annular
velocity; LAVi, left atrium volume index; PAWP, pulmonary artery wedge pressure.
by guest on May 7, 2018
http://circheartfailure.ahajournals.org/D
ownloaded from

23
Table 4. Contingent table of the direction of PAWP and E wave, e’ average and E/e’
average changes with moving from the supine to the upright position. 19% (14/75), 16%
(9/56), 46% (23/50) of patients had a discordant change of E-wave, e’ average, E/e’
average, respectively, when compared to PAWP
E wave
E < 0 E > 0 Total
PAWP < 0 60 (80%) 10 (13%) 70 (93%)
PAWP > 0 4 (5%) 1 (1%) 5 (7%)
Total 64 (85%) 11 (15%) 75 (100%)
e’ average
e’ < 0 e’ > 0 Total
PAWP < 0 45 (80%) 5 (9%) 50 (89%)
PAWP > 0 4 (7%) 2 (4%) 6 (11%)
Total 49 (88%) 7 (13%) 56 (100%)
E/e’ average
E/e’ < 0 E/e’ > 0 Total
PAWP < 0 23 (46%) 22 (44%) 45 (90%)
PAWP > 0 1 (2%) 4 (8%) 5 (10%)
Total 24 (48%) 26 (52%) 50 (100%)
Abbreviations: E, peak early mitral inflow velocity; e’, peak early diastolic mitral annular
velocity; PAWP, pulmonary artery wedge pressure.
by guest on May 7, 2018
http://circheartfailure.ahajournals.org/D
ownloaded from

24
Figure Legends
Figure 1. Relationship between PAWP measured by RHC and estimated by E/e’ ratio.
Legend: The modest correlation between the PAWP derived by E/e’ and directly measured
by RHC is shown in the scatter plot (A). The Bland-Altman plot (B) demonstrates no bias,
but wide a limits of agreement (±7.7 mmHg).
Figure 2. Response of E wave, e’ average and E/e’ ratio to PAWP changes (supine to
upright).
Legend: Both E wave (A) and e’ average (B) had a positive correlation to PAWP changes,
although the latter was not statistically significant. No linear relationship between E/e’ ratio
and PAWP (C) was found.
Figure 3. Supine PAWP by average E/e’ ratio groups using the recommended cut-off of 13.
Legend: Despite the observed differences of mean PAWP (11±4 vs 14±6 mmHg; p=0.001),
the overlap between groups is significant.
by guest on May 7, 2018
http://circheartfailure.ahajournals.org/D
ownloaded from

by guest on May 7, 2018
http://circheartfailure.ahajournals.org/D
ownloaded from

by guest on May 7, 2018
http://circheartfailure.ahajournals.org/D
ownloaded from

by guest on May 7, 2018
http://circheartfailure.ahajournals.org/D
ownloaded from

Waxman, David M. Systrom and Amil M. ShahMário Santos, Jose Rivero, Shane D. McCullough, Erin West, Alexander R. Opotowsky, Aaron B.
Ventricular Filling PressureE/e' Ratio in Patients with Unexplained Dyspnea: Lack of Accuracy in Estimating Left
Print ISSN: 1941-3289. Online ISSN: 1941-3297 Copyright © 2015 American Heart Association, Inc. All rights reserved.
is published by the American Heart Association, 7272 Greenville Avenue, Dallas, TX 75231Circulation: Heart Failure published online June 11, 2015;Circ Heart Fail.
http://circheartfailure.ahajournals.org/content/early/2015/06/11/CIRCHEARTFAILURE.115.002161World Wide Web at:
The online version of this article, along with updated information and services, is located on the
http://circheartfailure.ahajournals.org/content/suppl/2015/06/11/CIRCHEARTFAILURE.115.002161.DC1Data Supplement (unedited) at:
http://circheartfailure.ahajournals.org//subscriptions/
is online at: Circulation: Heart Failure Information about subscribing to Subscriptions:
http://www.lww.com/reprints Information about reprints can be found online at: Reprints:
document. Permissions and Rights Question and Answer process is available in the
click Request Permissions in the middle column of the Web page under Services. Further information about thisEditorial Office. Once the online version of the published article for which permission is being requested is located,
can be obtained via RightsLink, a service of the Copyright Clearance Center, not theCirculation: Heart Failure Requests for permissions to reproduce figures, tables, or portions of articles originally published inPermissions:
by guest on May 7, 2018
http://circheartfailure.ahajournals.org/D
ownloaded from

SUPPLEMENTAL MATERIAL
Supplemental Methods
Supplement Analysis to Assess Missing data
We performed a sensitivity analysis to assess the influence of missing data in our
results by restricting our analysis to patients with no missing data both at supine and
upright average E/e’ (n=50). We noted no differences in the study results using this
subset of patients (see Table 1-3) compared to the overall study population. We
found a significant correlation between supine E/e’ ratio and PAWP (r=0.34; p=0.02).
The linear regression model was: PAWP = 0.39*E/e’ + 7.4 (p=0.009; 95%CI: 0.10-
0.68). Using this equation to predict PAWP, we found a similar width in agreement
(Bland-Altman method) between predicted and measured PAWP (95% limits of
agreement: -7.7 to 7.7 mmHg, range of 6.5 to 20.8 mmHg). Regarding the diagnostic
utility of E/e’ to identify elevated LVFP (PAWP > 15 mmHg), we found that the
ROC area was 0.66 (95%CI: 0.37-0.95); an E/e’ above 13 had a sensitivity of 17%
and specificity of 86%. The findings of this sensitivity analysis were, therefore,
consistent with the results of our primary analysis.
Supplemental Analysis of Extreme Outliers
We performed a sensitivity analysis to assess the weight of an identified extreme
outlier (Supplement Figure 1) in our main results. We found a significant correlation
between supine E/e’ ratio and PAWP (r=0.34; p=0.001), but still no correlation
between PAWP change and E/e’ change (r=-0.08; p=0.57). The linear regression
model was: PAWP = 0.31*E/e’ + 8.1 (p=0.02; 95%CI: 0.06-0.54). Using this
equation to predict PAWP, we found a similar width in agreement (Bland-Altman

method) between predicted and measured PAWP (95% limits of agreement: -7.3 to
7.3 mmHg). Regarding the diagnostic utility of E/e’ to identify elevated LVFP
(PAWP > 15 mmHg), we found that the ROC area was 0.62 (95%CI: 0.47-0.77); an
E/e’ above 13 had a sensitivity of 0% and specificity of 89%.
Hence, we can conclude that this outlier has no significant influence in our main
results.
Supplemental Tables
Supplemental Table 1 – Clinical, echocardiographic and invasive hemodynamics
supine features between patients with and without upright TDI missing values.
Characteristic No missing
(n=61)
Missing
(n=57) P-value
Age, y 54±19 53±19 0.69
Female, n (%) 42 (69) 41 (72) 0.71
BMI, Kg/m2 27.1±6.1 28.0±7.0 0.44
BSA, m2 1.9±0.3 1.9±0.3 0.39
LVEDVi, mL/m2 37±9 33±9 0.01
LVESVi, mL/m2 15±5 12±5 0.06
LVEF, % 62±7 63±9 0.76
LAVi, mL/m2 19±6 17±6 0.14
Septal wall
thickness, cm
0.94±0.18 0.94±0.15 0.84
Posterior wall
thickness, cm
0.90±0.14 0.86±0.20 0.21

LV mass index,
g/m2
67±18 60±20 0.07
E, cm/s 78±18 77±18 0.75
A, cm/s 70±22 73±19 0.63
E/A ratio 1.2±0.5 1.1±0.4 0.45
DT, ms 228±53 217±41 0.27
e’ septal, cm/s 8.4±2.9 9.0±2.5 0.32
e’ lateral, cm/s 11.5±4.4 12.4±4.2 0.34
e’ average, cm/s 10.0±3.6 10.7±3.2 0.33
E/e’ septal 10.2±4.2 9.1±2.6 0.13
E/e’ lateral 7.8±3.7 6.6±2.6 0.10
E/e’ average 8.7±3.8 7.5±2.5 0.09
PAWP, mmHg 11±5 12±5 0.88
CI, L/min/m2 3.0±0.6 3.0±0.6 0.98
Systolic BP,
mmHg
138±23 130±22 0.06
Diastolic BP,
mmHg
78±10 78±12 0.88
MAP, mmHg 98±12 96±13 0.30
SVR, dyne.s.cm-5 1431±393 1337±338 0.18
HR, bpm 70±15 75±14 0.08
Abbreviations: A, peak late mitral inflow velocity; BP, blood pressure; BMI, body
mass index; BSA, body surface area; CI, cardiac index; DT, deceleration time; E,
peak early mitral inflow velocity; e’, peak early diastolic mitral annular velocity; HR,

heart rate; LAVi, left atrium volume index; LVESVi, left ventricular end-systolic
volume index; LVEDVi, left ventricular end-diastolic volume index; LVEF, left
ventricular ejection fraction; MAP, mean arterial pressure; PAWP, pulmonary artery
wedge pressure; SVR, systemic vascular resistance.
Supplemental Table 2 – Invasive hemodynamic and echocardiographic data in
supine and upright positions of patients with no missing value of E-wave, e’ septal
and lateral data (upright and supine).
Characteristic Supine N Upright N Delta N P-value
Invasive hemodynamic data
PAWP, mmHg 11±4 50 6±3 50 -5±4 50 <0.001
CI, L/min/m2 3.0±0.6 47 2.6±0.8 49 -0.3±0.9 46 0.01
Systolic BP,
mmHg 139±22 49 146±26 50 +8±19 49 0.003
Diastolic BP,
mmHg 79±9 49 79±11 50 0±8 49 0.81
MAP, mmHg 100±11 49 102±13 50 +2±11 49 0.05
SVR,
dyne.s.cm-5 1446±370 46 1744±593 48 +356±557 44 <0.001
HR, bpm 69±15 47 79±14 50 +10±14 47 <0.001
Echocardiographic data
E, cm/s 78±18 50 60±13 50 -18±12 50 <0.001
A, cm/s 71±22 50 67±17 48 -5±13 48 <0.001
E/A ratio 1.2±0.5 50 1.0±0.3 48 -0.2±0.4 48 <0.001
DT, ms 227±53 46 262±67 31 +37±59 30 0.001

e’ septal, cm/s 8.4±3.0 50 6.5±1.9 50 -1.9±2.1 50 <0.001
e’ lateral, cm/s 11.5±4.5 50 7.8±2.1 50 -3.8±3.5 50 <0.001
e’ average,
cm/s 9.9±3.6 50 7.1±1.8 50 -2.8±2.6 50 <0.001
E/e’ septal 10.3±4.2 50 10.1±3.7 50 -0.25±2.6 50 0.54
E/e’ lateral 7.9±3.9 50 8.4±3.2 50 +0.6±3.0 50 0.19
E/e’ average 8.8±3.9 50 9.0±3.2 50 +0.2±2.6 50 0.57
LVEDVi,
mL/m2 37±9 49 31±8 37 -8±8 37 <0.001
LVESVi,
mL/m2 15±5 49 12±5 37 -3±4 37 <0.001
LVEF, % 62±7 49 61±10 37 -2±9 37 0.15
LAVi, mL/m2 19±6 49 13±5 40 -7±5 40 <0.001
Abbreviations: A, peak late mitral inflow velocity; BP, blood pressure; CI, cardiac
index; DT, deceleration time; E, peak early mitral inflow velocity; e’, peak early
diastolic mitral annular velocity; HR, heart rate; LAVi, left atrium volume index;
LVEDSi, left ventricular end-systolic volume index; LVEDVi, left ventricular end-
diastolic volume index; LVEF, left ventricular ejection fraction; MAP, mean arterial
pressure; PAWP, pulmonary artery wedge pressure; SVR, systemic vascular
resistance.

Supplemental Table 3 – Correlation between E wave, E/e’ and PAWP, and their
orthostatic-induced changes of patients with no missing value of E-wave, e’ septal
and lateral data (upright and supine).
Parameter N Coefficient P-value
Supine
E/e’ septal 50 0.32 0.02
E/e’ lateral 50 0.29 0.04
E/e’ average 50 0.34 0.02
E-wave 50 0.33 0.03
E/A 50 0.11 0.46
LAVi 49 0.19 0.20
Upright
E/e’ septal 50 0.06 0.70
E/e’ lateral 50 -0.12 0.42
E/e’ average 50 -0.09 0.56
E-wave 50 0.18 0.22
E/A 48 -0.18 0.22
LAVi 40 0.38 0.01
Delta
ΔE/e’ septal 50 0.03 0.83
ΔE/e’ lateral 50 -0.11 0.43
ΔE/e’ average 50 -0.04 0.77
ΔE wave 50 0.42 0.003
Δe’ septal 50 0.14 0.33

Δe’ lateral 50 0.20 0.17
Δe’ average 50 0.22 0.12
Δ E/A 72 0.20 0.10
Δ LAVi 40 -0.30 0.06
Abbreviations: E, peak early mitral inflow velocity; e’, peak early diastolic mitral
annular velocity; LAVi, left atrium volume index; PAWP, pulmonary artery wedge
pressure.
Supplemental Table 4 – Contingent table of the direction of PAWP and E wave (A),
e’ average (B) and E/e’ average (C) changes with moving from the supine to the
upright position of patients with no missing value of E-wave, e’ septal and lateral data
(upright and supine). 16% (8/50), 16% (8/50), 46% (23/50) of patients had a
discordant change of E-wave, e’ average, E/e’ average, respectively, when compared
to PAWP.
A
ΔE < 0 ΔE > 0 Total
ΔPAWP < 0 41 (82%) 4 (8%) 45 (90%)
ΔPAWP > 0 4 (8%) 1 (2%) 5 (10%)
Total 45 (90%) 5 (10%) 50 (100%)
B
Δe’ < 0 Δe’ > 0 Total
ΔPAWP < 0 41 (82%) 4 (8%) 45 (90%)
ΔPAWP > 0 4 (8%) 1 (2%) 5 (10%)
Total 49 (90%) 7 (10%) 50 (100%)

C
ΔE/e’ < 0 ΔE/e’ > 0 Total
ΔPAWP < 0 23 (46%) 22 (44%) 45 (90%)
ΔPAWP > 0 1 (2%) 4 (8%) 5 (10%)
Total 24 (48%) 26 (52%) 50 (100%)
Abbreviations: E, peak early mitral inflow velocity; e’, peak early diastolic mitral
annular velocity; PAWP, pulmonary artery wedge pressure.
Supplemental Figures Supplemental Figure 1 – The outlier Supplemental Figure 1 Legend: The excluded outlier in the sensitivity analysis.