
EE 495 Report: A Signal Reception Study of 94.9 … · EE 495 Report: A Signal Reception Study of...
22
1 EE 495 Report: A Signal Reception Study of 94.9 KVWV LP in Whatcom and Skagit Counties Author: Soren Wellman 15-March-2016 Abstract The purpose of this project was to gain insight into the signal strength and broadcast radius of Bellingham’s newest low power frequency modulation (LFPM) radio station: Bellingham Community Radio KVWV 94.9 FM. The station began streaming online in October 2015 and began broadcasting over the airwaves on February 1st 2016 from its transmitter site in Bellingham, WA. Due to an unresolved technical issue causing a large voltage standing wave ratio (VSWR), the station has been transmitting at less than half its licensed power of 100 Watts effective radiated power (ERP). Using an RTLSDR device to collect quantitative received signal strength data at various locations throughout Whatcom and Skagit Counties, maps were constructed that provide a picture of broadcast reach throughout the region. The report concludes with a critique of the methods chosen as well as advice for future tests conducted when the station broadcasts at its full, licensed power. Equipment and Parts NooElec Software Defined Radio (SDR) NESDR Mini 2+ 0.5 PPM TCXO USB RTL-SDR Receiver with Antenna Hyundai Accent Cd Mp3 Player XM Bluetooth Radio 96170-1R150GU SDRSharp Software, Version 1.0.0.1430-RTL-SDR ASUS Laptop, Model X55LA-BHI5N12
-
Upload
phungthuan -
Category
Documents
-
view
219 -
download
2
Transcript of EE 495 Report: A Signal Reception Study of 94.9 … · EE 495 Report: A Signal Reception Study of...
1
EE 495 Report:
A Signal Reception Study of 94.9 KVWV LP
in Whatcom and Skagit Counties
Author:
Soren Wellman
15-March-2016
Abstract
The purpose of this project was to gain insight into the signal strength and broadcast radius of
Bellingham’s newest low power frequency modulation (LFPM) radio station: Bellingham Community
Radio KVWV 94.9 FM. The station began streaming online in October 2015 and began broadcasting over
the airwaves on February 1st 2016 from its transmitter site in Bellingham, WA. Due to an unresolved
technical issue causing a large voltage standing wave ratio (VSWR), the station has been transmitting at
less than half its licensed power of 100 Watts effective radiated power (ERP). Using an RTLSDR device
to collect quantitative received signal strength data at various locations throughout Whatcom and Skagit
Counties, maps were constructed that provide a picture of broadcast reach throughout the region. The
report concludes with a critique of the methods chosen as well as advice for future tests conducted when
the station broadcasts at its full, licensed power.
Equipment and Parts
NooElec Software Defined Radio (SDR) NESDR Mini 2+ 0.5 PPM TCXO USB RTL-SDR
Receiver with Antenna
Hyundai Accent Cd Mp3 Player XM Bluetooth Radio 96170-1R150GU
SDRSharp Software, Version 1.0.0.1430-RTL-SDR
ASUS Laptop, Model X55LA-BHI5N12
2
Table of Contents
Abstract………………………………………………………………………………………………..1
Table of Contents……………………………………………………………………………………...2
Introduction …………………………………………………………………………………………...3
Methods and Procedure.………………………………….……………………………………………4
Results………………………………………………………………………………………………...6
Discussion…………………………………………………………………………………………….14
Conclusion…………………………………………………………………………………………….20
References…………………………………………………………………………………………….22
3
1 Introduction
This project stems from KVWV’s ongoing partnership with Western Washington University
(WWU) that involves Electrical Engineering (EE) students in community-engaged learning projects led
by Professor Andy Klein since the station’s formation in 2015 [1]. These project experiences provide
technical support to the station, while providing students an opportunity to acquire first-hand radio
experience outside the classroom.
In the first projects, several WWU EE students became heavily involved with the transmitter site
selection and construction. This resulted in a student report that evaluated various broadcast locations for
the future station which culminated in the decision to place the station’s transmitter at the Karate Church
located at 519 E. Maple St [2]. Once the location had been decided, this follow-on project was initiated
between KVWV and WWU with the goal of conducting a survey of the radio’s signal strength after the
transmitter was operational. KVWV sought to investigate which communities the radio was able to reach
as well as the quality of the signal received. With this knowledge, KVWV could make more informed
decisions regarding community-specific programing, and perhaps more importantly give advertisers data
about the audiences they can reach via KVWV.
The survey was complicated by the fact that KUOW-FM 94.9, a 100,000 Watt station located at
the University of Washington in Seattle, 85 miles south of Bellingham, transmits at the same FM
frequency [3]. Consequently, the presence of an in-band interferer made it more challenging to determine
the power of KVWV’s signal from the static background noise. Before KVWV was on the air, KUOW
could be picked up at many locations in the Bellingham area, albeit typically with static noise present.
Therefore, the survey needed to include information about when KUOW’s signal was being mixed with
or dominating the KVWV signal.
I decided that different kinds of data would be needed to complete the best picture of the signal
strength in the region. First would be quantitative data of the station’s received signal strength, then a
qualitative assessment of how audible the signal was, and a second qualitative assessment of how mixed
the received signal was with KUOW’s signal. These measurements were to each be taken at various
points of interest across western Whatcom County and northwestern Skagit County.
From my experience driving in the Skagit and Whatcom Counties listening to other Bellingham

4
based stations, I predicted that due to the current VRWS problem KVWV’s signal could only be received
in Bellingham and communities to the north of Bellingham with a high degree of clarity and little
interference from KUOW. I also predicted that as one travels south from Bellingham that KOUW would
eventually become the dominant signal likely taking over around the town Edison if travelling down
Chuckanut Drive or around Mile 235 if travelling south on Interstate 5.
2 Method and Procedure
I began collecting data using a car to travel to various locations across Whatcom and Skagit
Counties and using the car radio to make qualitative measurements and using the RTLSDR along with the
SDRSharp software to make quantitative measurements on my laptop. The RTLSDR sent digital
information to my computer about the radio signals it received and the SDRSharp software allowed me to
see graphical representation of the data as well as perform various analyses such as Signal to Noise Ratio
calculations. I connected the USB cable to the RTLSDR and set the antenna in a fixed position, stretched
as far away as possible from my laptop computer. This was done to prevent the laptop from acting as an
antenna, which could strengthen or interfere with the received signal. I made sure all measurements were
made in this configuration to keep the data as standardized as possible without introducing additional
variables. For the same reasons, all measurements were made with all of the car doors closed. The method
I chose to decide where to make measurements was based on trying to collect data in the centers of the
communities I visited as well as when I heard a significant change in the signal at 94.9 FM. I pulled off to
the side of the road and record the data values for both 94.9 FM and 92.9 FM.
I chose to measure this second station, 92.9 FM KISM, because their transmitter is one of the
highest powered radio signals in Whatcom County rated at 50,000 Watts [4]. The collected data
indicating where KISM’s signal became inaudible could represent the maximum boundary for which
KVWV hopes to be able to broadcast when broadcasting from the Karate Church at full strength. This
prediction should only provide a rough estimate as the KISM transmitter is located on Orcas Island,
approximately 15 miles east of Bellingham, but should provide a better estimation model than a high
powered station based in Seattle or Vancouver BC.
When using the SDRSharp software I selected settings that I used as the standard for each
measurement recorded. These settings are listed in Table 2.1 and were not altered as I made
measurements.
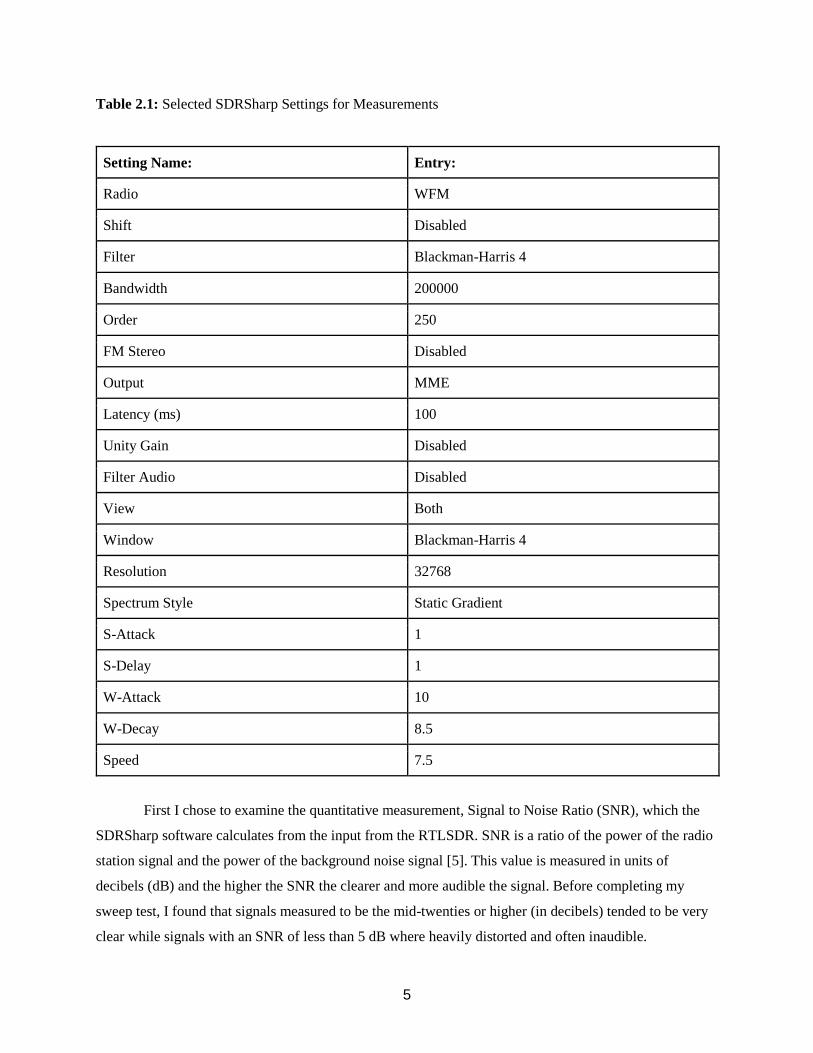
5
Table 2.1: Selected SDRSharp Settings for Measurements
Setting Name: Entry:
Radio WFM
Shift Disabled
Filter Blackman-Harris 4
Bandwidth 200000
Order 250
FM Stereo Disabled
Output MME
Latency (ms) 100
Unity Gain Disabled
Filter Audio Disabled
View Both
Window Blackman-Harris 4
Resolution 32768
Spectrum Style Static Gradient
S-Attack 1
S-Delay 1
W-Attack 10
W-Decay 8.5
Speed 7.5
First I chose to examine the quantitative measurement, Signal to Noise Ratio (SNR), which the
SDRSharp software calculates from the input from the RTLSDR. SNR is a ratio of the power of the radio
station signal and the power of the background noise signal [5]. This value is measured in units of
decibels (dB) and the higher the SNR the clearer and more audible the signal. Before completing my
sweep test, I found that signals measured to be the mid-twenties or higher (in decibels) tended to be very
clear while signals with an SNR of less than 5 dB where heavily distorted and often inaudible.
6
The first of the two qualitative measurements made, was how free the signal was from static and
distortion. I refer to this as the qualitative strength of the signal. I applied this method to both, 92.9 and
94.9 and made the measurement regardless if I could hear KVWV or KUOW. These measurements were
made on a four-point scale. Locations with the least amount of distortion present were labeled Clear
Signal. Next, I labeled signals that were still audible but suffered some distortion and static Moderate
Static. Signals with heavy static and-or high distortion but were still audible (this was judged as to
whether I could make out words being spoken or sung) were labeled High Static. Finally, signals whose
words spoken were indecipherable were labeled as Inaudible.
To complement this measurement, I included a qualitative measurement of how much it 94.9 was
made up of KVWV’s signal and how much was made up of KUOW’s signal. I refer to this as the
qualitative signal isolation. This was represented as different five states. The first was labeled Exclusive
KVWV if no signal of KUOW was present. Likewise, the Exclusive KOUW was used when no signal from
KVWV was present. If the signal was predominantly KVWV with some overlap of KUOW the signal
was labeled KVWV Dominant. Similarly, if KUOW was the predominant signal but was mixed with some
KVWV it was labeled KOUW Dominant. If the signals from the two stations were approximately equal
the signal was labeled Equally Mixed. This metric was not recorded for 92.9 FM as at no point did I pick
up any signal other than KISM at this frequency.
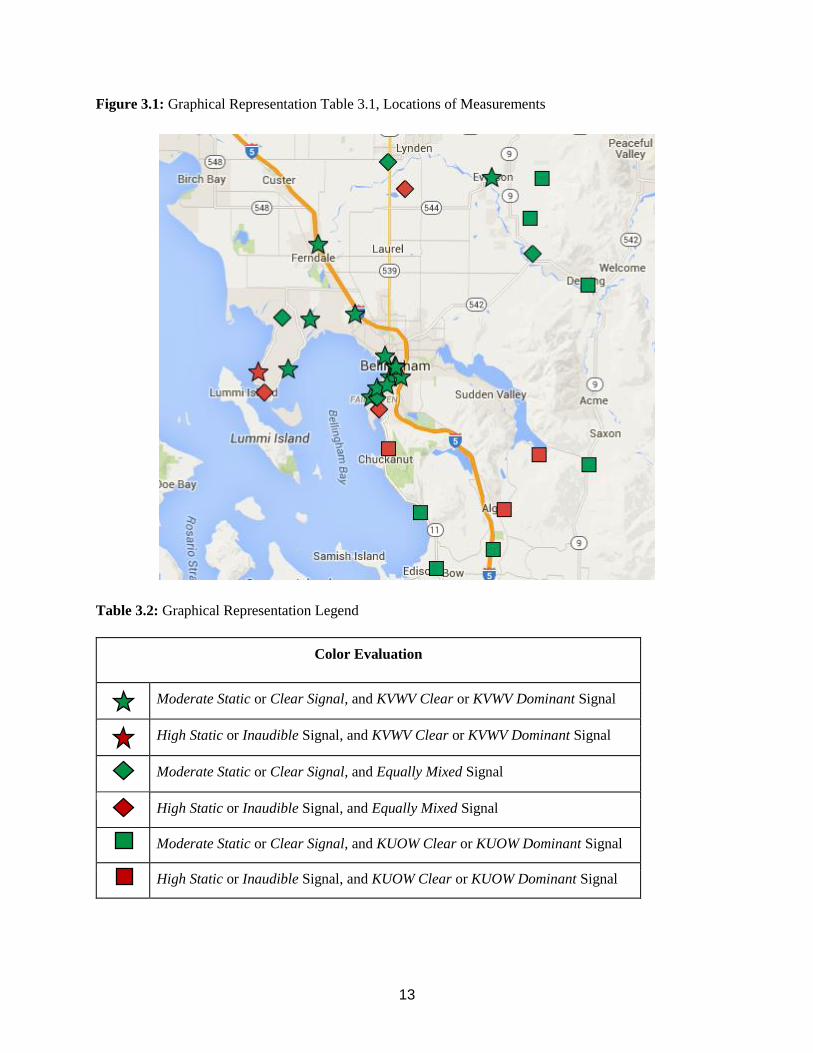
I have included these data visually as well. For each measurement location a marker has been
placed on the included maps. The shape of the marker implies whether KVWV or KUOW was the
stronger signal. For locations measured as Exclusive KVWV or KVWV Dominant the marker is represented
by a star. Locations measured as Exclusive KUOW or KOUW Dominant the marker are represented by a
square. The locations where the signals were Equally Mixed a diamond marker is used. The color of the
marker indicates the clarity of the signal. Markers representing locations with High Static or Inaudible
signals are red in color, while markers representing locations with a Clear Signal or Moderate Static are
represented with green markers.
3 Results
All the measurements were taken on February 28th 2016. The weather was partly sunny with a
high of 54 degrees Fahrenheit and a low of 45 degrees Fahrenheit. The measurements were taken
between 3:00 PM and 10:00 PM. Each data point collected is represented in Table 3.1, Figure 3.1 and

7
Table 3.2. This includes the approximate street address or intersection, Global Positioning System (GPS)
Coordinates, and the quantitative and qualitative metric assessments of each station.
Table 3.1: Radio Sweep Results per Location
Location
Address:
Location
GPS:
Station: SNR: Qualitative
Strength:
Qualitative
Signal
Isolation:
Bellingham
Airport
Latitude 48.79565
26
94.9 6.5 Clear Signal Exclusive
KVWV
Longitude -
122.5330
734
92.9 21 Clear Signal
6000 Portal
Way Latitude 48.85883
52
94.9 8.6 Moderate
Static
KVWV
Dominant
Ferndale Longitude -
122.5839
204
92.9 30 Clear Signal
8071 WA-539 Latitude 48.79565
26
94.9 11.6 Moderate
Static
Equally
Mixed
Lyden Longitude -
122.5330
734
92.9 23.2 Clear Signal
E Wiser Rd
and Lake rd
Latitude 48.90880
81
94.9 6.9 High Static Equally
Mixed
Lyden Longitude -
122.4558
378
92.9 29.9 Clear Signal
144 River Rd Latitude 48.92022
69
94.9 7.5 High Static KUOW
Dominant
Longitude - 92.9 26.1 Clear Signal
8
122.4880
48
203 W Main St Latitude 48.92011
71
94.9 7.7 Moderate
Static
KVWV
Dominant
Everson Longitude -
122.3426
588
92.9 23.8 Clear Signal
S Pass and
Liebrant Rd
Latitude 48.92024
07
94.9 10.1 Clear Signal Exclusive
KOUW
Nooksack Longitude -
122.2766
997
92.9 17.6 Moderate
Static
Siper Rd and
Hopell Rd
Latitude 48.88366
6
94.9 10.1 Moderate
Static
Exclusive
KOUW
Longitude -
122.2929
96
92.9 17.4 Moderate
Static
Lawrence Rd
and Hatley Rd
Latitude 48.85051
2
94.9 6.8 Moderate
Static
Equally
Mixed
Everson Longitude -
122.2875
58
92.9 33.1 Clear Signal
5048 Mt Baker
Hwy
Latitude 48.82330
2
94.9 7.5 Clear Signal Exclusive
KOUW
Deming Longitude -
122.2126
702
92.9 15.2 Moderate
Static
Valley Hwy &
Park Rd
Latitude 48.66012
34
94.9 15.5 Clear Signal Exclusive
KOUW

9
Longitude -
122.2125
464
92.9 14.3 High Static
3959 S Bay
Dr,
Latitude 48.66898
459
94.9 8.4 High Static Exclusive
KOUW
Sedro-
Woolley
Longitude -
122.2806
39
92.9 10 Inaudible
Alger Cain
Lake Rd Coal
Bunker Rd
Latitude 48.61893
44
94.9 3.3 High Static Exclusive
KOUW
Sedro-
Woolley
Longitude -
122.3282
316
92.9 4.8 Inaudible
Bow Hill Rest
Area
Latitude 48.58324
55
94.9 6.8 Clear Signal Exclusive
KOUW
Bow Longitude -
122.3442
14
92.9 26.2 Clear Signal
5521
Chuckanut Dr
Latitude 48.56562
09
94.9 15.9 Clear Signal Exclusive
KOUW
Bow Longitude -
122.4218
329
92.9 18.8 Moderate
Static
Pigeon Point, Latitude 48.61621
88
94.9 10.8 Moderate
Static
Exclusive
KOUW
Chuckanut Dr Longitude -
122.4443
33
92.9 29.9 Clear Signal
10
Yacht Club Rd Latitude 48.67494
74
94.9 11.2 High Static KUOW
Dominant
Chuckanut Dr Longitude -
122.4880
769
92.9 27.8 Clear Signal
Iris Lane Latitude 48.70990
65
94.9 10.6 Moderate
Static
KVWV
Dominant
Chuckanut Dr Longitude -
122.4996
592
92.9 25.3 Clear Signal
401 Harris Ave Latitude 48.72045
95
94.9 7.9 Clear Signal Exclusive
KVWV
Fairhaven Longitude -
122.5111
067
92.9 32.6 Clear Signal
Mill Ave and
11th St
Latitude 48.72089
06
94.9 8.1 Clear Signal Equally
Mixed
Fairhaven Longitude -
122.5033
925
92.9 31.7 Clear Signal
State and 12th
St
Latitude 48.72941
44
94.9 4.8 Clear Signal KVWV
Dominant
Bellingham Longitude -
122.5027
433
92.9 32.1 Clear Signal
Viking Union Latitude 48.73851
1
94.9 29.1 Clear Signal Exclusive
KVWV
WWU Longitude -
122.4856
31
92.9 35.5 Clear Signal
11
Karate Church Latitude 48.74464
62
94.9 31.4 Clear Signal Exclusive
KVWV
Bellingham Longitude -
122.4769
6989
92.9 5.5 Inaudible
Wade King
Recreation
Center
Latitude 48.73150
46
94.9 10.5 Moderate
Static
Exclusive
KVWV
WWU Longitude -
122.4889
433
92.9 28.5 Clear Signal
310 N Samish
Way
Latitude 48.73911
79
94.9 20.4 Clear Signal Exclusive
KVWV
Bellingham Longitude -
122.4693
627
92.9 23 Clear Signal
N State St & E
Holly St
Latitude 48.74842
68
94.9 42.5 Clear Signal Exclusive
KVWV
Bellingham Longitude -
122.4770
955
92.9 28.3 Clear Signal
Broadway &
W Holly St
Latitude 48.75775
88
94.9 35.7 Clear Signal Exclusive
KVWV
Bellingham Longitude -
122.4914
347
92.9 27.7 Clear Signal
Marine Dr &
Ferndale Rd
Latitude 48.79179
5
94.9 5.8 Clear Signal Exclusive
KVWV
Bellingham Longitude - 92.9 27.8 Clear Signal

12
122.5952
5
Haxton Way
and Kwina Rd,
Latitude 48.79380
49
94.9 7.9 Moderate
Static
Mixed
Signal
Lummi
Reservation
Longitude 122.6350
893
92.9 29.8 Clear Signal
Haxton Way &
Southgate Rd
Latitude 48.74321
1
94.9 9 High Static KVWV
Dominant
Lummi
Reservation
Longitude -
122.6667
923
92.9 36.2 Clear Signal
Lummi View
Dr &
Blackhawk
Way
Latitude 48.72581
92
94.9 6.5 High Static Equally
Mixed
Lummi
Reservation
Longitude -
122.6587
604
92.9 32.4 Clear Signal
Lummi Shore
Rd &
Smokehouse
Rd
Latitude 48.74667
14
94.9 16.8 Clear Signal Exclusive
KVWV
Lummi
Reservation
Longitude -
122.6251
323
92.9 20 Clear Signal
13
Figure 3.1: Graphical Representation Table 3.1, Locations of Measurements
Table 3.2: Graphical Representation Legend
Color Evaluation
Moderate Static or Clear Signal, and KVWV Clear or KVWV Dominant Signal
High Static or Inaudible Signal, and KVWV Clear or KVWV Dominant Signal
Moderate Static or Clear Signal, and Equally Mixed Signal
High Static or Inaudible Signal, and Equally Mixed Signal
Moderate Static or Clear Signal, and KUOW Clear or KUOW Dominant Signal
High Static or Inaudible Signal, and KUOW Clear or KUOW Dominant Signal
14
4 Discussion
Perhaps the best way to analyze the data gathered in the sweep is by grouping it into geographical
regions from Figure 3.1. First, The City of Bellingham itself is considered as this is the location KVWV
was established to provide service to. The data points here can be seen in Figure 4.1. Fairhaven and
Chuckanut Drive form another region extending down to the town of Bow, Figure 4.2. The next region is
made up of Marine Drive and the Lummi Reservation not including Lummi Island. These points can be
seen in Figure 4.3. Then the communities of Ferndale, Lynden, Everson and Nooksack form another
region and finally Deming, Acme, Saxon and Alger make up the final region of interest, these points are
seen in Figure 4.4.
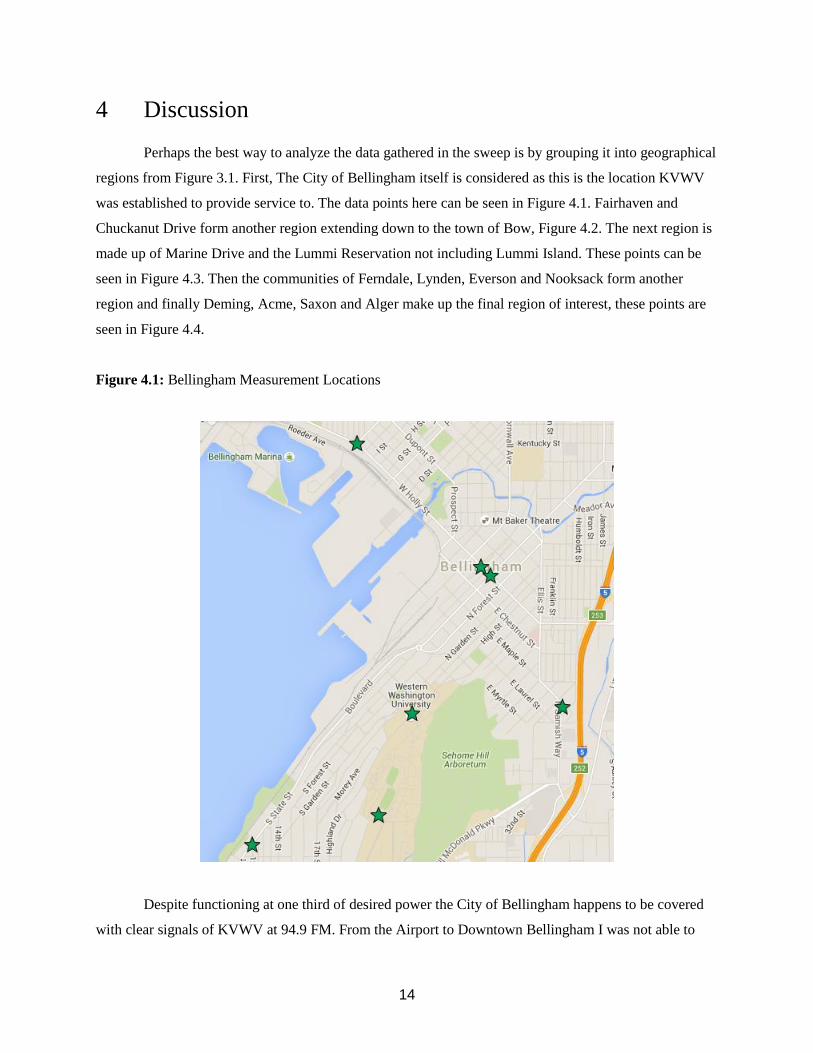
Figure 4.1: Bellingham Measurement Locations
Despite functioning at one third of desired power the City of Bellingham happens to be covered
with clear signals of KVWV at 94.9 FM. From the Airport to Downtown Bellingham I was not able to

15
detect any traces of KUOW’s broadcast. The only place where I had brief disruptions in the signal with
static was on the south side of Sehome Hill. The hill provides a large amount of elevation between the
broadcast point and the listener. When KVWV begins to operate at full power I do not expect much
change in what residents and travelers within the city will hear but perhaps areas of slight static will
dissipate.
Figure 4.2: Fairhaven (a.) and Chuckanut Drive (b.) Measurement Locations
(a.)
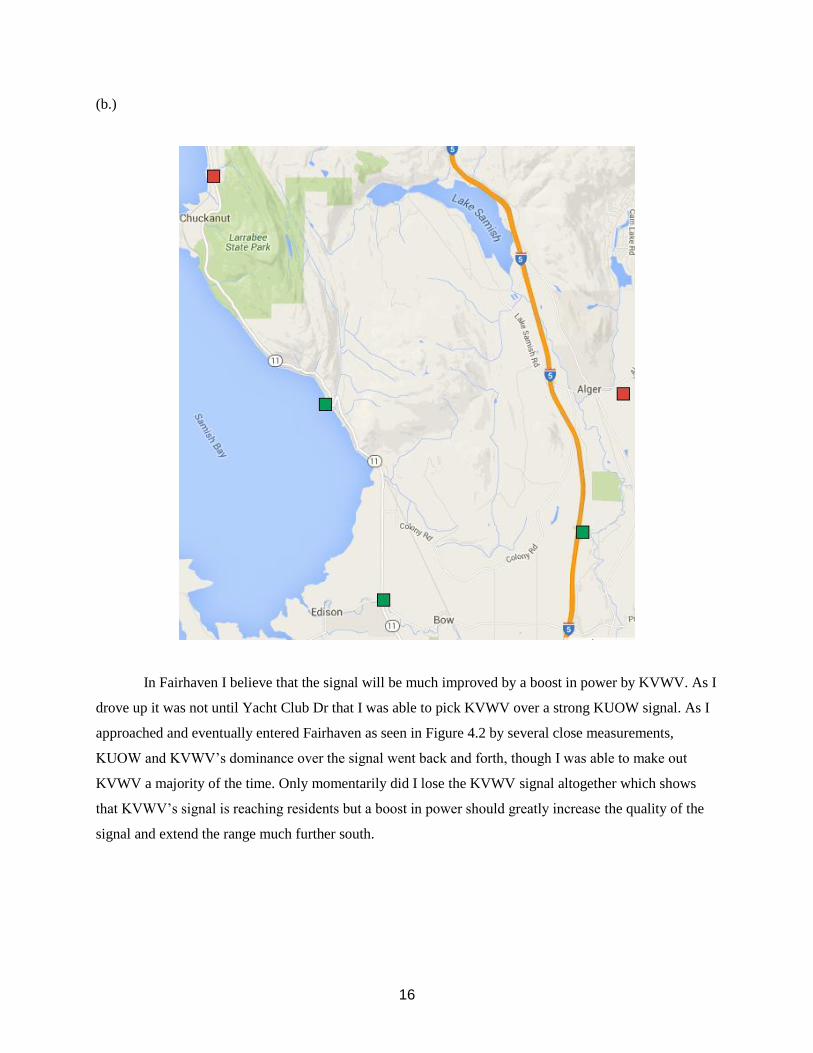
16
(b.)
In Fairhaven I believe that the signal will be much improved by a boost in power by KVWV. As I
drove up it was not until Yacht Club Dr that I was able to pick KVWV over a strong KUOW signal. As I
approached and eventually entered Fairhaven as seen in Figure 4.2 by several close measurements,
KUOW and KVWV’s dominance over the signal went back and forth, though I was able to make out
KVWV a majority of the time. Only momentarily did I lose the KVWV signal altogether which shows
that KVWV’s signal is reaching residents but a boost in power should greatly increase the quality of the
signal and extend the range much further south.
17
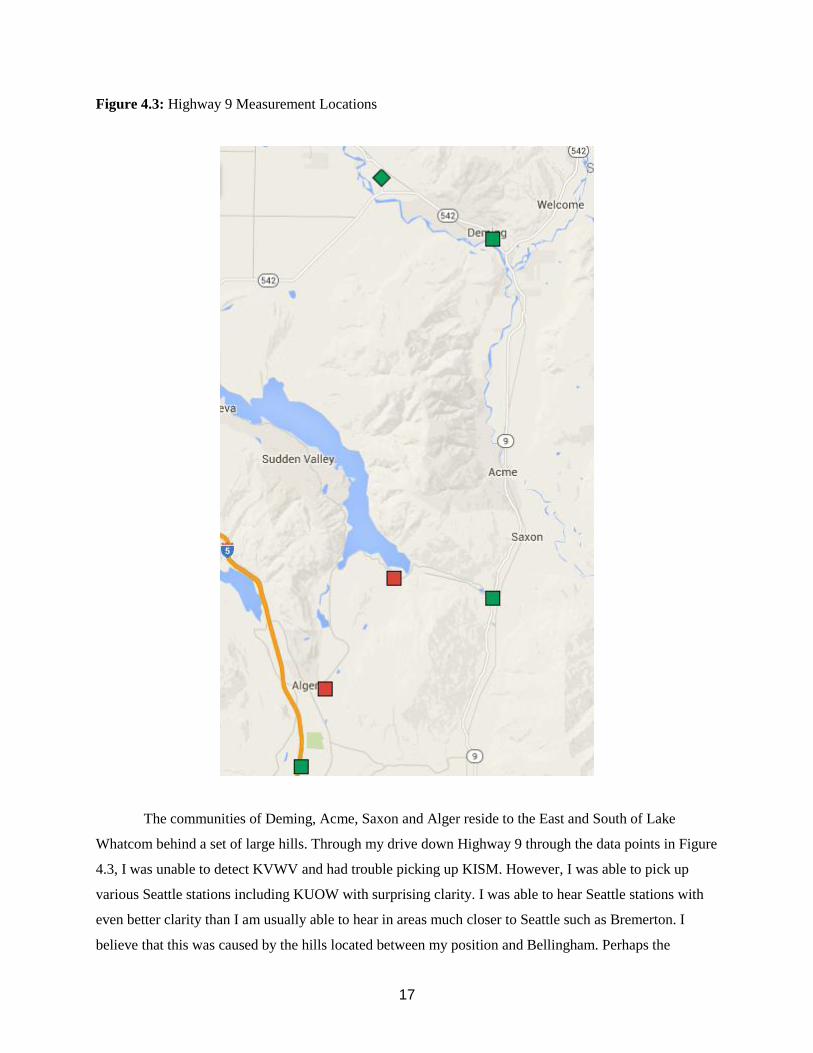
Figure 4.3: Highway 9 Measurement Locations
The communities of Deming, Acme, Saxon and Alger reside to the East and South of Lake
Whatcom behind a set of large hills. Through my drive down Highway 9 through the data points in Figure
4.3, I was unable to detect KVWV and had trouble picking up KISM. However, I was able to pick up
various Seattle stations including KUOW with surprising clarity. I was able to hear Seattle stations with
even better clarity than I am usually able to hear in areas much closer to Seattle such as Bremerton. I
believe that this was caused by the hills located between my position and Bellingham. Perhaps the
18
valley’s topography also fostered constructive interference for the Seattle based signals. My conjecture is
that even with a full power transmitter at the Karate Church, KVWV should not carry much hope for
reaching these communities.
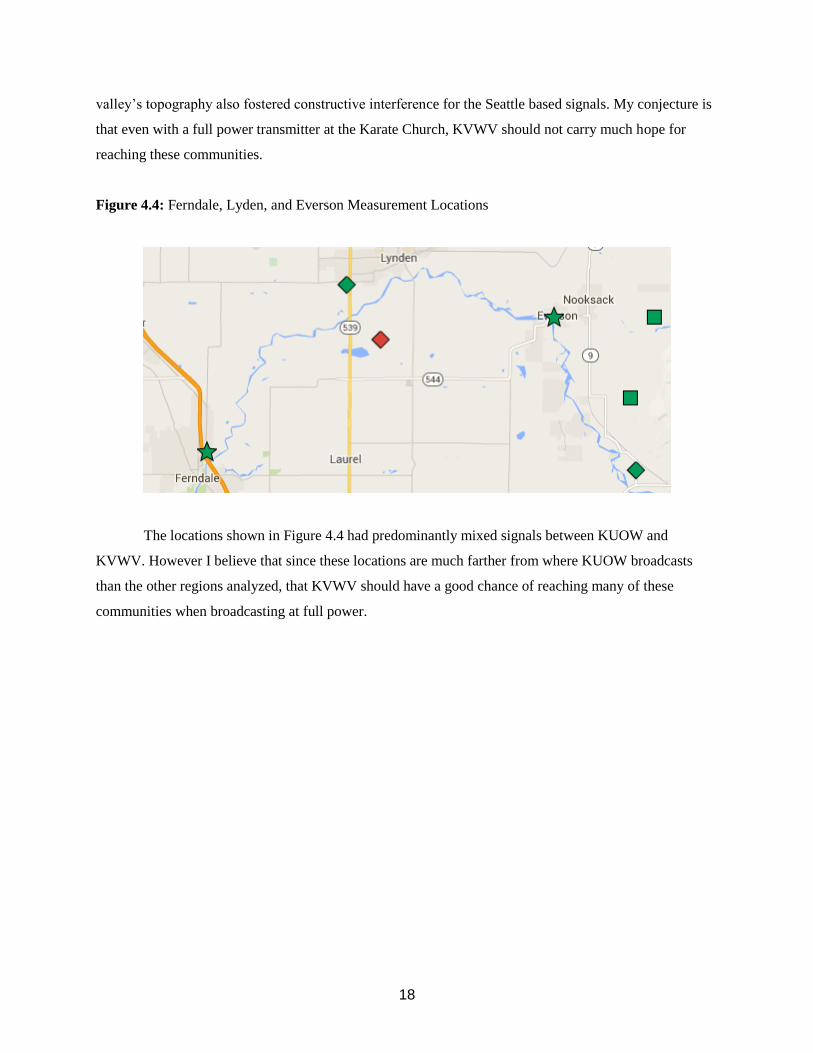
Figure 4.4: Ferndale, Lyden, and Everson Measurement Locations
The locations shown in Figure 4.4 had predominantly mixed signals between KUOW and
KVWV. However I believe that since these locations are much farther from where KUOW broadcasts
than the other regions analyzed, that KVWV should have a good chance of reaching many of these
communities when broadcasting at full power.
19
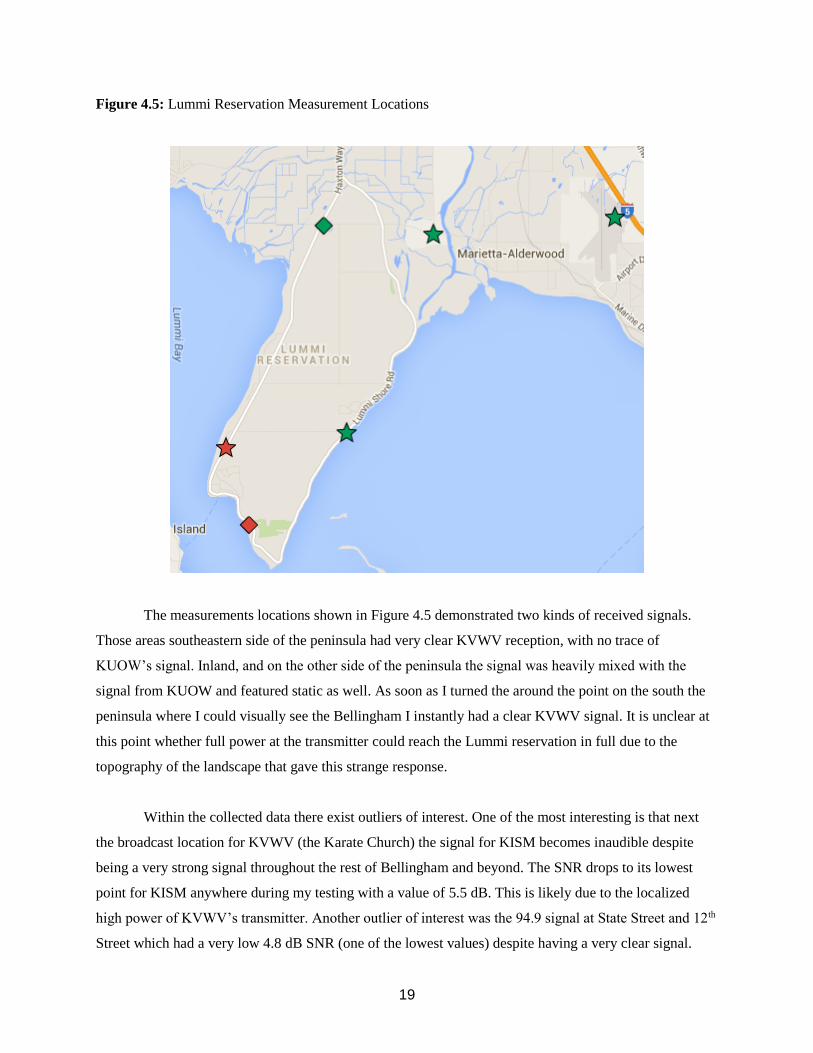
Figure 4.5: Lummi Reservation Measurement Locations
The measurements locations shown in Figure 4.5 demonstrated two kinds of received signals.
Those areas southeastern side of the peninsula had very clear KVWV reception, with no trace of
KUOW’s signal. Inland, and on the other side of the peninsula the signal was heavily mixed with the
signal from KUOW and featured static as well. As soon as I turned the around the point on the south the
peninsula where I could visually see the Bellingham I instantly had a clear KVWV signal. It is unclear at
this point whether full power at the transmitter could reach the Lummi reservation in full due to the
topography of the landscape that gave this strange response.
Within the collected data there exist outliers of interest. One of the most interesting is that next
the broadcast location for KVWV (the Karate Church) the signal for KISM becomes inaudible despite
being a very strong signal throughout the rest of Bellingham and beyond. The SNR drops to its lowest
point for KISM anywhere during my testing with a value of 5.5 dB. This is likely due to the localized
high power of KVWV’s transmitter. Another outlier of interest was the 94.9 signal at State Street and 12th
Street which had a very low 4.8 dB SNR (one of the lowest values) despite having a very clear signal.
20
One explanation for this could be that there is interference that does not reconstruct the signal, such as
narrow band interference. Also interesting is that the SNR is highest, not next to the broadcast location,
but closer to downtown Bellingham, particularly the intersection of N State Street and East Holly which
has an SNR of 42.5, almost 10 dB higher than the next highest value recorded. This likely implies some
kind of constructive interference, possibly caused by larger building in the downtown area.
As one of the project's goals was to identify improvements that could be made when completing a
similar signal survey when KVWV is broadcasting near its intended ERP of 100 Watts, I offer the
following suggestions.
The first suggestion would be to include more locations of interest. With the power increasing up
to twofold, a larger area will likely be needed to give the best information about what communities can be
reached by KVWV. Building upon this, there were communities left out by my sweep which still need
data on signal strength, notably Lummi Island, Portage Island, Birch Bay and areas directly east of
Bellingham such as Sudden Valley.
Perhaps my most highly recommended suggestion is that when completing future sweeps of
Whatcom and Skagit Counties signal investigators should highly consider using a team of at least two.
One driver and another person to record data and operate the instruments. This would allow for much
higher quantities of data points to be taken in far less time. The other more pressing reason is that many of
the roads and highways offered few locations to pullover and make measurements. When they did there
was often dangerously small distances between shouldered vehicles and passing traffic. Highway 9,
Chuckanut Drive and Park Road proved the most difficult to find safe locations to record data with just
one person driving and operating instruments.
One variable that I did not account for weather. Perhaps during future data collection, multiple
tests could be performed varied collections based upon levels of cloud cover and temperature. These are
both factors that can have an effect on radio transmission and thus received signal strength [5].
5 Conclusion
The most useful data for determining whether residents or travelers in a particular area will be
able to listen to KVWV was, not surprisingly, the qualitative analyses of signal clarity and signal
isolation. Unfortunately, because of the competing signal from KUOW, there was little correlation
21
between the quantitative SNR data and the ability to tune in to KVWV. That being said, there is a
correlation between SNR and audibility for KISM. Patterns in these results indicate potential signal
strength results for a fully powered KVWV broadcast as both transmitters are located in the Bellingham
area.
The results from this survey should give the organization of KVWV a better grasp of where their
signal is currently reaching, and some insights into where it will and will not be able to reach. I believe
that when KVWV is broadcasting at full rated power, the techniques and suggestions detailed in this
report will be beneficial to future signal investigators.

22
References
[1] KVWV 94.9 FM. (2015, January). Station Info [Online]. Available: http://kvwv.org/station-info.php
[2] D. Sjoerdsma, A Study of Candidate LPFM Transmitter Sites in Bellingham, WA, unpublished.
March, 2015. Available: http://aspect.engr.wwu.edu/reports/sjoerdsmaKVWV.pdf
[3] Federal Communications Commission. (2012, February). Call sign KUOW [Online]. Available:
http://www.fccbulletin.com/callsign/?q=KUOW
[4] Federal Communications Commission. (2012, February). Call sign KISM [Online]. Available:
http://www.fccbulletin.com/callsign/?q=KISM
[5] C.R. Johnson, Jr., W.A. Sethares, and A.G. Klein, Software Receiver Design. Cambridge University
Press, 2011.


![[Shinobi] Bleach 495](https://static.fdocuments.us/doc/165x107/568c344d1a28ab02358ff2c2/shinobi-bleach-495.jpg)
