
Edward No 858 Sept 15 2.15 ISQuA 11 · PDF file · 2016-08-02U5MR 257 (191 in...
5
9/28/2011 1 Association between Workforce Capacity and Pediatric Ambulatory Care in Afghanistan Anbrasi Edward, PhD, MPH, MBA, Binay Kumar MBA, MPH, Haseeb Niayash MD, MPH, David H Peters, MD, PhD, Gilbert Burnham, MD, PhD Johns Hopkins University, Ministry of Public Health Afghanistan ISQuA 2011 Objectives Illustrate the trends in healthcare quality for under five children in outpatient clinics in Afghanistan between 2005 and 2008 Determine factors, including workforce capacity associated with quality of IMCI care applying bivariate and multivariate statistical measures Discuss study limitations and implications for improving care quality for children in post conflict environments Global deficits in health workforce Estimated at 100M (Chen et al,2004) Doctors, nurses & midwives; 24M Ave world density: 1.6 doctors, 2.5 nurses/1000 Ratio of nurses to doctors: 1.6 to 1.0 Imbalance in skill mix (specialists vs primary care) Maldistribution, migration (internal: rural to urban, public to private, external: brain drain) Association with health service coverage and outcomes Chen, L., T. Evans, et al. (2004). "Human resources for health: overcoming the crisis." Lancet 364(9449): 1984-1990. Provider Density and Health Outcomes Provider Density and Health Outcomes Provider Density and Health Outcomes Provider Density and Health Outcomes Higher worker density associated with improved health coverage and outcomes (Chen et al) >2.5 HW/1000 enhances measles coverage and SBA Critical for achieving MDGs Workforce deficits further exacerbated in fragile health systems - Afghanistan Weak health systems capacity, reliant on donor financing Human resource crisis is characterized by poor working conditions; minimal financial compensation, inadequate staffing (estimated at 39%), lack of career development opportunities or other incentives and worsening security Growing demand for female providers who currently constitute only 24% of the workforce Internal migration from public to private sector (international organizations and local NGO’s) Worker retention, a challenge as opportunities arise for specialized education in high income economies Afghanistan’s Overwhelming Disease Burden Ranks 4th in child mortality IMR 165 (129 in 2006,AHS) U5MR 257 (191 in 2006,AHS) Ranks 2 nd maternal mortality MMR 1600 (Ramos 2002) Life Expectancy 44y
Transcript of Edward No 858 Sept 15 2.15 ISQuA 11 · PDF file · 2016-08-02U5MR 257 (191 in...

9/28/2011
1
Association between Workforce Capacity and Pediatric Ambulatory Care in Afghanistan
Anbrasi Edward, PhD, MPH, MBA, Binay Kumar MBA, MPH,
Haseeb Niayash MD, MPH, David H Peters, MD, PhD, Gilbert
Burnham, MD, PhD
Johns Hopkins University, Ministry of Public Health Afghanistan
ISQuA 2011
Objectives
� Illustrate the trends in healthcare quality for under five children in outpatient clinics in Afghanistan between 2005 and 2008
� Determine factors, including workforce capacity associated with quality of IMCI care applying bivariate and multivariate statistical measures
� Discuss study limitations and implications for improving care quality for children in post conflict environments
Global deficits in health workforce
�Estimated at 100M (Chen et al,2004)
�Doctors, nurses & midwives; 24M
� Ave world density: 1.6 doctors, 2.5 nurses/1000
� Ratio of nurses to doctors: 1.6 to 1.0
�Imbalance in skill mix (specialists vs primary care)
�Maldistribution, migration (internal: rural to urban, public to private, external: brain drain)
� Association with health service coverage and outcomes
Chen, L., T. Evans, et al. (2004). "Human resources for health: overcoming the crisis." Lancet 364(9449): 1984-1990.
Provider Density and Health OutcomesProvider Density and Health OutcomesProvider Density and Health OutcomesProvider Density and Health Outcomes
�Higher worker density associated with improved health coverage and outcomes (Chen et al)
�>2.5 HW/1000 enhances measles coverage and SBA
�Critical for achieving MDGs
Workforce deficits further exacerbated in fragile
health systems - Afghanistan
� Weak health systems capacity, reliant on donor financing
� Human resource crisis is characterized by poor working conditions; minimal financial compensation, inadequate staffing (estimated at 39%), lack of career development opportunities or other incentives and worsening security
� Growing demand for female providers who currently constitute only 24% of the workforce
� Internal migration from public to private sector (international organizations and local NGO’s)
� Worker retention, a challenge as opportunities arise for specialized education in high income economies
Afghanistan’s Overwhelming Disease Burden
� Ranks 4th in child mortality �IMR 165 (129 in 2006,AHS)�U5MR 257 (191 in 2006,AHS)
� Ranks 2nd maternal mortality � MMR 1600 (Ramos 2002)
� Life Expectancy 44y

9/28/2011
2
Formidable Healthcare environment…
� Limited access to health services
� Total OOP: 75% of THE
� 10.5M (42%) live below poverty (<$1/day)
� Inadequate access to safe water 40.3%
� Deliveries by SBA -24%
Ministry and Donor Health Expenditure NHA 2009
Component Amount (US$) Percentage
Curative care services 115,258,776 44.9
Ancillary services 435,450 0.2
Medical goods dispensed 17,760 <0.1
Prevention and PH services 56,636,570 22.1
Health administration 52,249,140 20.4
Capital formation of healthcare provider org 18,866,332 7.3
Education and training of Health personnel 7,363,603 2.9
Research and development in health 1,623,641 0.6
Not classified 4,293,578 1.7
Total 256,744,552 100
Health Reconstruction Efforts
� Critical shortage of health personnel
� >70% of health providers in Kabul city
Promising trends in health service delivery
� MOPH designed a Basic Package of Health Services (BPHS) to address the major disease burden� Service delivery through contracting mechanisms
� Balanced Score Card - a comprehensive performance system to measure multiple domains of the health sector ; patients and community, staff, capacity for service provision, quality of service provision, financial Systems, overall Vision
� Annual independent assessments conducted nationally since 2004 to measure performance of BPHS services
� Enhanced capacity and quality of service delivery as evidenced by the BSC trends
Afghanistan Balanced Scorecard
Measure
National
Median
Lower
Benchmark
Upper
Benchmark Badakhshan Badghis Baghlan Balkh Bamyan Farah
A. Patients & Community
1 Overall Patient Satisfaction % 83.1 66.4 90.9 86.4 76.9 90.9 84.7 97.9 82.82 Patient Perception of Quality Index % 76.0 66.2 83.9 77.6 66.2 82.2 80.0 84.4 69.43 Written Shura-e-sehie activities in community % 34.2 18.1 66.5 35.6 0.0 34.2 17.7 34.5 73.2
B. Staff
4 Health Worker Satisfaction Index % 63.5 56.1 67.9 63.5 57.6 67.9 68.3 61.4 54.45 Salary payments current % 76.7 52.4 92.0 54.9 91.8 45.8 53.3 91.4 97.7
C. Capacity for Service Provision
6 Equipment Functionality Index* % 65.7 61.3 90.0 69.6 62.2 57.5 67.3 75.8 66.37 Drug Availability Index % 71.1 53.3 81.8 52.9 50.1 72.8 56.1 85.6 9.88 Family Planning Availability Index % 61.4 43.4 80.3 54.2 57.9 70.4 64.9 82.7 0.09 Laboratory Functionality Index (Hospitals & CHCs) % 18.3 5.6 31.7 31.7 3.8 15.2 0.0 37.0 0.0
10 Staffing Index -- Meeting minimum staff guidelines % 39.3 10.1 54.0 38.0 22.4 42.7 45.8 53.0 57.111 Provider Knowledge Score % 53.5 44.8 62.3 48.6 41.6 49.3 54.0 69.0 45.512 Staff received training in last year % 39.0 30.1 56.3 68.9 50.9 39.0 52.4 35.5 37.213 HMIS Use Index % 67.7 49.6 80.7 60.9 62.7 40.0 72.9 67.7 72.414 Clinical Guidelines Index % 34.8 22.5 51.0 18.3 25.5 29.9 16.4 41.9 59.515 Infrastructure Index % 55.0 49.3 63.2 63.2 49.7 50.0 58.3 57.9 76.716 Patient Record Index % 65.6 56.1 92.5 51.5 98.5 80.7 97.3 64.5 97.1
17 Facilities having TB register % 15.8 8.3 26.6 32.5 27.0 16.1 16.4 0.0 4.3
D. Service Provision
18 Patient History and Physical Exam Index % 70.6 55.1 83.5 54.2 71.7 55.1 85.4 83.6 52.019 Patient Counseling Index % 29.6 23.3 48.9 23.3 40.4 29.3 55.3 33.2 16.020 Proper sharps disposal % 62.2 34.1 85.0 64.4 34.1 76.9 75.1 85.0 67.821 Average new outpatient visits per month (BHC>750 visits) % 22.2 6.7 57.1 27.3 10.0 27.3 71.4 22.2 0.022 Time spent with patient (> 9 minutes) % 18.0 3.5 31.2 21.0 30.7 1.2 27.3 12.8 18.023 BPHS facilities providing antenatal care % 62.0 28.9 82.8 28.9 49.4 49.7 67.2 88.1 82.824 Delivery care according to BPHS % 25.4 10.5 39.3 38.0 36.2 10.5 39.3 38.0 57.1
E. Financial Systems
25 Facilities with user fee guidelines % 90.6 80.3 100.0 94.8 95.6 95.9 28.9 86.1 100.026 Facilities with exemptions for poor patients % 84.7 64.4 100.0 68.5 54.6 69.3 84.3 95.6 93.9
F. Overall Vision
27 Females as % of new outpatients % 55.2 46.5 59.7 46.9 45.9 56.0 55.1 55.2 59.0
28 Outpatient visit concentration index CI (-1 to 1) -0.010 0.041 -0.055 0.021 0.024 -0.038 0.025 -0.076 -0.036
29 Patient satisfaction concentration index CI (-1 to 1) 0.002 0.020 -0.018 -0.019 0.000 0.003 -0.007 -0.005 0.020
Composite Scores
30 Upper Benchmarks Achieved % 17.2 10.3 30.8 17.2 6.9 6.9 20.7 34.5 31.031 Lower Benchmarks Achieved % 82.8 75.9 89.7 86.2 79.3 86.2 86.2 96.6 72.4
BSC Performance Trends: 2004 to 2008
0
20
40
60
80
100
2004 2005 2006 2007 2008Pts and Community Staff Capacity for Service Provision Quality of care Financial Overall vision
p<0.001
p<0.001
p<0.001
p<0.001
p<0.01
Edward A, Kumar B, Kakar F, Salehi AS, Burnham G, Peters DH. Configuring Balanced Scorecards for Measuring Health SystemPerformance: Evidence from 5 Years' Evaluation in Afghanistan. PLoS Med.8(7):e1001066.

9/28/2011
3
Quality of Care for Children U5: WHO’s IMCI
> 60% deaths associatedwith malnutrition
ARI20%
Diarrhea12%
Measles5%
Malaria8%HIV/AIDS
4%
Perinatal22%
Other29%
� Integration of the Integrated Management of Childhood Illness (IMCI) clinical guidelines in BPHS
� >2100 providers trained
� significant improvements in quality of care for children U5 in primary health facilities between 2004 and 2006
� Limitation of previous studies
� GM not included in IMCI index
� >60% of under five deaths worldwide are attributed to under nutrition
� Malnutrition is a growing concern� 1/3rd of child deaths are due to under-
nutrition
Edward A, Dwivedi V, Mustafa L, Hansen PM, Peters DH, Burnham G. Trends in the quality of health care for children aged less than 5 years in Afghanistan, 2004-2006. Bull World Health Organ 2009;87(12):940-9.
Rationale
� Study trends in IMCI quality of care between 2005 and 2008
� Examine workforce capacity and competency across facilities; staffing adequacy, gender mix, training, knowledge and job satisfaction
� Explore associations between workforce capacity and care quality
Study Design and Sample
� All accessible provinces (upto 25 functional facilities)
� Stratified random sampling of all BPHS health facilities� 3 District Hospitals (DH)
� 7 Comprehensive Health Centers (CHC)
� 15 Basic Health Centers (BHC)
� Case management observations of 5 new outpatients U5 years selected by systematic sampling followed by caretaker interviews
� Interviews on 4 randomly selected health providers per hospital
� Facility assessment of capacity and clinical capabilities including staffing, availability of essential equipment, drugs, laboratory etc
Patient Profile
Characteristics 2005
(n=2485)
2006
(n=2690)
2007
(n=2834)
2008
(n=2780)
Child age <24m (%) 58 57 58 56
Child sex: Male (%) 54 52 53 52
Caretaker: Female (%) 71 73 73 76
Presenting Symptoms (%)
Diarrhea 49 45 44 43
Cough/difficulty in breathing 15 17 19 20
Fever 18 20 20 16
Other (skin infection, injury etc) 18 18 17 21
Type of health facility n=589 n=605 n=622 n=612
BHC 344 373 373 379
CHC 204 191 203 190
DH 41 41 46 43
Screening for Danger Signs
p<0.0001
Assessment of IMCI Conditions
0
20
40
60
80
100
2005 2006 2007 2008
diarrhea cough/diff breath fever anemia vaccine GM
p<0.0001
9/28/2011
4
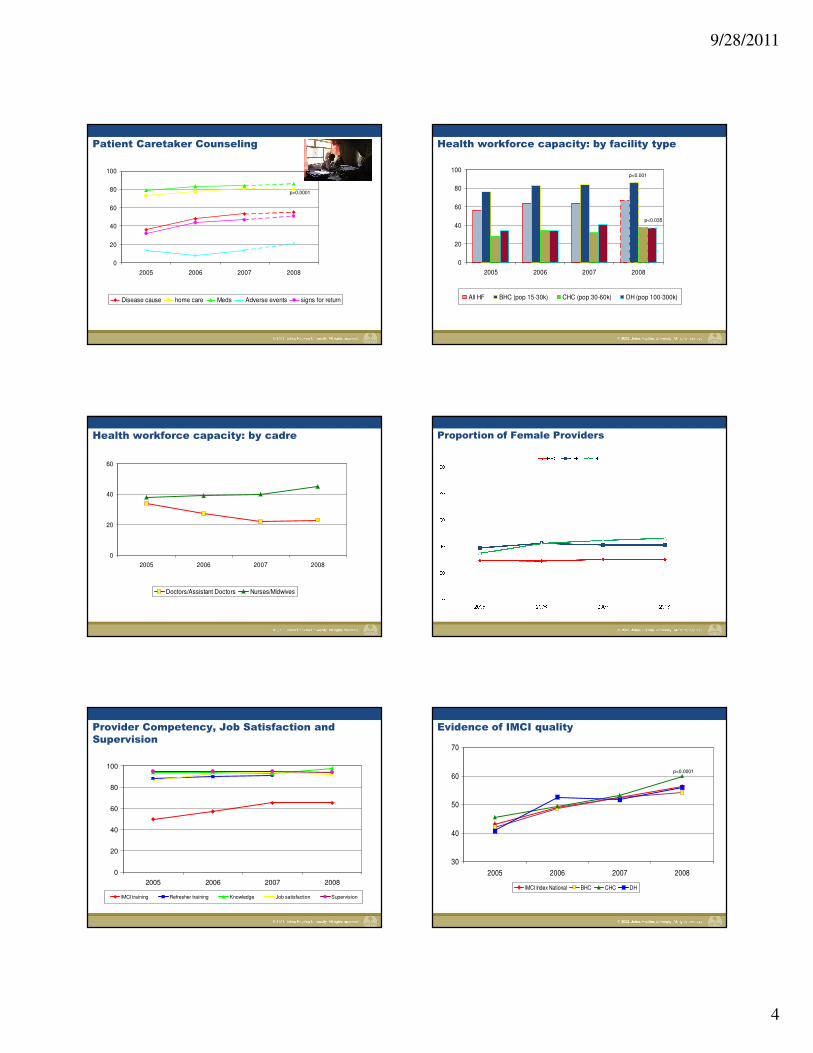
Patient Caretaker Counseling
0
20
40
60
80
100
2005 2006 2007 2008
Disease cause home care Meds Adverse events signs for return
p<0.0001
Health workforce capacity: by facility type
0
20
40
60
80
100
2005 2006 2007 2008
All HF BHC (pop 15-30k) CHC (pop 30-60k) DH (pop 100-300k)
p<0.001
p<0.035
Health workforce capacity: by cadre
0
20
40
60
2005 2006 2007 2008
Doctors/Assistant Doctors Nurses/Midwives
Proportion of Female Providers
Provider Competency, Job Satisfaction and
Supervision
0
20
40
60
80
100
2005 2006 2007 2008
IMCI training Refresher training Knowledge Job satisfaction Supervision
Evidence of IMCI quality
30
40
50
60
70
2005 2006 2007 2008
IMCI Index National BHC CHC DH
p<0.0001

9/28/2011
5
Determinants of Quality IMCI Index
Predictor Variable Bivariate Multivariate
p value coeff p value
Year of assessment (2008) - 7,4 0.000
Child Age (<24m) 0.000 4.25 0.000
Caretaker Sex (Female) 0.000 4.57 0.000
Provider Cadre (Doctor and assistant doctors) 0.000 7.58 0.000
Provider Sex (Male) 0.000 (2006)
Provider knowledge (adequate) 0.000
Provider satisfaction (high) 0.000 11.24 0.000
Adequacy of doctors/assistant doctors 0.000 2,31 0.005
IMCI training (all or some providers) 0.000 5.75 0.000
Refresher training (all or some providers) 0.000
6 Supervision visits in 6m (all or some providers) 0.000 (2007,2008) 3.14 0.05
IMCI guidelines (present) 0.000 5.21 0.000
Consultation time (≥10min) 0.000 16.19 0.000
Facility type (CHC) 0.000 (2005,2008) 1,63 0.000
Management Agency (contracting in vs out and other)0.000 3.93/5.86 0.000
Patient load (high)0.000 (2008)
Community council (active)0.000 3.09 0.001
Key Findings on Quality Determinants
� Some evidence of investments illustrated by improved quality of
care (though still suboptimal) , IMCI training and health workforce
� Declining trends of adequacy of physicians/assistant doctors
� Determinants of Quality
� Patient characteristics: age <24m, female caretaker, consultation time
� Provider characteristics: physician, knowledge, IMCI training, refresher training, supervision, job satisfaction
� Facility: Adequacy of clinical staff, contracting-in management, community council
� Study Limitations
� Bias (observer, courtesy, not risk adjusted)
� Comorbidities and non-IMCI conditions not examined
Conclusions and Future Considerations
� Regulatory mechanisms and comprehensive measurement
frameworks support governance and priority setting
� Lack of mechanisms to foster a culture of behavior change for
quality improvement amongst healthcare providers
� Environmental pressures including worsening security, internal
and external migration of clinicians pose a major threat to
sustaining the gains in healthcare quality
� Efforts to strengthen workforce and retention, availability of
trained female providers; performance based incentives
� Innovations for e-learning and establishment for additional
schools of medicine and nursing to complement the recent
investments in midwifery training
� Inequity of access to the bottom population quintile necessitates
alternate measures for community based health providers
Accelerating efforts toward optimal quality