Education's Role in Explaining Diabetic Health Investment ...
24
Education's Role in Explaining Diabetic Health Investment Differentials by Matthew E. Kahn, Columbia University June 1996 Discussion Paper Series No. 9596-20
Transcript of Education's Role in Explaining Diabetic Health Investment ...

Education's Role in Explaining DiabeticHealth Investment Differentials
byMatthew E. Kahn, Columbia University
June 1996
Discussion Paper Series No. 9596-20

Education's Role in Explaining Diabetic Health Investment Differentials1
Matthew E. Kahn
Columbia University
June 1996
Abstract
Diabetic tight blood sugar control minimizes the likelihood of complications. This study focuses onquantifying education's role in explaining diabetic investment in health capital. Ability and information proxiesare used to test whether education's positive effect on diabetic compliance is causal. The paper's key findingis that education continues to have a positive impact on diabetic health investment even after controlling forIQ and available information.
Assistant Professor of Economics and International Affairs, Columbia University,Department of Economics, 420 W. 118th Street, NY NY 10027. e-mail: [email protected] thank Dora Costa for useful comments.

I. Introduction
Labor economists have found evidence that during the 1980s and 1990s, the returns to education have
increased (Levy and Murnane 1992). One hypothesis that might explain this fact is that the more educated
have been better able to process new information and access new technologies such as computers (Krueger
1993). An extension of this argument is that the health returns to education may have also increased because
people with high education levels have accessed new technologies and processed new scientific information
about the benefits of health investments.
This paper explores the health investment choices of different vintages of diabetics of different
education levels. Thirteen million people have diabetes.1 Diabetes is a chronic disease in which the body does
not produce or respond to insulin.2 Diabetic's choices over diet, exercise, blood sugar control, and smoking
play a key role in determining the likelihood of suffering diabetic complications.3
Recent diabetic research has documented the value of tight blood sugar control in minimizing the
are two major types of diabetes: insulin-dependent diabetes mellitus (IDDM also calledtype I ) and non-insulin dependent diabetes mellitus (NIDDM, also called type II) (AmericanDiabetic Association 1993). NIDDM is much more common than IDDM (known as juvenilediabetes). Almost 98% of people older than 20 with diabetes have NIDDM. Diabetes therapy isgeared toward controlling high blood glucose levels and preventing diabetes complications. ForIDDM, treatment consists of insulin injections and diet/exercise therapy. For NIDDM, treatmentmay include insulin injections or oral agents to lower blood glucose, diet therapy, a weight-reduction program for patients who are overweight, and a program of exercise.
2 Insulin is a hormone, produced by the pancreas, that helps the body metabolize the sugar glucose.When insulin is absent or ineffective, high levels of glucose appear in the blood. High blood glucose levelscan lead to both short-term and long-term complications (American Diabetic Association 1993).
3In Kahn (1995), I present an optimistic thesis that newer cohorts of diabetic should experience lowerrates of complications because the "full price" of diabetic compliance with good health habits is falling.The "full price" of compliance depends on whether an individual is insured so that he faces alower marginal cost of investing in self protection equipment, the physical cost of devoting effortto health maintenance, and how tasty are diet substitutes for their sugar counter-parts.
1

likelihood of complications.4 Education may play a key role in explaining cross-sectional variation in diabetic
health choices. If diabetics with high levels of education are most likely to see doctors and to process this
information and to value future utility (a low discount rate), then they will make larger behavioral changes than
less educated people. Diabetic health inequality would grow over time if different demographic groups make
larger lifestyle changes in response to new information.
This study focuses on quantifying diabetic health investment by education level in different calendar
years. If the most educated are making larger investments, there are two major hypotheses that could explain
this finding. One is that education raises one's learning ability and thus one is more productive at accessing
new technologies and understanding new information about tight blood sugar control. A second theory is that
education proxies for patience and that more patient people are more likely to be "health nuts".5
By studying education's role, I contribute to the health production literature. Following
Grossman (1975), Berger and Leigh (1989) and Kenkel (1991), I explore education's impact on investment
in health. My contribution is to study a specific subgroup (diabetics) who have an incentive to recognize that
controlling their pre-existing condition requires certain investments that a non-diabetic may not need to make.
To study variation in diabetic health investment, I focus on several key inputs in the production of good health.
This paper's empirical work focuses on explaining diabetic smoking, body mass index (bmi), diet control and
blood sugar control as a function of education, IQ and information proxies. Smoking propensities are
especially informative proxy for diabetic health investment. Diabetics should not smoke because variation
4Drury (1984) reports that diabetics are about twice as likely relative to non-diabetics to report everhaving cataracts, glaucoma, arteriosclerosis, hypertension, heart attacks, strokes, and kidney trouble.Diabetics are more likely than non-diabetics to be limited in their usual activities. Diabetes is the seventhleading cause of death in the United States and third largest killer of African Americans.
5For a comprehensive review of the education and health literature see Grossman andKaestner(1996).

in blood sugar levels damages blood vessels and smoking exacerbates such circulation problems.6 My findings
can be simply summarized. Even controlling for IQ or information proxies, education continues to have a
positive impact on diabetic health investment. To document these findings; in Section II, I present my data
sources. Section III presents my findings and Section IV concludes.
II. The Data
This study uses four data sets to explore diabetic investment choices over time and across demographic
groups. Two National Health Interview Survey (NHIS) cross-sections in 1976 and 1989 are used to contrast
smoking propensities between diabetics and non-diabetics. The NHIS is a continuing nationwide sample
survey on personal and demographic characteristics, illnesses, injuries, impairments, chronic conditions,
utilization of health resources, and other health topics, obtained through personal household interviews. The
NHIS sample is representative of the non-institutionalized U.S. civilian population. In 1976 and 1989, the
NHIS included an extensive set of questions about the prevalence of diabetes. The majority of diabetics in this
data set are type two diabetics who are diagnosed later in life. Table One presents the summary statistics
indicating that the average age of diabetics in the sample is 57.5. Type Two diabetes is not randomly assigned
in the population. A person is more likely to be diabetic if she is older, black, heavy, and has less education
(Kahn 1995).
The National Health Interview Surveys (NHIS) provides data in 1976 and 1989 on diabetic smoking
rates and demographic characteristics. The 1989 data has extensive information questions asked to over 2000
diabetics that include proxies for diabetic investment in health capital and diabetic health maintenance
6Recent medical literature has verified this using treatment/control comparisons (seeChase 1991, Gay 1992, Stegmayr 1990). Gay (1992) report evidence of a non-linearity that theexcess morbidity for smoking diabetics is greater than that expected from the combined effects ofsmoking and diabetes on morbidity.

investment and information. The questions include whether the diabetic takes insulin or diabetic pills, has
been given a diet, follows a diet, checks urine and blood, and checks his/her blood pressure. In addition, the
data set includes questions on the source of diabetic information. In particular, whether the diabetic has
learned to control his/her condition from; a doctor, nurse, dietician, relative or friend, another diabetic,
diabetic organizations, or library, newspaper, support group, or national diabetic information clearinghouse,
or taken a diabetic class. These are crude proxies for information since it is impossible to standardize what
people have learned or were exposed to.7
The NHIS cross-sections provide a large number of observations on type 2 diabetics but much fewer
observations on type 1 diabetics. Type 1 (the juvenile) diabetics are interesting for two reasons. First, these
diabetics are diagnosed early in the life cycle thus many decisions such as human capital attainment, marriage,
occupational choice, may be tied to health investment.8 Second, the onset of type 1 diabetes is considered to
be "exogenous". There is less concern with type 1 diabetes that they are not representative of the general
population. Until recently, a large sample of micro data on type 1 diabetics was not available. The recently
completed Diabetic Clinical Control Trials (DCCT), (see New England Journal of Medicine 1993), offer a
unique opportunity to study type one diabetic health investments. This study was designed to learn the benefits
of tight blood sugar control through a control/treatment group comparison. At the randomization stage, 1441
type 1 diabetics were asked detailed health questions. The data reports their propensities to smoke, drink,
exercise, and an indicator of their mean blood level over the last two months. This data set is divided into two
groups; the "primary" and "secondary" groups. This distinction was made because the goal of the DCCT was
to study whether tight blood sugar control had high health benefits for newly diagnosed diabetics and for
7One might conjecture that access to these sources are normal goods. To test this, I estimated linearprobability models to estimate the likelihood that a diabetic accessed each of these. The measure of incomein the NHIS is family income. I found positive but quite small effects. On average a $10,000 increase infamily income increased the probability that a diabetic accessed these sources by 2%.
8A rational addiction model (Becker and Murphy 1991) might predict that forwardlooking young diabetics would be less likely to start smoking than similar non-diabetics.

diabetics who had longer durations. The sample of diabetics were not a random sample of the universe of type
one diabetics. To be admitted into the DCCT an applicant was required to not have severe complications.9
Relevant for my work, each participant received a physical exam, was asked standard demographic questions,
including their smoking propensities, and took an IQ test. Table One shows that the mean IQ was 113 which
is a standard deviation above "normal". Given that the DCCT data consists of people under age 40,1 want
to compare smoking propensities to a "control" group. The National Longitudinal Survey of Youth (NLS Y)
asked individuals questions about smoking propensities in its 1992 wave. I use this cross-section from this
panel data set to compare smoking propensities.
III. Specifications and Findings
My empirical goal is to study education's role in diabetic health investment and to study how
education's effect varies in different calendar years and whether its impact diminishes when one controls for
information or ability proxies such as IQ. I proxy for health investment using individual smoking, propensity
to follow a diet, blood sugar control and one's body mass index (bmi) which is weight standardized for height
(weight in kilograms divided by the square of height in meters).10 Each of these health decisions, to not smoke,
to follow a diet and achieve tight blood sugar control represents a costly investment
A more structural modeling approach would write down a lifetime dynamic expected utility model.
Facing a budget constraint, each person would choose what inputs to consume while weighing the costs and
9 To quality for the DCCT, a person had to be between the ages 13-40, have had IDDM for aduration of at least 1 year but less than 5 (group 1), and had absence of diabetic retinopathy or other ocularlesions, second group duration 1 to 15, minimal eye troubles, no hypertension. Also not allowed into thesample were very heavy people, or people with high blood pressure, high cholesterol, no alcoholics or drugabusers.
10Costa (1993) documents the U shaped relationship between bmi and relative mortalityrisk. Weight adjusted for height is a measure of current nutritional status.

benefits of consumption. The higher a person discounts future utility or their greater unwillingness to tradeoff
"tasty" food for future good health would lower their investment in these health inputs. A second relevant issue
is cognitive dissonance and self control. A person could desire good health but not know how to achieve it or
subconsciously suppress information that might aide in rational decision making (Thaler and Shefrin 1981,
Akerlof and Dickens 1982). A forward looking rational addiction model would predict that diabetics would
be less likely to start smoking than non-diabetics because the former face a higher "long term" price as
measured by increased health complications (Becker and Murphy 1992, Becker, Grossman and Murphy 1994).
Smoking Findings
Smoking is an important decision that reveals information about diabetics. Diabetic smoking rates
were 29% and 21% respectively in 1976 and in 1989. Diabetics may not internalize the full cost of their
actions if they do not perceive the health complications caused by the complementarities between their
condition and smoking. This is especially likely to be true if the presence of a pre-existing condition is not
randomly assigned in the population. If people with less "self control" are more likely to be diabetic and more
likely to smoke, then they will need an extra incentive not to smoke than a random person in the society. In
results that are available on request, I have estimated a bivariate probit model that a person smokes and is
diabetic and found a statistically significant correlation of .6. This indicates that controlling for all observed
demographic characteristics, the unobserved characteristics that increase one's probability of being a smoker
also increase one's probability of being a diabetic.11
Table Two presents seven separate smoking propensity logits. Each column of Table Two reports a
separate set of estimates. Holding age, diabetic duration, and sex constant, I study how smoking propensities
nGraber et. al (1992) report additional evidence that diabetic smokers differ from theuniverse of diabetics. They report evidence that diabetic smokers were much more likely to quitoutpatient treatment education programs than observationally identical diabetic non-smokers.This suggests that smoking proxies for a general unwillingness to make health investments.
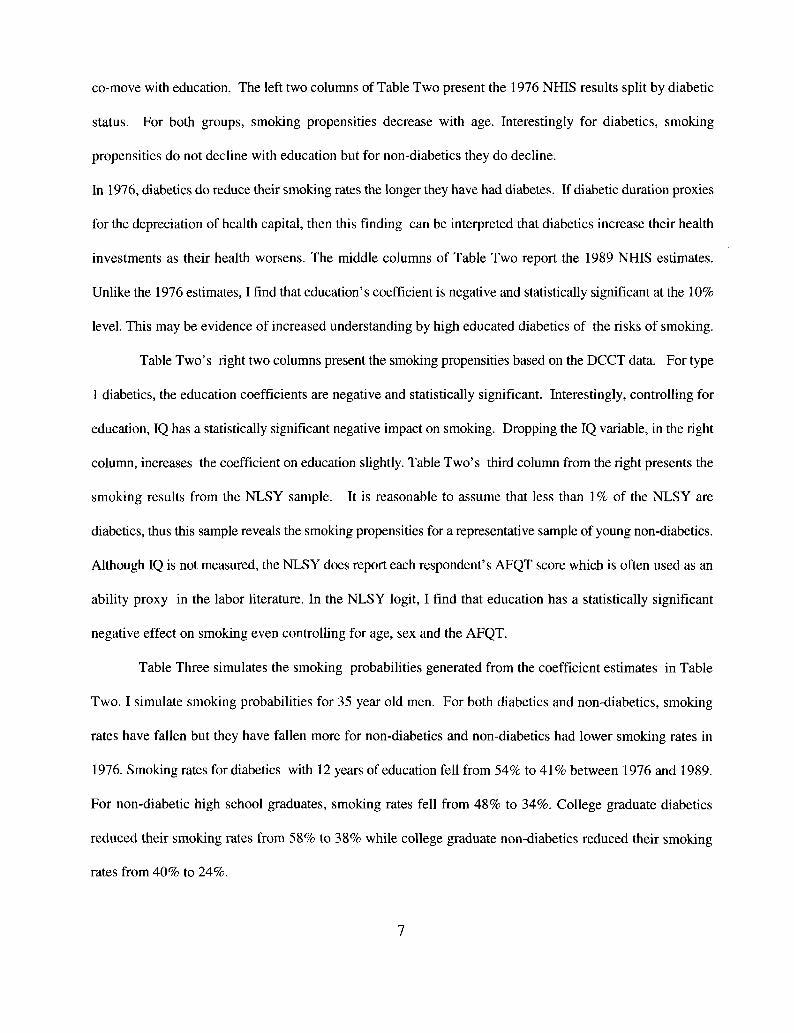
co-move with education. The left two columns of Table Two present the 1976 NHIS results split by diabetic
status. For both groups, smoking propensities decrease with age. Interestingly for diabetics, smoking
propensities do not decline with education but for non-diabetics they do decline.
In 1976, diabetics do reduce their smoking rates the longer they have had diabetes. If diabetic duration proxies
for the depreciation of health capital, then this finding can be interpreted that diabetics increase their health
investments as their health worsens. The middle columns of Table Two report the 1989 NHIS estimates.
Unlike the 1976 estimates, I find that education's coefficient is negative and statistically significant at the 10%
level. This may be evidence of increased understanding by high educated diabetics of the risks of smoking.
Table Two's right two columns present the smoking propensities based on the DCCT data. For type
1 diabetics, the education coefficients are negative and statistically significant. Interestingly, controlling for
education, IQ has a statistically significant negative impact on smoking. Dropping the IQ variable, in the right
column, increases the coefficient on education slightly. Table Two's third column from the right presents the
smoking results from the NLSY sample. It is reasonable to assume that less than 1 % of the NLSY are
diabetics, thus this sample reveals the smoking propensities for a representative sample of young non-diabetics.
Although IQ is not measured, the NLSY does report each respondent's AFQT score which is often used as an
ability proxy in the labor literature. In the NLSY logit, I find that education has a statistically significant
negative effect on smoking even controlling for age, sex and the AFQT.
Table Three simulates the smoking probabilities generated from the coefficient estimates in Table
Two. I simulate smoking probabilities for 35 year old men. For both diabetics and non-diabetics, smoking
rates have fallen but they have fallen more for non-diabetics and non-diabetics had lower smoking rates in
1976. Smoking rates for diabetics with 12 years of education fell from 54% to 41% between 1976 and 1989.
For non-diabetic high school graduates, smoking rates fell from 48% to 34%. College graduate diabetics
reduced their smoking rates from 58% to 38% while college graduate non-diabetics reduced their smoking
rates from 40% to 24%.

Although both diabetics and non-diabetics reduce smoking as education increases, these simulations
suggest that non-diabetics have a greater elasticity of not smoking with respect to education than do diabetics.
Given that diabetics face a greater health incentive to not smoke than non-diabetics, these results suggest that
type 2 diabetics must have a stronger preference for smoking than non-diabetics. My findings suggest that a
benevolent paternalistic government would have trouble reducing type 2 diabetic smoking. Education had no
impact in 1976 and a relatively small effect in 1989. This suggests that public information campaigns would
not be successful in reducing type 2 diabetic smoking. An alternative to information would be higher prices
but the government cannot "two part price" smoking for diabetics.
Unlike for type 2 diabetics, I find larger education effects for type 1 diabetic based on the DCCT
relative to the non-diabetic "control group" (the NLSY). Increasing a type 1 diabetic's education from 12 to
16 years reduces smoking propensities by 20 percentage points while this education increase reduces non-
diabetic smoking rates as indicated in the NLSY data by 18 percentage points. For both the NLSY and DCCT
samples, I find that increases in education not the IQ proxy leads to a larger reduction in smoking rates.
Interestingly, even for the type 1 diabetics the simulations indicate very high smoking rates among less
educated diabetics. All diabetics have an incentive to not smoke but regardless of education level diabetics are
smoking more than their non-diabetic counterparts.
Additional Evidence on Diabetic Education and Self Control
In addition to smoking rates, blood sugar control is another key determinant of diabetic health. The
DCCT sample includes an A1C test. This test provides an indicator of the mean of diabetic blood sugar levels
over the last two to three months. It is a crucial input in informing a diabetic's doctor about the degree of
patient tight control over blood sugar.12 Given that the diabetic's goal is to achieve tight blood sugar control,
12Even if the diabetic keeps detailed food and blood sugar monitoring records, thediabetic has private information about his "cheating". The A1C test reveals information about thediabetic's overall control over the time interval.

this is an indicator of whether the mean "is right". There is no test of the historical variance around the target.
Table Four presents two separate OLS regressions where the dependent variable is the diabetic's A1C reading.
I estimate the A1C regression separately for the DCCT's "Secondary" and "Primary" samples. The Secondary
sample have had type one diabetes longer and have experienced some complications. For this group, I find
that people who are older, have had diabetes for a longer duration and have more educated have a statistically
significantly lower A1C. This indicates that they have tighter control over their condition. Interestingly, IQ
has the "wrong" sign and is statistically insignificant for this sample. For the "primary" sample, I find that
education continues to increase the degree of tight control. Unlike the other sample, I find that the IQ variable
is statistically significant at the 10% level. Its sign indicates that increased IQ increases blood sugar control.
The coefficient sizes indicate that 9 extra points of IQ or 1 more year of education have equal impacts on
reducing the A1C score. I have dropped the IQ variable from the regressions and have that education's
coefficient is robust.13 Although education's coefficient is negative and statistically significant its magnitude
is relatively small. The standard deviation for the A1C variable is 1.6 while the coefficient on an extra year
of education is -.10.
A final interesting point is to relate A1C scores with smoking propensities. A self control model
would posit that people who do a less good job controlling their diabetes are also more likely to smoke. Simply,
on all margins they are investing less in their health. I find that for people with an A1C reading below the
median only 16.8% smoke while for diabetics whose A1C is above the median the mean smoking rate is 25%.
Diabetic Health: Education vs. Information
The previous section documented that controlling for IQ does not diminish the impact of education
on smoking rates. In this section, I study whether controlling for diabetic information proxies reduces the
13The raw correlation between IQ and education in my DCCT sample is .4.
9

impact of education on health input variables such as smoking and diet. I mimic a notable recent study by
Kenkel (1991). He uses the Health Promotion/Disease Prevention Supplement of the 1985 Health Interview
Survey to test for education's impact on health investment after controlling for health information. This data
set quantifies the number of correct answers respondents gave linking behavior to health outcomes. Kenkel
(1991) reports that controlling for this health knowledge, education continues to have a positive effect on
health investment as indicating by smoking.
My information proxies are the dummy variables in the 1989 NHIS data that indicates the sources of
diabetic information about disease control. I explore whether including information proxies lowers the impact
of education on diabetic propensities to smoke, follow their diet, and bmi. Table Five presents these results.
Each column is estimated using OLS. Thus, the smoking and diet models are linear probability models. The
dependent variable in the left two columns is a dummy variable that equals one if the diabetic is a smoker. The
specifications are identical except that the first specification includes the 13 information dummies discussed
in the data section. Each of these information proxies equals one if the diabetic reported it as a source of
information about controlling the condition. The smoking results indicate that a visit with a nurse at a doctor's
office reduces smoking propensities by 6.5 percentage points. I conduct an F-test on the joint significance of
the information proxies and cannot reject the hypothesis that they are jointly equal to zero. Interestingly, the
coefficient on education's impact on smoking does not change when information proxies are included but the
coefficient is no longer statistically significant.
The middle two columns of Table Five report the results where bmi is the dependent variable. A larger
bmi indicates a heavier person. It is reasonable to posit that increased information may lower bmi. For bmi,
I find that diabetics who discuss their condition with a doctor (86% of the sample) have a lower bmi of .68.
Diabetics who receive information from the National Diabetic Information Clearinghouse (NDIC) have a bmi
of 1.26 lower than observationally identical diabetics who do not. In the NHIS 1989 sample, the mean bmi
is 25 with a standard deviation of 4.5. Thus, the information effects are relatively small. Similar to the
10

smoking results, the information proxies are jointly insignificant. Increased education lowers diabetic bmi. A
one year increase in education lowers bmi by .087 units. This estimate is just slightly lower than the education
estimate without the information proxies. This indicates that including the information proxies does not
diminish education's explanatory power but that the education coefficient is not that large.
Finally, the right columns of Table Five present the follow diet results. Again, I find that the
information proxies are jointly insignificant but I do find that diabetics who visit a doctor increase their
likelihood of following a diet by 5.8 percentage points. Interestingly, diabetics who had at least one diabetic
parent have a two percentage point lower follow diet propensity and are likely to have a higher bmi.14 Similar
to my findings for smoking and bmi, I find that more educated diabetics are more likely to invest in health
inputs. In the specification that includes information proxies, an extra year of schooling increases one's
likelihood of following a diet by .0058 percentage points. In the specification that omits these information
variables, an extra year of schooling increases this diet compliance by .0072 percentage points. Thus, I
conclude that the information proxies only weakly explain differential investment behavior and that they only
slightly reduce the coefficient on education. Although education does increase a diabetic's propensity to follow
a diet the absolute magnitude of the education coefficient is not large.
IV. Conclusion
This paper has focused on quantifying differential diabetic health investment by education levels. The
paper's key finding is that education continues to have a positive impact on diabetic health investment even
after controlling for IQ and available information. I presented evidence that the less educated are achieving
lower levels of compliance. Based on the evidence presented in this paper on smoking, blood sugar control,
14A diabetic who had a diabetic parent might be better informed about the consequencesof not being in control of the condition because they would have observed the complicationssuffered by their parent. Thus, the diabetic parent dummy might be interpreted as an informationproxy. Alternatively, a diabetic parent might indicate a family fixed effect that this family hasunobserved characteristics that make them more at risk to not follow a diet and be heavier.
11

and body mass index, the more educated are achieving tighter control and this will lead to lower complication
rates.
Whether this is socially optimal depends on whether less educated diabetics are informed about the
full cost of their decisions to smoke and to not follow a diet. If increased education does raise one's ability to
process information to control diabetes, then there may be a paternalistic role for the State in aiding less
educated diabetics.15
15 Ironically, recent research has argued that smoking taxes are too high. Viscusi (1994) makesan convincing case that the taxes are too high for the representative agent. If there is health consequenceheterogeneity among smoker then a benevolent planner might want to two part price charging people withpre-existing conditions higher prices.
12

References
Akerlof, George and William Dickens. "The Economic Consequences of Cognitive Dissonance". AmericanEconomic Review (June 1982) page 307-319.
Becker, Gary and Kevin Murphy. "Rational Addiction" Journal of Political Economy. 80(4)August 1992.
Becker, Gary and Michael Grossman and Kevin Murphy. "An Empirical Analysis of Cigarette Addiction."American Economic Review. June 1994 p396-410.
Berger, Mark and J. Paul Leigh. "Schooling, Self-Selection and Health". Journal of Human Resources. 1989.P434-445.
Chase, HP, et. Al. "Cigarette Smoking Increases the Risk of Albuminuria among Subjects with Type 1Diabetes." JAMA 265: 614-617 1991
Coonrod, Beth and Jean Betschart and Maureen Harris. "Frequency and Determinants of Diabetes PatientEducation Among Adults in the U.S. Population". Diabetes Care, Vol 17 #8, (August 1994) pp. 852-865.
Costa, Dora. "Height, Weight, Wartime Stress, and Older Age Mortality: Evidence from the Union ArmyRecords." Explorations in Economic History 30. 1993, pp. 424-449.
Diabetes Control and Complications Trial Coordination Center. Protocol for the Diabetes Control andComplications Trial. NTIS Document PB-88116462, November 1987.
Diabetes Control and Complications Trial Research Group. "The Effect of Intensive Treatment of Diabeteson the Development and Progression of Long-Term Complications in Insulin Dependent Diabetes Mellitus."New England Journal of Medicine. September 30, 1993, p 977-990.
Drury, Thomas. Disability Among Adult Diabetics, published in Diabetes in America. NIH 1985.Drury, Thomas, Kathleen Danchik, and Maureen Harris. Sociodemographic Characteristics of Adult Diabetics.published in Diabetes in America. NIH 1985.
Gay, EC et al. "Smokers with IDDM Experience Excess Morbidity: the Colorado IDDM Registry." DiabetesCare 15 947-952; 1992
Graber. A. et. Al. "Dropout and Relapse During Diabetes Care." Diabetes Care Vol. 15 #11 November 1992page 1477.
Grossman, Michael. "On the Concept of Health Capital and the Demand for Health." Journal of PoliticalEconomy. March 1972. pp. 223-250.
Grossman, Michael. The Demand for Health: A Theoretical and Empirical Investigation. NBER #119. 1972.Columbia University Press.
13

Grossman, Michael and Robert Kaestner. "Effects of Education on Health". In Social Benefits of Education.Edited by Jere Behrman and Nevzar Stacey. University of Michigan Press, 1006.
Kahn, Matthew. "The Cost of Diabetes". Columbia University mimeo 1995.
Kenkel, Don "Health Behavior, Health Knowledge and Schooling" April 1991. Journal of PoliticalEconomy. 99(2) Pages 287-305.
Krueger, Alan. "Computers in the Work Place" Quarterly Journal of Economics. February 1993.
Levy, Frank and Richard Murnane. "U.S. Earnings Levels and Earnings Inequality: A Review of Trendsand Proposed Explanations". Journal of Economic Literature (September 1992) V. 30 pp. 1333-1381.
Sawicki, Peter et. Al. "Smoking is Associated with Progression of Diabetic Nephropathy" Diabetes Care.Vol 17 #2 February 1994.
Stegmayr, BG; "A Study of patients with Diabetes mellitus (type 1) and end stage renal failure: tobaccousage may increase risk of nephropathy and death" Journal of Internal Medicine; 228 121-124 1990.
Thaler, Richard and H. Shefrin. "An Economic Theory of Self Control". Journal of Political Economy.(April 1981) 89. pp. 392-406.
Viscusi, Kip. "Cigarette Taxation and the Social Consequenes of Smoking". NBER Working Paper #4891October 1994.
14

Table One
Summary Statistics
Variable
smoke
age
Male
education
diabeticduration
AFQT
IQ
A1C
obs
1976 NHISNon-Diabeticmean(SD)
.38(.48)
39.8(17.7)
.48(.50)
12(2.8)
0.00
20471
1976DiabeticMean(SD)
.29(.45)
57.2(14.4)
.43(.49)
10.3(3.3)
8.5(8.8)
668
1989 NHISNon-Diabeticmean(SD)
.27(.45)
42.5(16.5)
.47(.50)
12.5(3.0)
0.00
19350
1989DiabeticMean(SD)
.21(.41)
58.7(13.6)
.42(.49)
10.8(3.5)
11.3(10.3)
2158
1992NLSYMean(SD)
.23(.42)
30.9(2.31)
.50(.50)
12.8(2.42)
40.9(28.8)
8570
DCCTDiabeticMean(SD)
.21(.41)
26.8(7.08)
.47(.50)
14.1(2.28)
5.64(4.6)
113.2(10)
8.88(1.59)
1424
15

Table Two
Smoking Propensities for Diabetics and Non-Diabetics
logit specification; dependent variable equals one if person is a smoker
age
education
Male
diabetic duration
IQ
constant
ObservationsPsuedo R2
1976NHISDiabetic
-.033(.007)
.044(.03)
.099(.18)
-.027(.012)
.72(.58)
619.06
1976NHISNon-Diabetic
-.022(.001)
-.078(.006)
.44(.03)
1.19(.09)
19739.03
1989NHISDiabetic
-.031(.004)
-.026(.016)
.29(.11)
-.01(.0057)
.76(.31)
2158.04
1989NHISNon-Diabetic
-.016(.001)
-.122(.006)
.17(.032)
1.16(.09)
19988.03
1992NLSY
.031(.011)
-.21(.013)
.22(.048)
-.002(.001)
1.31(.31)
8570.05
DCCT
.10(.015)
-.18(.054)
-.16(.19)
-.034(.025)
-.019(.01)
1.27(1.20)
709.08
DCCT
.10(.015)
-.21(.051)
-.14(.19)
-.031(.025)
-.45(.76)
709.06
Standard errors in (). For the NLSY sample, IQ is proxied using the AFQT test score. The DCCTsample are all type 1 diabetics.
16

Table Three
Simulated Smoking Probabilites
35 year old maneducation =12
35 year old maneducation =16
35 year old maneducation = 12IQ = 90
35 year old maneducation =12IQ= 110
35 year old maneducation =16IQ = 140
NHIS 1976
Diabetic
54
58
Non-Diabetic
48
40
NHIS 1989
Diab
41
38
Non-Diab
34
24
NLSY1992
Wholesample
39.7
22
40.0
38.3
20.2
DCCT
TypeOneDiabetic
55
34
62.5
53.2
23.9
Note: Since the NLSY does not include an IQ score, the AFQT score is used as a proxy.For the simulation, the 35th percentile is equal to an IQ of 90, and the 65th percentile asan IQ of 110 and 95th percentile as an IQ of 140.
17

Table Four
Blood Sugar Control
Each column reports a OLS regressionwhere the dependent variable is a measureof blood sugar control over a 3 monthinterval
IQ
body mass index(bmi)
duration
age
education
sex
constant
ObservationsPsuedo R2
A1C
Secondsample
.003(.006)
-.018(.02)
-.055(.014)
-.018(.009)
-.10(.032)
.17(.11)
11.2(.83)
709.07
A1C
primarysample
-.01(.006)
.023(.022)
-.013(.0098)
-.09(.03)
.38(.13)
10.5(.90)
715.06
Standard errors in (). The data are from theDCCT sample. Bmi is defined inthe text in footnote #10. Its mean is 23.4and its standard deviation is 2.82.
18

Table Five
Diabetic Investment as a Function of Education and Information
Data Source: 1989 NHIS
doctor
nurse
dietician
hospital
friend
another diabetic
health department
diabetic organization
NDIC
support group
library
newspaper
diabetic education class
male
age
age squared
duration
education
parent diabetic
black
constant
F-test for Informationvariables
Observations
R2
smoke
-.016
-.065**
.004
-.0009
.017
-.011
-.008
-.042
.011
-.018
.021
.003
-.031
.036*
.007-
-.0001**
-.0003
-.0033
-.008
.03
29**
1.18P = .29
2092
.06
smoke
.039*
.007*
-.0001**
-.0006
-.0047-
-.0048
.028
.24*
2092
.05
bmi
-.68-
.06
-.08
.08
.43
.24
1.62*
.32
-1.26-
-.84
-.21
-.68-
.21
-1.53**
.57**
-.005**
-.06**
-.087*
.68**
.96**
16.2**
1.44P=.13
2058
.12
bmi
-1.48**
.57**
-.005**
-.06**
-.098**
.72**
.98**
15.7**
2058
.10
followdiet
.058*
.0099
.034*
.011
-.022
.027
-.024
.021
.03
.016
-.033
-.031
-.005
-.051**
.0026
-.0000
-.0016*
.0059**
-.024-
.022
.70**
1.47P=.121
2030
.02
followdiet
-.053**
.008
.0000
-.0013-
.0072**
-.026-
.017
.80
2030
.01
~ indicates statistical significance at the 10% level, * indicates statistical significance at the 5% level and **indicates statistical significance at the 1% level. All regressions estimated with OLS. Thus, the smoking andfollowing diet models are linear probability models.
19

1995-1996 Discussion Paper Series
Department of EconomicsColumbia University
1022 International Affairs Bldg.420 West 118th Street
New York, N.Y., 10027
The following papers are published in the 1995-96 Columbia University Discussion Paper serieswhich runs from early November to October 31 of the following year (Academic Year).
Domestic orders for discussion papers are available for purchase at the cost of $8.00 (U.S.) Perpaper and $140.00 (US) for the series.
Foreign orders cost $10.00 (US) per paper and $185.00 for the series.
To order discussion papers, please write to the Discussion Paper Coordinator at the above addressalong with a check for the appropriate amount, made payable to Department of Economics,Columbia University. Please be sure to include the series number of the requested paper when youplace an order.

1995-96 Discussion Paper Series
9596-01 Protectionist Response to Import Competition in Declining Industries by: J. ChoiReconsidered
9596-02 New Estimates on Climate Demand: Evidence from Location Choice by: M. Cragg
M.Kahn
9596-03 Enforcement by Hearing
9596-04 Preferential Trading Areas and Multilateralism: Strangers, Friends orFoes?
9596-05 Simplification, Progression and a Level Playing Field
9596-06 The Burden of Proof in Civil Litigation
9596-07 Market Structure and the Timing of Technology Adoption
9596-08 The Emergence of the World Economy
9596-09 The Global Age: From a Skeptical South to a Fearful North
9596-10 A Conformity Test for Cointegration
9596-11 Identification and Kullback Information in the GLSEM
9596-12 Informational Leverage and the Endogenous Timing of ProductIntroductions
9596-13 Changes in Wage Inequality
9596-14 The Design of Monte Carlo Experiments for VAR Models
9596-15 A Toplogical Invariant for Competitive Markets
9596-16 Topology and Invertible Maps
9596-17 Smooth Infinite Economies
by: C. Sanchirico
by: J. Bhagwati
A. Panagariya
by: W. Vickrey
by: C. Sanchirico
by: J. Choi
M. Thum
by: R. Findlay
by: J. Bhagwati
by: P. Dhrymes
by: P. Dhrymes
by: J. Choi
by: J. Mincer
by: P. Dhrymes
by: G. Chichilnisky
by: G. Chichilnisky
by: G. Chichilnisky

1995-96 Discussion Paper Series
9596-18 Measuring Neighborhood Investments: Urban Quality of Life by: D. DipasqualeExpenditures by Race M K a h n
9596-19 The Silver Lining of Industrial Decline: Rust Belt Manufacturing's by: M. KahnImpact on Particulates
9596-20 Education's Role in Explaining Diabetic Health Investment Differentials by: M. Kahn