Educational Opportunity in Indiana: Studies of the Twenty ...mpas/Links/Papers/LuminaReport.pdf ·...
47
Educational Opportunity in Indiana: Studies of the Twenty-first Century Scholars Program Using State Student Unit Record Data Systems 1 Professor Edward P. St. John, Amy S. Fisher, Malisa Lee, Nathan Daun-Barnett, Krystal Williams, University of Michigan July 14, 2008 The report is part of a study of Indiana’s Twenty-first Century Scholars Program funded by the Lumina Foundation for Education. The Indiana Commission on Higher Education, the College Board, and the State Student Assistance Commission of Indiana provided data for this study; this support is gratefully acknowledged. The findings and interpretations in the paper are the authors’ and are not official statements of the sponsoring organizations. 1 This report revise a report, “Education Opportunity: A Study of Indiana’s Twenty-first Century Scholars Program,” previously disseminated on a limited basis by the authors. This revised report corrects and updates analyses of the 1999 students cohort (Section 5) and revises the executive summary and conclusions based on the refined analysis.
Transcript of Educational Opportunity in Indiana: Studies of the Twenty ...mpas/Links/Papers/LuminaReport.pdf ·...

Educational Opportunity in Indiana: Studies of the Twenty-first Century Scholars Program Using State Student Unit Record Data Systems1 Professor Edward P. St. John, Amy S. Fisher, Malisa Lee, Nathan Daun-Barnett, Krystal Williams, University of Michigan
July 14, 2008 The report is part of a study of Indiana’s Twenty-first Century Scholars Program funded by the Lumina Foundation for Education. The Indiana Commission on Higher Education, the College Board, and the State Student Assistance Commission of Indiana provided data for this study; this support is gratefully acknowledged. The findings and interpretations in the paper are the authors’ and are not official statements of the sponsoring organizations.
1 This report revise a report, “Education Opportunity: A Study of Indiana’s Twenty-first Century Scholars Program,” previously disseminated on a limited basis by the authors. This revised report corrects and updates analyses of the 1999 students cohort (Section 5) and revises the executive summary and conclusions based on the refined analysis.

Educational Opportunity in Indiana: A Study of the Twenty-first Century Scholars Program
i
Executive Summary During the past two-decades, Indiana improved in both high school-graduation and
college-enrollment rates compared to other states. The Twenty-first Century Scholars Program, a statewide project that guarantees student aid and provides support services to low-income students, along with state-wide efforts to provide college preparatory courses in all high schools appear to have contributed to these outcomes, but further research was needed given limited prior research on these programs.
The earlier studies of the Twenty-first Century Scholars Program established a significant positive association between completing the scholars pledge and enrollment in two- and four-year colleges. The more recent studies in this report substantially enhance the understanding of the direct and indirect effects of the Twenty-first Century Scholars Program. The studies reported here include:
• Analyses of academic preparation during high school using the 2000 Cohort and
data from College Board surveys of high school courses along with student data from the Indiana Commission on Higher Education student information system (SIS).
• Analyses of student engagement in support services using the 2004 cohort
comprised of data from records of student engagement in support activities provided by the Twenty-first Century Scholars program and regional centers along with data from the state student information system.
• Analyses of student aid applications using the 2005 cohort along with data from
records of student engagement in support activities provided by the Twenty-first Century Scholars program and regional support centers along with information from financial aid applications.
• Analyses of degree attainment after six years of college using the 1999 cohort
comprised of surveys of 9th grade students supplemented with information from the state student information system.
Academic Preparation: Studies of the 2000 Cohort
The linkages between policies—including high school reform policies and financial aid
guarantees—and access to advanced curriculum have not been previously examined using a state-level database. Key findings from the analysis of access to advanced courses among students with financial need in Indiana’s 2000 cohort2 include:
2 Analyses of preparation were limited to students who enrolled in college because: a) the College Board surveys were not completed by all students; and 2) SIS included information on diploma types only for students enrolled in college within the state system.

Educational Opportunity in Indiana: A Study of the Twenty-first Century Scholars Program
ii
• Taking the Scholars Pledge improved the odds that students would complete the advanced preparatory curriculum (Honors diploma). This finding illustrates a consistent pattern that Scholars took advantage of access to advanced high school courses more often than their peers who did not take the pledge.
• Given high school reforms in Indiana, there was improved access to advanced
curriculum in schools that serve a high percentage of minority students. Both students of color and white students enrolled in schools with a high percentage of minority students were more likely to complete Honors diplomas than students enrolled in schools with fewer minority students.
• Taking the Scholars Pledge was particularly beneficial to African Americans for
whom taking the Pledge was positively associated with completing college preparatory curriculum (Core 40 and Honors diplomas) compared to the regular high school diploma.
• Taking the Scholars Pledge also improved access to advanced math courses
(Calculus and Trigonometry/Pre-Calculus) among students who had enrolled in four-year colleges after taking the SAT as high school seniors.3 This finding indicates that the Scholars program improved preparation for STEM majors among students from families with financial need in the Indiana high school class of 2000.
Outreach and Encouragement: Studies of the 2004 Cohort
The analyses of encouragement activities provide substantial evidence of the linkage between engagement and academic preparation, a link in the academic success pipeline that has not been previously studied. Key findings include:
• Four patterns of engagement in support services converged as factors: student
involvement in counseling, parent involvement in academic preparation activities; parent involvement in events and college visits; and parent involvement in college and career planning activities.
• Both student and family engagement along with affiliation with a regional service
center improved the odds of enrollment among Scholars. • Compared to other low-income students, taking the Scholars Pledge had a
significant association with completing an Honors curriculum during high school, which can be explained in part by the positive association between engagement activities and preparation.
3 The outcomes for these analyses, enrollment in advanced math courses, were derived from the College Board surveys on the SAT. Since students enrolling in four-year colleges were more likely to complete the SAT than were students in two-year colleges, we limited these analyses to students who enrolled in four-year colleges.
Educational Opportunity in Indiana: A Study of the Twenty-first Century Scholars Program
iii
• Taking a Scholars Pledge was positively associated with enrollment in four-year colleges compared to enrollment in two-year colleges, an outcome also positively associated with engagement in student support services.
• Students who used support serves provided by regional service centers were more
likely than students who used only the statewide service to complete honors courses, to enroll in college and to enroll in a four-year college.
Application for Student Aid: Studies of the 2005 Cohort
Analysis of the relationship of engagement in outreach by students and parents with application for student aid, the key indicator of completing the Scholars pledge for students in the 2005 cohort, were: 1) parental involvement in events and site visits was positively associated with application for student aid; and 2) involvement in regional centers improved the odds of applying compared to only using the state center. Degree Attainment after Six Years: Studies of the 1999 Cohort
Scholars in the 1999 cohort enrolled in public two- and four-year colleges at higher rates than non-scholars. Compared to their high school peers, Scholars attained four-year degrees at a slightly lower rate than other students, attained two-year degrees at a slightly higher rate, and a substantially higher percentage of Scholars attained some college, but dropped out before receiving a college degree. Overall, a higher percentage of Twenty-first Century Scholars who were in the 9th grade in 1996 eventually attained at least some college than did other students. However, the fact that the departure rate from college for Scholars in the 1999 cohort was higher than for other students is reason for concern. Multiple comparisons were conducted to discern reasons for departure. In analyses of Scholars compared to other students, Scholars had lower odds of attaining degrees than dropping out. However, when students who were eligible for or received Pell grants (i.e., students with similar financial and family backgrounds to Scholars) were the comparison group, Scholars had the same odds of attaining a degree.
Conclusions
Over time, substantial evidence is accumulating showing that the Twenty-first Century Scholars program is improving educational opportunity and college attainment in Indiana. For recent cohorts, there is evidence of improved access to college preparatory curriculum in high school and improved odds of enrollment in four-year colleges, especially research universities. It is expected that future cohorts will also enjoy better odds of degree attainment as a result of the program and the improved access to college preparatory curriculum for Indiana high school students in the early Twenty-first Century.
The Twenty-first Century Scholars Programs represents a model of success that has contributed to improved college enrollment rates in the State of Indiana. Additional investments in programs for college success have been made by the Lumina Foundation for Education and colleges and universities in the state. Future evaluation studies should focus on the impact of these new reforms on retention and degree attainment by low-income students.

Educational Opportunity in Indiana: A Study of the Twenty-first Century Scholars Program
iv
Table of Contents Executive Summary i List of Figures and Tables v 1.0 Educational Opportunity in Indiana 1 2.0 Academic Preparation: Study of the 2000 Cohort 9 2.1 Approach 10 2.2 High School Diploma 11 2.3 Race and Diploma Type 18 2.4 Access to Advanced Math 22 2.5 Summary Findings of Academic Preparation 25 3.0 Outreach and Encouragement: Study of the 2004 Cohort 27 3.1 Approach 27 3.2 Patterns of Engagement 30 3.3 Enrollment in Public Colleges 33 3.4 Comparison of Scholars and Other Pell Recipients 37 3.5 Academic Preparation by College Students 41 3.6 College Choices 45 3.7 Summary Findings on Outreach and Encouragement 49 4.0 Applications for Student Financial Aid: Study of the 2005 Cohort 50 4.1 Databases 50 4.2 Patterns of Engagement 51 4.3 Application to For Student Aid 51 5.0 Follow-Up Study of the 1999 Cohort 55 5.1 Tracking Success of Scholars in the 1999 Cohort Files 55 5.2 Multinomial Logistic Regression Analysis 60 5.2.1 Comparison of Scholars to All Non-Scholars 61 5.2.2 Pell Eligible Students 68 5.2.3 Comparison to Pell Recipients 73 5.3 Attainment after 6 Years 77 5.3.1 PSM Attainment Analysis with All Scholars 79 5.3.2 PSM Comparison for Pell Eligible Students 83 5.3.3 PMS Comparing Pell-Recipient Scholars with Other Pell Recipients 87 5.4 Conclusions 91 6.0 Conclusions 92 Appendix I: State Comparisons 94 Appendix II: Student Engagement Indicators 100 Appendix III: Comparison of Scholar Types for 2 111 References 114
Educational Opportunity in Indiana: A Study of the Twenty-first Century Scholars Program
v
List of Figures and Tables
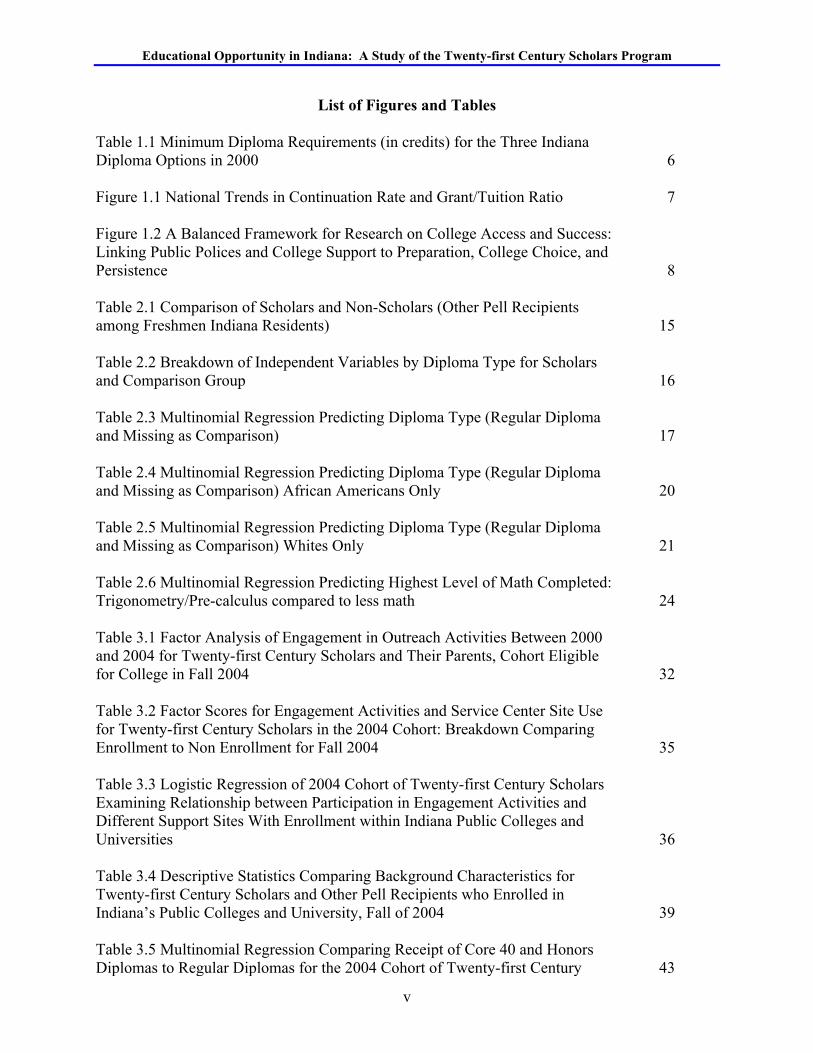
Table 1.1 Minimum Diploma Requirements (in credits) for the Three Indiana Diploma Options in 2000 6 Figure 1.1 National Trends in Continuation Rate and Grant/Tuition Ratio 7 Figure 1.2 A Balanced Framework for Research on College Access and Success: Linking Public Polices and College Support to Preparation, College Choice, and Persistence 8 Table 2.1 Comparison of Scholars and Non-Scholars (Other Pell Recipients among Freshmen Indiana Residents) 15 Table 2.2 Breakdown of Independent Variables by Diploma Type for Scholars and Comparison Group 16 Table 2.3 Multinomial Regression Predicting Diploma Type (Regular Diploma and Missing as Comparison) 17 Table 2.4 Multinomial Regression Predicting Diploma Type (Regular Diploma and Missing as Comparison) African Americans Only 20 Table 2.5 Multinomial Regression Predicting Diploma Type (Regular Diploma and Missing as Comparison) Whites Only 21 Table 2.6 Multinomial Regression Predicting Highest Level of Math Completed: Trigonometry/Pre-calculus compared to less math 24 Table 3.1 Factor Analysis of Engagement in Outreach Activities Between 2000 and 2004 for Twenty-first Century Scholars and Their Parents, Cohort Eligible for College in Fall 2004 32 Table 3.2 Factor Scores for Engagement Activities and Service Center Site Use for Twenty-first Century Scholars in the 2004 Cohort: Breakdown Comparing Enrollment to Non Enrollment for Fall 2004 35 Table 3.3 Logistic Regression of 2004 Cohort of Twenty-first Century Scholars Examining Relationship between Participation in Engagement Activities and Different Support Sites With Enrollment within Indiana Public Colleges and Universities 36 Table 3.4 Descriptive Statistics Comparing Background Characteristics for Twenty-first Century Scholars and Other Pell Recipients who Enrolled in Indiana’s Public Colleges and University, Fall of 2004 39 Table 3.5 Multinomial Regression Comparing Receipt of Core 40 and Honors Diplomas to Regular Diplomas for the 2004 Cohort of Twenty-first Century 43
Educational Opportunity in Indiana: A Study of the Twenty-first Century Scholars Program
vi
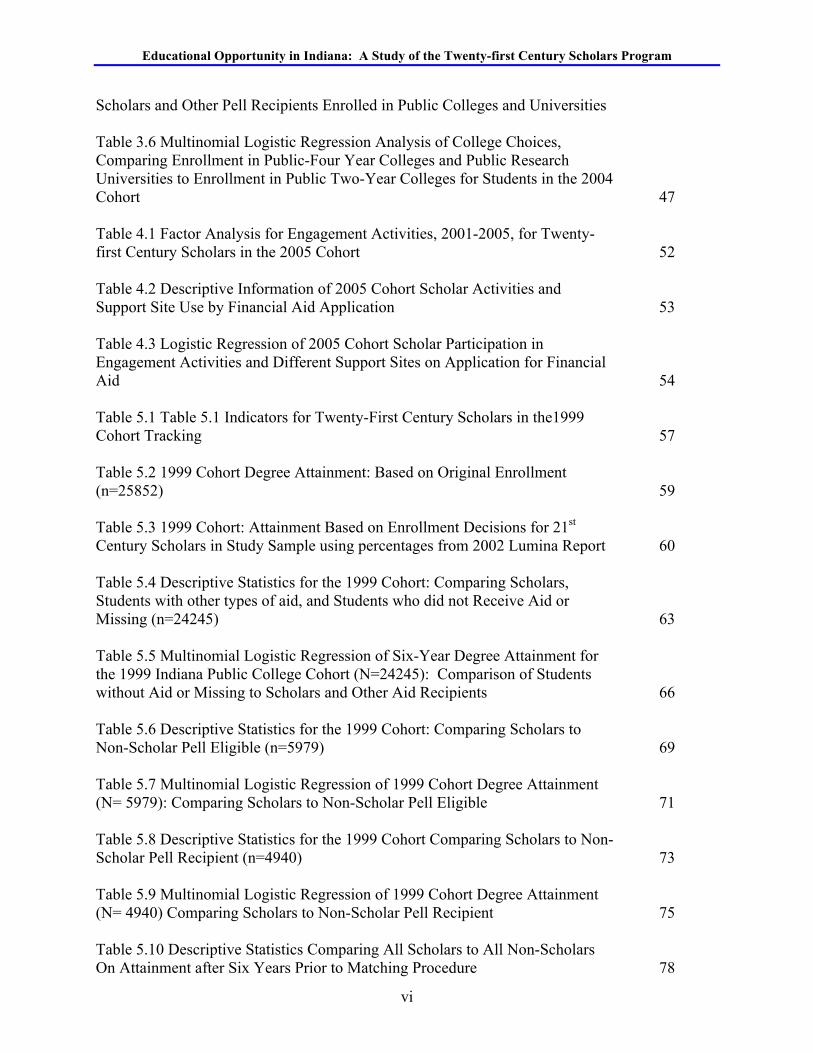
Scholars and Other Pell Recipients Enrolled in Public Colleges and Universities Table 3.6 Multinomial Logistic Regression Analysis of College Choices, Comparing Enrollment in Public-Four Year Colleges and Public Research Universities to Enrollment in Public Two-Year Colleges for Students in the 2004 Cohort 47 Table 4.1 Factor Analysis for Engagement Activities, 2001-2005, for Twenty-first Century Scholars in the 2005 Cohort 52 Table 4.2 Descriptive Information of 2005 Cohort Scholar Activities and Support Site Use by Financial Aid Application 53 Table 4.3 Logistic Regression of 2005 Cohort Scholar Participation in Engagement Activities and Different Support Sites on Application for Financial Aid 54 Table 5.1 Table 5.1 Indicators for Twenty-First Century Scholars in the1999 Cohort Tracking 57 Table 5.2 1999 Cohort Degree Attainment: Based on Original Enrollment (n=25852) 59 Table 5.3 1999 Cohort: Attainment Based on Enrollment Decisions for 21st Century Scholars in Study Sample using percentages from 2002 Lumina Report 60 Table 5.4 Descriptive Statistics for the 1999 Cohort: Comparing Scholars, Students with other types of aid, and Students who did not Receive Aid or Missing (n=24245) 63 Table 5.5 Multinomial Logistic Regression of Six-Year Degree Attainment for the 1999 Indiana Public College Cohort (N=24245): Comparison of Students without Aid or Missing to Scholars and Other Aid Recipients 66 Table 5.6 Descriptive Statistics for the 1999 Cohort: Comparing Scholars to Non-Scholar Pell Eligible (n=5979) 69 Table 5.7 Multinomial Logistic Regression of 1999 Cohort Degree Attainment (N= 5979): Comparing Scholars to Non-Scholar Pell Eligible 71 Table 5.8 Descriptive Statistics for the 1999 Cohort Comparing Scholars to Non-Scholar Pell Recipient (n=4940) 73 Table 5.9 Multinomial Logistic Regression of 1999 Cohort Degree Attainment (N= 4940) Comparing Scholars to Non-Scholar Pell Recipient 75 Table 5.10 Descriptive Statistics Comparing All Scholars to All Non-Scholars On Attainment after Six Years Prior to Matching Procedure 78

Educational Opportunity in Indiana: A Study of the Twenty-first Century Scholars Program
vii
Table 5.11 Descriptive Statistics Comparing All Matched Scholars to All Matched Non-Scholars, in Percentages 80 Table 5.12 Multinomial Logistic Regression of Attainment Comparing All Scholars to All Non-Scholars Using Propensity Score Matching (n=2510) 81 Table 5.13 Multinomial Logistic Regression of Attainment Comparing All Scholars to All Non-Scholars Using Propensity Score Matching, Including Observable Control Variables (n=2510) 82 Table 5.14 Comparing Pell Eligible Scholars to Pell Eligible Non-Scholars On Attainment after Six Years Prior to Matching Procedure 84 Table 5.15 Descriptive Statistics Comparing Matched Pell Eligible Scholars to Matched Pell Eligible Non-Scholars, in Percentages 85 Table 5.16 Multinomial Logistic Regression of Attainment Comparing Pell Eligible Scholars to Pell Eligible Non-Scholars Using Propensity Score Matching (n=1794) 86 Table 5.17 Multinomial Logistic Regression of Attainment Comparing Pell Eligible Scholars to Pell Eligible Non-Scholars Using Propensity Score Matching, Including Observable Control Variables (n=1794) 86 Table 5.18 Comparing Pell Recipient Scholars to Pell Recipient Non-Scholars On Attainment after Six Years Prior to Matching Procedure 87 Table 5.19 Descriptive Statistics Comparing Matched Pell Recipient Scholars to Matched Pell Recipient Non-Scholars, in Percentages 88 Table 5.20 Multinomial Logistic Regression of Attainment Comparing Pell Recipient Scholars to Pell Recipient Non-Scholars Using Propensity Score Matching (n=1446) 89 Table 5.21 Multinomial Logistic Regression of Attainment Comparing Pell Recipient Scholars to Pell Recipient Non-Scholars Using Propensity Score Matching, Including Observable Control Variables (n=1446) 90

Educational Opportunity in Indiana: A Study of the Twenty-first Century Scholars Program
viii
Appendix Table AI.1 Trends in College Continuation Rates by State 95 Table AI.2 Trends in Public HS Graduation Rates by State 97 Figure AI.1 Need Based Aid as a Percent of Tuition: Comparison of States (2004 Fiscal Year) 99 Table AII.1 2004 Cohort Basic Descriptive Statistics of Scholar Activities (Regardless of Whether Scholar Enrolled in College) 101 Table AII.2 2004 Cohort Basic Descriptive Statistics of Scholar Activities: Enrolled in College vs. Not Enrolled in College 103 Table AII.3 2005 Cohort Basic Descriptives of Scholar Activities (Regardless of Whether Scholar Enrolled in College) 105 Table AII.4 2005 Cohort Basic Descriptives of Scholar Activities: Applied for Aid vs. Not Apply for Aid 108 Table AIII.1Analysis of Grant Aid Depending on Scholar Indicator (from SIS or from Scholar Track data): 2004 Cohort 112

Educational Opportunity in Indiana: A Study of the Twenty-first Century Scholars Program
1
1.0 Educational Opportunity in Indiana
Improving educational attainment among citizens in the state has been a policy priority in
Indiana for three decades. As part of the effort to adjust to a changing economy in the Great
Lakes region, state policy has emphasized improvements in high school curriculum, student
encouragement, and student financial aid as means for creating a nationally competitive
workforce. Trends illustrate there has been substantial success.
The most notable improvement has been in college enrollment rates for high school
graduates. Indiana ranked 8th in 2004 (Table A.1),4 with 62% of high school graduates enrolling
compared to a national rate of 55.5%. This represents a substantial improvement compared to
1986 when only 33% of Indiana’s high school graduates enrolled in college compared to 35.7%
nationally, which ranked Indiana in the bottom quintile of states.
One aspect of the increase in college-going rates has been an improvement in high school
curriculum. During the past three decades, the state has improved access to advanced courses
while maintaining a competitive position in high school graduation rates (Table A.2). Indiana
had a graduation rate of 76.2% for public high schools in 1986, a rate slightly higher than the
national average of 73.4%. By 2004, Indiana’s graduation rate of 62% compared to a national
average of 55.5%. In spite of the decline in graduation rates in Indiana and the country overall
during this period, the positive differential in graduation rates in Indiana compared to the nation
improved from 2.8 percentage points in 1986 to 6.5 percentage points in 2004.
The state of Indiana requires all high schools to offer the Core 40 diploma (a college
preparatory curriculum) and strongly encourages them to offer the additional advanced courses
for completion of an Honors diploma. The state provides additional funding to schools per
4 Tables and figures whose labels start with an “A” are in the Appendix sections at the end of the report; other tables and figures appear at the end of each chapter or chapter section.
Educational Opportunity in Indiana: A Study of the Twenty-first Century Scholars Program
2
student completing a Core 40 or Honors diploma as an incentive for providing these
opportunities to more students (Theobald, 2003). While Indiana has had college preparatory and
Honors diploma options for some time, lower percentages of Indiana SAT takers had taken
advanced courses, so it was important to provide incentives for schools to offer and encourage
participation in advanced courses. The actual course requirements for the three diploma types—
regular, Core 40, and Honors—are detailed in Table 1.1, along with the alignment of courses
with college admissions.
Another aspect of the pattern of improved access in Indiana has been that outreach,
encouragement, and support services available through the Indiana Career and Postsecondary
Assistance Center (ICPAC) (Hossler & Schmit, 1995) have led a sustained statewide effort to
provide information on education and career options to students in middle and high school. This
process of outreach has doubtless contributed to the maintenance of relatively high completion
rates in Indiana high schools as compared to the national average, given an environment of
stiffening requirements for graduation.
Still another component of the Indiana story has been the sustained commitment to need-
based student financial aid. In a period when many states—Georgia, Louisiana, Michigan,
Florida and New Mexico—have shifted to merit aid as a priority, Indiana has risen among states
in its investments in student aid. In 2004, Indiana ranked 3rd behind New York and California on
investments in state grants as measured by the ratio of state spending per full time student on
need-based grants to the weighted average tuition charge in the state (Figure A.1). State funding
of need-based student financial aid has a strong positive association with college enrollment rates
in time series studies of states (St. John, 2006; St. John, Chung, Musoba, Simmons, Wooden, &

Educational Opportunity in Indiana: A Study of the Twenty-first Century Scholars Program
3
Mendez, 2004). In fact, national trends in enrollment rates for high school graduates appear to
rise and fall in a pattern consistent with this indicator of state investment in grants (Figure 1.1).
Indiana’s Twenty-first Century Scholars Program has also contributed to the
improvement in college enrollment rates in Indiana. Students who qualify for the federal Free
and Reduced Lunch program in the 8th grade are eligible to sign up for this program, pledging to
take the steps to prepare for college, remain drug and crime free, and apply for college and
student financial aid. In return, the state of Indiana guarantees Scholars they will receive grants
equaling tuition charges in a public college or university. This grant award, modestly higher than
what a high-need student would receive otherwise, provides a guarantee for financial support that
eases family concerns about college costs at an early stage in the student’s academic career.
To build a research-based understanding of the ways the Twenty-first Century Scholars
Program contributes to expanded educational opportunity in the state, it is important to consider
the role of state policy in easing concerns about college costs, enabling preparation, expanding
college choice, and enabling degree attainment. The balanced access model (Figure 1.2) provides
a framework to guide research examining the impact of these policies. According to this model,
there are eight different ways policy can influence educational opportunity; prior research has
confirmed some of these linkages.
• Easing family concerns about costs: If low-income parents no longer fear that
college costs will be prohibitive, they are more likely to encourage their children
to take the steps to prepare for college (Linkage 1, Figure 1.2). The pledge
process in the Twenty-first Century Scholars Program provides a mechanism for
formalizing this link by committing grant funding as a response to the student’s
pledge.

Educational Opportunity in Indiana: A Study of the Twenty-first Century Scholars Program
4
• High School policies that provide opportunities for preparation: The state of
Indiana requires all high schools to offer college preparatory curriculum (Core 40)
and honors diplomas, and provides extra funds to high schools graduating
students with these advanced diplomas. These policies have the potential to
improve opportunities for low-income students to complete preparatory courses
(Linkage 2).
• Encouragement and outreach to improve preparation and college application
rates: Indiana provides information as support for all students and their parents
and coordinates regional centers to encourage students to prepare and apply
(Linkage 3).
• State grants coordinated with tuition to make pricing more transparent and
improve access: Since Twenty-first Century Scholars are guaranteed grants
equaling public college tuition, they are provided aid packages that are more
likely to meet financial need and increase enrollment opportunity (Linkage 4), a
link confirmed by prior research (St. John, E. P., Musoba, Simmons, & Chung,
2002).
• State grants to improve the chances of enrolling in college: Prior research
confirms that Scholars awards improve the odds that low-income students will
enroll in both two-year and four-year colleges compared to non-enrollment
(Linkages 5 and 7) (St. John, E. P., Musoba, Simmons, & Chung, 2002; St. John,
Musoba, Simmons, Chung, Schmit, & Peng, 2004).
• State grants, college academic programs and student services to improve
attainment: Once admitted to college, Twenty-first Century Scholars benefit from

Educational Opportunity in Indiana: A Study of the Twenty-first Century Scholars Program
5
academic support and student aid like other students, and research indicates
Scholars have the same odds of persisting through the first four years of college as
non-Scholars (St. John, Gross, Musoba, & Chung, 2006) despite their low-income
status.
While the contributions of the Twenty-first Century Scholars Program to improvements
in college access, including the opportunity to enroll in four-year colleges, for low-income
students in Indiana are well documented, many questions remain about the preparation process
and patterns of college success. This report presents a new set of research studies that examine
some of these remaining questions. Databases were developed and analyzed to examine:
• The roles of the Scholars Program and other state educational policies in
improving academic preparation during high school (focus on linkages 1 and 3);
• The role of support services in college preparation (focus on linkage 2);
• Long-term patterns of academic success in college (focus on linkages 6 and 8).

Educational Opportunity in Indiana: A Study of the Twenty-first Century Scholars Program
6
Table 1.1 Minimum Diploma Requirements (in credits) for the Three Indiana Diploma Options in 2000 Subject Area General Diploma College Prep.
Dip.(Core 40) Honors Diploma
English/ Language Arts
8 credits 8: Literature, Composition and Speech
8: Literature, Composition and Speech
Mathematics 4: Algebra I or Integrated Math I
6: Algebra I and II and Geometry
8: Algebra I and II, Geometry, and more advanced (e.g. Calculus, Trig., or AP Statistics)
Social Studies 4: US History, US Government, and other
6: US History, US Government, World History or Geography, Economics, and other
6: US History, US Government, and credits in World History, Geography, or Economics
Science 4: More than one area of science represented
6: Laboratory in Biology I, Chemistry I, Physics I or more advanced
6: Laboratory in Biology I, Chemistry I, Physics I or more advanced
Foreign Language
Can be part of the 8 “other areas”
6 -8 credits, must include 6 in one language or 4 each in two languages
Fine Arts Can be part of the 8 “other areas”
2 credits Visual or Performing Arts
Other areas 2: Above subjects or technology competency
8: Either more courses in above subjects or computers or career/technical
PE and Health & Safety
1: In each 1: In each 1: In each
Electives 16 2-4 9 Total Credit Hours
40 40 47
College Access Eligible for regular admission at 2-year campuses, below requirements public 4-year campuses
Eligible for regular admission at a 4-year public campuses, recommended for 2-year campuses
Eligible for regular admission at a 4-year or 2-year public campus
Source: St. John & Musoba (in review).

Educational Opportunity in Indiana: A Study of the Twenty-first Century Scholars Program
7
Figure 1.1 National Trends in Continuation Rate and Grant/Tuition Ratio

Educational Opportunity in Indiana: A Study of the Twenty-first Century Scholars Program
8
Figure 1.2 A Balanced Framework for Research on College Access and Success: Linking Public Polices and College Support to Preparation, College Choice, and Persistence
K-12 POLICIES SOCIAL & EDUCATIONAL POSTSECONDARY FACTORS FINANCE & ENCOURAGEMENT
Aid Guarantees: Ease Family
Finance Concerns 1
3
3
Student Expectations &
Plans
High School Policy • Funding • Curriculum • Standards • Testing
Academic Preparation
Enrollment; 2-Yr or/4-Yr. & Transfer
College Outreach
Student Services Academic Programs
Taking Examination
Application & Admission
Persistence to Degree 8
77
764
Pricing: Set Tuition &
Package Financial Aid
State Coordination of
Tuition & Grant $
Family Income & Education
Source: Adapted Balanced Access Model from St. John, 2003
K-1
2 E
ncou
rage
men
t &
Col
lege
Out
reac
h
Direct link
3
4
2
54
3
64
Educational Opportunity in Indiana: A Study of the Twenty-first Century Scholars Program
9
2.0 Academic Preparation:
Studies of the 2000 Cohort
The ways education programs influence academic preparation (e.g., the role of state
reform policies) have seldom been examined. The 2000 cohort of Indiana high school graduates
dataset combines the students’ questionnaires from the College Board, completed as part of the
SAT, with records from the state student information system. Using this database it was possible
to examine how both taking the Scholars’ pledge (i.e., easing family concerns about college
costs) and school characteristics (i.e., indicators for implementation of education reform policies)
influenced academic preparation, controlling for family background. We considered two
indicators of preparation:
• Completion of an honors diploma or a core 40 diploma compared to a regular
diploma; and
• Completion of calculus or trigonometry/pre-calculus compared to completion of
lower math standards.
The first of these analyses focus specifically on the diploma type and relate directly to the
policy intent of increasing the percentage of students with preparatory curriculum. These
analyses compare 21st Century Scholars enrolled in college with a similar group of Pell recipients
(a federal need-based aid program) from the 2000 cohort. The second set of analyses uses only
students in the two groups (Scholars and comparison students) who completed the SAT, the
group for which we had specific course information.5 The two sets of analyses are presented
after discussing the research approach.
5 Students reported whether they had completed or were taking specific courses as part of their response on the College Board questionnaire taken with the SAT.

Educational Opportunity in Indiana: A Study of the Twenty-first Century Scholars Program
10
2.1 Approach
The analyses consider the relationship between participating in the Twenty-first Century
Scholars program and the type of diploma earned. This sample (n=5397) is restricted to the
following population: (1) ages 17-19, (2) high school graduates, (3) either Twenty-first Century
Scholar (treatment group) or other Pell eligible students (control group), and (4) Indiana state
residents. The analysis is based on a parsimonious multinomial logistic regression where
controls are included for student background (gender and race), parent characteristics (income
and education), and school characteristics (locale, percent minority and percent free and reduced
lunch). This analysis looks specifically at the traditional high school graduate who goes
immediately to college.
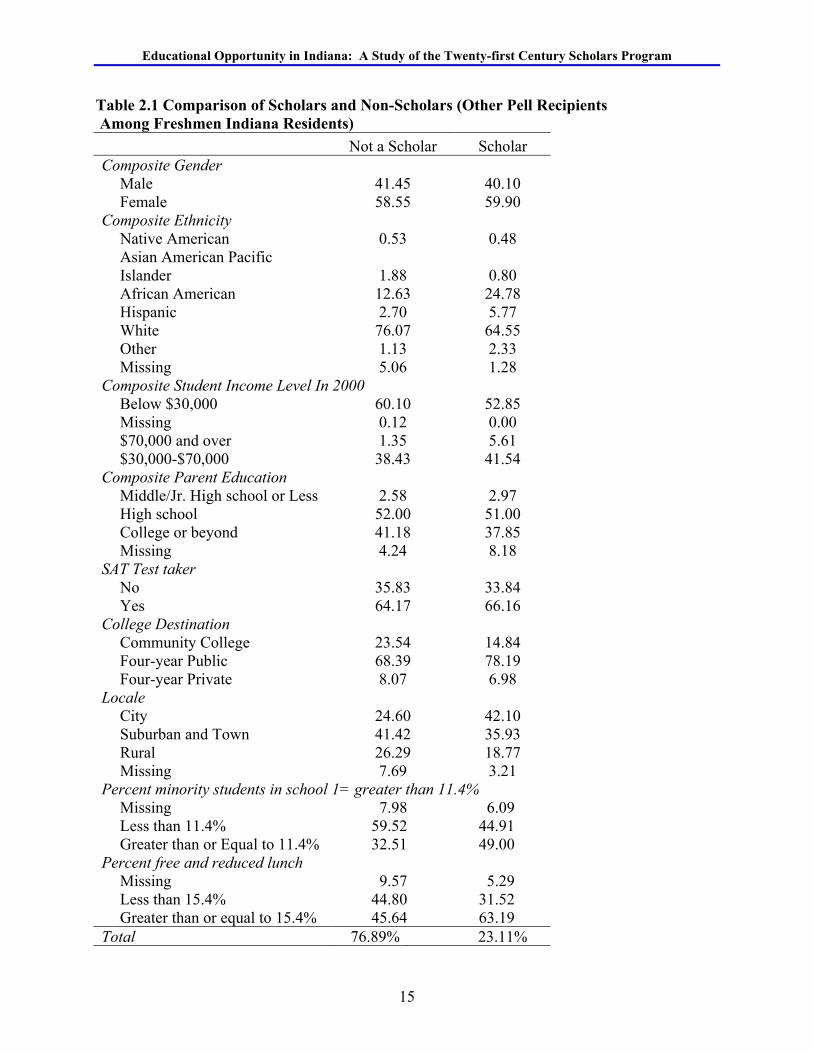
Pell recipients who enrolled in college provided a group of Indiana residents with
comparable socioeconomic status (SES) to the Twenty-first Century Scholars who also enrolled
(Table 2.1). A slightly lower percentage of scholars were from families with incomes below
$30,000 (53% of Scholars compared to 60% of other Pell recipients). However, a slightly lower
percentage of the Scholars had parents with college degrees (38% of Scholars compared to 41%
of other Pell recipients).
The two groups differed slightly with respect to their schools and steps in the preparation
process. Higher percentages of Scholars were from high schools with high minority enrollment
and high poverty rates. Not only did the comparison group go to higher SES schools, but a
higher percentage of students in this group actually took the SAT, an indicator of preparation
illustrated in Table 2.2. Research clearly indicates that completing advanced courses in high
school is associated with higher SAT scores in Indiana as it is nationally (St. John & Musoba, in
review). These statistics of school context and test taking illustrate that the Scholars program was
successful at recruiting students from high risk, high poverty schools with high percentages of
Educational Opportunity in Indiana: A Study of the Twenty-first Century Scholars Program
11
minority students. In addition, a higher percentage of the Scholars were from urban schools,
while a higher percentage of other Pell recipients were from suburbs and towns. All of these
factors would suggest that Scholars faced more numerous barriers to strong academic
preparation.
The breakdown of the sample population by diploma type (Table 2.2) indicates that 25%
received Honors diplomas, 41% received Core 40 diplomas, and 33% received regular diplomas.
There was substantial variation in diploma type by race: nearly half of the Asian American
students received Honors diplomas while more than 40% of African American and Native
American students received regular diplomas. There were also variations in diploma type based
on student background and other factors (e.g., locale), but the differences were not as great as for
race. Given these findings, we completed supplemental analyses of diploma type to explore
whether there were differences in the effects of the program across racial groups.
A higher percentage of Scholars than other Pell recipients actually enrolled in public
four-year colleges. Prior research indicates that this difference could be due to additional
financial aid—and the aid guarantee—rather than to preparation (St. John, Musoba, Simmons,
Chung, Schmit, & Chung, 2002), which leads to a central question for this study: Do students in
schools that serve minority and low-income students have equal access to advanced preparation?
This issue is one of the intermediate outcomes overlooked in prior research.
2.2 High School Diploma Type
Multinomial logistic regression analyses were conducted to examine the relationship
between being a scholar and the type of diploma received (Table 2.3). The analyses were limited
to students who enrolled in four-year colleges because the preparatory diploma type is not
required for community college enrollment. The coding of variables included:
Educational Opportunity in Indiana: A Study of the Twenty-first Century Scholars Program
12
• Twenty-first Century Scholars were compared to non-Scholar, Pell eligible
students,
• Males compared to females,
• African American, Hispanic, Asian American, Native American, other and non-
reported compared to whites,
• Students with high family income (above $70,000), low income (below $30,000),
and missing income were compared to middle income (between $30,000 and
$70,000) students,
• Students with parents who had attended college, had less than a high school
education, or had missing information on parent’s education were compared to
students whose parents had graduated from high school,
• High schools in cities and rural areas and those with missing information on high
school locale were compared to high schools in towns and suburbs,
• Schools with high minority (above 11.4%) enrollment were compared to schools
with fewer minority students,
• Schools with high poverty rates (15.4% of students qualify for free or reduced
lunch) were compared to high schools with less poverty.
In this analysis, earning an Honors or a Core 40 diploma was compared to earning a
regular diploma. The independent variables were entered in four steps to provide a means of
examining how adding variables changed the statistical relationships. Scholars were compared to
non-scholars in Model 1, gender and race/ethnicity were added in Model 2, SES variables were
added in Model 3, and school characteristics in Model 4.
The analyses indicated a positive association between being a scholar and receiving an
Honors diploma, compared to a regular diploma, in the final two analyses, Models 3 and 4, after

Educational Opportunity in Indiana: A Study of the Twenty-first Century Scholars Program
13
family SES was considered. However, being a Scholar had a significant and negative
relationship with receiving a Core 40 diploma only in Model 2, when student characteristics
were considered without SES. When school characteristics were controlled (Model 4), the
scholars pledge was not significantly associated with the receipt of a Core 40 diploma, but was
significantly associated with receipt of an Honors diploma compared to a regular diploma.
Both gender and race/ethnicity had significant relationships with access to advanced
curriculum as approximated by the level of diploma received. Males were consistently less likely
than females to receive either an Honors or Core 40 diploma relative to a regular diploma. In
addition, Latino/a and African American students were less likely than whites to receive an
Honors diploma; African American students were also less likely than white students to receive a
Core 40 diploma. Asian American students were more likely than white students to receive an
Honors diploma than a regular diploma, but did not differ significantly with respect to the Core
40 diploma. These findings illustrate that race continues to be an important indicator of access to
advanced curricula among Indiana residents.
Socioeconomic status (SES) was also significantly associated with diploma type.
Students from high- and low-income families were consistently less likely than students from
middle-income families6 to have attained either type of advanced diploma. In addition, having a
parent with a college education improved the odds of receiving either a college preparatory (Core
40) or Honors diploma in high school compared to the regular diploma. Parents’ education had a
linear relationship indicating that as parental education increases, so does the type of diploma
students receive. Income, on the other hand, revealed a curvilinear relationship to access to
advanced curriculum, meaning that both low income and high income students were more likely
to complete an advanced diploma relative to the middle income group. 6 This finding indicates a curvilinear relationship, given the positive association of being from a middle-income family. It clearly illustrates a non-linear logit. Design set variable coding avoids the linear assumption (Hosmer & Lemeshow, 2000) typically made when income is analyzed.
Educational Opportunity in Indiana: A Study of the Twenty-first Century Scholars Program
14
Being in schools with higher concentrations of minority students improved the odds that
low-income students would receive an Honors or Core 40 diploma compared to a regular
diploma. This finding strongly implies that having educational policies that require high schools
to offer advanced programs and providing monetary rewards to schools for students completing
these degrees improved access.
Educational Opportunity in Indiana: A Study of the Twenty-first Century Scholars Program
15
Table 2.1 Comparison of Scholars and Non-Scholars (Other Pell Recipients Among Freshmen Indiana Residents) Not a Scholar Scholar Composite Gender Male 41.45 40.10 Female 58.55 59.90 Composite Ethnicity Native American 0.53 0.48
Asian American Pacific Islander 1.88 0.80
African American 12.63 24.78 Hispanic 2.70 5.77 White 76.07 64.55 Other 1.13 2.33 Missing 5.06 1.28 Composite Student Income Level In 2000 Below $30,000 60.10 52.85 Missing 0.12 0.00 $70,000 and over 1.35 5.61 $30,000-$70,000 38.43 41.54 Composite Parent Education Middle/Jr. High school or Less 2.58 2.97 High school 52.00 51.00 College or beyond 41.18 37.85 Missing 4.24 8.18 SAT Test taker No 35.83 33.84 Yes 64.17 66.16 College Destination Community College 23.54 14.84 Four-year Public 68.39 78.19 Four-year Private 8.07 6.98 Locale City 24.60 42.10 Suburban and Town 41.42 35.93 Rural 26.29 18.77 Missing 7.69 3.21 Percent minority students in school 1= greater than 11.4% Missing 7.98 6.09 Less than 11.4% 59.52 44.91 Greater than or Equal to 11.4% 32.51 49.00 Percent free and reduced lunch Missing 9.57 5.29 Less than 15.4% 44.80 31.52 Greater than or equal to 15.4% 45.64 63.19 Total 76.89% 23.11%

Educational Opportunity in Indiana: A Study of the Twenty-first Century Scholars Program
16
Table 2.2 Breakdown of Independent Variables by Diploma Type for Scholars and Comparison Group
Honors Core 40 Regular N Row % Row % Row %
Composite Gender Male 2220 21.13 41.22 37.66 Female 3177 28.49 41.14 30.37 Composite Ethnicity Native American 28 10.71 46.43 42.86 Asian American Pacific Islander 88 47.73 34.09 18.18 African American 833 12.85 44.90 42.26 Hispanic 184 16.30 52.72 30.98 White 3962 29.48 41.65 28.87 Other 76 30.26 39.47 30.26 Missing 226 0.44 12.39 87.17 Composite Student Income Level In 2000 Below $30,000 3153 21.38 40.79 37.84 Missing 5 20.00 80.00 $70,000 and over 126 27.78 33.33 38.89 $30,000-$70,000 2113 31.42 42.31 26.27 Composite Parent Education Level Middle/Jr High school or Less 144 20.14 36.11 43.75 High school 2794 25.02 42.30 32.68 College or beyond 2181 28.43 41.91 29.67 Missing 278 9.35 26.62 64.03 21st Century Scholar Not a Scholar 4150 25.61 40.75 33.64 Scholar 1247 24.94 42.58 32.48 SAT Test taker Yes 3488 33.34 46.27 20.38 No 1909 7.36 36.20 56.44 College Destination Community College 1162 3.79 26.59 69.62 Four-year Public 3813 31.08 46.60 22.32 Four-year Private 422 34.36 32.23 33.41 Locale City 1546 22.06 44.76 33.18 Suburban and Town 2167 28.43 42.87 28.70 Rural 1325 29.74 41.06 29.21 Missing 359 6.41 15.88 77.72 Percent minority students in school 1= greater than 11.4% Missing 407 6.14 20.09 68.68 Less than 11.4% 3030 30.10 45.20 24.70 Greater than or Equal to 11.4% 1960 24.01 41.46 34.53 Percent free and reduced lunch Missing 463 11.23 20.09 68.68 Less than 15.4% 2252 30.10 45.20 24.70 Greater than or equal to 15.4% 2682 24.01 41.46 34.53 Total 5397 25.46 41.17 33.37

Educational Opportunity in Indiana: A Study of the Twenty-first Century Scholars Program
17
Table 2.3 Odds Ratios from a Multinomial Regression Predicting Diploma Type (Regular Diploma and Missing as Comparison) Part A Honors Model 1 Model 2 Model 3 Model 4 Scholars Pledge 1.000 1.100 1.360 *** 1.370 *** Background Characteristics Male 0.577 *** 0.554 *** 0.547 *** Native American and Other 0.756 0.645 0.659 Asian 2.490 *** 2.740 *** 2.790 *** Black 0.290 *** 0.297 *** 0.321 *** Hispanic/Latino 0.550 *** 0.599 * 0.611 * No race reported 0.005 *** 0.008 *** 0.008 *** Parent Characteristics Below $30,000 0.549 *** 0.55 *** Above $70,000 0.535 ** 0.535 * Income missing 0.532 0.539 Parents ed. Less than high school 0.771 0.756 Parents college education or above 1.300 *** 1.310 *** Parents education missing 0.263 *** 0.262 *** School Characteristics High school located in city 0.974 High school located in rural area 0.940 High school location missing 0.435 * Greater than 11.4% Minority 1.013 *** Greater than 15.4% Poverty 1.000 Part B Core 40 Model 1 Model 2 Model 3 Model 4 Scholars Pledge 1.080 0.866 * 1.010 1.030 Background Characteristics Male 0.801 *** 0.779 *** 0.767 *** Native American and Other 0.913 0.764 0.782 Asian 1.270 1.300 1.300 Black 0.787 *** 0.72 *** 0.769 ** Hispanic/Latino 1.340 ~ 1.370 ~ 1.410 No race reported 0.103 *** 0.150 *** 0.153 *** Parent Characteristics Below $30,000 0.712 *** 0.714 *** Above $70,000 0.554 ** 0.554 * Income missing 0.320 0.323 Parents ed, less than high school 0.750 0.726 * Parents college education or above 1.100 1.110 Parents education missing 0.385 *** 0.382 *** School Characteristics High school located in city 1.130 High school located in rural area 0.897 High school location missing 0.784 Greater than 11.4% Minority 1.013 *** Greater than 15.4% Poverty 1.004 * N 5563 5563 5563 5563 LR (Chi2) 4.0300 529.280 *** 886.940 *** 936.65 *** Psuedo-R2 0.0003 0.044 0.076 0.08 ~ p<0.10, * p<0.05, **p<0.01, ***p<0.001

Educational Opportunity in Indiana: A Study of the Twenty-first Century Scholars Program
18
2.3 Race and Diploma Types
Since the descriptive and regression analyses indicate that both race and school
characteristics play substantial roles in access to advanced curriculum, it is important to examine
the difference in access to advanced diplomas separately for whites and African Americans, the
two groups for which there was sufficient data for this type of breakdown. The analyses use
models identical to the ones discussed above except that race/ethnicity variables were excluded
because only one racial group was considered in each analysis.
In the analyses of African Americans (Table 2.4), being a Scholar had a significant and
positive association with completing an Honors diploma in Models 1, 2 and 4. This illustrates
that the Scholars Programs enabled students to overcome barriers by easing concerns about costs
and/or through encouragement. The scholars program was not significantly associated with a
Core 40 diploma for African Americans.
SES did not have as strong a relationship with diploma type for African Americans as it
did for the sample population as a whole. Low-income students were less likely than middle-
income students to receive either type of advanced diploma, but parents’ education was not
significant.
Finally, school characteristics had a significant relationship with access to advanced
courses for African Americans as they did for the entire population. Being enrolled in a school
with a high percentage of minority students increased the odds of receiving an Honors diploma
or a Core 40 diploma, compared to a regular diploma, for African Americans.
There were some differences in the analysis of whites (Table 2.5) compared to both the
entire population (Table 2.3) and African Americans (Table 2.4). First, being a Twenty-first
Century Scholar was not significantly associated with receipt of an advanced diploma for whites,
a finding that differs from the prior two analyses. Second, parents’ education was positively

Educational Opportunity in Indiana: A Study of the Twenty-first Century Scholars Program
19
associated with completion of an Honors diploma, compared to a regular diploma, for whites but
not for African Americans.
There were also some notable similarities. Low-income white students were less likely to
gain access to advanced diplomas than their middle-income counterparts, a finding consistent
with the analyses for African Americans. In addition, attending a school with a high percentage
of minorities was positively associated with completion of Honors or Core 40 diplomas for
whites as it was for African Americans and the population as a whole.
The finding that enrollment in schools with high percentages of minorities is beneficial
with respect to access to advanced courses is particularly noteworthy. It illustrates that the
benefits of the academic reforms have enabled both students of color and majority students to
improve access to advanced curriculum. In Indiana, the process of reforming high school
curriculum appears to have had an impact on access to advanced curricula for all students in
schools with high percentages of low-income and minority students.

Educational Opportunity in Indiana: A Study of the Twenty-first Century Scholars Program
20
Table 2.4 Odds Ratios from Multinomial Regression Predicting Diploma Type (Regular Diploma and Missing as Comparison) African Americans Only Part A Honors Model
1 Model 2 Model
3 Model
4
21st Century Scholar 1.920 ** 1.880 ** 1.740 1.850 ** Background Characteristics Male 0.578 * 0.58 * 0.566 * Parent Characteristics Below $30,000 0.569 * 0.574 * Above $70,000 0.775 0.739 ~ Parents ed. less than high school 0.559 0.579 Parents college education or
above 1.08 1.01
School Characteristics High school located in city 1.25 High school located in rural area 0.763 Greater than 11.4% Minority 1.015 *** Greater than 15.4% Poverty 0.995 Part B Core 40 Model
1 Model
2 Model
3
Scholars Pledge 1.270 * 1.260 1.230 1.280 Background Characteristics Male 0.805 0.784 0.772 Parent Characteristics Below $30,000 0.637 * 0.63 * Above $70,000 0.338 ~ 0.317 ~ Parents ed. less than high school 0.967 0.93 Parents college education or
above 1.08 1.12 ~
School Characteristics 0.42 High school located in city 0.944 High school located in rural area 0.722 Greater than 11.4% Minority 1.009 *** Greater than 15.4% Poverty 1.005 N 833 833 833 LR (Chi2) 8.78 14.47 *** 79.22 *** Psuedo-R2 0.0005 0.01 0.482 ~ p<0.10, * p<0.05, **p<0.01, ***p<0.001

Educational Opportunity in Indiana: A Study of the Twenty-first Century Scholars Program
21
Table 2.5 Odds Ratios from Multinomial Regression Predicting Diploma Type (Regular Diploma and Missing as Comparison) Whites Only Part A Honors Model
1 Model 2 Model
3 Model
4
Scholars Pledge 1.120 1.130 1.140 1.130 Background Characteristics Male 0.571 *** 0.550 *** 0.542 *** Parent Characteristics Below $30,000 0.555 *** 0.554 *** Above $70,000 0.663 0.679 Parents ed. less than high
school 0.689 0.697
Parents college education or above
1.270 ** 1.280 ***
School Characteristics High school located in city 1.050 ~ High school located in rural
area 0.963
Greater than 11.4% Minority 1.020 *** Greater than 15.4% Poverty 1.004 Part B Core 40 Model
1 Model 2 Model
3 Model
4
Scholars Pledge 0.959 0.923 0.958 0.939 Background Characteristics Male 0.819 ** 0.795 ** 0.785 ** Parent Characteristics Below $30,000 0.754 *** 0.753 *** Above $70,000 0.681 0.704 Parents ed. less than high
school 0.746 0.715
Parents college education or above
1.120 ~ 1.126
School Characteristics High school located in city 1.220 ~ High school located in rural
area 0.946
Greater than 11.4% Minority 1.020 *** Greater than 15.4% Poverty 1.003 N 3962 3962 3962 3962 LR (Chi2) 2.950 47.590 350.430 *** 387.420 *** Psuedo-R2 0 0.005 0.041 0.045 ~ p<0.10, * p<0.05, **p<0.01, ***p<0.001
Educational Opportunity in Indiana: A Study of the Twenty-first Century Scholars Program
22
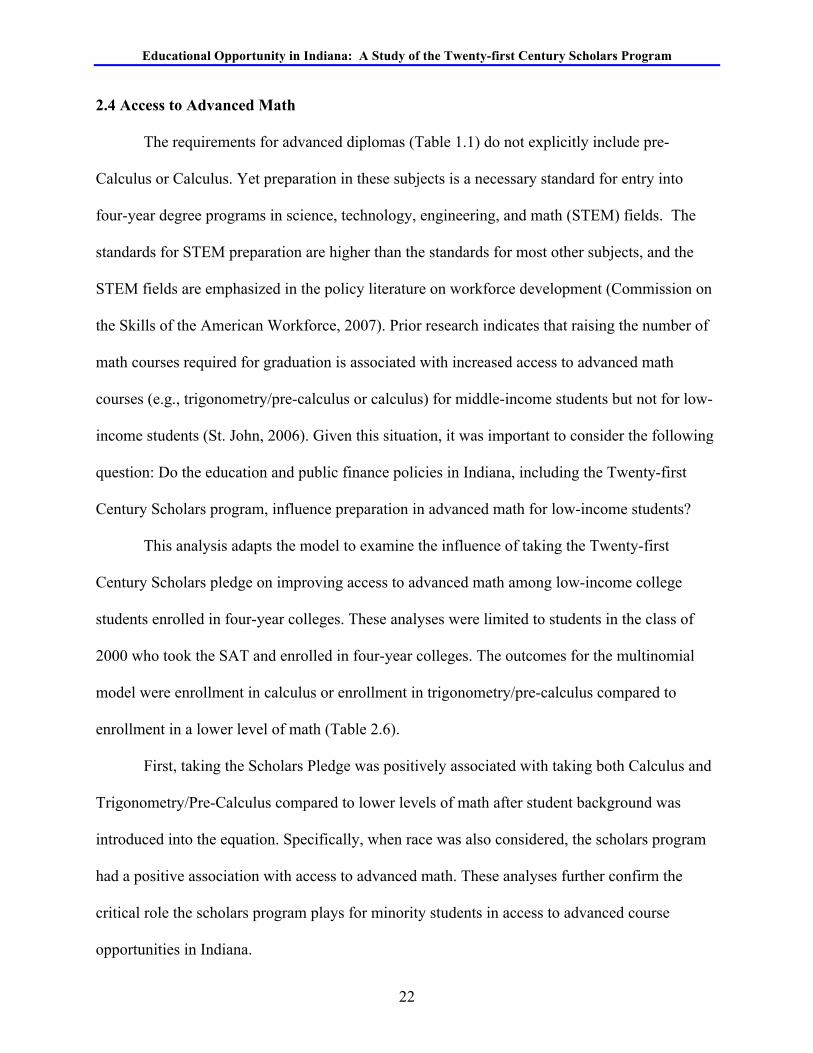
2.4 Access to Advanced Math
The requirements for advanced diplomas (Table 1.1) do not explicitly include pre-
Calculus or Calculus. Yet preparation in these subjects is a necessary standard for entry into
four-year degree programs in science, technology, engineering, and math (STEM) fields. The
standards for STEM preparation are higher than the standards for most other subjects, and the
STEM fields are emphasized in the policy literature on workforce development (Commission on
the Skills of the American Workforce, 2007). Prior research indicates that raising the number of
math courses required for graduation is associated with increased access to advanced math
courses (e.g., trigonometry/pre-calculus or calculus) for middle-income students but not for low-
income students (St. John, 2006). Given this situation, it was important to consider the following
question: Do the education and public finance policies in Indiana, including the Twenty-first
Century Scholars program, influence preparation in advanced math for low-income students?
This analysis adapts the model to examine the influence of taking the Twenty-first
Century Scholars pledge on improving access to advanced math among low-income college
students enrolled in four-year colleges. These analyses were limited to students in the class of
2000 who took the SAT and enrolled in four-year colleges. The outcomes for the multinomial
model were enrollment in calculus or enrollment in trigonometry/pre-calculus compared to
enrollment in a lower level of math (Table 2.6).
First, taking the Scholars Pledge was positively associated with taking both Calculus and
Trigonometry/Pre-Calculus compared to lower levels of math after student background was
introduced into the equation. Specifically, when race was also considered, the scholars program
had a positive association with access to advanced math. These analyses further confirm the
critical role the scholars program plays for minority students in access to advanced course
opportunities in Indiana.

Educational Opportunity in Indiana: A Study of the Twenty-first Century Scholars Program
23
Second, African American and Latino students were less likely than whites to enroll in
Calculus compared to other math courses. African Americans were also less likely than whites to
have access to trigonometry/pre-calculus than to lower levels of math. From the evidence, it
appears that taking the Scholars Pledge helps students overcome this racial barrier, but not for all
students. For example, Asian Americans were more likely than whites to enroll in both types of
advanced math, a probable artifact of a cultural preference for STEM fields.7 Finally, males
were more likely than females to enroll in calculus, another artifact of major choice given that
males were more likely to choose engineering and other STEM majors (St. John & Musoba, in
review).8
Third, low-income students had lower odds of enrolling in either calculus or
trigonometry/pre-calculus compared to lower levels of math. Students whose parents had
enrolled in college were more likely than students whose parents had graduated from high school
to enroll in calculus than in lower levels of math. These findings further illustrate the role of
social class, with income influencing access to advanced math and parents’ education having an
additional effect.
Fourth, school characteristics were also associated with access to math. Being in a high
poverty school reduced the odds of enrolling in trigonometry/pre-calculus compared to lower
levels of math. This indicates that the educational reforms in Indiana did not entirely overcome
barriers to access to advanced math because a number of schools do not yet appear to offer the
advanced courses in a sufficient number to overcome disparities.
7 Analyses of major choice among students in Indiana’s 2000 cohort indicate that Asian Americans are more likely than whites to choose majors in STEM fields as freshmen (St. John & Musoba, in review). 8 African Americans were also more likely than whites to choose majors in STEM fields and computing (St. John & Musoba, in review), so we cannot attribute the lower rate of access to math to major choice for African Americans.

Educational Opportunity in Indiana: A Study of the Twenty-first Century Scholars Program
24
Table 2.6 Multinomial Regression Predicting Highest Level of Math Completed: Trigonometry/Pre-calculus compared to less math
Part A Trig/ Pre-Calc. Model
1 Model
2 Model
3 Model
4 Scholars Pledge 1.110 1.190 * 1.190 * 1.180 ~ Background Characteristics Male 0.892 0.886 0.883 Native American and Other 0.609 ~ 0.620 ~ 0.604 ~ Asian 2.420 ** 2.49 ** 2.48 ** Black 0.618 *** 0.645 *** 0.666 ** Hispanic/Latino 0.868 0.903 0.894 No race reported 0.000 0 0 Parent Characteristics Below $30,000 0.789 ** 0.79 ** Above $70,000 1.018 1.03 Parents ed. less than high school 0.832 0.845 Parents college education or above 1.03 1.03 School Characteristics High school located in city 1.005 High school located in rural area 0.950 Greater than 11.4% Minority 1.004
Greater than 15.4% of the class qualifies for free or reduced lunch 0.991 *
Part B Calculus Model
1 Model
2 Model
3 Model
4 Scholars Pledge 1.120 1.300 * 1.290 * 1.290 * Background Characteristics Male 1.230 * 1.220 * 1.227 * Native American and Other 0.760 0.758 0.763 Asian 3.280 ** 3.32 *** 3.3 *** Black 0.326 *** 0.339 *** 0.328 *** Hispanic/Latino 0.315 ** 0.359 ** 0.358 ** No race reported 0.000 0 0 Parent Characteristics Below $30,000 0.736 ** 0.735 ** Above $70,000 1.05 1.05 Parents ed. less than high school 0.687 0.682 Parents college education or above 1.503 *** 1.500 *** School Characteristics High school located in city 1.050 High school located in rural area 1.050 Greater than 11.4% Minority 0.998
Greater than 15.4% of the class qualifies for free or reduced lunch 1.005
N 3544 3544 3544 3544 LR (Chi2) 2.06 105.350 *** 143.17 *** 153.54 *** Psuedo-R2 0.0003 0.015 0.0203 0.0218 ~ p<0.10, * p<0.05, **p<0.01, ***p<0.001

Educational Opportunity in Indiana: A Study of the Twenty-first Century Scholars Program
25
2.5 Summary Findings on Preparation
The linkages between policies—including high school reform policies and financial aid
guarantees—and access to advanced curriculum have seldom been previously examined using a
state-level database.9 Key findings from the analysis of access to advanced math courses among
students with financial need in Indiana’s millennial cohort:
• Taking the Scholars Pledge improved the odds of completing advanced
preparatory curriculum (Honors diploma). This finding illustrates a consistent
pattern that Scholars had greater access to advanced high school courses than their
peers who did not take the pledge.
• High school reforms in Indiana apparently improved access to advanced
curriculum in schools that serve minority students. Students, both minority and
white, enrolled in schools with high percentages of minority students were more
likely to complete Core 40 or Honors diplomas than students enrolled in schools
with fewer minority students, even though, as the point above illustrates, there is
more work to do.
• Taking the Scholars Pledge was particularly beneficial to African Americans.
Among African Americans who enrolled in college, taking the Pledge improved
the odds of completing college preparatory curriculum (Core 40 or Honors
diploma) compared to the regular high school diploma. The same was not true for
white students.
• Taking the Scholars Pledge also improved access to advanced math courses
(calculus and trigonometry/pre-calculus) among students who enrolled in four-
9 There has been some prior research examining these linkages with national databases (e.g., St. John, 2006), but we know of no prior state-level studies that have examined these linkages.

Educational Opportunity in Indiana: A Study of the Twenty-first Century Scholars Program
26
year colleges after taking the SAT. This finding indicates that the Scholars
program–in combination with the adoption of the Core 40 and the provision of
additional state support to fund implementation–improved preparation for STEM
majors among students from families with financial need in the Indiana high
school class of 2000.

Educational Opportunity in Indiana: A Study of the Twenty-first Century Scholars Program
27
3.0 Outreach and Encouragement:
Studies of the 2004 Cohort
The Twenty-first Century Scholars program has a statewide network of service centers
that provide counseling and other support services to students and their families.10 Since 2000,
Indiana has collected information regarding the use of services provided by the regional and
statewide support centers. The systematic collection of this information provided a means to
examine patterns of use and predicted outcomes (Table 1.1, link 3). While there is an extensive
literature on student engagement in outreach activities prior to college enrollment, most of these
studies are qualitative (e.g., McDonough, 1997; Hossler, Schmit, & Vesper, 1998). Patterns of
student engagement in outreach and encouragement activities provided by state agencies, like
those provided by the Twenty-first Century Scholars Program, can, in theory, improve
opportunities to prepare for and enroll in college. The Balanced Access and Success Model
(Figure 1.2) provides the logic for assessing the relationship between student and parent
engagement in these services and subsequent outcomes.
3.1 Approach
The analyses used data collected by the State Student Aid Commission of Indiana
(SSACI) on engagement in support activities provided by the statewide center in Bloomington
and regional centers located across Indiana. Each time a student engaged in a service activity, the
contact was recorded. Given this method of collection, the frequency of contact by activity and
center providing the service were the primary indicators of student-parent engagement. Appendix
II provides the complete list of service activities. To develop this database it was necessary to:
10 Historically these services were provided by ICPAC, but they are now provided by the State Student Assistance Agency of Indiana as part of a federal grant (GEAR UP).

Educational Opportunity in Indiana: A Study of the Twenty-first Century Scholars Program
28
• Create cohort files from information collected on each student since events were
recorded but not organized into student files.
• Develop frequency measures for each activity to provide a measure of the extent
of engagement for each activity.
The factor analyses (Section 3.2) used the database for the 2004 cohort. Factor analysis
provides a useful method of identifying unobservable relationships between observed events. It
is a statistical technique that permits representation of a set of variables in terms of a smaller
number of variables (Kim & Mueller, 1978). This method involves a linear transformation using
correlations between the original variables. When the resultant variables, known as factors, are
used as independent variables, they serve in two ways: making the regression model more
parsimonious and including measures of otherwise unobservable constructs. Factor analysis is
not an analytic tool on its own; rather it creates conceptual variables.
Data collected by SSACI included all of the support activities available to scholars and
recorded each incidence of participation. After reshaping the dataset to create unique records for
each student, two sets of variables for each activity were created: an indicator variable for
whether or not a student partook of a particular support service, and a variable counting how
many times a student engaged in such an activity. Descriptive information about each of the
specific support services for the 2004 Cohort appears in Appendix AII, Tables AII.2 and AII.3.
Factor analysis requires the use of continuous variables, hence only count variables were
included in the creation of the factors. Because the support activities could be related to each
other conceptually in a variety of combinations, all count variables were entered into an
exploratory factor analysis. The exploratory factor analysis yielded four potential factors based
on both statistical and conceptual strength; the broader concepts presented by each factor reflect

Educational Opportunity in Indiana: A Study of the Twenty-first Century Scholars Program
29
access to social and cultural forms of capital. The next step, confirmatory factor analysis for
each potential factor, indicated that each factor stood on its own. For a list of each factor, the
variables contributing to it, and the factor loadings, see Table 3.1. In that table, the Cronbach’s
alpha serves as a measure of reliability. The numeric score, which can range from 0 to 1,
represents “the mean of the correlations between all of the different possible splits of the scale
into two halves” (Cohen, Cohen, West, & Aiken, 2002).
Of final note is the highly skewed distribution of each factor. In order to include these
newly created variables in the regression models, they needed to be recoded into dichotomous
variables. Each factor was divided into whether or not a student or parent participated in that
factor, creating four dichotomous variables.
To assess the relationship between student engagement and college enrollment by
Scholars it was necessary to link with the student engagement database of the Indiana
Commission for Higher Education’s State Student Information System (SIS) for 2004-05.
Student inclusion in the database served as an indicator of student enrollment. Some students in
the 2004 Scholars cohort enrolled in Indiana’s public colleges and universities while others did
not. However, we had no indicators of enrollment in private colleges or universities or of
enrollment out of state for students in this cohort. Some students who did not enroll in state
colleges and universities enrolled in private or out-of-state colleges while others did not enroll
anywhere. Given this limitation, analyses do not provide information on enrollment in college,
but only enrollment within the state’s pubic colleges and universities.
The analyses of college choice and academic preparation used a subpopulation from the
2004 file of students enrolled in public colleges and universities. This included all students
designated in the SIS as being Twenty-first Century Scholars along with students who received
Educational Opportunity in Indiana: A Study of the Twenty-first Century Scholars Program
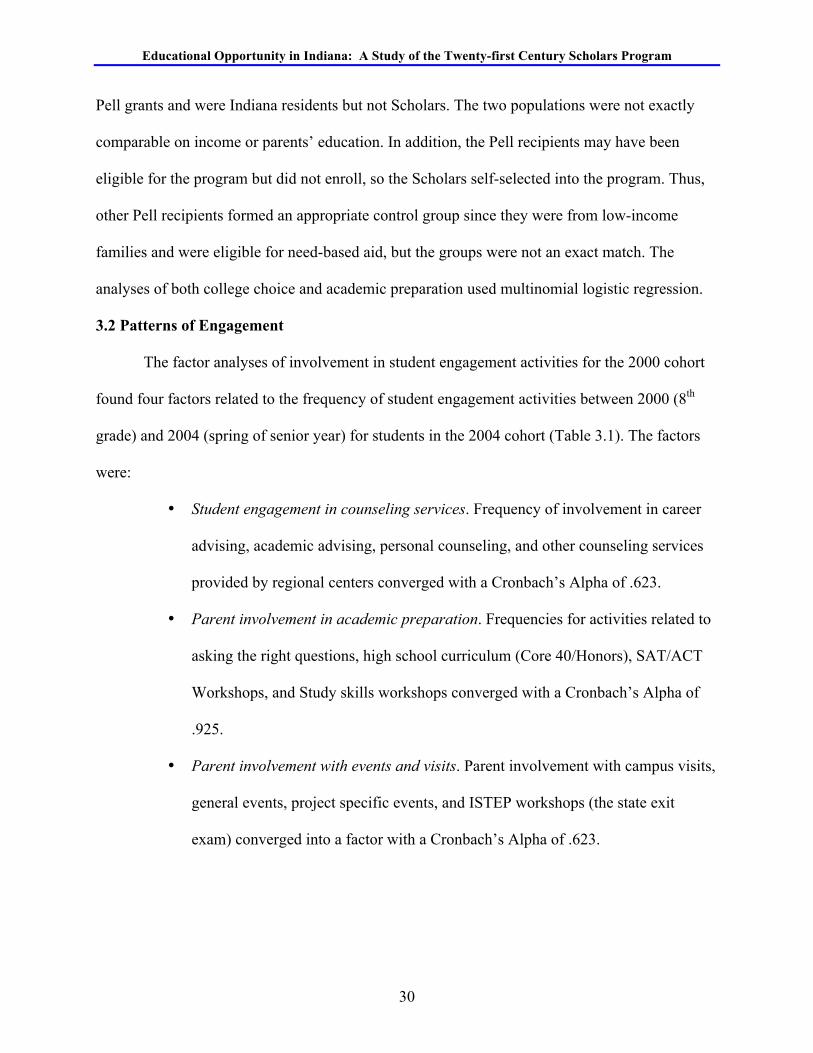
30
Pell grants and were Indiana residents but not Scholars. The two populations were not exactly
comparable on income or parents’ education. In addition, the Pell recipients may have been
eligible for the program but did not enroll, so the Scholars self-selected into the program. Thus,
other Pell recipients formed an appropriate control group since they were from low-income
families and were eligible for need-based aid, but the groups were not an exact match. The
analyses of both college choice and academic preparation used multinomial logistic regression.
3.2 Patterns of Engagement
The factor analyses of involvement in student engagement activities for the 2000 cohort
found four factors related to the frequency of student engagement activities between 2000 (8th
grade) and 2004 (spring of senior year) for students in the 2004 cohort (Table 3.1). The factors
were:
• Student engagement in counseling services. Frequency of involvement in career
advising, academic advising, personal counseling, and other counseling services
provided by regional centers converged with a Cronbach’s Alpha of .623.
• Parent involvement in academic preparation. Frequencies for activities related to
asking the right questions, high school curriculum (Core 40/Honors), SAT/ACT
Workshops, and Study skills workshops converged with a Cronbach’s Alpha of
.925.
• Parent involvement with events and visits. Parent involvement with campus visits,
general events, project specific events, and ISTEP workshops (the state exit
exam) converged into a factor with a Cronbach’s Alpha of .623.
Educational Opportunity in Indiana: A Study of the Twenty-first Century Scholars Program
31
• Parent involvement in planning activities. Frequency of parent involvement in
study skills workshops, career workshops, and college preparation workshops
converged with a Cronbach’s Alpha of .756
These factors provide indicators of patterns of engagement by students and their parents
that hold together conceptually. As you can see, the only student activities that converged were
related to counseling. Students using these services had a perceived need for counseling they did
not receive through the school or home and followed through on acquiring these services through
their regional centers. Other student engagement activities did not converge into a factor. On the
other hand, several parental activities converged. The academic preparation for parents factor
represents parental engagement in activities that inform them about the expectations for their
students relative to college preparation. Parent activities related to preparation indicate active
parental involvement in building an understanding of college, a form of family academic capital.
Finally, the parent activities related to planning for college (e.g., attending workshops) are also
logically aligned.

Educational Opportunity in Indiana: A Study of the Twenty-first Century Scholars Program
32
Table 3.1 Factor Analysis of Engagement in Outreach Activities Between 2000 and 2004 for Twenty-first Century Scholars and Their Parents, Cohort Eligible for College in Fall 2004 Counseling (Student) Cronbach's Alpha (reliability) = .623
Variables in Factor Factor
Loading Factor Score
Count of Career Advising (Student) 0.837 0.376 Count of Academic Advising (Student) 0.823 0.370 Count of Personal Counseling (Student) 0.778 0.350 Count of Other Counseling (Student) 0.489 0.220 Academic Preparation (Parent) Cronbach's Alpha (reliability) = .925
Variables in Factor Factor
Loading Factor Score
Count of Right Questions Workshops (Parent) 0.932 0.284 Count of Core 40/Academic Honors Workshops (Parent) 0.912 0.278 Count of SAT/ACT Workshops (Parent) 0.910 0.277 Count of Study Skills/Time Management Workshops (Parent) 0.869 0.265 Events and Visits (Parent) Cronbach's Alpha (reliability) = .623
Variables in Factor Factor
Loading Factor Score
Count of College Visits (Parent) 0.810 0.340 Count of General Events (Parent) 0.693 0.291 Count of Project Specific Events (Parent) 0.680 0.285 Count of Cultural Events (Parent) 0.628 0.263 Count of ISTEP Workshops (Parent) 0.625 0.262 Career Planning (Parent) Cronbach's Alpha (reliability) = .756
Variables in Factor Factor
Loading Factor Score
Count of Study Skills Workshops (Parent) 0.846 0.404 Count of Career Workshops (Parent) 0.843 0.402 Count of College Prep Workshops (Parent) 0.818 0.391

Educational Opportunity in Indiana: A Study of the Twenty-first Century Scholars Program
33
3.3 Enrollment in Public Colleges
The analysis of enrollment captures the pipeline from high school to public colleges
within Indiana’s state system of education. (Since enrollments in private colleges and out-of-
state colleges are not included in the comparison variable in the logistic regression analysis,
these analyses should not be treated as enrollment per se.) The logical model for enrollment in
public colleges considered the influence of support services on enrollment. Student background
information, a requisite for a sound logical model of enrollment, was not included in the
database.
The breakdown of engagement activities (Table 3.2) provides a comparison of Scholars
who enrolled in Indiana public colleges compared to Scholars who did not enroll for the 2004
cohort. The enrolled students had significantly higher factor scores on counseling and parent
visits and events than did those who did not enroll. In contrast, enrolled Scholars had
significantly lower scores on parental engagement in academic preparation than did those who
did not enroll. The scores for parent involvement in planning activities did not significantly
differ for the two groups. There were no significant differences for enrollment versus non-
enrollment for any of the centers. However, students who used only services from the state
center in Bloomington were less likely to enroll than students who used services at any of the
regional centers.
The logistic regression analysis of enrollment in public colleges (Table 3.3) indicates a
strong relationship between engagement factors and college enrollment. The model correctly
predicts 66% of the cases (which would include students who did not enroll in the public
system). Three of the factors had a significant association with enrollment in the public system.
Students with higher scores on the counseling factor and parent involvement in events had higher
Educational Opportunity in Indiana: A Study of the Twenty-first Century Scholars Program
34
odds of enrolling in college than did students with lower scores on these factors, indicating that
using counseling services and engagement in parent activities are associated with continuation in
the state system. One factor, parent engagement in academic preparation activities, was
negatively associated with continuation in the public system. Since these activities are generally
thought to be associated with enrollment, it is probable that this factor is associated with
enrollment in private or out-of-state colleges. We could not test this alternative hypothesis with
the data available.
In addition, students who engaged in regional service center activities were more likely
than students who used only state services to enroll in college. This is a prima facie indicator that
the regional service centers provided effective support for students. This hypothesis is further
tested in the analysis of college choice below.

Educational Opportunity in Indiana: A Study of the Twenty-first Century Scholars Program
35
Table 3.2 Factor Scores for Engagement Activities and Service Center Site Use for Twenty-first Century Scholars in the 2004 Cohort: Breakdown Comparing Enrollment to Non Enrollment for Fall 2004 (N=5,668) Enrollment Statusa
Activities Enrolled (Mean)
Not Enrolled (Mean)
Sig. Diff.
Counseling for the Student (Standardized Factor)b 0.03 -0.02 ~ Academic Preparation for the Parent (Standardized Factor)c -0.05 0.02 * Visits and Events for the Parent (Standardized Factor)d 0.05 -0.03 ** Career Planning for the Parent (Standardized Factor)e 0.03 -0.01
Support Sitesf Total
(Count) Enrolled (%) Not Enrolled
(%) State Center (Bloomington) © 694 24.64 75.36 Charlestown 254 37.01 62.99 East Chicago 442 32.81 67.19 Evansville 254 37.01 62.99 Fort Wayne 238 34.87 65.13 Gary 228 44.74 55.26 Indianapolis 567 38.10 61.90 Knox 145 35.17 64.83 Kokomo 243 40.33 59.67 Lafayette 202 37.13 62.87 Muncie 475 36.84 63.16 North Vernon 265 29.81 70.19 Richmond 383 26.37 73.63 South Bend 584 38.18 61.82 Terre Haute 302 31.46 68.54 Unknown © 2 100.00 0.00 Vincennes 252 38.49 61.51 No Support Site - Student Did Not Engage in Activities 138 30.43 69.57 Note: *** p<0.001, ** p<0.01, * p<0.05, ~ p<0.1 a. Enrollment information comes from the SIS database, which contains data only for students who enrolled in Indiana's public institutions of higher education. b. Continuous variable measuring frequency of personal counseling, academic advising, career advising, and other counseling. Mean = 0, SD = 1 c. Continuous variable measuring frequency of workshop attendance on the following topics: Core 40/Academic Honors, Right Questions, Study Skills/Time Management, and SAT/ACT. Mean = 0, SD = 1 d. Continuous variable measuring frequency of college visits, general events, cultural events, project specific events, and ISTEP workshops. Mean = 0, SD = 1 e. Continuous variable measuring frequency of workshops for study skills, career, and college preparation. Mean = 0, SD = 1 f. Dichotomous variables of participation at this support site or not, with the support site at Bloomington and Unknown support site as comparison

Educational Opportunity in Indiana: A Study of the Twenty-first Century Scholars Program
36
Table 3.3 Logistic Regression of 2004 Cohort of Twenty-first Century Scholars Examining Relationship Between Participation in Engagement Activities and Different Support Sites with Enrollment within Indiana Public Colleges and Universitiesa (N = 5,668) Activities: Odds Ratio Sig. Counseling for the Student (Standardized Factor)b 1.206 *** Academic Preparation for the Parent (Standardized Factor)c 0.832 * Visits and Events for the Parent (Standardized Factor)d 1.176 *** Career Planning for the Parent (Standardized Factor)e 1.019 Support Sitesf Charlestown 2.341 *** East Chicago 1.975 *** Evansville 2.384 *** Fort Wayne 2.236 *** Gary 2.996 *** Indianapolis 2.496 *** Knox 1.509 * Kokomo 2.422 *** Lafayette 2.354 *** Muncie 2.194 *** North Vernon 1.576 ** Richmond 1.963 ** South Bend 2.543 *** Terre Haute 1.541 ** Vincennes 1.764 ** No Support Site – Student Did Not Engage in Activities 0.259 *** Number of Cases 5668.000
Model χ2 (df) 121.696
(20) *** Nagelkerke Pseudo R2 0.029 % Correctly Predicted 65.51 Note: *** p<0.001, ** p<0.01, * p<0.05, ~ p<0.1

Educational Opportunity in Indiana: A Study of the Twenty-first Century Scholars Program
37
3.4 Comparison of Scholars and Other Pell Recipients
The breakdown analysis comparing students in the Scholars program with students who
received Pell grants (Table 3.4) found there were significant differences between the two groups.
Most of the students in the two groups were from the lowest two income categories, but a
significantly higher percentage of the non-scholars were from the lowest two income groups
(86% of scholars compared to 95% of other Pell recipients). In contrast, a higher percentage of
Scholars than non-scholars were minority students. Significantly higher percentages of Scholars
were African Americans, Hispanics and Native Americans, groups generally less represented in
college, while a significantly higher percentage of non-scholars were white. Apparently, many
low-income whites did not choose to enroll in the program in spite of eligibility.
These two groups are not exactly comparable. Some students who signed up for the
scholars program may have had growth in family income after they signed up. It is possible that
some families would have income growth after the 8th grade and even some Pell recipients were
from high-income quartiles. The fact that whites were less likely to sign up for the program
should be an area of concern; all low-income students may lack the financial resources and
academic preparation needed for college.
A higher percentage of Scholars than non-scholars among this low-income population
had completed Core 40 or Honors diplomas. In addition, a higher percentage of Scholars than
non-scholars enrolled in research universities and other four-year colleges, while a higher
percentage of non-scholars enrolled in two-year colleges. The question we consider in the
logistic analyses is whether these outcomes are related to engagement in outreach and
encouragement support services. To examine this relationship, we recoded the variables related
to engagement. First, rather than use factor scores, an approach that would have excluded the

Educational Opportunity in Indiana: A Study of the Twenty-first Century Scholars Program
38
comparison group, we used dichotomous variables related to whether or not students had used
counseling services and whether or not students’ parents were involved in the activities included
in the factors. In addition, we compared students who had been involved in service activities at
any regional center to others in a dichotomous variable. Using this coding scheme it was possible
to examine the significance of engagement in the differences across outcomes.