EDUCATIONAL MISMATCH AMONG PH.D.S: DETERMINANTS … · NBER Working Paper No. 12693 November 2006...
37
NBER WORKING PAPER SERIES EDUCATIONAL MISMATCH AMONG PH.D.S: DETERMINANTS AND CONSEQUENCES Keith A. Bender John S. Heywood Working Paper 12693 http://www.nber.org/papers/w12693 NATIONAL BUREAU OF ECONOMIC RESEARCH 1050 Massachusetts Avenue Cambridge, MA 02138 November 2006 The authors thank the National Science Foundation (NSF) and William Rayburn for helping to secure access to the restricted data and Richard Freeman, Dan Hamermesh, Shulamit Kahn, Kostas Mavromaras and the participants of seminars at the University of Aberdeen, Scotland, Lancaster University, England, the University of Wisconsin-Milwaukee, the National Bureau of Economic Research, and the NSF for helpful comments. The use of NSF data does not imply NSF endorsement of the research methods or conclusions contained in this paper. The views expressed herein are those of the author(s) and do not necessarily reflect the views of the National Bureau of Economic Research. © 2006 by Keith A. Bender and John S. Heywood. All rights reserved. Short sections of text, not to exceed two paragraphs, may be quoted without explicit permission provided that full credit, including © notice, is given to the source.
Transcript of EDUCATIONAL MISMATCH AMONG PH.D.S: DETERMINANTS … · NBER Working Paper No. 12693 November 2006...

NBER WORKING PAPER SERIES
EDUCATIONAL MISMATCH AMONG PH.D.S:DETERMINANTS AND CONSEQUENCES
Keith A. BenderJohn S. Heywood
Working Paper 12693http://www.nber.org/papers/w12693
NATIONAL BUREAU OF ECONOMIC RESEARCH1050 Massachusetts Avenue
Cambridge, MA 02138November 2006
The authors thank the National Science Foundation (NSF) and William Rayburn for helping to secureaccess to the restricted data and Richard Freeman, Dan Hamermesh, Shulamit Kahn, Kostas Mavromarasand the participants of seminars at the University of Aberdeen, Scotland, Lancaster University, England,the University of Wisconsin-Milwaukee, the National Bureau of Economic Research, and the NSFfor helpful comments. The use of NSF data does not imply NSF endorsement of the research methodsor conclusions contained in this paper. The views expressed herein are those of the author(s) and donot necessarily reflect the views of the National Bureau of Economic Research.
© 2006 by Keith A. Bender and John S. Heywood. All rights reserved. Short sections of text, not toexceed two paragraphs, may be quoted without explicit permission provided that full credit, including© notice, is given to the source.
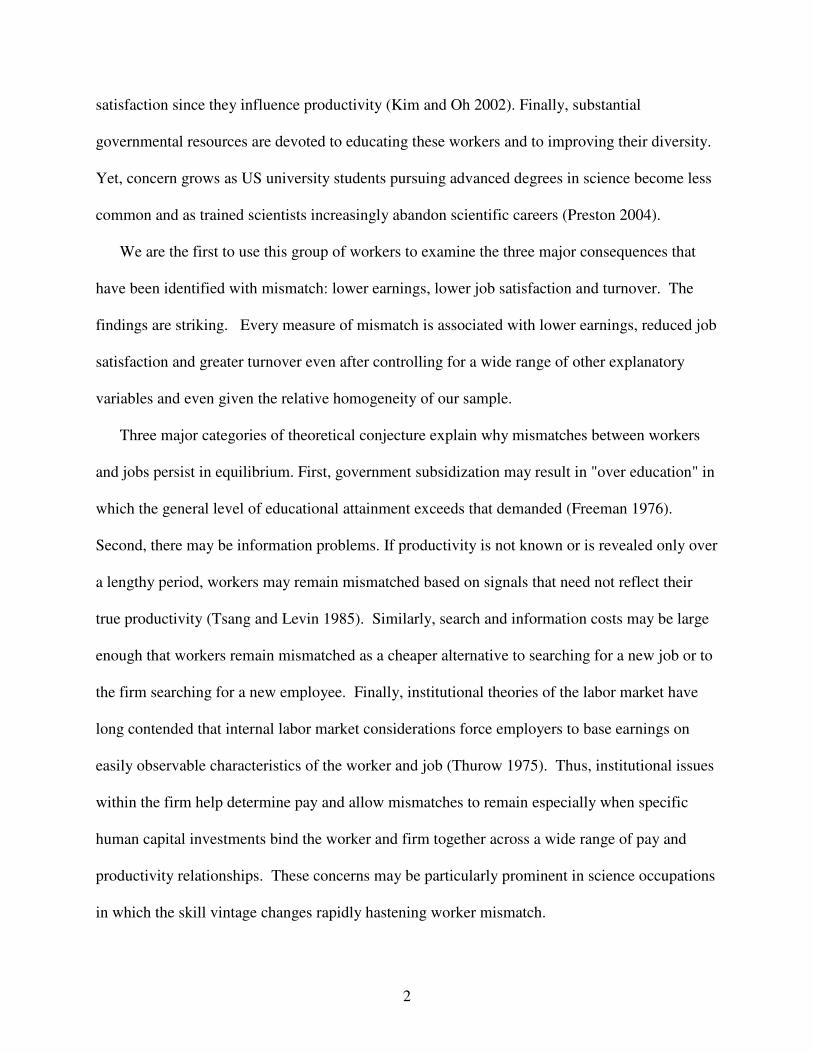
Educational Mismatch Among Ph.D.s: Determinants and ConsequencesKeith A. Bender and John S. HeywoodNBER Working Paper No. 12693November 2006JEL No. J24,J28,J44
ABSTRACT
Using the Survey of Doctoral Recipients, the magnitude and consequences of job mismatch are estimatedfor Ph.D.s in science. Approximately one-sixth of academics and nearly one-half of nonacademicsreport some degree of mismatch. The influence of job mismatch is estimated for three job outcomes:earnings, job satisfaction and turnover. Surprisingly large and robust influences emerge. Mismatchis associated with substantially lower earnings, lower job satisfaction and a higher rate of turnover.These results persist across a variety of specifications and hold for both academics and nonacademics.Estimates of the determinants of mismatch indicate that older workers and those in rapidly changingdisciplines are more likely to be mismatched and there is a suggestion that women are more likelyto be mismatched.
Keith A. BenderDepartment of EconomicsUniversity of Wisconsin-MilwaukeeP.O. Box 413, Bolton Hall 814Milwaukee, WI [email protected]
John S. HeywoodDepartment of EconomicsUniversity of Wisconsin - MilwaukeeP.O. Box 413, Bolton Hall 814Milwaukee, WI [email protected]

1
Educational Mismatch among Ph.D.s:
Determinants and Consequences
Keith A. Bender and John S. Heywood
1. Introduction
According to assignment theory, the returns to investments in human capital vary dramatically
with the quality of the match between the worker and the job (see Sattinger 1993 and Belman
and Heywood 1997). Mismatches between worker skills and job requirements have substantial
costs as workers are either unable to fulfill job requirements or have skills that go unused.
Mismatches waste educational resources resulting in dissatisfied workers (Tsang 1987) and
higher turnover (McGoldrick and Robst 1996). Lower job satisfaction and higher turnover may
reduce formal training and lower labor productivity and so firms' profits (Groot 1993 and Sloane
et al. 1996). Finally, frustration over being mismatched may independently reduce worker effort
(Belfield 2000).
In this paper we focus on workers with a Ph.D. in science and examine the predicted
consequences of mismatch. First, we examine these workers because they play a key role in
innovation and creating technological progress. As a consequence, economists have estimated
the determinants of productivity for scientists (Levin and Stephan 1991), the adequacy of their
supply (Stephan and Levin 1991, Stephan 1996, National Science Board 2003 and Teitelbaum
2004) and the rewards to their education (Stephan and Everhart 1998). Second, the homogeneity
of this sample allows us to control for variables excluded from typical estimates in examining the
consequences of mismatch. Third, managers concerned with maximizing the impact of their
research and development staff need to understand the relationship between mismatch, job
2
satisfaction since they influence productivity (Kim and Oh 2002). Finally, substantial
governmental resources are devoted to educating these workers and to improving their diversity.
Yet, concern grows as US university students pursuing advanced degrees in science become less
common and as trained scientists increasingly abandon scientific careers (Preston 2004).
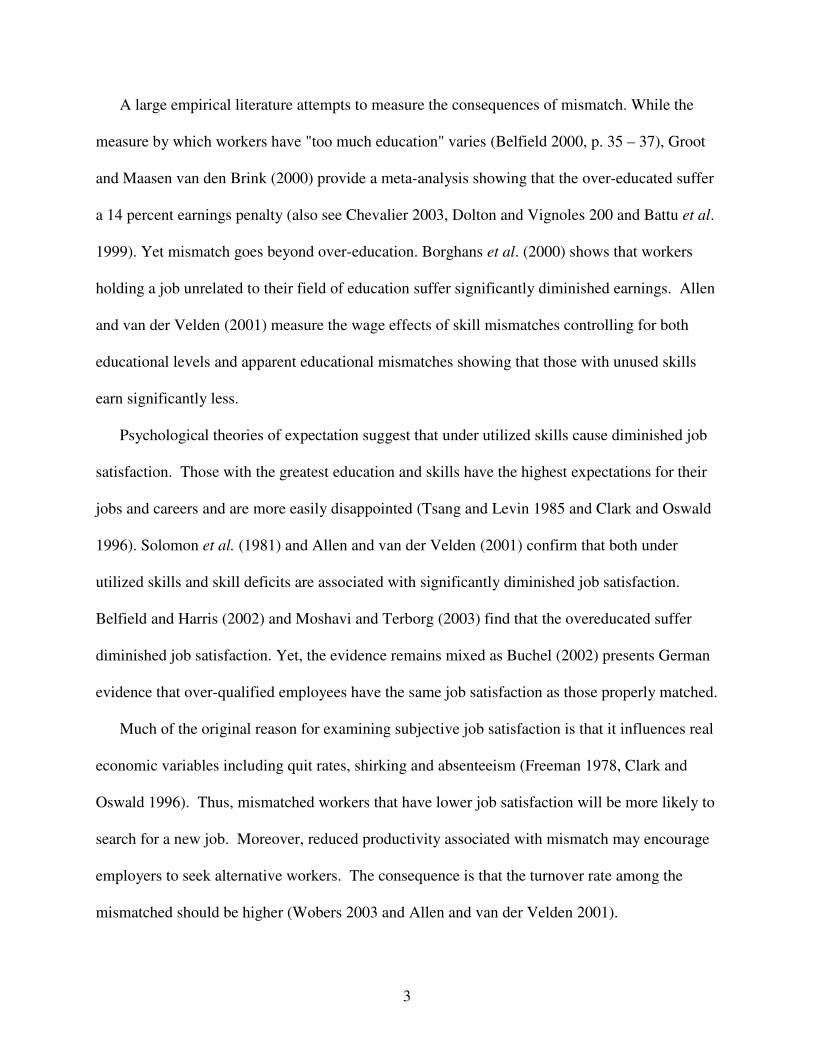
We are the first to use this group of workers to examine the three major consequences that
have been identified with mismatch: lower earnings, lower job satisfaction and turnover. The
findings are striking. Every measure of mismatch is associated with lower earnings, reduced job
satisfaction and greater turnover even after controlling for a wide range of other explanatory
variables and even given the relative homogeneity of our sample.
Three major categories of theoretical conjecture explain why mismatches between workers
and jobs persist in equilibrium. First, government subsidization may result in "over education" in
which the general level of educational attainment exceeds that demanded (Freeman 1976).
Second, there may be information problems. If productivity is not known or is revealed only over
a lengthy period, workers may remain mismatched based on signals that need not reflect their
true productivity (Tsang and Levin 1985). Similarly, search and information costs may be large
enough that workers remain mismatched as a cheaper alternative to searching for a new job or to
the firm searching for a new employee. Finally, institutional theories of the labor market have
long contended that internal labor market considerations force employers to base earnings on
easily observable characteristics of the worker and job (Thurow 1975). Thus, institutional issues
within the firm help determine pay and allow mismatches to remain especially when specific
human capital investments bind the worker and firm together across a wide range of pay and
productivity relationships. These concerns may be particularly prominent in science occupations
in which the skill vintage changes rapidly hastening worker mismatch.
3
A large empirical literature attempts to measure the consequences of mismatch. While the
measure by which workers have "too much education" varies (Belfield 2000, p. 35 – 37), Groot
and Maasen van den Brink (2000) provide a meta-analysis showing that the over-educated suffer
a 14 percent earnings penalty (also see Chevalier 2003, Dolton and Vignoles 200 and Battu et al.
1999). Yet mismatch goes beyond over-education. Borghans et al. (2000) shows that workers
holding a job unrelated to their field of education suffer significantly diminished earnings. Allen
and van der Velden (2001) measure the wage effects of skill mismatches controlling for both
educational levels and apparent educational mismatches showing that those with unused skills
earn significantly less.
Psychological theories of expectation suggest that under utilized skills cause diminished job
satisfaction. Those with the greatest education and skills have the highest expectations for their
jobs and careers and are more easily disappointed (Tsang and Levin 1985 and Clark and Oswald
1996). Solomon et al. (1981) and Allen and van der Velden (2001) confirm that both under
utilized skills and skill deficits are associated with significantly diminished job satisfaction.
Belfield and Harris (2002) and Moshavi and Terborg (2003) find that the overeducated suffer
diminished job satisfaction. Yet, the evidence remains mixed as Buchel (2002) presents German
evidence that over-qualified employees have the same job satisfaction as those properly matched.
Much of the original reason for examining subjective job satisfaction is that it influences real
economic variables including quit rates, shirking and absenteeism (Freeman 1978, Clark and
Oswald 1996). Thus, mismatched workers that have lower job satisfaction will be more likely to
search for a new job. Moreover, reduced productivity associated with mismatch may encourage
employers to seek alternative workers. The consequence is that the turnover rate among the
mismatched should be higher (Wobers 2003 and Allen and van der Velden 2001).

4
Unlike the literature reviewed above, we go beyond simply identifying the consequences of
mismatch to ask which reasons for being mismatched have the greatest consequences. We find
that those mismatched because of the lack of jobs or family considerations suffer very large
reductions in wages and job satisfaction. Women who are mismatched because of family
considerations have particularly large reductions in earnings.
We also estimate the causes of mismatch. The estimations suggest that the vintage of
scientific skills is a critical determinant. In general, scientists are more likely to be mismatched,
and the penalty for mismatch grows when they are older. There is evidence of the traditional
movement from the lab to management for workers in rapidly changing disciplines and the
suggestion that women are more likely to be mismatched all else equal.
2. Data and Methodology
We draw our primary data from the 1997 and 1999 Survey of Doctorate Recipients (SDR)
conducted by the National Opinion Research Center for the National Science Foundation. The
SDR is a nationally representative sample of all Ph.D. graduates in the hard and social sciences
prior to 1997 living in the US. Collected in response to the National Research Council's demand
for data that allows the integration of occupational detail and academic training, the SDR is
conducted every other year. The 1997 SDR is the most recent wave asking questions about
overall job satisfaction. It is also the only wave asking what we identify as the secondary
mismatch indicators. We selected all currently employed scientists for which full information
was available yielding a sample of 31,845.1
1While much of the data from the SDR are publicly available, we add variables from the restricted use version. These variables include annual earnings, detailed job codes, race/ethnicity, age and marital status. See the SDR website at ‘http://sestat.nsf.gov/’ for details on both versions of the SDR data.

5
The primary indicator of mismatch comes from responses to the question: "Thinking about
the relationship between your work and your education, to what extent is your work related to
your doctoral degree?" The possible responses are "closely related," "somewhat related" and
"not related." Those scientists working in jobs not related to their education are presumably
using less of the knowledge, training and skills learned in that education. In this critical sense
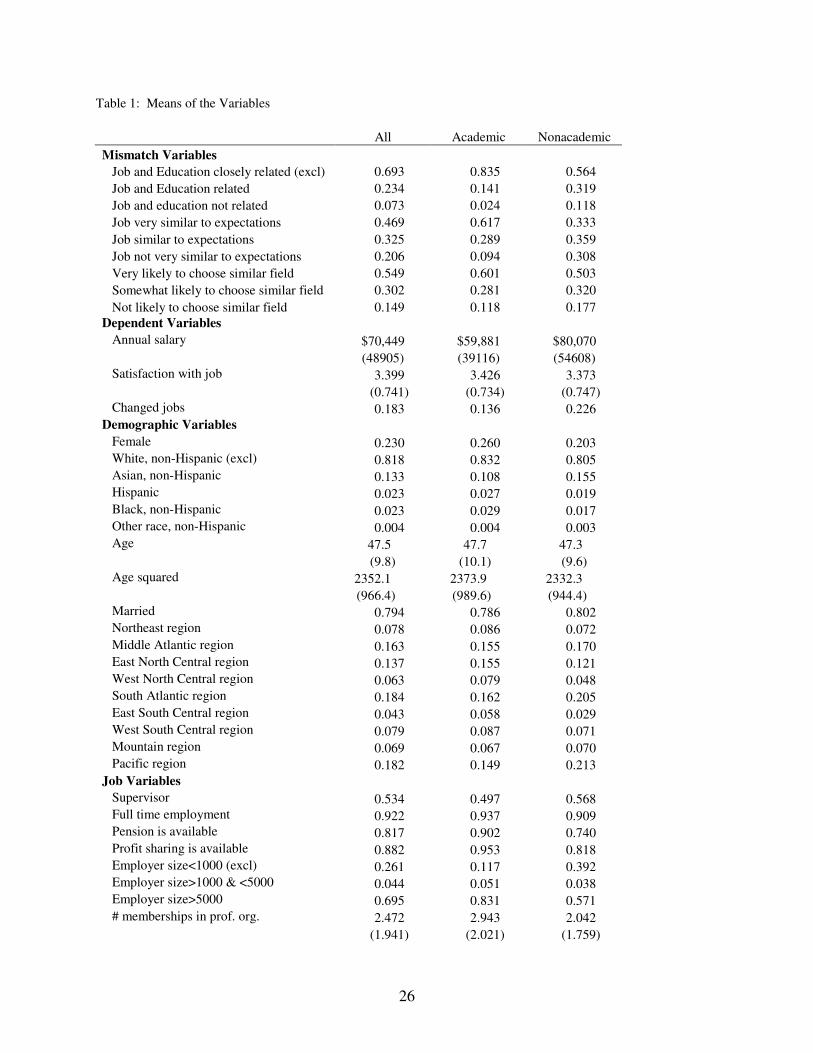
they may be identified as mismatched. As Table 1 shows, only 7.3 percent of the sample report
their education and job are not at all related, although another 23.4 percent report that their
education and job are only somewhat related.
Two secondary mismatch indicators probe related aspects of the link between the workers'
scientific education and their current job. The first asks, "Thinking back to when you completed
your degree would you say your work during a typical week on your job is 1) very similar to
what you expected to be doing, 2) somewhat similar to what you expected to be doing or 3) not
very similar to what you expected to be doing." To the extent that expectations upon completing
the doctoral degree reflect the training and experience in their field, those who are far away from
their expectations may also be far away from their training or field. Obviously, expectations
could be imperfect and, if so, one might expect a weaker relationship between this question and
underlying mismatches. The means indicate that 20.6 percent report that their job is not very
similar to what they expected with another 32.5 reporting that their job is only somewhat similar
to what they expected.
The other secondary question asks, "If you had the chance to do it over again, knowing what
you do now, how likely is it that you would choose the same field of study for your highest
degree?" The answers are "very likely," "somewhat likely" and "not likely at all." While this
question might simply be seen as identifying those who feel they made a bad career choice, it

6
seems reasonable that those who are mismatched would especially regret their choice of field.
Consistent with evidence that scientists leave their careers in large numbers (Preston 2004), only
slightly more than half of the sample report being very likely to repeat their study for their
highest degree. In sum, these three questions reflect slightly different aspects of the relationship
between education and the workers' current positions. Despite these differences, the three
measures appear highly correlated as we will show shortly.
Table 2 presents cross-tabulations of the two secondary measures of mismatch with the
primary measure. The top panel shows that the distribution of expectations of the job given the
education is broadly similar to that on how closely the job and education relate. The diagonal
terms are the largest within each column and comprise roughly 60 percent of the sample. The
distribution of the likelihood of repeating the same education is bit less similar to the primary
indicator. The diagonal terms are not the largest in two columns and comprise a smaller share of
the sample. The less than perfect correlation suggests the three measures capture somewhat
different aspects of mismatch and that considering each may be valuable.
Using these measures, we investigate the effect of mismatch on earnings, job satisfaction and
job change. The earnings measure is annual earnings in 1997 including all wages, salaries,
bonuses, overtime, commissions, consulting fees and net income from business and has an
average of over $70,000. The critical question on job satisfaction asks "How would you rate
your overall satisfaction with your principal job during the week of April 15th?" The choices are
"very dissatisfied," "somewhat dissatisfied," "somewhat satisfied," and "very satisfied." These
responses are ordered values from 1 to 4 with an average of 3.4. Job change information comes
from the 1999 survey which asks workers to identify one of the following: 1) their current job is
different than that held in the 1997 survey but with the same employer; 2) their current job is

7
different than that they held in the 1997 but with a different employer; 3) they hold the same job
and employer as in 1997 or 4) they hold the same job with a different employer. We view
positive answers to either of the first two options as evidence of a job change. A relatively large
share of sample, 18.3 percent, changed jobs within the two years. We also use only those who
changed employers and jobs as true job changes, and this does not alter the basic results.
The bottom portion of Table 1 indicates the rich set of demographic and job dimension
variables that we use as controls in an effort to isolate the influence of the indicators of
mismatch. These include race, gender, age, marital status, regional variables, a very large vector
of job dimensions that might influence earnings, job satisfaction and turnover as well as detailed
discipline indicators (see Bender and Heywood 2006 for a detailed list of these indicators).
Table 3 collects the primary mismatch indicator, earnings, job satisfaction and turnover.
The data is presented separately for each discipline and divided between those holding academic
and nonacademic jobs. Academics in general are much less likely to report any degree of
mismatch (this is true across all three mismatch indicators). Academic economists report the
lowest share of any degree mismatch at only 2.2 percent. Those working in computer science
report a very high degree of mismatch with two-thirds reporting a degree of mismatch. This may
reflect a vintage effect in which the discipline changes very quickly heightening the gap between
skills learned in school and those needed on the job. Such a possibility emphasizes the need to
control for the age of the worker. The single highest degree of mismatch is among those
nonacademics working in "other disciplines." This follows, in part, from construction. This
category includes disciplines other than those in the sciences. Thus, workers in this category are
necessarily working in disciplines other than that in which they were trained.

8
In terms of the outcome variables, those groups with better matches on average also have
higher job satisfaction and lower job change. For example, academics, who say that they are
better matched on average, report modestly higher job satisfaction and have much lower
turnover. On the other hand, although more highly matched, academics earn less than
nonacademics in every discipline. Further investigation, simultaneously controlling for other
determinants of earnings, is warranted to see if this correlation holds.
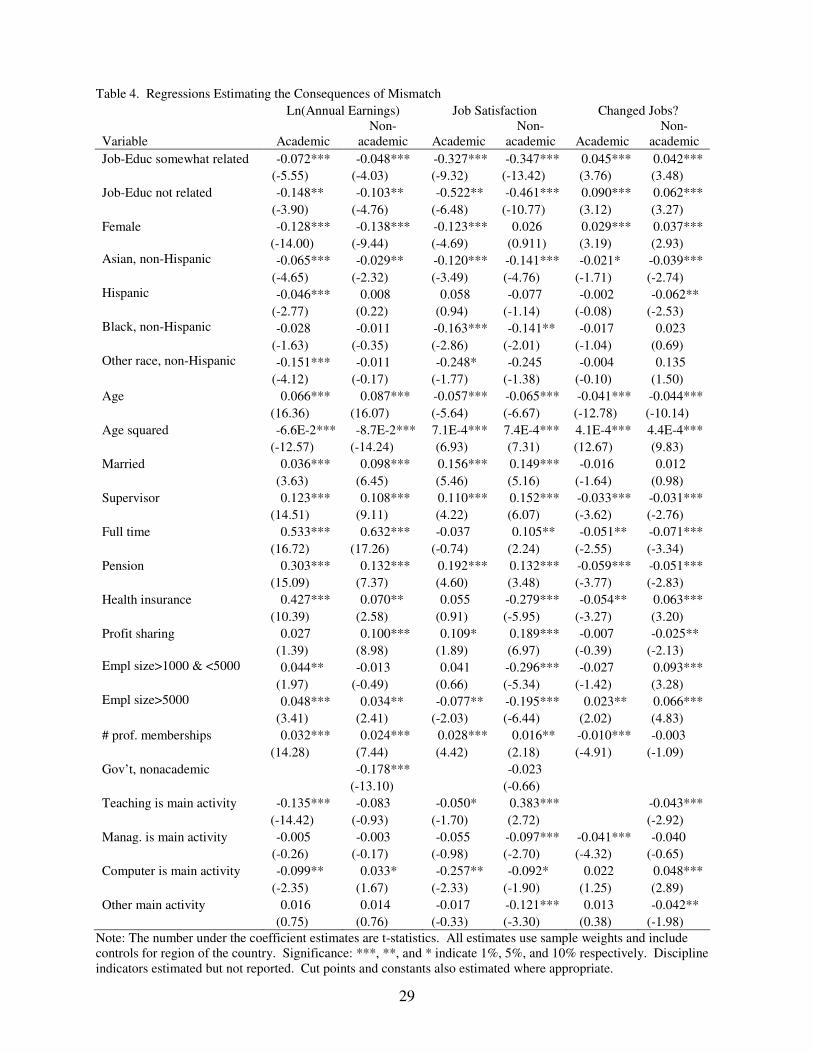
3. Consequences of Mismatch Table 4 presents typical log linear earnings equations revealing a number of anticipated results.
In both the academic and nonacademic sectors women and blacks earn less, all else equal.
Supervisors, those married, receiving pensions and working full time each earn more. Those
working in the government earn less than those working in the private nonacademic sector. Age
shows the standard concave pattern with earnings. Thus, for the academics in the sample, the
age coefficients do not reflect Ransom's (1993) finding that higher seniority for university
professors is associated with lower salaries, all else equal.
The results indicate that among academics those who view their primary activity as teaching
earn less and that only those in management science earn more than the excluded group,
economists. Although not reported, those in hard science earn more than 20 percent less than
economists with the gap larger in percentage terms in the nonacademic sector than in the
academic sector.
Importantly, a large decrement in earnings is associated with the critical mismatch variables.
If academic workers report that their education only relates somewhat, their earnings are 6.9

9
percent lower holding all else equal.2 The comparable earnings penalty for nonacademic
workers is 4.7 percent. If academic workers report that their education does not relate, their
earnings are 13.8 percent lower. The comparable earnings penalty for nonacademic workers is
9.8 percent. The greater penalty in academia may reflect a greater importance of appropriate
educational credentials or it may be that academic jobs not in a worker's Ph.D. field reflect a
greater degree of mismatch than is true for nonacademic jobs. Recalling that at least one
consensus estimate of the penalty associated with over-education was 14 percent, we are
estimating a mismatch penalty of roughly the same size. This is surprising as those estimates
were taken to measure the influence of having an unnecessary degree. While that may be true
for some of our mismatched workers, it need not be. Workers need only report that they are
working in an area (a subject matter) outside their degree.
Job satisfaction measures force workers to consider elements of the job in addition to
earnings. These elements include fringe benefits, interactions with coworkers, the value of the
work itself, relations with supervisors, hours and intrinsic rewards to name only a few. As
Hamermesh (2000) argues, job satisfaction measures, at their best, hope to capture the sum of
utility derived from all aspects of the job.
As the job satisfaction measure is an ordered response, the estimation follows a cumulative
normal in an ordered probit. The results in Table 4 confirm some expectations from past work
on job satisfaction but present a few surprises. Women do not emerge as the "contented
workers" that estimations on general populations often report (Clark 1997). Women in
nonacademic jobs have the same job satisfaction as men while women in academia report lower
2 The coefficient β is transformed into a percentage change in earnings, 1−βe .

10
job satisfaction holding all else constant.3 Blacks report lower job satisfaction as do those
working for larger employers. Many of the other results roughly follow the wage equations with
the married, supervisors, those working full time and those with pensions all reporting higher job
satisfaction. The pattern of discipline effects (suppressed to save space) also follows familiar
lines with those in engineering and the hard sciences reporting lower job satisfaction than the
excluded group, economists, and those in management reporting higher job satisfaction. The age
results do not follow the wage equation with job satisfaction declining with age but at a
decreasing rate. Job satisfaction declines well into mid career before starting to rebound. Ward
and Sloane (2000) find that satisfaction with salary decreases with age for male academics.
The mismatch variables are associated with substantially lower job satisfaction. For both
academics and nonacademics, working in jobs not related to their education is associated with a
highly significant and large reduction in overall job satisfaction. The magnitude of this influence
is understood by making projections. If we assume all variables are held at their mean levels
except the mismatch variables, we can use the cut points and project the probability of being in
each satisfaction level. As an illustration, if we assume that academic workers have the mean
characteristics and are in jobs closely related to their education, they have a 0.655 probability of
reporting the highest level of satisfaction, very satisfied. If they hold jobs only somewhat related
to their education, the probability of reporting being very satisfied drops to 0.543. Finally, if
they hold a job not at all related to their education, the probability of reporting being very
satisfied is only 0.428. A complete set of projections is available from the authors, but it is
apparent that the marginal influence of mismatch on job satisfaction is very large.
3 Bender and Heywood (2006) show that while women academics report lower job satisfaction than men, women in government report the same satisfaction as men while women in business report greater satisfaction than men.

11
As discussed, one advantage of the SDR is the ability to follow the workers two years after
the 1997 survey to determine whether or not they have changed their job. This measure of
turnover is a dichotomous measure and becomes the dependent variable in probit specifications
as shown in the last two columns of Table 4. These estimations repeat some familiar patterns.
Those who are supervisors and have fringe benefits are less likely to have changed jobs with the
latter perhaps reflecting deferred compensation that binds workers to employers.4 Job change
becomes more likely with age but eventually turns around and becomes less likely late in life.
This is the inverse of the statistical pattern between age and job satisfaction reinforcing previous
research that job satisfaction is inversely related to changing jobs. Black workers appear no
more likely to change jobs than do white workers while those in large firms are more likely to
change jobs.
The critical mismatch variables reveal that those working positions not related to their
education have a higher probability of turnover than those in positions closely related to their
education: 9.0 percentage points higher for academics and 6.2 percentage points higher for
nonacademics. Given that the average turnover rate across the two subsamples is slightly above
18 percent, these are very large marginal effects. Again, there is a more muted effect for a
worker being in a field only somewhat related to their education. Among academics, these
workers are 4.5 percentage points more likely to change jobs and among nonacademics, these
workers are 4.2 percentage points more likely to change jobs. The marginal effects for both of
these degrees of mismatch are statistically significant for each subsample.5
4 Such an implication makes sense to the extent that pensions are back-loaded (as in defined benefit plans – see Lazear 1979) and to the extent that health insurance creates "job lock" making mobility difficult (Adams 2004). 5 We altered our definition of job change restricting it to include only those workers who simultaneously changed jobs and employers. This removes normal promotions from being classified as job changes but runs the risk of excluding real job changes within an employer. The mismatch coefficients remain statistically significant and of the same direction. Mismatch continues to increase the probability of job change.

12
Our examination of the consequences of mismatch presents a consistent picture. Using this
primary indicator of mismatch, we find routine and robust partial correlations. Mismatch
remains associated with lower wages, lower job satisfaction and an increase probability of
changing jobs.
Other Indicators of Mismatch
The other survey measures related to mismatch present a similar, if slightly less dramatic,
picture. Our estimates of the earnings equations used precisely the same set of controls as
reported in Table 4 but merely replaced the mismatch variables with their alternatives. As the
first panel in Table 5 shows in specification 2, academics who find their work not very similar to
their expectations at the time of degree completion have 9.2 percent lower earnings while
nonacademics who find their work not very similar to their expectations have 6.4 percent lower
earnings. Academics who report that they would not be very likely to repeat their Ph.D. degree in
the same field have 9.5 percent lower earnings while those nonacademics who report the same
thing have 8.7 percent lower earnings when compared to those very likely to repeat their degree.
All of the coefficients from which these percentage measures are statistically significant at the
five percent level and serve to further confirm the suggestion that mismatch among the highly
educated is associated with reduced earnings.
The results on job satisfaction are more dramatic with substantially larger declines than those
associated with the original mismatch indicator. Academics whose work is not very similar to
their expectations have a 30.4 percentage point reduction in the probability of being in the
highest satisfaction category compared to those whose work is similar to their expectations (this
is now a marginal effect). Nonacademics whose work is not very similar to their expectations
have a 28.2 percentage point reduction in the probability of being in the highest satisfaction

13
category. Those academics not very likely to repeat their degree have a 40.5 percentage point
reduction in the probability of being in the highest satisfaction category and those nonacademics
whose work is not similar to expectations have a 30.8 percentage point reduction in the same
probability. While these secondary measures may simply be alternative satisfaction measures, it
remains possible that they capture important elements of mismatch as each directs the respondent
to compare their work to an aspect of their education. To the extent this is correct, the results
serve to confirm those presented with the original indicator.
The two secondary measures of mismatch also reinforce the results on job turnover. Those
academics whose expectations are not very similar are 7.4 percentage points more likely to
change jobs and those nonacademics whose expectations are not very similar are 10.9 percentage
points more likely to change jobs. Academics who would not be likely to repeat their graduate
education are 5.8 percentage points more likely to change jobs and nonacademics who are not
very likely to repeat their graduate education are 6.9 percentage points more likely to change
jobs compared to those who are very likely to repeat their graduate education. Thus, the
secondary measures show a somewhat different pattern on job change that suggests that
mismatch is more likely to result in job change for nonacademics than for academics.
Nonetheless, the general patterns are similar across all three measures and across all three
consequences. All of the coefficients for both levels of mismatch are statistically significant at
the one percent level.
The Role of Reasons for Mismatch
In this section we expand the dimensions of mismatch including in the analysis the reasons that
workers see themselves as mismatched. The SDR asks each respondent who identifies
themselves as in a job that does not at all relate to their education what is the most important

14
reason why they have taken such a job. The reasons (with percentages giving that reason in
parentheses) include: better pay and promotion opportunities (20.3%), better working conditions
(4.2%), the job's location (4.7%), family-related reasons (5.8%), a job is not available in their
doctoral field (24.5%), a change in career/professional interests (28.6%) or other (11.9%). The
vast majority of workers cite one of three responses: better pay and promotion, the lack of jobs or
changed interests. We transform these into a series of dummy variables to replace the previous
general measure of job and education not at all related.
Table 6 summarizes earnings regressions in which the reasons for mismatch replace simply
being in a job not very closely related to one's education. It is clear that a change in career
interests is associated with the smallest decline in earnings while being mismatched to improve
pay and promotion opportunities shows up increasing earnings by slightly more than 7 percent.
Once these are controlled for, the other reasons for being mismatched are associated with
remarkably large declines in earnings. Workers mismatched because of no jobs in the field,
suffer a 28.1 percent penalty and those mismatched for family related reasons suffer a 36.4
percent penalty. Approximately one-quarter of those in jobs unrelated to their education identify
no jobs in their field and 7.3 percent of all respondents indicate that their jobs are unrelated to
their education. Thus, slightly less than two percent of the doctoral recipients report being
mismatched because of a lack of jobs in their field.
The difference by gender is also highlighted in Table 6. The extremes are more pronounced
in the female sample. The gain associated with being mismatched because of a desire for better
pay and promotion shows women earning 22.6 percent more. At the same time, the loss
associated with being mismatched because of family reasons is a staggering 55.9 percent.

15
Women who cite their family as a reason for their job and education not being related are earning
less than half what would otherwise be the case.
The augmented job satisfaction estimates reveal that mismatch is never associated with
greater job satisfaction even when it is associated with greater pay or promotion opportunities.
All of the coefficients in the right hand side of Table 6 are negative including that on pay and
promotion opportunities. This pattern suggests that those who leave their doctoral discipline
behind in order to earn more are not pleased with the decision. The need to meet budget
expenses or provide a better standard of living for one's family may come at the cost of working
in an area the scientist would rather pursue. Indeed, Preston (2004) highlights just this kind of
tradeoff in exploring those scientists who choose to work outside of science. While it need not
be the case that all of those mismatched in our sample have left science, working outside one's
education in order to earn more comes with reduced job satisfaction. When looking within
genders, it is clear that even for women who reported a more than 20 percent increase in earnings
associated with working outside their educational field in order to improve pay and promotion
opportunities, the move brought no improvement in job satisfaction. More generally, to the
extent that job satisfaction can be taken as an indicator of utility, the fact that mismatch is never
associated with increased utility (even when associated with increased income) further illustrates
its high social costs.6
6 The augmented estimation of the turnover equations were also estimated. There were fewer statistically significant reasons for mismatch. The importance of the absence of jobs and the change in career interests emerged as positive determinants of turnover. There were no significant negative determinants of turnover and there were few differences by gender.

16
4. Using the Panel Data
One of the important aspects of the SDR is its longitudinal design. While not all variables
are available in all years, we undertake a series of panel estimates to confirm the largely cross-
sectional results of the previous sections. In particular, we are concerned that workers who are
less productive will naturally earn less and, perhaps, be less satisfied and subject to greater
turnover. Yet, the fact that they are less productive also makes such workers more likely to be
mismatched. To the extent that our controls in the cross sectional analysis above do not capture
differences in productivity, the associations we have shown run the risk of merely reflecting
fixed worker effects rather than the true influence of an exogenous mismatch.
In order to examine this issue, we use five waves of the public use SDR sample for 1993,
1995, 1997, 1999 and 2001. As mentioned, job satisfaction is only available in 1997 and the
finest breakdown by discipline is unavailable in the public use data. An additional limitation of
the public use data is that annual earnings are rounded to the nearest thousand and top-coded at
$150,000. Recognizing these limitations, we use the public use data to estimate an earnings
equation across these five waves (in 2001 dollars). Accounting for individual fixed effects, the
unbalanced panel estimation examines the role of mismatch on earnings. The variables that are
constant across waves such as race and gender drop out of the estimation, while the coefficients
on the mismatch variables reflect the consequences of individual workers changing in the degree
of mismatch. However, these coefficients should be purged of the role of individual effects such
as lower productivity that might simultaneously generate both mismatch and lower earnings.
Table 7 presents the estimations and reveals that all of the coefficients on the mismatch
variables remain negative and statistically significant. This happens despite the errors in
variables associated with the public use sample. Academics no longer show a larger earnings
17
penalty for mismatch. Women have a large penalty associated with being somewhat mismatched
but the penalty for education and job not relating at all is essentially the same for men and
women. Most notably, and as anticipated, controlling for fixed effects causes the coefficients
themselves to be smaller. Indeed the percentage penalty associated with mismatch is roughly
half the size, on average, as that estimated in the cross-section. We are quick to emphasize that
this should be taken with care as the specification and construction of the variables differ
between the two sets of estimations. Nonetheless, the fixed effect estimates emerge as smaller
but still routinely negative and statistically significant.
In addition to controlling for fixed effects, the panel data can help inform the extent to which
mismatch reflects temporary disequilibrium. Rubb (2003) has estimated that less than one in
five overeducated worker moves to being matched within one year. Beginning with the group of
workers that are in jobs either not related or only somewhat related to their education in 1997,
only 25.7 percent reported closely related jobs in 1999 and only slightly more, 27.0 percent,
reported closely related jobs four years later in 2001. Thus, the vast majority of those
mismatched in the core year of our study remain so four years later suggesting that mismatch and
its consequences are persistent.7
The Influence of Age on the Penalty for Mismatch
The complementarity between education and the experience gained working in the field of one's
education may generate a quality and quantity of human capital not generated for those who are
mismatched. As this process of accumulating human capital and receiving a return on that
investment takes time, it seems sensible that the penalty to being mismatched may be small in
the early years of a career but grow larger in the later years of a career. To test this hypothesis
7The base group of workers in 1997 differs between these two years because of attrition that is substantial in the SDR. We did examine the determinants of those who dropped out between 1997 and 1999 finding that mismatch itself is not a significant determinant.

18
we added interactions between the mismatch indicators, how closely one's education and job
relate, and the age and age squared variables. These interactions were added to the earnings
specification.
The results provide broad confirmation that the penalty associated with mismatch is larger
for older workers. The upper left panel of Figure 1 shows the predicted log earnings from a
cross-sectional estimate for a hypothetical female worker with mean female characteristics as she
ages. The upper right panel shows the same cross-sectional estimate for a hypothetical male
worker with mean male characteristics. The pattern generally shows the lower earnings for those
in jobs that only somewhat related and the still lower earnings of those in jobs that do not relate
at all. As anticipated, the size of the penalty associated with mismatch for older workers
typically exceeds that for younger workers. Men face a small penalty early in their careers for
being mismatched, but it grows dramatically. At age 62 the penalty for being in a job that does
not relate at all is $15,498 (20.9 percent) compared with only $725 (1.8 percent) at age 28.
Women appear to face a penalty that starts larger, grows quickly in the early years, leveling off
and actually shrinking slightly very late in their careers. Thus, at age 62 the penalty for being in
a job that does not relate at all is $5,411 (10.4 percent) compared with a large $2,912 (8.6
percent) at age 28.
On the other hand, it might be argued that these cross-sectional estimates identify differences
across cohorts but give no guide as to what happens when a single cohort ages. The lower panels
of Figure 1 repeat the unbalanced panel wage estimations with the age-mismatch interactions for
the five waves taken from the public use sample. The coefficients on the interactions with age
come from the actual aging of workers as fixed effects hold worker specific determinants
constant. The pattern identified in the cross-sectional estimates is at least as evident in the fixed

19
effect panel estimates. The size of penalty grows as workers age. While the dollar values of the
penalties are smaller in the panel estimates, the tendency for the penalty to shrink slightly late in
the work life of women is absent. The estimations make clear that more than simple cohort
effects are reflected in the tendency for the mismatch penalty to grow as workers age.
5. Determinants of Mismatch
In an attempt to describe the mismatched we return to our broad mismatch measures and
estimate their determinants. For each of these variables, we use the broad controls examined to
date as potential determinants. As each of the mismatch variables has three ordered responses,
the estimations follow an ordered probit specification measuring the degree of mismatch. In
general, the results suggest that mismatch is likely to result from a dating of scientific skills.
The first column of Table 8 estimates the extent of mismatch as measured by the closeness of
job and education. The results indicate that the likelihood of mismatch increases with age but at
a decreasing rate. However, the coefficients are such that the likelihood of mismatch increases
(the net coefficient across both terms is positive) until the age of 57. Thus, throughout most of a
scientist's work life the chance of mismatch increases with age. This pattern is reinforced by the
specifications using the other measures of mismatch and tends to indicate that mismatch is
associated with retaining an older vintage of scientific knowledge and skills.
The married, those working full time and supervisors are less likely to report being
mismatched. Similarly, those in academia and government are less likely to report be
mismatched. Two of the three indicators suggest women are more likely to be mismatched all
else equal.
20
Compared to those who do primarily research, those who have a primary activity of teaching
are less likely to be mismatched but those who manage are more likely to be mismatched. The
latter correlation would tend to support the commonly observed career path within private
industry where scientists move from the lab to the front office or within academia where they
leave the lab for administration. Again, this may reflect the vintage of scientific skills. This
transition might be evidenced by the fact that those in the largest employers are more likely to be
mismatched. These workplaces have the largest internal labor markets and longest career ladders
and can more easily make such transitions available to scientists. Interestingly, those who have a
primary activity of using the computer are also more likely to be mismatched. This may reflect
that some of those who are mismatched have been forced to reduce the scope of their knowledge
to a single activity often in a supportive rather than lead research role.
Finally, the pattern of fields may be seen as further evidence on the role of vintage. The
fields that are least likely to be mismatched are economics (the base category) and other social
science while those among the most likely to be mismatched are hard science, computer science
and health science. Such a pattern might be expected if the vintage of knowledge is less crucial
in the former fields than in the latter fields. Another way of putting this is that the speed of
change in the former fields is much slower than in the latter fields making mismatch less likely.
6. Conclusions
This paper has examined the consequences of job mismatch among the most highly educated
workers in the economy. These workers of the knowledge economy are often thought to be
critical for technological progress and growth. Understanding the consequences of mismatch is

21
important when considering governmental policies toward scientific education including issues
of subsidizing students, supporting universities and encouraging technology transfer.
The evidence assembled here uses three related measures of mismatch from the Survey of
Doctoral Recipients and estimates their influence on three job outcomes: earnings, job
satisfaction and turnover. Mismatch is associated with worse outcomes: lower wages, lower job
satisfaction and higher turnover. This persists across substantial variations in estimation and
holds for academics and nonacademics and for men and women. The size of the influences was
surprisingly large with double digit percentage earnings reductions in earnings, being 20
percentage points less likely to report high job satisfaction and a 1/3 increase in the turnover rate.
The fixed effect panel estimates suggest a statistically significant earnings penalty of about half
the size estimated in the cross-section.
While this paper has not tried to estimate rates of return (either public or private) on scientific
education, one cannot help but be concerned about the implications of these findings. The
primary mismatch variable indicates one in six academics report a degree of mismatch and
nearly one in two nonacademics report a degree of mismatch. Given the large share of
mismatched workers and the apparently severe consequences of mismatch a thorough review of
policy options would seem in order.
Our attempts to estimate the determinants of mismatch suggest that there may be substantial
vintage effects at work as the fields in which the knowledge base changes most quickly appear to
be associated with a greater chance of being mismatched. Also, there appears to be confirmation
of the typical pattern of moving from the first line of science research into more administrative
positions as scientists age. Moreover, the influences of the reasons for mismatch are particularly
interesting. Those who are mismatched in an attempt to earn more, do earn more but remain less

22
satisfied. This is intriguing and suggests greater inquiry into exactly what these individual do
and whether they regret the decision to remain matched. If they do, it might be worth
considering the options for recreating matches.

23
References
Adams, Scott J. 2004. "Employer-provided Health Insurance and Job Change," Contemporary Economic Policy, 22: 357 - 69.
Allen, Jim and Rolf van der Velden. 2001. "Education Mismatches versus Skill Mismatches,"
Oxford Economic Papers 53: 434 – 52. Battu, Harminder, Clive Belfield and Peter Sloane. 1999. "Over-education among Graduates: A
Cohort View," Education Economics 7: 21 – 38. Belfield, Clive R. 2000. Economic Principles for Education: Theory and Evidence, Cheltenham
UK: Edward Elgar. Belfield, Clive R. and R.D.F. Harris. 2002. "How well do Theories of Job Matching Explain
Variations in Job Satisfaction across Educational Levels? Evidence for UK Graduates," Applied Economics 34: 535 – 48.
Belman, Dale and John S. Heywood. 1997. "Sheepskin Effects by Cohort: Implications of Job-
Matching in a Signaling Model," Oxford Economic Papers 49: 623 - 37. Bender, Keith A. and John S. Heywood. 2006. "Job Satisfaction of the Highly Educated: The
Role of Gender, Academic Tenure and Comparison Income," Scottish Journal of Political Economy, 53(2): 253 – 79.
Borghans, Lex, Allard Bruinshoofd and Andries de Grip. 2000. "Low Wages, Skills and the
Utilization of Skills," in The Overeducated Worker, eds. Lex Borghans and Andries de Grip, Cheltenham UK: Edward Elgar.
Buchel, F. 2002. "The Effects of Overeducation on Productivity in Germany: The Firm's
Viewpoint," Economics of Education Review 21: 263 – 75. Chevalier, Arnaud. 2003. "Measuring Over-education," Economica 70: 509 – 31. Clark, Andrew E. 1997. "Job Satisfaction and Gender: Why are Women so Happy at Work?"
Labour Economics 4: 341 – 72. Clark, Andrew E. and Andrew J. Oswald. 1996. "Satisfaction and Comparison Income," Journal
of Public Economics 61: 359 – 81. Dolton, Peter and A. Vignoles. 2000. "The Incidence and Effects of Over-education in the UK
Graduate Labor Market," Economics of Education Review 19: 179 – 98. Freeman, Richard. 1978. "Job Satisfaction as an Economic Variable," American Economic
Review 68: 135 – 41.

24
Freeman, Richard. 1976. The Over-Educated American, New York: Academic Press. Groot, Wim. 1993. "Overeducation the Returns to Enterprise Related Schooling," Economics of
Education Review 12: 299 – 309. Groot, Wim and Henriette Maasen van den Brink. 2000. "Over-education in the Labor Market: a
Meta-Analysis," Economics of Education Review 19: 149 – 58. Hamermesh, Daniel. 2000. "The Changing Distribution of Job Satisfaction," Journal of Human
Resources 36: 1 – 40. Kim, B. and H. Oh. 2002. "Economic compensation compositions preferred by R& D personnel
of different R& D types and intrinsic values," R & D Management 32: 47 – 59. Lazear, Edward P. 1979. "Why is there Mandatory Retirement?" Journal of Political Economy
87: 1261 – 84, Levin, Sharon and Paula Stephan. 1991. "Research Productivity over the Live Cycle: Evidence
for Academic Scientists," American Economic Review 81: 114 – 32. McGoldrick, K. and J. Robst. 1996. "Gender Differences in Overeducation: A Test of the Theory
of Differential Overqualification," American Economic Review 86: 280 - 84. Moshavi, D. and J. R. Terborg. 2002. "The Job Satisfaction and Performance of Contingent and
Regular Customer Service Representatives: A Human Capital Approach," International Journal of Service Industry Management 13: 333 – 47.
National Science Board. 2003. The Science and Engineering Workforce: Realizing American's
Potential. Arlington VA: National Science Foundation. Preston, Anne E. 2004. Leaving Science: Occupational Exit From Scientific Careers, New York:
Russell Sage Foundation. Ransom, Michael. 1993. "Seniority and Monopsony in the Academic Labor-Market," American
Economic Review 83: 221 – 33. Rubb, S. 2003. "Overeducation: A Short or Long run Phenomenon for Individuals?" Economics
of Education Review 22: 389 – 94. Sattinger, Michael. 1993. "Assignment Models of the Distribution of Earnings," Journal of
Economic Literature 31: 851 – 80. Sloane, Peter J., Harminder Battu and Paul Seaman. 1996. "Over-education and the Formal
Education/Experience and Training Trade-off," Applied Economics Letters 3: 511 -515.
25
Solomon, Lewis C., Laura Kent, Nancy L. Ochsner and Marog-Lea Hurwicz. 1981. Underemployed Ph.D.s, Lexington, MA: D.C. Heath and Company.
Stephan, Paula. 1996. "The Economics of Science," Journal of Economic Literature 34: 1199 -
1235. Stephan, Paula and S.S. Everhart. 1998. "The Changing Rewards to Science: The Case of
Biotechnology," Small Business Economics 10: 141 – 51. Stephan, Paula and Sharon Levin. 1991. "Ph.D. Supply," Issues in Science and Technology 7: 28
– 29. Teitelbaum, M.S. 2004. "Do We Need More Scientists?" in The US Scientific and Technical
Workforce: Improving Data for Decision Making, eds. TK. Kelly, W.P. Buts, S. Carroll, D.M. Adamson and G. Bloom, Santa Monica CA: Rand Corporation.
Thurow, Lester. 1975. Generating Inequality, New York, NY: Basic Books. Tsang, Mun C. and Harold Levin. 1985. "The Economics of Overeducation," Economics of
Education Review 4: 93 – 104. Tsang, Mun C. 1987. "The Impact of Underutilization of Education on Productivity: a Case
Study of the US Bell Companies," Economics of Education Review 6: 239 -54. Ward, Melanie and Peter J. Sloane. 2000. "Non-Pecuniary Advantages Versus Pecuniary
Disadvantages: Job Satisfaction Among Male and Female Academics in Scottish Universities," Scottish Journal of Political Economy 47: 273 – 303.
Wolbers, M. 2003. "Job Mismatches and their Labor-Market Effects among School-Leavers in
Europe," European Sociological Review 19: 249 – 66.
26
Table 1: Means of the Variables All Academic Nonacademic Mismatch Variables Job and Education closely related (excl) 0.693 0.835 0.564 Job and Education related 0.234 0.141 0.319 Job and education not related 0.073 0.024 0.118 Job very similar to expectations 0.469 0.617 0.333 Job similar to expectations 0.325 0.289 0.359 Job not very similar to expectations 0.206 0.094 0.308 Very likely to choose similar field 0.549 0.601 0.503 Somewhat likely to choose similar field 0.302 0.281 0.320 Not likely to choose similar field 0.149 0.118 0.177 Dependent Variables Annual salary $70,449 $59,881 $80,070 (48905) (39116) (54608) Satisfaction with job 3.399 3.426 3.373 (0.741) (0.734) (0.747) Changed jobs 0.183 0.136 0.226 Demographic Variables Female 0.230 0.260 0.203 White, non-Hispanic (excl) 0.818 0.832 0.805 Asian, non-Hispanic 0.133 0.108 0.155 Hispanic 0.023 0.027 0.019 Black, non-Hispanic 0.023 0.029 0.017 Other race, non-Hispanic 0.004 0.004 0.003 Age 47.5 47.7 47.3 (9.8) (10.1) (9.6) Age squared 2352.1 2373.9 2332.3 (966.4) (989.6) (944.4) Married 0.794 0.786 0.802 Northeast region 0.078 0.086 0.072 Middle Atlantic region 0.163 0.155 0.170 East North Central region 0.137 0.155 0.121 West North Central region 0.063 0.079 0.048 South Atlantic region 0.184 0.162 0.205 East South Central region 0.043 0.058 0.029 West South Central region 0.079 0.087 0.071 Mountain region 0.069 0.067 0.070 Pacific region 0.182 0.149 0.213 Job Variables Supervisor 0.534 0.497 0.568 Full time employment 0.922 0.937 0.909 Pension is available 0.817 0.902 0.740 Profit sharing is available 0.882 0.953 0.818 Employer size<1000 (excl) 0.261 0.117 0.392 Employer size>1000 & <5000 0.044 0.051 0.038 Employer size>5000 0.695 0.831 0.571 # memberships in prof. org. 2.472 2.943 2.042 (1.941) (2.021) (1.759)

27
Academic Sector 0.477 1.000 0.000 Business Sector (excl) 0.103 0.000 0.197 Government Sector 0.420 0.000 0.803 Research is main work activity (excl) 0.407 0.371 0.439 Teaching is main work activity 0.218 0.450 0.007 Management is main work activity 0.161 0.092 0.225 Computer work is main work activity 0.048 0.013 0.080 Other main activity 0.166 0.073 0.250 Discipline Indicators Economics (excl) 0.030 0.040 0.020 Computer 0.040 0.006 0.071 Math 0.047 0.081 0.017 ‘Hard’ Science 0.328 0.392 0.269 Social Science (not Economics) 0.171 0.198 0.146 Engineering 0.135 0.093 0.172 Management 0.137 0.077 0.192 Health 0.028 0.023 0.032 Teacher 0.040 0.081 0.003 Other (nonscience) Occupation 0.045 0.010 0.077
Note: All means are weighted using sample weights. Numbers in parentheses are standard deviations for continuous variables. ‘(excl)’ indicates that this variable was a reference variable in the regressions.

28
Table 2. Frequency Distribution between Three Mismatch Variables
How Related is Job and Education Not Closely Related Closely Related Very Closely Related
Job not very similar to expectations 5.54 9.14 4.59 Job similar to expectations 0.79 10.67 21.59 Job very similar to expectations 0.64 3.65 43.39 Not likely to choose same field 2.78 4.75 7.39 Somewhat likely to choose same field 2.10 8.51 19.95 Very likely to choose same field 2.09 10.21 42.23
Table 3: Educational Mismatch, Earnings, Job Satisfaction and Turnover by Discipline and Sector Discipline
Sector
% Closely Related
% Very Satisfied
Average Salary
% Change Jobs
All Academic Nonacademic
83.5 56.4
54.8 50.9
$59,881 80,070
13.6 22.6
Economics Academic Nonacademic
97.8 76.5
56.6 55.1
62,911 88,308
10.6 19.5
Social Science Academic Nonacademic
93.7 88.7
55.8 55.7
51,986 63,918
12.0 14.6
Computer Science
Academic Nonacademic
38.4 28.6
59.9 43.5
63,172 78,025
26.9 26.1
Math Academic Nonacademic
86.9 68.7
51.3 50.2
56,565 76,758
10.2 18.2
Hard Science Academic Nonacademic
85.9 66.9
54.1 48.9
56,067 72,572
14.4 22.5
Engineering Academic Nonacademic
87.7 57.2
53.8 44.7
68,200 80,444
11.6 22.3
Management Academic Nonacademic
55.7 41.9
63.9 57.4
90,202 104,885
18.4 29.3
Health Academic Nonacademic
50.5 39.8
55.6 58.1
80,098 101,106
19.9 13.7
Other Disciplines Academic Nonacademic
35.0 17.4
45.0 48.6
39,462 65,627
22.9 23.6
Note: % Change jobs – includes those who changed jobs regardless of whether or not they changed employers.
29
Table 4. Regressions Estimating the Consequences of Mismatch Ln(Annual Earnings) Job Satisfaction Changed Jobs?
Variable Academic Non-
academic Academic Non-
academic Academic Non-
academic Job-Educ somewhat related -0.072*** -0.048*** -0.327*** -0.347*** 0.045*** 0.042*** (-5.55) (-4.03) (-9.32) (-13.42) (3.76) (3.48) Job-Educ not related -0.148** -0.103** -0.522** -0.461*** 0.090*** 0.062*** (-3.90) (-4.76) (-6.48) (-10.77) (3.12) (3.27) Female -0.128*** -0.138*** -0.123*** 0.026 0.029*** 0.037*** (-14.00) (-9.44) (-4.69) (0.911) (3.19) (2.93) Asian, non-Hispanic -0.065*** -0.029** -0.120*** -0.141*** -0.021* -0.039*** (-4.65) (-2.32) (-3.49) (-4.76) (-1.71) (-2.74) Hispanic -0.046*** 0.008 0.058 -0.077 -0.002 -0.062** (-2.77) (0.22) (0.94) (-1.14) (-0.08) (-2.53) Black, non-Hispanic -0.028 -0.011 -0.163*** -0.141** -0.017 0.023 (-1.63) (-0.35) (-2.86) (-2.01) (-1.04) (0.69) Other race, non-Hispanic -0.151*** -0.011 -0.248* -0.245 -0.004 0.135 (-4.12) (-0.17) (-1.77) (-1.38) (-0.10) (1.50) Age 0.066*** 0.087*** -0.057*** -0.065*** -0.041*** -0.044*** (16.36) (16.07) (-5.64) (-6.67) (-12.78) (-10.14) Age squared -6.6E-2*** -8.7E-2*** 7.1E-4*** 7.4E-4*** 4.1E-4*** 4.4E-4*** (-12.57) (-14.24) (6.93) (7.31) (12.67) (9.83) Married 0.036*** 0.098*** 0.156*** 0.149*** -0.016 0.012 (3.63) (6.45) (5.46) (5.16) (-1.64) (0.98) Supervisor 0.123*** 0.108*** 0.110*** 0.152*** -0.033*** -0.031*** (14.51) (9.11) (4.22) (6.07) (-3.62) (-2.76) Full time 0.533*** 0.632*** -0.037 0.105** -0.051** -0.071*** (16.72) (17.26) (-0.74) (2.24) (-2.55) (-3.34) Pension 0.303*** 0.132*** 0.192*** 0.132*** -0.059*** -0.051*** (15.09) (7.37) (4.60) (3.48) (-3.77) (-2.83) Health insurance 0.427*** 0.070** 0.055 -0.279*** -0.054** 0.063*** (10.39) (2.58) (0.91) (-5.95) (-3.27) (3.20) Profit sharing 0.027 0.100*** 0.109* 0.189*** -0.007 -0.025** (1.39) (8.98) (1.89) (6.97) (-0.39) (-2.13) Empl size>1000 & <5000 0.044** -0.013 0.041 -0.296*** -0.027 0.093*** (1.97) (-0.49) (0.66) (-5.34) (-1.42) (3.28) Empl size>5000 0.048*** 0.034** -0.077** -0.195*** 0.023** 0.066*** (3.41) (2.41) (-2.03) (-6.44) (2.02) (4.83) # prof. memberships 0.032*** 0.024*** 0.028*** 0.016** -0.010*** -0.003 (14.28) (7.44) (4.42) (2.18) (-4.91) (-1.09) Gov’t, nonacademic -0.178*** -0.023 (-13.10) (-0.66) Teaching is main activity -0.135*** -0.083 -0.050* 0.383*** -0.043*** (-14.42) (-0.93) (-1.70) (2.72) (-2.92) Manag. is main activity -0.005 -0.003 -0.055 -0.097*** -0.041*** -0.040 (-0.26) (-0.17) (-0.98) (-2.70) (-4.32) (-0.65) Computer is main activity -0.099** 0.033* -0.257** -0.092* 0.022 0.048*** (-2.35) (1.67) (-2.33) (-1.90) (1.25) (2.89) Other main activity 0.016 0.014 -0.017 -0.121*** 0.013 -0.042** (0.75) (0.76) (-0.33) (-3.30) (0.38) (-1.98)
Note: The number under the coefficient estimates are t-statistics. All estimates use sample weights and include controls for region of the country. Significance: ***, **, and * indicate 1%, 5%, and 10% respectively. Discipline indicators estimated but not reported. Cut points and constants also estimated where appropriate.

30
Table 5: Comparing Consequences across Different Measures of Mismatch Academic Nonacademic Log Annual Earnings Regression Specification 1 Education relates -0.072*** -0.048*** (-5.55) (-4.03) Educ does not relate -0.148*** -0.103*** (-3.90) (-4.76) Specification 2 Similar to expectations -0.031*** -0.050*** (-3.57) (-4.15) Not very similar -0.096*** -0.066*** (-5.19) (-4.67) Specification 3 Somewhat likely -0.050*** -0.060*** (-5.67) (-5.13) Not very likely -0.100*** -0.091*** (-7.51) (-5.89) Job Satisfaction ordered probit regression (marginal effects) Specification 1 Education relates -0.130*** -0.138*** (9.39) (-13.59) Educ does not relate -0.204*** -0.180*** (-6.83) (-11.27) Specification 2 Similar to expectations -0.234*** -0.199*** (-23.60) (-18.74) Not very similar -0.304*** -0.282*** (-19.48) (-23.03) Specification 3 Somewhat likely -0.238*** -0.179*** (-24.06) (-18.23) Not very likely -0.405*** -0.308*** (-37.37) (-28.40) Change Jobs probit regression (marginal effects) Specification 1 Education relates 0.045*** 0.042*** (3.76) (3.48) Educ does not relate 0.090*** 0.062*** (3.12) (3.27) Specification 2 Similar to expectations 0.038*** 0.070*** (4.26) (5.31) Not very similar 0.074*** 0.109*** (4.48) (7.13) Specification 3 Somewhat likely 0.039*** 0.026*** (4.31) (2.25) Not very likely 0.058*** 0.070*** (4.07) (4.83) Notes: Each specification includes the covariates listed in Tables 4-6, except where the measures of educational mismatch are replaced by the mismatch measures listed in this table. Significance: *** at the 1 percent level. Numbers in parentheses are t-statistics (for the earnings regression) or asymptotic z-statistics (job satisfaction and change jobs regressions). The results for the job satisfaction ordered probits are marginal effects of the probability of being in the highest job satisfaction category, holding all other variables at their mean value.

31
Table 6: Selected Earnings and Job Satisfaction Regressions Results – Simple and Augmented for Reasons for Mismatch
Log Annual Earnings Job Satisfaction Male Female Male Female
Specification 1 Job-Education Somewhat Related -0.039***
(-3.65) -0.069***
(-3.59) -0.144***
(-15.15) -0.120***
(-8.05) Job-Education Not at all Related -0.094***
(-4.47) -0.116***
(-2.73) -0.188***
(-11.64) -0.165***
(-6.37) r-squared or �2 statistic 0.353 0.336 952.40*** 350.44*** Specification 2 Job Education Somewhat Related -0.062***
(5.93) -0.084*** (4.38)
-0.141*** (14.82)
-0.121*** (8.03)
Pay and Promotion Opportunities 0.050 (1.43)
0.203** (2.29)
-0.135*** (4.45)
-0.059 (0.93)
Working Conditions
-0.244*** (2.82)
-0.203 (1.14)
-0.007 (0.10)
-0.104 (1.05)
Job Location
-0.313*** (4.49)
-0.220* (1.93)
-0.249*** (4.15)
-0.045 (0.43)
Family Related Reasons -0.228** (2.47)
-0.444*** (3.77)
-0.285*** (5.39)
-0.183*** (3.20)
Job Not Available in Field -0.257*** (6.27)
-0.201** (2.48)
-0.335*** (16.60)
-0.353*** (11.35)
Change in Career / Professional Interests -0.058 (1.59)
-0.104 (1.52)
-0.034 (1.17)
-0.025 (0.49)
Other Reason
-0.168** (2.33)
-0.239** (2.10)
-0.256*** (6.19)
-0.273*** (5.71)
r-squared or �2 statistic 0.377 0.368 1052.1*** 405.9*** Notes: Significance: ***, **, and * indicate 1%, 5%, and 10% respectively. Numbers under coefficient estimates are t-statistics. Marginal effects from the job satisfaction ordered probit regressions are shown for the probability of being in the highest job satisfaction category. The probability for males and females to be in the highest job satisfaction category (based on average characteristics) is 0.537 and 0.502, respectively. All variables from Table 4 are also included in the estimations.

32
Table 7: Mismatch Earnings Penalties from Fixed Effects Regressions Variable Full Academic Nonacademic Female Male Job-Education somewhat related -0.019*** -0.020*** -0.017*** -0.019** -0.011*** (-5.58) (-4.00) (-3.38) (-2.31) (-2.95) Job-Education not at all related -0.073*** -0.028** -0.069*** -0.058*** -0.059*** (-11.39) (-2.42) (-8.24) (-3.92) (-8.47) R-sq: within 0.174 0.181 0.117 0.139 0.181 R-sq: between 0.267 0.308 0.163 0.174 0.216 R-sq: overall 0.245 0.280 0.155 0.166 0.198 Variance of fixed effect 0.469 0.444 0.525 0.525 0.457 Variance of the error term 0.314 0.264 0.328 0.363 0.297 rho 0.691 0.738 0.719 0.677 0.704
Notes: Variables are in comparison to those who report their job and education are closely matched. The number under the coefficient estimates are t-statistics. Significance: ***, **, and * indicate 1%, 5%, and 10% respectively. Data are from the 1993, 1995, 1997, 1999, and 2001 SDR public use files. Earnings are in 2001 dollars. Other controls include: age, age squared, supervises individuals, full time contract, US citizenship, main activity is teaching, main activity is management, main activity is computer work, main activity is other, and principle job is mid/top level manager. ‘rho’ is the proportion of the variance due to the fixed effect.

33
Table 8. Determinants of Mismatch
Variable
Job and Education Not
Related Expectations Not Similar
Likelihood of Not adopting
the same Field Female 0.002 0.015*** 0.009** (0.88) (3.00) (2.07) Asian, non-Hispanic 3.3E-04 -0.020*** 0.073*** (0.17) (-3.48) (11.19) Hispanic -0.002 -0.004 -0.010 (-0.66) (-0.29) (-0.93) Black, non-Hispanic 0.002 -0.009 0.003 (0.45) (-0.76) (0.23) Other race, non-Hispanic 0.005 -0.003 0.013 (0.41) (-0.10) (0.49) Age 0.002*** 0.016*** 0.010*** (3.77) (8.98) (6.42) Age squared -2.0E-5*** -1.4E-04*** -1.2E-4*** (-3.24) (-7.71) (-7.59) Married -0.007*** -0.016*** -0.014*** (-3.75) (-3.02) (-2.89) Supervisor -0.012*** -0.022*** -0.031*** (-7.39) (-4.76) (-7.40) Full time -0.008** -0.036*** -0.013 (-2.27) (-3.58) (-1.56) Pension -0.013*** -0.008 -0.033*** (-4.52) (-1.09) (-4.61) Health insurance 0.002 -9.6E-04 0.023*** (0.83) (-0.10) (2.88) Profit sharing 0.004** 5.5E-04 -0.017*** (2.18) (0.09) (-3.19) Employer size>1000 & <5000 0.006 0.011 0.015 (1.32) (0.97) (1.42) Employer size>5000 0.007*** 0.005 0.016*** (3.73) (0.78) (3.17) Academic -0.035*** -0.113*** -0.039*** (-15.20) (-17.67) (-6.74) Government -0.010*** -0.010 -0.006 (-4.65) (-1.30) (-0.84) Teaching is main activity -0.012*** -0.020*** -0.014** (-5.69) (-3.08) (-2.54) Management is main activity 0.039*** 0.155*** 0.043*** (10.13) (15.80) (5.69) Computer is main activity 0.060*** 0.140*** 0.068*** (8.31) (8.58) (5.15) Other main activity 0.024*** 0.072*** 0.036*** (6.84) (8.25) (4.94)

34
Table 8 continued Computer discipline 0.257*** 0.250*** 0.020 (8.56) (8.46) (1.09) Mathematics discipline 0.051*** 0.028 -0.002 (3.81) (1.50) (-0.14) ‘Hard’ science discipline 0.045*** 0.048*** 0.025* (5.39) (3.07) (1.92) Social Science discipline -0.016*** -0.072*** -0.011 (-3.32) (-5.72) (-0.89) Engineering discipline 0.078*** 0.087*** 0.006 (5.73) (4.63) (0.43) Management science discipline 0.148*** 0.209*** 0.010 (7.78) (9.17) (0.73) Health science discipline 0.231*** 0.109*** -0.003 (7.86) (4.37) (-0.20) Teacher discipline 0.144*** 0.087*** 0.029* (6.34) (3.87) (1.73) Other (nonscience) discipline 0.411*** 0.446*** 0.091*** (12.21) (15.66) (4.47) Chi-squared 4839.7*** 4912.5*** 903.6***
Note: The number under the coefficient estimates are t-statistics. The coefficients are the marginal effects of being in the most mismatched category from ordered probit estimations. All estimates use sample weights and include controls for the region of the country. Significance: ***, **, and * indicate 1%, 5%, and 10% respectively.

35
Figure 1. Cross-Section and Panel Based Age-Earnings Profiles by Gender and Degree of Mismatch
Age-Earnings Profile by Degree of Mismatch for the Female SampleBased on Cross Section Estimates
20000
30000
40000
50000
60000
70000
80000
90000
25 26 27 28 29 30 31 32 33 34 35 36 37 38 39 40 41 42 43 44 45 46 47 48 49 50 51 52 53 54 55 56 57 58 59 60 61 62 63 64 65
Age
Pro
ject
ed A
nnua
l Ear
ning
s
Closely Relates Relates Does not relate
Age-Earnings Profile by Degree of Mismatch for the Male SampleBased on Cross Section Estimates
20000
30000
40000
50000
60000
70000
80000
90000
25 26 27 28 29 30 31 32 33 34 35 36 37 38 39 40 41 42 43 44 45 46 47 48 49 50 51 52 53 54 55 56 57 58 59 60 61 62 63 64 65
Age
Pro
ject
ed A
nnua
l Ear
ning
s
Closely Relates Relates Does not relate
Age-Earnings Profile by Degree of Mismatch for the Female SampleBased on Panel Estimates
20000
30000
40000
50000
60000
70000
80000
90000
25 26 27 28 29 30 31 32 33 34 35 36 37 38 39 40 41 42 43 44 45 46 47 48 49 50 51 52 53 54 55 56 57 58 59 60 61 62 63 64 65
Age
Pro
ject
ed A
nnua
l Ear
ning
s
Closely Relates Relates Does not relate
Age-Earnings Profiles by Degree of Mismatch for the Male SampleBased on Panel Estimates
20000
30000
40000
50000
60000
70000
80000
90000
25 26 27 28 29 30 31 32 33 34 35 36 37 38 39 40 41 42 43 44 45 46 47 48 49 50 51 52 53 54 55 56 57 58 59 60 61 62 63 64 65
Age
Pro
ject
ed A
nnua
l Ear
ning
s
Closely Relates Relates Does not relate