Education Service Quality, Value and Satisfaction on ...
24
89 Education Service Quality, Value and Satisfaction on Student Customer Intentions and Behaviour Dr. Garry Prentice Department of Psychology, Dublin Business School Dublin, Ireland. Dr. Joseph Brady Department of Marketing and Sales Management Research, SBS Swiss Business School Zurich, Switzerland. Dr. Christopher McLaughlin School of Business & Social Sciences, Institute of Technology Sligo Sligo, Ireland. © Garry Prentice, Christopher McLaughlin and Joseph Brady. This work is licensed under the Creative Commons Attribution-NonCommercial-ShareAlike 4.0 International License. To view a copy of this license, visit https://creativecommons.org/licenses/by-nc-sa/4.0/ . Abstract Traditional avenues of accreditation, module review and teaching evaluations are not the only ways to assess education service quality and related issues. In order to evaluate the education service provided by a private university in Ireland, this investigation utilized an extension of Cronin, Brady and Hult’s (2000) model examining the effects of quality, value and customer satisfaction on customer intentions and behaviour. The model predicts that positive perceptions of quality, value and satisfaction in relation to the education service encounter will lead to positive word of mouth, and future intention to use the service again. The Arts undergraduate student sample size was 260. The perception of a high price for the education service provided did not translate to high service value, and service quality was only shown to have an indirect effect on satisfaction, word of mouth behaviour and intentions to return to the university. Despite a slight majority stating that the service quality was above average, and the majority stating they were satisfied overall, only a minority indicated that they would use the service again. The underlying reasons for and implications from these findings and others are discussed. Keywords: Service quality; student satisfaction; retention; word-of-mouth Introduction With the proliferation of increasing economic stresses, online education platforms including Massive Open Online Courses (MOOCs), and global competition, higher education institutions face growing new threats and a potentially tumultuous future. As competition increases, there is a greater pressure for universities to re-examine traditional commercial management perspectives in academia and consider working more like a private enterprise rather than a bureaucratic organization. Although, the publicly funded institutions provide the majority of third level education provision in
Transcript of Education Service Quality, Value and Satisfaction on ...

89
Education Service Quality, Value and Satisfaction on Student Customer Intentions and Behaviour
Dr. Garry Prentice Department of Psychology, Dublin Business School
Dublin, Ireland.
Dr. Joseph Brady Department of Marketing and Sales Management Research, SBS Swiss Business School
Zurich, Switzerland.
Dr. Christopher McLaughlin School of Business & Social Sciences, Institute of Technology Sligo
Sligo, Ireland. © Garry Prentice, Christopher McLaughlin and Joseph Brady. This work is licensed under the Creative Commons Attribution-NonCommercial-ShareAlike 4.0 International License. To view a copy of this license, visit https://creativecommons.org/licenses/by-nc-sa/4.0/ .
Abstract Traditional avenues of accreditation, module review and teaching evaluations are not the only ways to assess education service quality and related issues. In order to evaluate the education service provided by a private university in Ireland, this investigation utilized an extension of Cronin, Brady and Hult’s (2000) model examining the effects of quality, value and customer satisfaction on customer intentions and behaviour. The model predicts that positive perceptions of quality, value and satisfaction in relation to the education service encounter will lead to positive word of mouth, and future intention to use the service again. The Arts undergraduate student sample size was 260. The perception of a high price for the education service provided did not translate to high service value, and service quality was only shown to have an indirect effect on satisfaction, word of mouth behaviour and intentions to return to the university. Despite a slight majority stating that the service quality was above average, and the majority stating they were satisfied overall, only a minority indicated that they would use the service again. The underlying reasons for and implications from these findings and others are discussed. Keywords: Service quality; student satisfaction; retention; word-of-mouth
Introduction With the proliferation of increasing economic stresses, online education platforms including Massive Open Online Courses (MOOCs), and global competition, higher education institutions face growing new threats and a potentially tumultuous future. As competition increases, there is a greater pressure for universities to re-examine traditional commercial management perspectives in academia and consider working more like a private enterprise rather than a bureaucratic organization. Although, the publicly funded institutions provide the majority of third level education provision in

90
Ireland, private higher education (PHE) institutions are a growing element of that provision, with fifteen PHE institutions represented by the Higher Education Colleges Association (HECA). Thus, the growing proliferation of PHE institutions in Ireland (the Irish institution selected for the present study is a PHE institution), suggests the greater need to be responsive to the needs of student service users (Tomlinson, 2017).
If an academic institution is to be more competitive, then logic would dictate that for the university to survive and grow, basic marketing concepts need to be implemented. Thus, marketing techniques are being applied regularly by a growing number of universities to achieve competitive superiority (Temple and Shattock, 2007; Wilkins, Shams and Huisman, 2013; Han, 2014). Current students are often a good marketing tool as they have similar characteristics to the prospective students and can be completely up to date in relation to what to expect about the offerings available at the university (Rudd and Mills, 2008). The challenge being that universities must consider the student from a commercial perspective, and not just an academic one. In an extension of a service marketing model (Cronin, Brady and Holt, 2000; See Figure 1), adding word of mouth recommendations, the present study examines the direct and indirect effects of student perceptions of sacrifice (effort, price and time), service quality performance, satisfaction and service value on education service related future intentions and word-of-mouth recommendations.
Perceived Education Service Quality and Student Satisfaction
Perceived service quality can be described as a consumer’s satisfaction with how well a service meets their expectations (Kelley, Donnelly, and Skinner, 1990; Hill, 1995; Sirvanci, 1996; Swan, Bowers, and Grover, 2002; Munteanu et al., 2010; Mark, 2013). When service delivery expectations are not met, institutions can run into potential problems. A possible scenario might be that the institution is not providing a service that matches the customers’ expectations (Zeithaml, Bitner and Gremler, 2006). In higher education, this could translate into a potential gap between the student’s expectations vs. perceptions and the service delivered vs. those promised by the university, leading to customer dissatisfaction in relation to service quality levels. Thus, dissatisfaction occurs because of a disconfirmation of expectations. As the foundations of service quality and satisfaction are based on the disconfirmation theory (Lacobucci, Grayson and Omstorm, 1994), many marketers have used the terms interchangeably despite research highlighting the distinctiveness of the constructs (Sureshchandar, Rajendran and Anantharaman, 2002).
The importance of distinguishing satisfaction and quality was illustrated by Cronin and Taylor (1992), when they pointed out service providers need to find out what their priorities should be when choosing their approach to delivery of quality. However, the academic service provider’s priority can be to deliver satisfied student customers who will then have a favourable view of education service quality, or they can prioritize the provision of a high-quality education service as an avenue to student satisfaction (Cronin and Taylor, 1992). Arguments put forward by Lazibat, Baković and Dužević (2014), Hoisington and Naumann (2003), Lee, Lee and Yoo (2000), Spreng and
91
MacKoy (1996), Cronin and Taylor (1992), amongst others, suggest that service quality perceptions lead to satisfaction, in contrast with the argument that student satisfaction is an antecedent to quality (Bolton and Drew, 1991; Bitner, 1990; Parasuraman, Zeithaml and Berry, 1988). The model tested in the current study takes the former view that good service quality leads to positive levels of student satisfaction.
H1 Perceptions of good service quality will have a significant positive impact on satisfaction.
The proposition that quality, when implemented effectively, does not cost anything was coined by Crosby (1979). The reason for this proposition was that organizations incur greater costs because of the deliverance of poor quality, while an improvement to general levels of quality would pay for itself through the reduction of costs incurred because of substandard quality (Eagle and Brennan, 2007). Eagle and Brennan (2007) also noted that a possible loss-of-reputation cost would occur if a student feels that they have been mistreated, breeding dissatisfaction with the education service provided, and as a result, encouraging the spread of negative word of mouth about the university. Failure to retain and expand a customer base is a serious limitation of any business; including private firms, universities and any institution that provides education services. As a result, the university could miss out on repeat student customers and the benefits of positive word of mouth recommendations (Nell and Cant, 2014). Thus, it is imperative to close the gaps between the promised service and the actual service delivered where necessary, through having the right service quality designs and standards. Universities should therefore, assess quality, not only through the traditional avenues of accreditation and module review, but also through the evaluation of factors that students feel are important in terms of their educational service quality provision (Oldfield and Baron, 2000). Service quality has a critical impact on competitiveness (Lewis, 1989), as poor service quality can adversely affect the re-purchase intentions of consumers if customer expectations are not met by adequate delivery or standards of the service (Ghobadian, Speller and Jones, 1994). In a higher education sense, re-purchase intentions would be returning to the university to undertake other courses (Marzo-Navorro, Pedraja-Iglesias and Rivera-Torres, 2005; Mavondo, Tsarenko and Gabbott, 2004; Schertzer and Schertzer, 2004). Quality shortfalls can lead to possible loss-of-reputation costs, including negative word of mouth about the university (Eagle and Brennan, 2007). In contrast, service quality positive perceptions can also attract new students through the spread of positive word of mouth (Voss, Gruber and Szmigin, 2007).
H2 Perceptions of good service quality will have a significant positive impact on behavioural intentions towards the university.
92
H3 Perceptions of good service quality will have a significant positive impact on number of word-of-mouth recommendations.
Service Quality has been measured using the SERVQUAL scale, but Cronin and Taylor (1992; 1994) went as far as to argue for the discarding of the expectancy component of the SERVQUAL scale, which then led to the construction of the SERVPERF scale, which had the advantage of being half the length of the SERVQUAL scale. The validity of using SERVPERF was supported by existing marketing literature thinking that the sole use of performance perceptions can reflect service quality (Parasurama, Zeithaml and Berry, 1994; Zeithaml, Berry and Parasuraman, 1996). The SERVPERF scale was used to measure service quality performance in the present study.
In relation to satisfaction’s overall role, Cronin and Taylor (1992) found that satisfaction is more influential in its effects on future intentions in relation to the service compared to service quality. Cronin and Taylor (1992) explained this finding by suggesting that customers may not purchase the best quality service, as availability, convenience or price positively influence satisfaction while having no impact on service quality perceptions. Another advantage of acquiring student satisfaction ratings in relation to facilities, courses and various education services is that this enhances student participation in the education experience (Nasser, Khoury and Abouchedid, 2008). Thus, as McCollough and Gremler (1999) concluded, examination of student satisfaction gives valuable insight into ways to improve the education experience by improving service areas where there are shortfalls. The scenario tested in this investigation is that satisfied students report favourable future intentions and word-of-mouth recommendations in relation to the higher education service.
H4 High levels of student satisfaction will have a significant positive impact on behavioural intentions towards the university.
H5 High levels of student satisfaction will have a significant positive impact on number of word-of-mouth recommendations.
Sacrifice and Service Value
Consistent with previous research, sacrifice is conceptualized as what the customer sacrifices in order to receive a service (Cronin, Brady and Hult, 2000). Rudd and Mills (2008) identified that high prices set by universities limit the number of potential possible students who could afford these courses. Not limited to money, other sacrifices such as time and effort are components of sacrifice (Cronin et al., 1997). Ledden, Kalafatis and Samouel (2007, p.966) specifically related sacrifice with

93
perceived value by stating “value perceptions are the result of a cognitive trade-off between benefits and sacrifices”.
H6 There will be a significant relationship between sacrifice and service value.
In the present study, service value is conceptualized using Zeithaml’s definition, “… perceived value is the consumers’ overall assessment of the utility of a product based on the perceptions of what is received and what is given” (1988, p. 14). The literature widely accepts this idea that value is perceived by the customer rather than objectively constructed by the seller (Setijono and Dahlgaard, 2007; Day and Crask, 2000; Woodruff, 1997). Value reflects the utility of the service by the customer; previously Cronin, Brady and Hult (2000) found that a perception of good service value had a positive impact on behavioural intentions towards the organization and satisfaction. This suggests that student customers who perceive higher value in regards to the education service provided are more likely to express greater satisfaction towards the university and also have higher levels of engagement with their university programme, leading to more positive recommendations to other prospective students. In the current investigation the impact of service value will be expanded to looking at its effect on number of word-of-mouth recommendations. Of course, it can also be argued that if a service is seen as having a high level of quality it will be also be valued (Lee, Hsieh and Cheng, 2016; Athanassopoulos, 2000; Chenet, Tynan and Money, 1999; Clow and Beisel, 1995; Fornell et al., 1996; Garbarino and Johnson, 1999; Roest and Pieters, 1997; Spreng, Mackenzie and Olshavsky, 1996; Zeithaml, Berry and Parasuraman, 1996).
H7 Perceptions of good service quality will have a significant positive impact on service value.
H8 Perceptions of good service value will have a significant positive impact on behavioural intentions towards the university.
H9 Perceptions of good service value will have a significant positive impact on number of word-of-mouth recommendations.
H10 Perceptions of good service value will have a significant positive impact on satisfaction.

94
Behavioural Intentions and Word-of-Mouth Recommendations
Behavioural intention is one of the final outcome variables in this model. Of course, increasing customer retention is a major component in relation to the power of a service provider to be profitable (Zeithaml, Berry and Parasuraman, 1996). Specifically, favourable behavioural intentions are correlated with a service provider’s power to persuade customers to “1) say positive things about them, 2) recommend them to other consumers, 3) remain loyal to them (i.e., repurchase from them), 4) spend more with the institution, and 5) pay price premiums” (Cronin, Brady and Hult, 2000, pp. 204-205). Thus behavioural intentions are included as an indicator of customer retention, and the probability of gaining positive word of mouth. The extension of this model (Cronin, Brady and Hult, 2000) entails the inclusion of actual behaviour in relation to repeat student custom and actual recommendations of the education service to others. As per Cronin, Brady and Hult.’s (2000) study, the overall prediction of this investigation is that positive perceptions of quality, value and satisfaction in relation to the service encounter will lead to favourable outcomes. The outcomes in this investigation are positive word of mouth, and future intention to use the service again. In addition, this research will examine the partial consensus from marketing literature (e.g. Lee, Hsieh and Cheng, 2016; Athanassopoulos, 2000; Chenet, Tynan, and Money, 1999; Clow and Beisel, 1995; Fornell et al., 1996; Garbarino and Johnson, 1999; Roest and Pieters, 1997; Spreng, Mackenzie, and Olshavsky, 1996; Zeithaml, Berry and Parasuraman, 1996) that favourable attitudes towards service quality lead to high levels of value attached to the service, which in turn leads to improved satisfaction levels. In an extension of this area of service marketing research, this investigation will also examine the indirect effects of service quality, sacrifice and service value on positive future intentions and likelihood of positive word-of-mouth in relation to education services offered.
H11 Positive perceptions in relation to service quality will have a significant positive indirect effect on satisfaction.
H12 Positive perceptions in relation to (a) service quality, (b) sacrifice and (c) service value will have significant positive indirect effects on behavioural intentions towards the university.
H13 Positive perceptions in relation to (a) service quality, (b) sacrifice and (c) service value will have significant positive indirect effects on the number of word-of-mouth recommendations.

95
Demographic Factors and the Conceptual Model As well as educational service quality factors, various student characteristics could have an influence on student satisfaction. For example, it has been found that part-time students have lower satisfaction levels than full-time students, with possible reasons being limited time for a part-time student to fully appreciate all the university facilities (Moro-Egido and Panades, 2010), greater imbalance between the competing demands of work and university, more personal and family challenges (Sears et al., 2017), compared to full-time students. The amount of time spent within the university may also affect satisfaction, with first and final year students seeing key elements of education service provision differently (Oldfield and Baron, 2000). For example, strengths or weaknesses of various education services may become clearer the longer a student attends the university. Soutar and Turner (2002) grouped students into the important market segments of international student, mature student and school leaver segments. Soutar and Turner (2002) argued that these types of student had different motivations when choosing higher education courses and different expectations of education service provision. The present study compares the responses of mature (part-time), school leaver (full-time), first and final year students in relation to the education service quality components and inter-relationships tested in the main theoretical model. The validity of the model in relation to the whole sample is also examined.
H14 The conceptual model and its components will yield significantly different results for the mode of study and year groupings.
H15 The conceptual model will yield a valid description, a good fit, of the relationships found between the constructs for the study sample.
Figure 1: Student intentions and word of mouth behaviour conceptual model
Sacrifice
Service Value
H6
Behavioural Intentions
H8
Service Quality
H7 H9
Word of mouth
H2
H3 H4
H10
Satisfaction H5

96
In summary, the conceptual model (See Figure 1) predicts significant relationships between sacrifice and service value (H6), service quality with service value (H7), behavioural intentions (H2), word of mouth (H3), and satisfaction (H1), while also suggesting significant relationships between service value and, satisfaction (H10), behavioural intentions (H8) and word of mouth (H9). The conceptual model also predicts a significant link between satisfaction and behavioural intentions (H4) and, word of mouth (H5), while also taking into account indirect relationships between service quality and satisfaction (H11) and, service quality, sacrifice, and service value, with behavioural intentions (H12), and word of mouth (H13). As well as testing the model’s validity (H15), the current study examines the model and it components across mode of study and year student groupings (H14).
Method
Participants
In order to facilitate the use of Structural Equation Modelling (SEM) statistical analyses, and to provide a representative sample of students, stratified random sampling was used. That is, students were randomly chosen from Arts classes within the private university to control for stratified variations in length of time studying, gender and mode of study (Full-time or Part-time). The final Arts student total sample size was 260 with 43.8% of the sample being full-time students, 56.2% part-time, and the majority of the sample was female (70.4%). The majority of the students were undertaking psychology courses (83.1% undertaking the degree and 4.6% the diploma), with the rest of the students undertaking undergraduate courses in Counselling (1.5%), Social Science (8.5%) and Social Studies (2.3%), which approximately represents the actual proportions of students taking specific Arts courses at the private university at that time. The amount of time the students had been studying was also taken into account with students included from year 1 (22.4%), year 2 (42.3%), year 3 (29.6%) and year 4 (5.7%) of their respective courses. The sample size met Barrett’s (2007) minimum criteria, more than 200 participants, for facilitation of an in-depth examination of the model and its features.
Research Design and Procedure
A quantitative cross-sectional descriptive study design was used. That is, self-report quantitative survey responses were collected at one time-point only. Although this research investigation is not an experiment where true causal effects could be inferred due to the manipulation of an independent variable(s), the multivariate model testing approach (SEM) used in this research allows a researcher to infer causal relationships as this approach is driven by the theoretical model to be tested (Hoyle, 1995). That

97
is, SEM allows the researcher to test complex hypotheses that may include direct and indirect effects, within one pre-specified theoretical model (Hoyle, 1995).
Materials
The questionnaire entailed use of a seven point Likert scale with the choices ranging from very low to very high, strongly disagree to strongly agree, or very poor to very good, depending on the wording of the items used. Based on Cronin, Brady and Hult’s (2000) model, three items relating to fees, time and effort, were used in the current study to denote sacrifice. However, the sacrifice items did not reach an acceptable level, above 0.7 as argued by Nunnally (1978), with an internal consistency reliability (α = .64), so only the item relating to fees is included in the model to measure sacrifice.
A further ten items measuring service quality performance in relation to employee reliability, timeliness, competency, approachability, politeness, language, trustworthiness, efforts and, facilities that are clean and free from danger were included in the questionnaire (α = .88). Two items were included to measure service value, with specifically one item stating, “Compared to what I have to give up (i.e. money, time and effort), the overall ability of this college to satisfy my wants and needs is” (α = .83). A further two items related to student satisfaction with one example being, “My choice to select this education service was a wise one” (α = .85). Intentions were addressed in relation to three specific outcomes, using the college again, likelihood of recommending the college to others, and specifically, “If I had to do it over again, the probability that I would still choose ……. is” (α = .87). The extension of this model (Cronin, Brady and Hult, 2000) entails the inclusion of actual behaviour in relation to repeat custom and actual recommendations of the service to others. Whether the participant had recommended the college’s services to others, and if so, how many times had they recommended the service to others were the last two questions on the quantitative student survey. Demographic questions relating to gender, age, study mode and year of degree were also included.
Results In terms of the effects of demographic factors (H14), to some extent the hypothesis stating that the research model components will yield significantly different results for mode of study groupings is supported as there are significant differences in mean scores, as denoted by asterisks in Table 1, between full-time and part-time students in relation to feelings about service quality performance, overall service quality and number of word of mouth recommendations made. In the cases of feelings about service quality performance full-time students rated these areas significantly more highly on average compared to the part-time students, while the part-time students made significantly more recommendations of the service to others, on average.
98
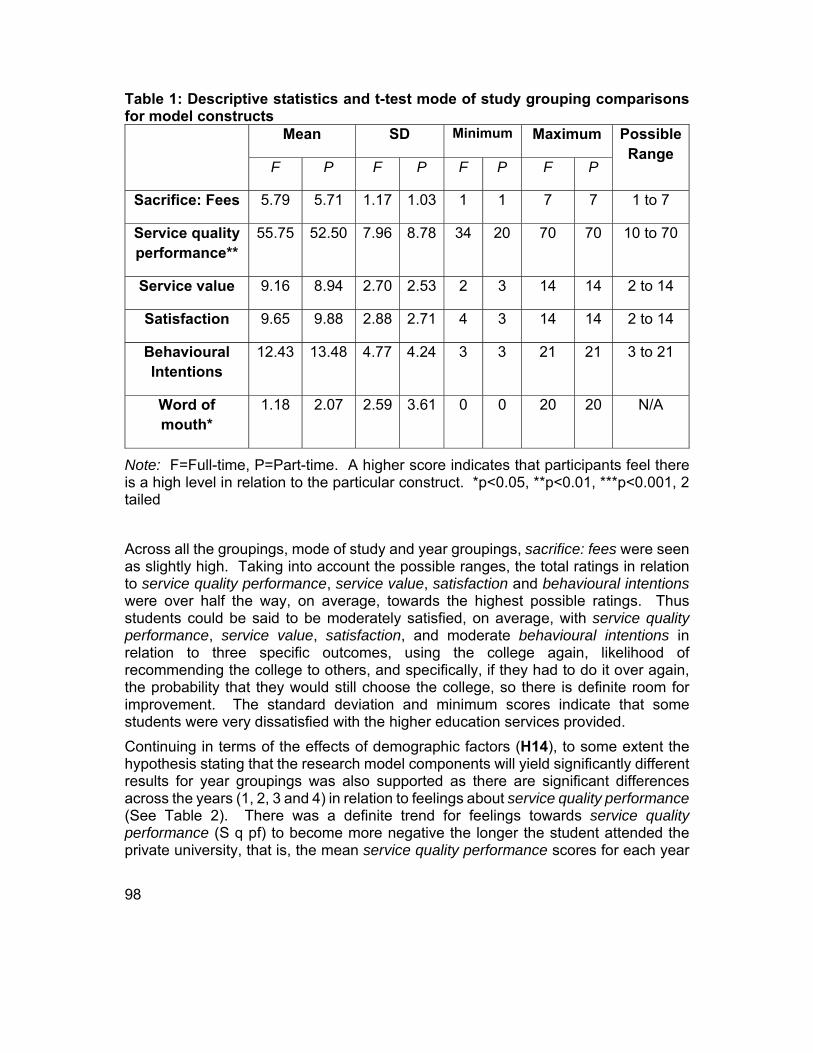
Table 1: Descriptive statistics and t-test mode of study grouping comparisons for model constructs
Mean SD Minimum Maximum Possible Range
F P F P F P F P
Sacrifice: Fees 5.79 5.71 1.17 1.03 1 1 7 7 1 to 7
Service quality performance**
55.75 52.50 7.96 8.78 34 20 70 70 10 to 70
Service value 9.16 8.94 2.70 2.53 2 3 14 14 2 to 14
Satisfaction 9.65 9.88 2.88 2.71 4 3 14 14 2 to 14
Behavioural Intentions
12.43 13.48 4.77 4.24 3 3 21 21 3 to 21
Word of mouth*
1.18 2.07 2.59 3.61 0 0 20 20 N/A
Note: F=Full-time, P=Part-time. A higher score indicates that participants feel there is a high level in relation to the particular construct. *p<0.05, **p<0.01, ***p<0.001, 2 tailed
Across all the groupings, mode of study and year groupings, sacrifice: fees were seen as slightly high. Taking into account the possible ranges, the total ratings in relation to service quality performance, service value, satisfaction and behavioural intentions were over half the way, on average, towards the highest possible ratings. Thus students could be said to be moderately satisfied, on average, with service quality performance, service value, satisfaction, and moderate behavioural intentions in relation to three specific outcomes, using the college again, likelihood of recommending the college to others, and specifically, if they had to do it over again, the probability that they would still choose the college, so there is definite room for improvement. The standard deviation and minimum scores indicate that some students were very dissatisfied with the higher education services provided.
Continuing in terms of the effects of demographic factors (H14), to some extent the hypothesis stating that the research model components will yield significantly different results for year groupings was also supported as there are significant differences across the years (1, 2, 3 and 4) in relation to feelings about service quality performance (See Table 2). There was a definite trend for feelings towards service quality performance (S q pf) to become more negative the longer the student attended the private university, that is, the mean service quality performance scores for each year

99
group steadily decrease from year 1 through to year 4. There are also declines in relation to service value (Serv val), satisfaction (Satisfact), behavioural intentions (Intentions) and word of mouth (WOM) recommendations the longer the students attended the university, although these are not significant. A relatively large standard deviation in relation to year 4 groupings’ service quality performance (S q pf) ratings suggests that there are some major variations in ratings in relation to this construct.
Table 2: Descriptive statistics and t-test year grouping comparisons for model constructs
Note: F=Full-time, P=Part-time. A higher score indicates that participants feel there is a high level in relation to the particular construct. *p<0.05, **p<0.01, ***p<0.001, 2 tailed. See Table 1 for the possible ranges. Sac: Fees= Sacrifice: Fees; S q pf= Service Quality Performance; Serv val= Service value; Satisfact= Satisfaction, WOM= word of mouth
Testing of student future intentions and behaviour model (H1 to H13 and H15)
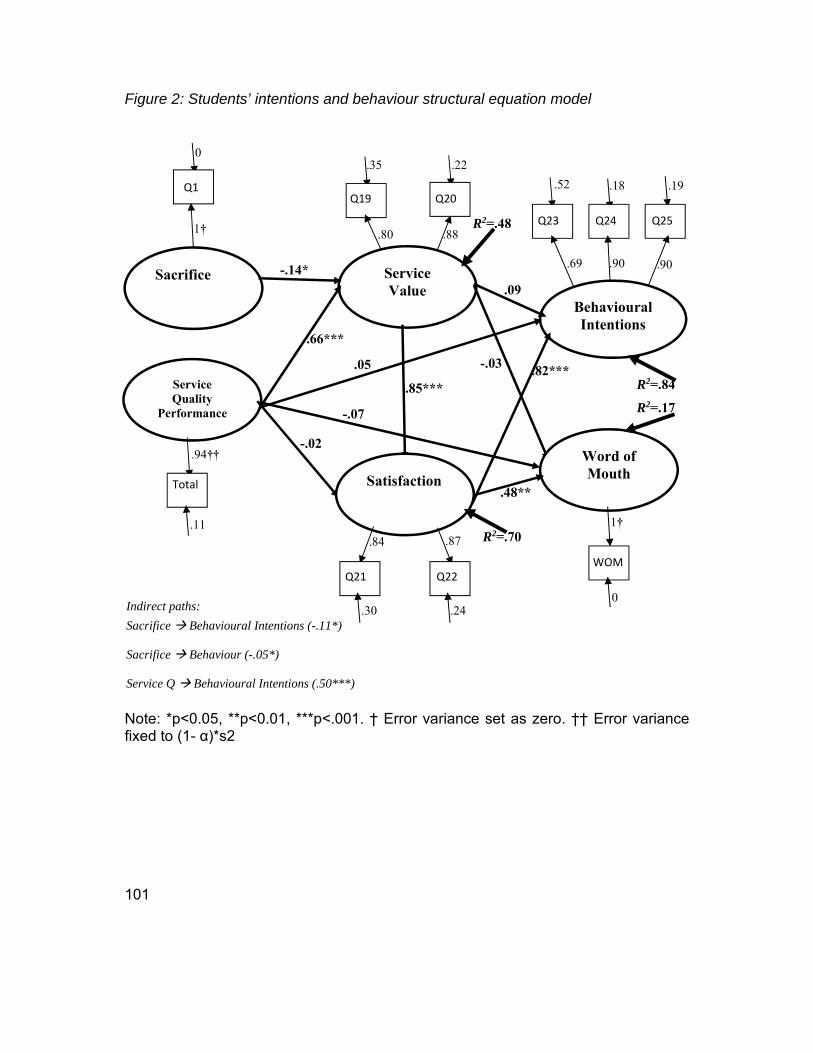
The Structural Equation Modeling analysis was conducted using the LISREL 8.7 program. The observed variables (shown as squares) indicated that item level indicators were acceptable representations of their respective latent variables (shown as circles) and the fit indices (Hu and Bentler, 1999) indicate that support was found for the acceptability of the model (see Figure 2) as a good description of the relationships between the selected variables (X2(27) = 42.01, p < 0.05; RMSEA = 0.05; SRMR = 0.02; CFI = 0.99; IFI = 0.99). This supports the fifteenth hypothesis (H15) as the model does yield a valid description of the relationships found between the constructs for the study sample.
The amount of variance explained in the endogenous variables (Service value, satisfaction, behavioural intentions and word of mouth recommendations) varied from 84% (Behavioural Intentions R2 = 0.84) to the lowest variance explained in relation to word of mouth recommendations (17%: R2 = 0.17). In relation to satisfaction, 70% (R2

100
= 0.70) of variation in responses to this concept was explained by the exogenous predictor variables associated with it (Service value and service quality performance), and 48% (R2 = 0.48) of variation in service value responses was explained by service quality performance and sacrifice. The significant levels of variation explained in satisfaction, service value and behavioural intentions, further support the validity of the model (H15).
As for the direct effects in the model (See the values shown on the bolded lines in Figure 2 and the Standardized Parameter Estimates in Table 3) there was support for a number of model-related hypotheses. There were significant positive and strong direct effects between service quality performance and service value (H7) (γ12 = .66, p < .001), service value and satisfaction (H10) (β21 = .85, p < .001), satisfaction and word of mouth recommendations (H5) (β42 = .48, p < .01), and between satisfaction and behavioural intentions (H4) (β32 = .82, p < .001). This means that perceptions of good service quality leads to students valuing the service more (Service value) (H7), valuing the service more (Service value) relates to greater satisfaction levels (H10), greater satisfaction leads to more word of mouth recommendations (H5) and greater likelihood of the student intending (Behavioural intentions) to return to the university (H4). In addition, sacrifice (Sac: Fees) had a significant weak negative direct effect on service value (H6) (γ11 = .14, p < .05). That is, the higher the students’ felt the fees were the more likely they did not value the service as much, but this relationship was weak. However, a number of model-related hypotheses were not supported. There were no significant direct effects between service quality performance and behavioural intentions (H2) (γ32 = .05, p > .05), service quality performance and word of mouth recommendations (H3) (γ42 = -.07, p > .05), service quality performance and satisfaction (H1) (γ22 = -.02, p > .05), service value and behavioural intentions (H8) (β31 = .09, p > .05), and between service value and word of mouth recommendations (H9) (β41 = -.03, p > .05).
101
Figure 2: Students’ intentions and behaviour structural equation model
Note: *p<0.05, **p<0.01, ***p<.001. † Error variance set as zero. †† Error variance fixed to (1- α)*s2
0 .35 .22
Q1 Q19 Q20
.52 .18 .19
Q23 Q24 Q25R2=.481†
Service Value
Sacrifice
.80 .88
.69 .90 .90
Behavioural Intentions
-.14*
.09
.66***
Service Quality
Performance
R2=.84
.05
.85***
-.03 .82***
R2=.17-.07
Word of Mouth
-.02
Satisfaction
.94††
Total
.48**
R2=.70.11 1†
.87
WOM
.84
Q21 Q22
0 Indirect paths:
Sacrifice Behavioural Intentions (-.11*)
Sacrifice Behaviour (-.05*)
Service Q Behavioural Intentions (.50***)
.30 .24

102
Table 3: Tests of Hypothesized Relationships
Path
Standardized Parameter Estimate
t Values
Conclusions
Direct effects
H1: Service Quality Performance
Satisfaction -.02 -0.18 H1 not
supported
H2: Service Quality Performance Behav. Intentions
.05 0.67 H2 not supported
H3: Service Quality Performance Word of Mouth
-.07 -0.74 H3 not supported
H4: Satisfaction Behavioural Intentions
.82 6.10*** H4 supported
H5: Satisfaction Word of Mouth .48 3.01** H5 supported
H6: Sacrifice Service Value -.14 -2.45* H6 supported
H7: Service Quality Performance Service Value
.66 8.87*** H7 supported
H8: Service Value Behavioural Intentions
.09 0.66 H8 not supported
H9: Service Value Word of Mouth -.03 -0.19 H9 not supported
H10: Service Value Satisfaction .85 8.15*** H10 supported
Indirect effects
H11: Service Quality Performance Satisfaction
.56 6.32*** H11 supported
H12a: Service Quality Performance Behav. Intentions
.50 5.91*** H12a supported

103
H12b: Sacrifice Behavioural Intentions
-.11 -2.37* H12b not supported
H12c: Service Value Behavioural Intentions
.69 7.15*** H12c supported
H13a: Service Quality Performance Word of Mouth
.24 3.10** H13a supported
H13b: Sacrifice Word of Mouth -.05 -2.03* H13b not supported
H13c: Service Value Word of Mouth .40 3.42** H13c supported
The indirect paths (See Figure 2 and Table 3) provide support for the predictions that positive perceptions in relation to service quality, sacrifice and service value will have significant positive indirect effects on behavioural intentions (H12a, H12b and H12c) and word of mouth recommendations (H13a, H13b and H13c). For example, service quality had a strong significant positive indirect effect through service value and satisfaction to behavioural intentions (.50, p < .001). Service value also had strong significant positive indirect effects on behavioural intentions (0.69, p < .001) and word of mouth recommendations (0.40, p < .01) through satisfaction. Service quality performance also had a strong significant positive indirect effect on satisfaction (H11) through service value (.56, p < .001). These indirect paths illustrate the importance of service value and satisfaction as mediators in relation to behavioural intentions and word of mouth recommendations. For example, service quality performance does not have any direct effects on behavioural intentions and word of mouth recommendations, but does have significant indirect effects on these constructs through service value and satisfaction. Higher levels of perceived service value and satisfaction encourage repeat custom (behavioural intentions) and positive word of mouth.
In order to test the equivalence of the model for the full-time and part-time student groupings within the overall sample (H14), a multi-group analysis was conducted. A comparison between the no restrictions model (Model tested simultaneously on both groupings with latent means and regression paths varying freely) and the fully restricted model (latent means and regression paths restricted to be equal across mode of study groupings) indicated no significant difference, S-B X2 (19) = 19.48, p > 0.05. This indicated that there was no significant difference between full-time and part-time student samples in relation to latent means and regression paths within the model

104
tested. This does not support the fourteenth hypothesis (H14) that the model will yield significantly different results for the mode of study groupings.
Discussion
In the present study, student customers’ expectations towards teaching, administration, facilities, IT and word of mouth recommendations for others to attend the college were examined using an extended Cronin, Brady and Hult’s (2000) service quality model. The overall model provided a good explanation of the relationships between the variables (H15) and also explained a significant amount of variation in satisfaction (H1, H10 and H11) and future college re-engagement behavioural intentions responses (H2, H4, H8 and H12) but not the number word of mouth student customer recommendations (H3, H5, H9 and H13), which supports the validity of Cronin, Brady and Hult’s (2000) model but calls into question the usefulness of the extended model.
More specifically, consistent with Cronin, Brady and Hult’s (2000) study, this research explored the role of sacrifice, fees paid by students, would have a significant impact on service value perceptions (H6). Indeed, the higher the students felt the fees were, the less they valued the service. This negative impact on value then had a further negative effect on satisfaction with the education service and behavioural intentions to re-engage with continued study at the college and word of mouth recommendations to others (H12 and H13). These motivations stemmed from the fact that most of the student sample felt that the fees were too high; thus exemplifying that overpricing can have dire consequences. According to Rudd and Mills (2008), charging too high a price can drain the pool of too many prospective students.
Service quality has also been shown to have a critical impact on competitiveness (Lewis, 1989). A number of studies (Cronin, Brady and Hult, 2000; Ghobadian, Speller and Jones, 1994; Marzo-Navorro, Pedraja-Iglesias and Rivera-Torres, 2005; Mavondo, Tsarenko and Gabbott, 2004) have illustrated the positive impact of service quality on satisfaction, re-purchase behavioural intentions and the spread of positive word of mouth (H1, H2 and H3). However, the current investigation contradicts these studies, as service quality had no direct impacts on college re-engagement behavioural intentions, word of mouth recommendations and satisfaction. Perceptions of good service quality performance did have a significant positive impact on service value (H7). This supports research studies that argued if a service is seen as having a high level of quality it will also be valued (Lee, Hsieh and Cheng, 2016; Athanassopoulos, 2000; Chenet, Tynan and Money, 1999; Clow and Beisel, 1995; Fornell et al., 1996; Garbarino and Johnson, 1999; Roest and Pieters, 1997; Spreng and MacKoy, 1996; Zeithaml, Berry and Parasuraman, 1996).
Of course, this does not mean that service quality has little impact on word of mouth recommendations and college re-engagement behavioural intentions. The current investigation found, through its impact on service value, that service quality had a

105
significant indirect effect on college re-engagement behavioural intentions and word of mouth recommendations to others (H12 and H13). More specifically, this research finding supports the partial consensus from marketing literature (e.g. Cronin, Brady and Hult, 2000; Ghobadian, Speller and Jones, 1994; Marzo-Navorro, Pedraja-Iglesias and Rivera-Torres, 2005; Mavondo, Tsarenko and Gabbott, 2004) that favourable attitudes towards service quality performance lead to high levels of value attached to the service, which in turn leads to improved satisfaction levels (H11). The present study then also found the more favourable the student customer felt about their experience at the college the more likely they would re-engage with the college and recommend it to others as a place of study (H4 and H5).
Evidence from this research investigation confirms the distinctiveness of service quality performance and satisfaction, supporting Sureshchandar, Rajendran and Anantharaman’s (2002) findings. Although there was no significant direct impact of service quality performance on satisfaction (H1), it still can be concluded that service quality has an indirect influence on satisfaction through its positive impact on service value, and subsequently, service value’s positive impact on satisfaction (H11). This finding partially supports arguments put forward by Lazibat, Baković and Dužević (2014), Hoisington and Naumann (2003), Lee, Lee and Yoo (2000), Spreng and MacKoy (1996) and, Cronin and Taylor (1992). In addition, this research also confirms Cronin and Taylor’s (1992) findings that satisfaction is more influential in its effects on future re-engagement behavioural intentions in relation to the education service compared to service quality performance. Cronin and Taylor (1992) went on to explain this finding by suggesting that customers may not purchase the best quality service, as availability, convenience or price positively influence satisfaction while having no impact on service quality performance perceptions.
Regarding the role of key student demographics (H14), there were significant differences between full-time and part-time students in relation to feelings about service quality performance, overall service quality and number of recommendations made. In the cases of feelings about service quality performance full-time students rated these areas significantly more highly (H14). This supports research (e.g. Soutar and Turner, 2002) that suggested differences in expectations of education provision according to school leaver and mature student groups. One reason for the difference in expectations could be the fact that a part-time student cannot fully appreciate all the facilities that the full-time students have more time to access (Moro-Egido and Panades, 2010). Of course, there can be various other reasons for the part-time students’ more negative evaluations of the education service quality performance, including the greater imbalance between the competing demands of work and college that they experience, and the more personal and family challenges (Sears et al., 2017) they undergo, compared to full-time students. Despite this, the part-time students made significantly more recommendations of the service to others (H14), including work colleagues. However, there were no significant differences between full-time and part-time students in relation to perceptions relating to fees, service value, satisfaction

106
and behavioural intentions, plus the overall model did not yield significantly different results for the mode of study groupings (H14).
There was a definite trend for feelings towards service quality performance to become more negative the longer the students attended the university (H14). There were also declines in relation to service value, satisfaction, college re-engagement behavioural intentions and word of mouth recommendations the longer the students attended the university, although these were not significant (H14). This supports Oldfield and Baron’s (2000) findings that first and final year students saw key elements of education service provision differently.
Implications for Marketing Education
The negative impact of pricing on service value and negative knock-on effects on satisfaction, repeat student customer intentions and word of mouth suggest the perception of expense can taint the students’ view of the education service in general. Thus a fair pricing system may give universities a competitive edge within the higher private education sector in Ireland, by not only attracting new students to the education service, but also by ensuring more satisfied students attending the courses who then spread positive word of mouth. This is an imperative within the private education sector in Ireland as the growing proliferation of private higher education institutions in Ireland competing against the dominant publicly-funded universities, suggests the greater need for private institutions to be responsive to the needs of student service users (Tomlinson, 2017), in order to make them stand out from the crowd.
There is no doubt that this service marketing approach can highlight the aspects of the service that the university provides that students are satisfied with. For example, in the present study, this included the quality of teaching and administration. However, this study also highlights that tangible evidence like facilities and IT should not be underestimated. Due to the complexity of higher education, students are not normally knowledgeable enough about it to accurately assess it (Driscoll and Wicks, 1998), so they rely more on the tangibles to draw conclusions about overall quality (Hoffman and Kretovics, 2004).
In the current investigation mode of study and the length of time within the university were significant factors. Part-time students appreciated the education service provided less than the full-time students, which could have been due to the lack of time they had to access the facilities provided or other pressing issues in relation to the tension between work and university life, or more personal and family challenges, that adversely affected their views of the service. This highlights the need to tailor educational offerings in a way that can be appreciated by those with other competing concerns outside the university as well as less access to the physical facilities provided in a university environment. Weaknesses of the various education services provided may have become clearer the longer the student attended the university so this

107
suggests the continued need to monitor student views, and act on any issues disclosed, throughout their educational experience.
Despite a slight majority in present study sample stating that the service quality was above average, and the majority of the sample stating they were satisfied overall, only a minority indicated that they would use the service again. This may mean that the university’s postgraduate offerings were not enticing enough for the student cohort sampled. A sizeable proportion of prospective students can be the university’s current students so this cohort should not be forgotten when new courses are considered.
There is a continual need for development and enhancement of an education service provision that matches the student customers’ expectations. The findings of this research study highlight the utility of Cronin, Brady and Hult’s (2000) model in examining student customers’ expectations.
Limitations and Future Directions
In relation to the present study, high price as a positive influence can be ruled out but availability and convenience could well be factors; the university examined in the current research is conveniently situated in the centre of a city. Regarding availability, despite the growing private education sector it can be argued that only a limited number of Arts courses are available in Ireland. These factors should be addressed in any future research using Cronin, Brady and Hult’s (2000) model in the education arena.
This research has put forward the argument that length of time within a university may expose its weaknesses from a student perspective so continued monitoring of student opinion is essential. However, there could be various other explanations for greater levels of student dissatisfaction; for example, to put it bluntly, familiarity may breed contempt. To gain greater insight into student views of their university, the reasons for their feelings towards the education service provision require examination. The strongest approach to this would be longitudinally following the same students through their university life. In addition, although this study argues that students are not normally knowledgeable enough about the subject-related educational provision to assess it (Driscoll and Wicks, 1998), and so they rely more on the tangibles to draw conclusions about overall quality (Hoffman and Kretovics, 2004), a future study could examine student perspectives on education provision while taking into account their views on the intangibles like core subject content and career information relating to the taught programme, Sears et al. (2017) did this with a similar sample to the current study, comprising of undergraduate psychology students in Canada.
The present study did not gather staff perspectives, which would have provided an alternative insight to the service marketing satisfaction model examined. Indicated by the positive ratings of service quality performance from the majority of students in the current study, there is no doubting that frontline lecturing and administrative staff

108
continued to interact with students in a professional manner. However, reducing the likelihood any staff emotional labour, due to the need to hide negative emotions and frustrations, can further enhance staff professionalism. Constanti and Gibbs (2004) argue that the distribution of power is unequal with the academic staff having greater level of emotional labour because they have to facilitate student satisfaction and profits of the management.
References Athanassopoulos, A.D. (2000) ‘Customer satisfaction cues to support market segmentation and explain switching behavior’, Journal of Business Research, 47(3), pp. 191–207.
Barrett, P. (2007) ‘Structural equation modelling: adjudging model fit’, Personality and Individual Differences, 42(5), pp. 815–824.
Bitner, M.J. (1990) ‘Evaluating service encounters: the effects of physical surroundings and employee responses’, Journal of Marketing, 54(2), pp. 69–82.
Bolton, R.N. and Drew, J.H. (1991) ‘A multistage model of customers’ assessments of service quality and value’, Journal of Consumer Research, 17(4), pp. 375–384.
Chenet, P., Tynan, C. and Money, A. (1999) ‘Service performance gap: re-evaluation and redevelopment’, Journal of Business Research, 46(2), pp. 133–147.
Clow, K. E. and Beisel, J. L. (1995) ‘Managing consumer expectations of low-margin, high-volume services’, Journal of Services Marketing, 9(1), pp. 33–46.
Constanti, P. and Gibbs, P. (2004) ‘Higher education teachers and emotional labour’, International Journal of Educational Management, 18(4), pp. 243–249.
Cronin, J.J., Brady, M.K., Brand, R.R., Hightower, R. and Shemwell, D.J. (1997) ‘A cross-sectional test of the effect and conceptualization of service value’, Journal of Services Marketing, 11(6), pp. 375–391.
Cronin, J.J., Brady, M. K. and Hult, G. T. M. (2000) ‘Assessing the effects of quality, value, and customer satisfaction on consumer behavioral intentions in service environments’, Journal of Retailing, 76(2), pp. 193–218.
Cronin, J.J. and Taylor, S. A. (1992) ‘Measuring service quality: a reexamination and extension’, Journal of Marketing, 56(3), pp. 55–68.
Cronin, J.J. and Taylor, S. A. (1994) ‘SERVPERF versus SERVQUAL: reconciling performance-based and perceptions-minus-expectations measurement of service quality’, Journal of Marketing, 58(1), pp. 125–131.
Crosby, P. B. (1979) Quality is free: the art of making quality certain. New York: McGraw-Hill.

109
Day, E. and Crask, M.R. (2000) ‘Value assessment: the antecedent of consumer satisfaction’, Journal of Consumer Satisfaction, Dissatisfaction and Complaining Behaviour, 13, pp. 52-60.
Driscoll, C. and Wicks, D. (1998) ‘The customer-driven approach in business education: a possible danger?’, Journal of Education for Business, 74(1), pp. 58–61.
Eagle, L. and Brennan, R. (2007) ‘Are students customers? TQM and marketing perspectives’, Quality Assurance in Education, 15(1), pp. 44–60.
Fornell, C., Johnston, M.D., Anderson, E.W. Cha, J. and Bryant, B.E. (1996) ‘The American customer satisfaction index: nature, purpose, and findings’, Journal of Marketing, 60(4), pp. 7–18.
Garbarino, E. and Johnson, M.S. (1999) ‘The different roles of satisfaction, trust, and commitment in customer relationships’, Journal of Marketing, 63(2), pp. 70–87.
Ghobadian, A., Speller, S. and Jones, M. (1994) ‘Service quality: concepts and models’, International Journal of Quality & Reliability Management, 11(9), pp. 43–66.
Han, P. (2014) ‘A literature review on college choice and marketing strategies for recruitment’, Family and Consumer Sciences Research Journal, 43(2), pp. 120–130.
Hill, F.M. (1995) ‘Managing service quality in higher education: the role of the student as primary consumer’, Quality Assurance in Education, 3(3), pp. 10–21.
Hoffman, K.D. and Kretovics, M.A. (2004) ‘Students as partial employees: a metaphor for the student-institution interaction’, Innovative Higher Education, 29(2), pp. 103–120.
Hoisington, S. and Naumann, E. (2003) ‘The loyalty elephant’, Quality Progress, 36(2), pp. 33-41.
Hoyle, R.H. (ed.) (1995) Structural Equation Modeling: Concepts, issues and applications. Thousand Oaks, CA: Sage.
Hu, L. and Bentler, P. M. (1999) ‘Cutoff criteria for fit indexes in covariance structure analysis: Conventional criteria versus new alternatives’, Structural Equation Modeling: A Multidisciplinary Journal, 6(1), pp. 1–55.
Iacobucci, D., Grayson, K. A. and Ostrom, A. L. (1994) ‘The calculus of service quality and customer satisfaction: Theoretical and empirical differentiation and integration’, in Swartz, T. A., Bowen, D. E., and Brown, S. W. (eds) Advances in services marketing and management. Greenwich, CT: JAI Press, pp. 1–67.
Kelley, S. W., Donnelly, J. H., & Skinner, S. J. (1990). Customer participation in service production and delivery. Journal of Retailing, 66(3), pp. 315-335.
Lazibat, T., Baković, T. and Dužević, I. (2014) ‘How perceived service quality influences students’ satisfaction? Teachers’ and students’ perspectives’, Total Quality Management & Business Excellence, 25(7–8), pp. 923–934.

110
Ledden, L., Kalafatis, S. P. and Samouel, P. (2007) ‘The relationship between personal values and perceived value of education’, Journal of Business Research, 60(9), pp. 965–974.
Lee, D.J., Hsieh, L.W. and Cheng, E. (Hui-P. (2016) ‘Relationships among service quality, value, and student athlete satisfaction at Taiwan’s national tug of war competition’, Contemporary Management Research, 12(3), pp. 275–288.
Lee, H., Lee, Y. and Yoo, D. (2000) ‘The determinants of perceived service quality and its relationship with satisfaction’, Journal of Services Marketing, 14(3), pp. 217–231.
Lewis, B.R. (1989) ‘Quality in the service sector: A Review’, International Journal of Bank Marketing, 7(5), pp. 4–12.
Mark, E. (2013) ‘Student satisfaction and the customer focus in higher education’, Journal of Higher Education Policy and Management, 35(1), pp. 2–10.
Marzo-Navarro, M., Pedraja-Iglesias, M. and Rivera-Torres, M.P. (2005) ‘Measuring customer satisfaction in summer courses’, Quality Assurance in Education, 13(1), pp. 53–65.
Mavondo, F.T., Tsarenko, Y. and Gabbott, M. (2004) ‘International and local student satisfaction: resources and capabilities perspective’, Journal of Marketing for Higher Education, 14(1), pp. 41–60.
McCollough, M. A. and Gremler, D. D. (1999) ‘Guaranteeing Student Satisfaction: An Exercise in Treating Students as Customers’, Journal of Marketing Education, 21(2), pp. 118–130.
Moro-Egido, A.I. and Panades, J. (2010) ‘An analysis of student satisfaction: full-time vs. part-time students’, Social Indicators Research, 96(2), pp. 363–378.
Munteanu, C., Ceobanu, C., Bobalca, C., and Anton, O. (2010) ‘An analysis of customer satisfaction in a higher education context’, International Journal of Public Sector Management, 23(2), pp. 124–140.
Nasser, R.N., Khoury, B. and Abouchedid, K. (2008) ‘University students’ knowledge of services and programs in relation to satisfaction: A case study of a private university in Lebanon’, Quality Assurance in Education, 16(1), pp. 80–97.
Nell, C.E. and Cant, M.C. (2014) ‘Determining student perceptions regarding the most important service features and overall satisfaction with the service quality of a higher education institution’, Management, 19(2), pp. 63–87.
Nunnally, J.C. (1978) Psychometric theory. 2nd edn. New York: McGraw-Hill.
Oldfield, B.M. and Baron, S. (2000) ‘Student perceptions of service quality in a UK university business and management faculty’, Quality Assurance in Education, 8(2), pp. 85–95.
Parasuraman, A., Zeithaml, V.A. and Berry, L.L. (1988) ‘SERVQUAL: A multiple-item scale for measuring consumer perceptions of service quality’, Journal of Retailing, 64(1), pp. 12–40.

111
Parasuraman, A., Zeithaml, V.A. and Berry, L.L. (1994) ‘Reassessment of expectations as a comparison standard in measuring service quality: implications for further research’, Journal of Marketing, 58(1), pp. 111–124.
Roest, H. and Pieters, R. (1997) ‘The nomological net of perceived service quality’, International Journal of Service Industry Management, 8(4), pp. 336–351.
Rudd, D. and Mills, R. (2008) ‘Expanding marketing principles for the sale of higher education’, Contemporary Issues in Education Research, 1(3), pp. 41–52.
Schertzer, C. B. and Schertzer, S. M. B. (2004) ‘Student satisfaction and retention: a conceptual model’, Journal of Marketing for Higher Education, 14(1), pp. 79–91.
Sears, C.R., Boyce, M.A., Boon S.D., Goghari, V.M., Irwin, K. and Boyes, M. (2017) ‘Predictors of student satisfaction in a large psychology undergraduate program.’, Canadian Psychology/Psychologie canadienne, 58(2), pp. 148–160.
Setijono, D. and Dahlgaard, J. J. (2007) ‘Customer value as a key performance indicator (KPI) and a key improvement indicator (KII)’, Measuring Business Excellence, 11(2), pp. 44–61.
Sirvanci, M. (1996) ‘Are students the true customers of higher education?’, Quality Progess, 29(10), pp. 40–45.
Soutar, G.N. and Turner, J.P. (2002) ‘Students’ preferences for university: a conjoint analysis’, International Journal of Educational Management, 16(1), pp. 40–45.
Spreng, R.A., MacKenzie, S.B. and Olshavsky, R.W. (1996) ‘A reexamination of the determinants of consumer satisfaction’, Journal of Marketing, 60(3), pp. 15-32.
Spreng, R.A. and Mackoy, R.D. (1996) ‘An empirical examination of a model of perceived service quality and satisfaction’, Journal of Retailing, 72(2), pp. 201–214.
Sureshchandar, G.S., Rajendran, C. and Anantharaman, R.N. (2002) ‘The relationship between service quality and customer satisfaction – a factor specific approach’, Journal of Services Marketing, 16(4), pp. 363–379.
Swan, J.E., Bowers, M.R. and Grover, R. (2002) ‘Customer involvement in the selection of service specifications’, Journal of Services Marketing, 16(1), pp. 88–103.
Temple, P. and Shattock, M. (2007) ‘What does branding mean in higher education?’ in Stensaker, B. and D’Andrea, V. (eds.) Branding in higher education: exploring an emerging phenomenon. Amsterdam: EAIR, pp. 73-82.
Tomlinson, M. (2017) ‘Student perceptions of themselves as “consumers” of higher education’, British Journal of Sociology of Education, 38(4), pp. 450–467.
Voss, R., Gruber, T. and Szmigin, I. (2007) ‘Service quality in higher education: The role of student expectations’, Journal of Business Research, 60(9), pp. 949–959.

112
Wilkins, S., Shams, F. and Huisman, J. (2013) ‘The decision-making and changing behavioural dynamics of potential higher education students: the impacts of increasing tuition fees in England’, Educational Studies, 39(2), pp. 125–141.
Woodruff, R.B. (1997) ‘Marketing in the 21st Century Customer Value: The Next Source for Competitive Advantage’, Journal of the Academy of Marketing Science, 25(3), pp. 139–156.
Zeithaml, V. A. (1988) ‘Consumer perceptions of price, quality, and value: a means-end model and synthesis of evidence’, Journal of Marketing, 52(3), pp. 2–22.
Zeithaml, V.A., Berry, L.L. and Parasuraman, A. (1996) ‘The Behavioral Consequences of Service Quality’, Journal of Marketing, 60(2), pp. 31-46.
Zeithaml, V.A., Bitner, M.J. and Gremler, D.D. (2006) Services marketing: Integrating customer focus across the firm. New York: McGraw-Hill.