EDUCATION SECTOR DEVELOPMENT PLAN -...
125
i EDUCATION SECTOR DEVELOPMENT PLAN 2013-2017 MINISTRY OF EDUCATION FEBRUARY 2013
Transcript of EDUCATION SECTOR DEVELOPMENT PLAN -...

i
EDUCATION SECTOR DEVELOPMENT PLAN
2013-2017
MINISTRY OF EDUCATION
FEBRUARY 2013

ii
Contents
CHARTS .................................................................................................................... V
TABLES .................................................................................................................... VI
ACRONYMS ............................................................................................................ VII
EXECUTIVE SUMMARY ........................................................................................ VIII
I. Introduction .................................................................................................................................................... viii
II. Situational Analysis ........................................................................................................................................ ix Low access and High disparities ....................................................................................................................... ix Low Quality and Relevance: ............................................................................................................................. ix
III. Plans and Strategies for Educational Development ................................................................................... xi
IV. Overview of the five year plan..................................................................................................................... xii Component 1: Increase Equitable Access to Basic education and literacy, Secondary and TVET education.
........................................................................................................................................................................ xiii Component 2: Quality and Relevance of Education ....................................................................................... xiv Component 3: Institutional Capacity Development ........................................................................................ xiv
V. Implementation .............................................................................................................................................. xv
VI. Monitoring, Evaluation and Reporting ...................................................................................................... xv
VII. Costs and Financing .................................................................................................................................. xvi
VIII. Conclusion................................................................................................................................................. xvi
CHAPTER I: ............................................................................................................... 1
1. INTRODUCTION ............................................................................................................................................ 1 1.1 National Context and Strategy of Education ................................................................................................ 1 1.2 Eritrean Education Strategy ......................................................................................................................... 2 1.3 Financing Education .................................................................................................................................... 4
2. VISION .............................................................................................................................................................. 6
3. OVERALL OBJECTIVES .............................................................................................................................. 6
4. STRATEGIC PRIORITIES ............................................................................................................................ 7
5. OVERALL TARGETS .................................................................................................................................... 8
CHAPTER II: INSTITUTIONAL CONTEXT ............................................................. 10
1. Progress and achievements ............................................................................................................................ 10 1.1 Access and Equity ...................................................................................................................................... 10 1.2 Quality and Relevance of Education .......................................................................................................... 14 1.3 Institutional Capacity ................................................................................................................................. 17
2. Challenges ....................................................................................................................................................... 18

iii
2.1 Low access/low equity ............................................................................................................................... 18 2.2 Equity by location. ..................................................................................................................................... 19 2.3 Equity by gender. ....................................................................................................................................... 20 2.4 Teacher Supply .......................................................................................................................................... 24 2.5 Low Learner Achievement ........................................................................................................................ 25 2.6 High wastage in general education ............................................................................................................ 25 2.7 Limited institutional and financial capacity ............................................................................................... 28
156. Finance. ................................................................................................................................................. 29
CHAPTER III: POLICY CONTEXT .......................................................................... 31
1. The Declaration of Policy on Education (1991) ............................................................................................ 31
2. The Macro Policy of the Government of Eritrea (November 1994) ........................................................... 31
3. The Transitional Constitution of the Peoples’ Front for Democracy and Justice (PFDJ) ....................... 32
4. Constitution of the State of Eritrea ............................................................................................................... 32
5. The Concept Paper for a Rapid Transformation of the Eritrean Education System (2002) ................... 33
6. The National Education Policy on Education (2003) ................................................................................... 33
7. National Economic Policy Framework and Programme (NEPF) – 1998-2000 (1998) ............................. 33
8. Poverty Reduction Strategy Paper (PRSP) (2003) ....................................................................................... 33
CHAPTER IV: STRATEGIES FOR EDUCATIONAL DEVELOPMENT ................... 37
1. Expanded and Equitable Access .................................................................................................................... 37
2. Girls’ and Women’s Education ..................................................................................................................... 37
3. Quality and Relevance of Education ............................................................................................................. 38
4. Reduction in wastage ...................................................................................................................................... 39
5. Technical and Vocational Skills Development. ............................................................................................ 39
6. Institutional Capacity Development .............................................................................................................. 40
7. Financing Strategy .......................................................................................................................................... 40
CHAPTER V: SPECIFIC OBJECTIVES, TARGETS AND ACTIVITIES .................. 41
A. Specific Objective 1: Improve Access and Equity ....................................................................................... 41 1. Basic Education (Formal and Adult Education) .......................................................................................... 41 2. Adult Literacy education .............................................................................................................................. 46
2.1 Overall Objectives ....................................................................................................................................... 46 3. Secondary Education ................................................................................................................................... 47 4. Technical and Vocational Education ........................................................................................................... 50 5. Expansion of Teacher Training Outputs ...................................................................................................... 51
B. Specific objective 2: Improve the Quality of Learning and Relevance of Education ............................... 55 1. Basic (Formal and Adult Education) and Secondary Education .................................................................. 55

iv
2. Technical and Vocational Skills Development ............................................................................................ 55 3. Reduction in wastage. .................................................................................................................................. 57
C. Specific Objective 3: Institutional Capacity Development ......................................................................... 57 3.1 Overall Objective ....................................................................................................................................... 57 3.2 Strategies/activities .................................................................................................................................... 57 3.3 Financing Strategy. .................................................................................................................................... 60 3.4 Tertiary Education and Training Institutions ............................................................................................. 66
CHAPTER VI: IMPLEMENTATION ARRANGEMENTS .......................................... 67
Ministry of Education (MOE) ........................................................................................................................... 67
The Steering Committee..................................................................................................................................... 67
MOE Departments, Divisions and Units ........................................................................................................... 68
CHAPTER VII: MONITORING AND EVALUATION (M&E) ..................................... 69
Review and reporting issues .............................................................................................................................. 69
REFERENCES ......................................................................................................... 71
ANNEXES ................................................................................................................ 72
Annex 1: Eritrea - Projected Costs of the ESDP, 2013-17 .............................................................................. 72
Annex 2: Detailed Cost Projections ................................................................................................................... 82 General Education ............................................................................................................................................ 82 TVET ............................................................................................................................................................... 87 ADULT LITERACY & COMPLEMENTARY EDUCATION FOR OUT OF SCHOOL CHILDREN ........ 88 ADMINISTRATION & CAPACITY DEVELOPMENT ................................................................................ 90
Annex 3: Enrolment Projections (2013-2017) .................................................................................................. 91 PROGRAMME PROJECTION FOR PRE-PRIMARY EDUCATION (2011-2017) ..................................... 91 PROGRAMME PROJECTION FOR ELEMENTARY EDUCATION (2011-2017) ..................................... 92 PROGRAMME PROJECTION FOR MIDDLE SCHOOL EDUCATION (2011-2017) ................................ 94 PROGRAMME PROJECTION FOR SECONDARY EDUCATION (2011-2017) ........................................ 95 Repetition and Drop-out Targets ..................................................................................................................... 96
Annex 4: Logical Framework ............................................................................................................................ 98
Annex 5: Current Organizational Structure of the Ministry of Education ................................................. 108

v
CHARTS
Page
Chart 1: Gross Enrolment by Level and Year, 2005/06 – 2010/11
Chart 2: Gross Enrolment Rate by Level and Year, 2005/06 – 2010/11
Chart 3: Enrolment in the Literacy Program by Gender and Year, 2005/06 – 2010/11
Chart 4: Technical and Vocational Training – Intermediate Level Enrolment by Gender
and Year, 2005/06 – 2010/11
Chart 5: Total Enrolment in NAVCOT and Technical Schools, 2007/08 – 2010/11
Chart 6: Number of Children age 7-11 out of school, 2005/06 – 2010/11
Chart 7: Elementary Level Gross and Net Enrolment Ratios by Region, 2010/11
Chart 8: Middle Level Gross and Net Enrolment Ratios by Region, 2010/11
Chart 9: Secondary Level Gross and Net Enrolment Ratios by Region, 2010/11
Chart 10: Gender Parity Index (GPI) by Level, 2010/11
Chart 11: Gross and Net Enrolment Ratios by Level and Gender, 2010/11
Chart 12: Enrolment by Level, Gender and Year, 2005/06 -2010/11
Chart 13: Total Enrolment in Grade 12 and Number of Graduates from Technical
School by Year, 2004 -2011
Chart 14: Percentage of TVET Graduates by year, 2005 – 2011
Chart 15: Percentage of Repeaters by Level and Gender, 2010/11
Chart 16: Percentage of Dropouts by Level and Gender, 2010/11
Chart 17: Survival Rate to Grade 5 by Year, 2005/06 -2010/11
Chart 18: Transition Rate from Elementary to Middle Level by Year, 2005/06 – 2010/11
Chart 19: Completion Rate of Grade 5 by Year, 2010/11 to 2015/16
Chart 20: Projected Enrolment by Level, 2010/11 to 2015/16
Chart 21: Gender Parity Index (GPI) by Level, 2010/11 to 2015/16
vi
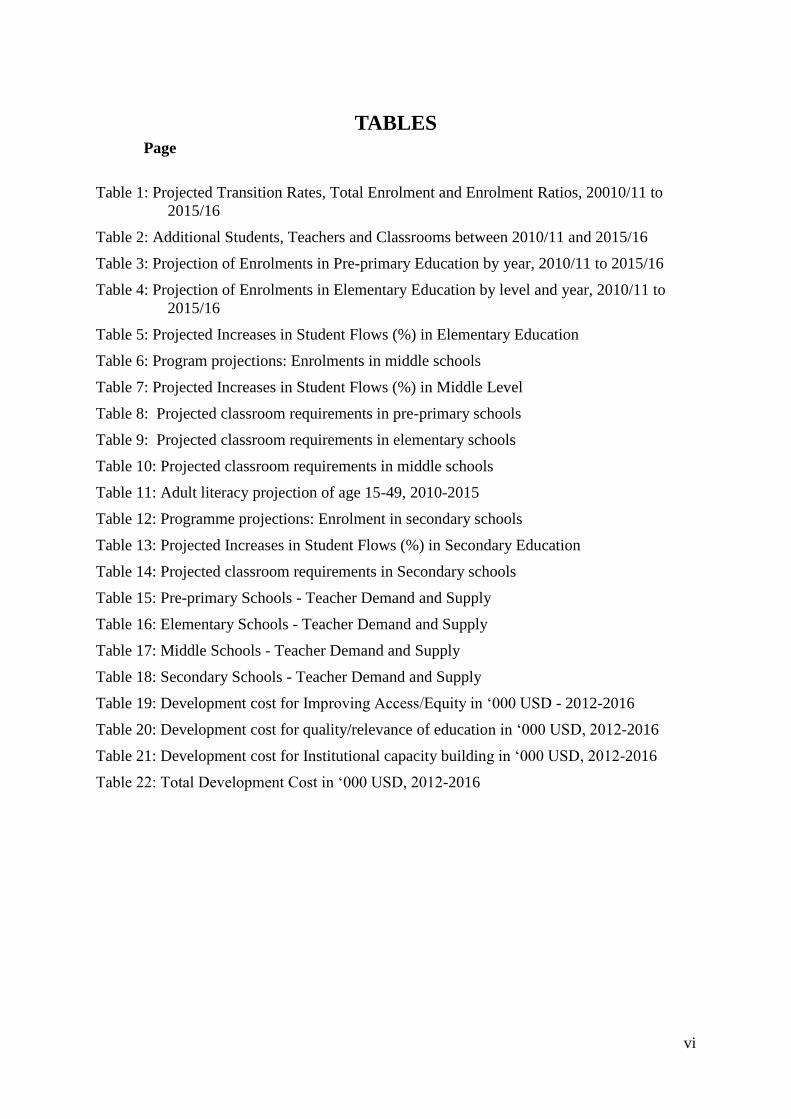
TABLES Page
Table 1: Projected Transition Rates, Total Enrolment and Enrolment Ratios, 20010/11 to
2015/16
Table 2: Additional Students, Teachers and Classrooms between 2010/11 and 2015/16
Table 3: Projection of Enrolments in Pre-primary Education by year, 2010/11 to 2015/16
Table 4: Projection of Enrolments in Elementary Education by level and year, 2010/11 to
2015/16
Table 5: Projected Increases in Student Flows (%) in Elementary Education
Table 6: Program projections: Enrolments in middle schools
Table 7: Projected Increases in Student Flows (%) in Middle Level
Table 8: Projected classroom requirements in pre-primary schools
Table 9: Projected classroom requirements in elementary schools
Table 10: Projected classroom requirements in middle schools
Table 11: Adult literacy projection of age 15-49, 2010-2015
Table 12: Programme projections: Enrolment in secondary schools
Table 13: Projected Increases in Student Flows (%) in Secondary Education
Table 14: Projected classroom requirements in Secondary schools
Table 15: Pre-primary Schools - Teacher Demand and Supply
Table 16: Elementary Schools - Teacher Demand and Supply
Table 17: Middle Schools - Teacher Demand and Supply
Table 18: Secondary Schools - Teacher Demand and Supply
Table 19: Development cost for Improving Access/Equity in ‘000 USD - 2012-2016
Table 20: Development cost for quality/relevance of education in ‘000 USD, 2012-2016
Table 21: Development cost for Institutional capacity building in ‘000 USD, 2012-2016
Table 22: Total Development Cost in ‘000 USD, 2012-2016

vii
ACRONYMS
ATEI Asmara Teacher Education Institute
AWPB Annual Work Plan and Budget
CEE Complementary Elementary Education
CPD Continuous Professional Development
DP Development partner
DGE Directorate of General Education
DKB Debubawi-Keih-Bahri (Southern Red Sea)
ECD Early childhood development
EIT Eritrean Institute of Technology
ELO Expected learning outcome
EFA Education For All
EMIS Education management information system
EPHS Eritrea Population and Health Survey
EPLF Eritrean Peoples’ Liberation Front
ENQF Eritrea National Qualification Framework
ESECE Eritrean Secondary Education Certification Examination
FRS Functional Requirement Specification
GAR Gross admission ratio
GER Gross enrolment ratio
GPI Gender parity index
ICT Information and communications technology
LAPG Learner Assessment and Progression Guide
LEMIS Labour Market Information System
LIAE Library and Information Association of Eritrea
M&E Monitoring and evaluation
MDG Millennium Development Goals
MML Minimum mastery learning
MLA Monitoring of Learning Achievement
MOE Ministry of Education
MOLHW Ministry of Labour and Human Welfare
NAR Net Admission Ratio
NER Net Enrolment Ratio
ODLP Open and Distance Learning Program
PFDJ Peoples’ Front for Democracy and Justice
PGE Provisional Government of Eritrea
PRC Pedagogic resource centre
PRSP Poverty Reduction Strategy Plan
PTSA Parent-teacher-student association
PRR Procedures Rules and Regulations
SACMEC Southern Africa Countries Monitoring & Evaluation consortium
SKB Semiemawi-Keih-Bahri (Northern Red Sea)
SDC Skills Development Centre
TRS Technical Requirement Specification
TVET Technical-vocational education and training
USD United States Dollar
Zoba Region

viii
EXECUTIVE SUMMARY
I. Introduction
1. This plan covers all sectors except tertiary education and is based on the principle that
education sub-sectors do not exist in isolation from each other, but need to perform in a
coherent, holistic and complementary way in order to optimize the achievement if the desired
goals. The Plan is a rolling five-year plan to be updated annually.
2. Eritrea is a very poor country economically. It has suffered much hardship as a
consequence of its struggle for independence and ongoing regional instability and also
because of the harshness of much of its physical environment and climate.
3. Eritrea recognizes the importance of education and training for the future prosperity and
wellbeing of the country and its people, in that they have the potential to develop the
knowledge and skills required for a vibrant, competitive economy, foster social development
and equality and to enable people to generate increased income and lift themselves out of
poverty.
4. For these reasons, the Government of the State of Eritrea considers education to be the
cornerstone of all national development efforts, particularly in human resources development,
economic growth and poverty alleviation. Accordingly, it is making significant investments
in the development of human resources by providing education and health services for the
entire population, so that they are able to fully participate in the civic, cultural, political,
social and economic affairs of their nation. Consequently, Eritrea’s development strategy
emphasizes people as the most central resource for its reconstruction and development and
this is reflected in the national theme ‘Our People are our Future.’ In this context, the
Government has stated its commitment to MDG and EFA goals. However, entrenched
problems in the education and training system impede Eritrea’s ability to accomplish these
goals.
5. Economic growth and poverty reduction have been the twin goals of the government’s
development programs since independence. Eritrea has considerable potential to generate
growth in agriculture and livestock production, fisheries, mining, small and medium
enterprises, tourism, telecommunications as well as infrastructure. Education and training are
crucial for successful development in all these fields.
6. Eritrea seeks to create a modern, technologically advanced, and internationally competitive
economy. A critical mass of qualified, trained and experienced human resources is a major
prerequisite for export-led industrial development as well as sustainable industrial
development. The existing technological base of the productive sectors of the economy is
antiquated and woefully inadequate to achieve international competitiveness. As in
agriculture, low educational and skill levels act as a tight constraint on industrial growth.
Eritrea has an acute shortage of skilled manpower in virtually all sectors.
7. Education and training also play a key role in poverty reduction and social development.

ix
8. In short, the shortage of appropriate human capital is impacting all aspects of the
development effort in both the private and public sectors.
II. Situational Analysis
9. At the time of liberation in 1991 education and training were extraordinarily limited in
terms of access, infrastructure and quality. Since then Eritrea has achieved significant
progress in rehabilitating, expanding and improving the education system. Total enrolments
more than doubled at elementary level between 1991/92 and 2010/11, and tripled at middle
and secondary levels over the same period. Enrolments in adult literacy classes reached over
40,000 in 2010/11. Despite the impressive progress, Eritrea faces daunting challenges in its
quest to provide equitable access to quality basic education and employable skills for its
youth and adults. The challenges are:
Low access and High disparities
10. Gross enrolment ratios have reached 93.2% at elementary level, 70.2% at middle level and
31.5.5% in secondary education. Still, about 121,000 Eritrean 7-11 year old children are not
enrolled in school. Disparities in access to schooling exist by location and by gender. At the
elementary and middle level gross enrolment ratios range from about 56.6% in the Southern
Red Sea Region to 110% in Debub. Several factors explain the disparities, including the
marked variation in physical and climatic conditions, shortage of schools, community
attitudes to education, and the difficulty of reaching certain segments of the population,
especially in sparsely populated areas.
11. Significant differences also exist between boys’ and girls’ participation in education. Gross
enrolment ratios are between 13, 10.5 and 6 percentage points lower for girls than for boys at
elementary, middle and secondary school levels.. Negative environmental (demand) side
factors include poverty, inability to afford the direct costs of schooling as well as loss of
children’s labor, and social and cultural obstacles, such as early marriage and undervaluing
the benefits of education for girls. Educational (supply) factors include lack of female
teachers and of trained teachers in mother tongue, overcrowded classrooms, inadequate
supply of learning and instructional materials, perceived lack of relevance of curriculum, lack
of sanitation facilities, and long distance to school.
Low Quality and Relevance:
12. Learning achievements: The Monitoring of Learning Achievement (MLA) study of 2008
analyzed the proportion of students in elementary education who acquired learning
competencies in core subjects. It indicated that despite great efforts to extend access, quality
was very low. None of the regions or grade 3 pupils tested achieved the minimum mastery
level in any subject. Low performance in mathematics and English is a matter for national
concern. Achievements varied widely by region, with Maekel 2.6 times higher than the
Anseba region in overall Grade 3 mastery. The performance of all regions was markedly
lower in Grade 5 than in grade 3. Girls’ combined scores compared favorably with males at
grade 3 in Mathematics, but significant differences existed in English, with performance 12
percentage points below boys. Nevertheless, girls have performed at grade 3 in Mother

x
Tongue 9.6 percentage points higher than boys. At grade 5 both girls and boys performed
equally.
13. Both supply and demand factors explain these disappointingly low academic results, for
similar reasons to those which inhibit access. Demand-side problems include poverty, child
domestic labor, weak parental interest, distance from school and socio-cultural barriers.
Multiple supply-side educational factors include: (i) shortage of teacher and school manager
competencies, qualifications and accountability for results (in the 2010/11 academic year,
only 69% of teachers at middle level were formally qualified, and just 83% in the secondary
phase); (ii) problems in curriculum relevance; (iii) overcrowded schools and classrooms,
often with dilapidated facilities and broken equipment (at secondary level, on average
teachers teach about 65 students per class) ; and (v) inefficient use of the school calendar and
school day resulting in much less than intended time on task.
14. TVET – relevance and quality: Lack of relevance manifests itself first in lack of demand-
responsiveness. The country lacks an effective labor market information system (LMIS) by
which to guide the direction of the system. Employers, the ultimate users of the output of the
TVET system, do not participate in advising the system. Formal skills training is limited to
traditional trades. Technical schools are marginal in the overall education system, accounting
for only 5% of enrolments at secondary level. Public non-formal skills training is also
negligible.
15. The quality and effectiveness of TVET also present problems. TVET institutions lack the
main inputs required for sound and effective training: qualified and experienced instructors,
textbooks and teaching materials and operational, reasonably up-to-date equipment.
Mechanisms do not exist to coordinate training policies among the key public actors and
employers. Insufficient data exists about the performance of the training institutions and their
graduates in the labor market.
16. High wastage and dropout: The Eritrean education system is characterized by wastage de
to high repetition rates at all three levels, generally between around 12% of students at each
grade each year. Low internal student flows means that it takes 6.5 student-years of inputs to
graduate one student from the five-year elementary phase. Repetition and late entry account
for large differences between net and gross enrolment ratios at elementary and middle levels.
14% and 23% more of the age group could be accommodated within existing elementary and
middle institutions, respectively, with efficient internal flows. High repetition rates increase
the cost of education and deny other children an opportunity for schooling.
17. Limited Institutional and Financial Capacity: The Ministry of Education faces two main
constraints: limited MOE implementation capacity at central, Zoba and local levels, and
scarce financial resources. Modern systems are lacking that would enable more efficient
management of planning information, budgeting and expenditures.
18. EFA goals cannot be reached without substantial increases in financial resources to support
education and training. The ability of Government to mobilize further resources for
education is constrained under present circumstances. Education and training are free at all
levels and the government shoulders virtually all the expenses of teacher salaries and building
construction. Parents at present finance some of the operating costs of schools through
voluntary contributions.

xi
III. Plans and Strategies for Educational Development
19. The Government’s strategies for economic growth and poverty reduction seek to transform
Eritrean society and create a modern, vibrant and competitive economy. Eritrea aims to make
basic education available to all, regardless of their ethnic origin, sex and religion. The
Government is committed to meet the EFA goal of achieving universal primary education, ie
a net enrolment of 100%, by 2015. Gross and net enrolment ratios at the middle level will
reach 106.4% and 50% respectively by 2016, with corresponding gross and net enrolment
ratios of 43.4% and 35% at the secondary level. These targeted increases imply an additional
enrolment of 207,408 at elementary level, 35,258 at middle level and 56,492 at secondary.
20. In the planned five year period MOE will target out-of-school youth, reduce class sizes and
the number of double shift schools, reduce repetition and increase learning achievement.
This will allow significant gains in internal efficiency that will increase the net enrolment
ratio to about 100%, 50% and 35% at elementary, middle and secondary levels education
respectively, by 2016/17.
21. The MOE places top priority on the expansion of educational opportunities for females.
Female gender parity with males will be achieved in elementary and middle education by
2015/16. However, gender parity will not be achieved in secondary education until 2016.
22. The Ministry has introduced several new policies aimed at resolving the key problems.
These include new curricula that are vertically and horizontally integrated, specification of
expected learning outcomes for each grade and subject, learner-centered and interactive
teaching methods, and continuous assessment of student performance to facilitate efficient
student passage through the system. Greater relevance will be achieved in middle and
secondary education through the introduction of practical courses as enrichment to core
academic subjects. Policies have been drafted for TVET and Adult Education aimed at
expanding access and improving the quality of education.
23. The Ministry will pursue multiple strategies to achieve its priority objectives. The strategy
to improve access involves targeting of classroom construction for underserved areas and
populations; breaking the bottleneck on the output of trained teachers; implementing
community-based campaigns and reducing the direct and indirect costs to parents of
enrolment of their children. Efforts will also be made to extend and reinforce adult literacy
programmes, in part using media education. Within this context MOE has prepared a
separate strategy for female education including: raising gender awareness of the
communities and teachers; revising curricula and teaching materials to make them gender
sensitive, disability sensitive and age-appropriate; expanding the number of female teachers;
opening boarding schools and hostels for girls in remote areas; ensuring grade 1 entry at the
proper age; and improving gender-disaggregated data for monitoring. In adult education
extensive campaigns and interventions will be made to lower illiteracy rate to 10% during the
plan period.
24. Strategies for quality improvement include the following interventions: curricula
revisions with focus on expected learning outcomes; provision of adequate, up-to-date
textbooks; increasing teacher and school leader competencies through staff development;
improving teaching methods and time on task; provision of facilities to relieve overcrowding
and facilities and equipment for science and ICT; reduction in double shifting, stimulating
parental interest and continuing MLA studies to track progress on learning achievements.

xii
Quality of the literacy program will also be improved through the enhancement of
facilitators’ and coordinators’ competencies; curriculum review and textbook production; and
by expanding community reading centers.
25. The strategy to reduce student repetition and dropout recognizes that virtually all of the
interventions designed to increase access and boost quality will also reduce student wastage.
Such reductions are essential to reduce costs in the system and free up capacity for new
students. Both school and non-school factors will be addressed, including the use of
continuous assessment, remedial instruction, information campaigns to counter negative
parental attitudes, in part through radio and media, and building of strong, community-based
parent-teacher-student-associations (PTSA). In addition, direct incentives will be employed
for the poorest students, including financial assistance to offset the direct costs of schooling.
26. The strategy for vocational and technical skills development seeks to build demand-
orientation into the training system; achieve more effective mastery of skills competencies;
broaden coverage and expand the quantitative output of skills to meet economic requirements
in various sectors; mobilize adequate financing to augment operating costs; and strengthen
the management capacity for skills development.
27. The strategy for building institutional capacity seeks to bring better educational services
to schools through functional analysis and readjustment of structures, procedures, resources
and staff development.
28. The financing strategy calls for increased contributions from the Government,
communities, the private sector and the assistance of Development Partners to reach the
targets set out in this plan, including the MDG and EFA Goals.
IV. Overview of the five year plan
29. The Ministry’s Five Year Education Sector Development Plan (ESDP), 2013-2017,
represents a significant milestone in plans for the education sector. It translates the vision of
Government and the strategies chosen to deliver it into outputs and outcomes, and identifies
the planned inputs and activities necessary to achieve the desired results.
30. The three objectives of the plan are to:
Increase equitable access to basic (including adult and non-formal education),
secondary and technical and vocational education;
Improve the quality of basic, secondary and technical and vocational education; and
Strengthen institutional capacity to deliver better quality education services.
31. In accordance with the overall sectoral priorities, the Plan features the following three
components:
a) Increase Equitable Access to Basic education and literacy, Secondary education and
TVET;
b) Improve Quality and Relevance of Basic, Secondary education and TVET; and
c) Institutional capacity building.
32. The ESDP will achieve the following total increases by level: 44,427 more pre-primary
students, 1124 pre-primary teachers and 746 pre-primary classrooms; 207,408 more
xiii
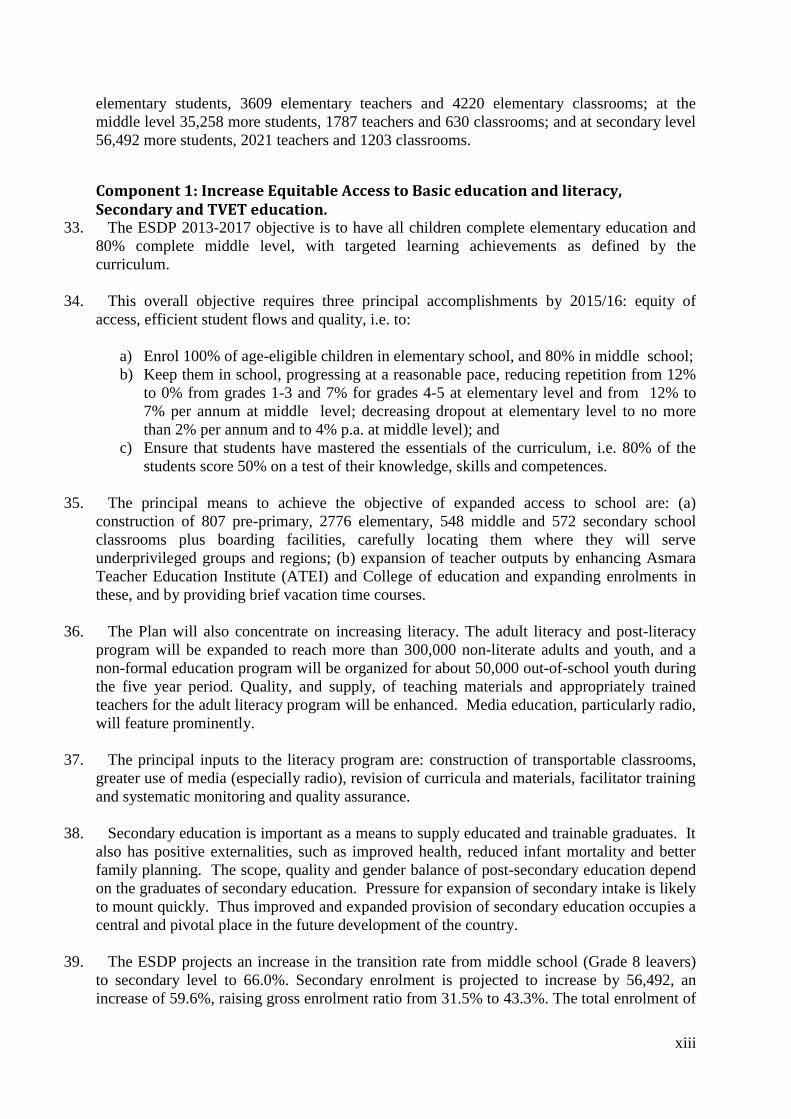
elementary students, 3609 elementary teachers and 4220 elementary classrooms; at the
middle level 35,258 more students, 1787 teachers and 630 classrooms; and at secondary level
56,492 more students, 2021 teachers and 1203 classrooms.
Component 1: Increase Equitable Access to Basic education and literacy, Secondary and TVET education.
33. The ESDP 2013-2017 objective is to have all children complete elementary education and
80% complete middle level, with targeted learning achievements as defined by the
curriculum.
34. This overall objective requires three principal accomplishments by 2015/16: equity of
access, efficient student flows and quality, i.e. to:
a) Enrol 100% of age-eligible children in elementary school, and 80% in middle school;
b) Keep them in school, progressing at a reasonable pace, reducing repetition from 12%
to 0% from grades 1-3 and 7% for grades 4-5 at elementary level and from 12% to
7% per annum at middle level; decreasing dropout at elementary level to no more
than 2% per annum and to 4% p.a. at middle level); and
c) Ensure that students have mastered the essentials of the curriculum, i.e. 80% of the
students score 50% on a test of their knowledge, skills and competences.
35. The principal means to achieve the objective of expanded access to school are: (a)
construction of 807 pre-primary, 2776 elementary, 548 middle and 572 secondary school
classrooms plus boarding facilities, carefully locating them where they will serve
underprivileged groups and regions; (b) expansion of teacher outputs by enhancing Asmara
Teacher Education Institute (ATEI) and College of education and expanding enrolments in
these, and by providing brief vacation time courses.
36. The Plan will also concentrate on increasing literacy. The adult literacy and post-literacy
program will be expanded to reach more than 300,000 non-literate adults and youth, and a
non-formal education program will be organized for about 50,000 out-of-school youth during
the five year period. Quality, and supply, of teaching materials and appropriately trained
teachers for the adult literacy program will be enhanced. Media education, particularly radio,
will feature prominently.
37. The principal inputs to the literacy program are: construction of transportable classrooms,
greater use of media (especially radio), revision of curricula and materials, facilitator training
and systematic monitoring and quality assurance.
38. Secondary education is important as a means to supply educated and trainable graduates. It
also has positive externalities, such as improved health, reduced infant mortality and better
family planning. The scope, quality and gender balance of post-secondary education depend
on the graduates of secondary education. Pressure for expansion of secondary intake is likely
to mount quickly. Thus improved and expanded provision of secondary education occupies a
central and pivotal place in the future development of the country.
39. The ESDP projects an increase in the transition rate from middle school (Grade 8 leavers)
to secondary level to 66.0%. Secondary enrolment is projected to increase by 56,492, an
increase of 59.6%, raising gross enrolment ratio from 31.5% to 43.3%. The total enrolment of

xiv
females is expected to increase substantially, over the plan period. The net enrolment ratio at
secondary level is expected to increase from 23.2% to 35%, an increase of 74.6%. The
gender parity index is expected to improve from 0.74 in 2010/11 to 0.95 in 2015/16.
40. The Plan is for increased access to be achieved through construction of 1203 classrooms,
targeting underserved areas, expansion of qualified teachers and reduction in repetition; as
well as social mobilization campaigns to increase demand for education services.
41. At secondary level, planned inputs will significantly increase the proportion of students
who gain minimum mastery level at graduation. Inputs include; curricula development,
provision of more and better textbooks, improvement of the qualifications of school directors
and teachers (including through distance education), reduction in double-shifting, enhancing
libraries and laboratories for science, expansion of ICT, and introduction of enrichment
programmes in practical skills.
42. TVET will be strengthened by the expansion of skills outputs through reinvigoration of
Skills Development Centers, building new technical schools and renovating existing ones.
The organization and management of skills development will be strengthened. In
collaboration with the Ministry of Labor and Human welfare (MOLHW) the sub-sector will
be strengthened through collection and analysis of labor market information, building the
capacity of the central MOE to take on support functions. Also, multipurpose training
providers for out-of-school youth and adults will be encouraged.
Component 2: Quality and Relevance of Education 43. The main means to achieve the objective of quality improvement are curriculum
development, expansion of textbook provision, enhancement of school support systems’
development and interventions to improve the competence of teachers through in-service
staff development, including of school leaders. Distance education features prominently in
the strategy to upgrade teacher qualifications.
44. Improvement in the quality of adult education will be achieved through the development of
curriculum and textbooks, supply of adequate teaching and learning materials and increasing
the supply of qualified facilitators and coordinators.
45. Raising the quality of skills training will be achieved through development of competency-
based training, increasing the supply of trained instructors and re-equipping of existing
training institutions. The outputs of these investments are expected to be a system of skills
formation more responsive to labor market demands, higher standards of quality, and a major
expansion in the number of beneficiaries acquiring relevant skills.
Component 3: Institutional Capacity Development
46. The ESDP draws on the findings of an institutional capacity assessment conducted in 2005.
The main activities to increase effectiveness and efficiency in the delivery of educational
services include a review of roles and responsibilities among the various actors, together with
the distribution of functions among the various organizational structures; and identification of
the gaps between needed and available inputs. The plan prioritizes support to capacity
development in: organizational development; staff professional skills development; systems

xv
development including EMIS, budgeting and human resources; updating of regulations and
addressing equipment requirements.
V. Implementation
47. The overall objective of the implementation framework is to ensure that the plan gets
implemented fully, on time and within budget. This requires, inter alia, an effective
administrative structure, efficient procedures, capable human resources and sufficient
financing for implementation.
48. Key implementers of the plan will comprise the Ministry of Education (MOE), the zoba and
local education offices. In executing its functions, the MOE will be assisted by other
government ministries and regional administrations. These are primarily the Ministries of
National Development, Finance, Public Works, Labor and Human Welfare and Justice.
49. The MOE will be responsible for the policy development and implementation of strategic,
legal, and institutional aspects of the plan and will retain oversight of these aspects. The
MOE will also retain responsibility for the management of the entire implementation process
of the plan. A Steering Committee chaired by the Minister of Education with all five MOE
Directors-General as members will; foster a common understanding of the plan goals and
policies; provide strategic oversight; review and approve annual work plans and budgets;
coordinate the various branches of the MOE in plan implementation; assess the performance
of the MOE in plan implementation; take corrective actions to avoid or overcome problems;
and report on program implementation to higher levels of government.
50. The implementation and execution functions of the MOE will be undertaken by the
respective structures of the MOE within which the technical and substantive aspects of the
plan will be mainstreamed. These structures include the various Departments at headquarters,
Zoba offices, Sub-zoba offices and schools.
VI. Monitoring, Evaluation and Reporting
51. In order to assess whether the development objectives of the ESDP are being met, a
monitoring and evaluation system will be established in the MOE. Monitoring and evaluation
of plan performance will systematically be carried out during the plan period, integrated into
the daily operation of the plan at all levels and used to encourage innovation, team building,
and local project ownership. The foundation of the plan monitoring and reporting systems
will be the Logical Framework and its key performance indicators.
52. There will be quarterly, annual and final reporting on performance measures against the
objectives and indicators of the ESDP. A Joint Annual Review Meeting (JARM) will be
convened with representation of key GSE officials from MOE and other Ministries,
consistent with the latter’s responsibility to contribute to the success of the program.
Development Partners who provide financial and other support to the Program will also be
able to participate; as well as the members of the reconstituted Education Working Group
(EWG).

xvi
VII. Costs and Financing
53. The five year ESDP will cost approximately US$ 545 million for increasing equitable
access, US$ 89 million for improving quality and relevance of education and US$ 59 million
for institutional capacity building. The overall cost for the three components amounts to
approximately US$ 700 million. The recurrent cost implications of the Plan will be
substantial. Government welcomes the support of development partners in meeting the
overall costs.
VIII. Conclusion
54. The Plan is expected to generate substantial benefits through increased access to basic
education (which includes adult and non-formal education), secondary and technical
education and improved student achievement at all levels. Major reductions are projected in
gender disparity and increased participation among other hard-to-reach disadvantaged groups.
The increased relevance of educational content and expansion of outputs from TVET
institutions will promote skills needed both for economic growth and increased personal
incomes. Employers increasingly will have access to more of the skills and competencies
they need, and the economy overall will have more of the workers required for accelerated
development. The population will also benefit from more and better education through the
resultant greater opportunities to participate fully in the civic, cultural, political, and social
affairs of the nation.

1
CHAPTER I:
1. INTRODUCTION
55. The developments and trends of education throughout the world reveal that education
systems of developing countries have made unprecedented progress in recent years.
However, the future holds major challenges for countries at all the various stages of
educational and economic development. Despite the increasing endeavour of governments,
the achievement is expected to remain the same mainly due to the rapid increase in the school
age population combined with falling enrolments.
56. Eritrea recognizes the importance of education and training for the development of the
country. Education develops the knowledge and skills required for a vibrant, competitive
economy. It enables people to generate increased income and lift themselves out of poverty.
It fosters social development and equality among the people.
57. For these reasons, the Government of the State of Eritrea considers education to be the
cornerstone of all national development efforts, particularly in human resources development,
economic growth and poverty alleviation. Accordingly, it is making significant investments
in the development of human resources by providing education and health services for the
entire population, so that they are able to fully participate in the civic, cultural, political,
social and economic affairs of their nation.
1.1 National Context and Strategy of Education
58. Eritrea, an independent state in Africa, is bounded on the east by the Red Sea, on the
southeast by Djibouti, on the south and west by Ethiopia, and on the north and northwest by
Sudan. Eritrea is one of the newest countries in Africa, having attained its independence after
a 30-year war with Ethiopia. Eritrea attained de facto independence in May 1991 and de jure
independence two years later in 1993. Asmara is its capital city. For administrative purposes,
Eritrea is divided into six regions (zobas), 58 sub-regions, 704 administrative areas and about
2580 villages.
59. Eritrea covers an area of 121,144 sq km and the Red Sea coast stretches more than 1,000
kilometers. The Denakil Depression in the southeast, which is inhabited by the Afar
community, falls below sea level and has been the site of some of the highest temperatures
recorded on earth. The National Geographic of October 2005 described it as the cruellest
place on earth, “a place of dry sands and even drier gravel beds, rocky lava flows, active
volcanoes, burning salt flats, temperatures that often top 120°F”. To the west, the coastal
plain rises sharply to the highland plateau, where altitudes range from 1,830 to 3013 meters
above sea level and annual rainfall is significantly higher than it is at the coast. The
population on the plateau is mostly inaccessible due to the rugged terrain and remoteness of
the area. Agriculture is the norm in the plateau region. Livestock raising and fishing
predominate in the north, west and in the drier coastal plains and the arid regions of the north
and west.
60. Since the last decade, Eritrea has experienced recurrent droughts and socio-economic
challenges resulting from the no war no peace stalemate with neighboring Ethiopia. These

2
contributed to the slowing down of its normal growth and development. Worse yet,
degradation of natural resources, inadequate infrastructures, and shortage of skilled human
power pose daunting constraints to its overall development process.
61. Eritrea has not had a population census since independence. The population estimates used
come from a variety of sources. In recent years, the Government has been using the total
population figure of 5.4 million, which was the estimate that appeared in United Nations
publications. However, recent demographic and health surveys indicate that the true figure is
considerably lower. The Eritrean Office of National Statistics now estimates that the total
population is about 3.6 million.
62. The national education statistics are based on age-specific population estimates provided by
the Office of National Statistics, consistent with the revised population total. Thus in the
Education Sector Development Plan, estimates such as numbers of out-of-school children and
of enrolment ratios are consistent with the revised, 3.6 million, total population figure, not the
earlier 5.4 million.
63. Eritrea’s economy is mainly based on agriculture, light industry, fisheries and services
including tourism. Almost 80 per cent of Eritreans live in rural areas, with the majority
relying on rain-fed agriculture and livestock rearing for their livelihoods. Eritrea is presently
developing its tourist industry around the Red Sea port of Massawa and the export potential
of its mineral reserves, including gold, copper and potash. Gold extraction commenced in
2011, and oil and natural gas reserves are possible. Eritrea ranked 177 of 187 countries on the
2011 Human Development Index, a composite index that combines GDP with adult literacy
and life expectancy. There are limited data on developmental and income inequality.
64. High gross domestic product (GDP) growth of 8.7% was estimated for 2011, with per
capita GDP of US$ 549 in 2012 representing a 16% increase on 2011 (IMF data). In spite of
many challenges, Eritrea undertook rehabilitation and reconstruction of the country giving
priority to food security and the construction of necessary infrastructure, the provision of
social services and social protection based on the principle of social justice.
1.2 Eritrean Education Strategy
65. The Government of the State of Eritrea considers education as key to national development.
An important milestone during the Eritrean struggle for independence was the development
of a new education system. The previous curriculum of the colonial powers deliberately
perpetuated marginalization of Eritreans and subjected them to degrading experiences and
concepts that undermined the dignity of Eritreans. For example the teaching of Eritrean
languages was replaced with instruction in the national language of the occupying forces.
During the struggle for Eritrean independence, education was considered critical to the
success of the struggle and accordingly the Eritreans involved in the struggle were given
quality education even at the battlefront. The new National curriculum was developed and it
emphasized the development of literacy in all local languages within a relevant education
system. Schools were set up mostly in open spaces in the liberated areas. All citizens were
encouraged to learn irrespective of their age, gender, ethnicity, religion, location and
occupation through formal and non-formal means. Mobile schools were opened for nomadic
populations. That experience formed the basis for innovative strategies of education service
delivery that the country still utilizes.

3
66. After independence in 1991, education for all was pursued with renewed vigor and spread
to all parts of the country. The clearest testament to the government resolve to eliminate
illiteracy was the foresighted declaration of free and compulsory education for all Eritreans
across all levels including secondary and tertiary education.
67. The Ministry of Education has adopted a three band structure (National Education Policy,
2010) consisting of basic education (that comprises pre-primary, elementary and middle
school), secondary education, and tertiary education. The structure allows combinations of
parallel formal and non-formal channels of basic education with opportunities for transition
from one system to the other. The policy further provides for transition between different
education channels in the system based on combinations of accredited academic performance
and experiential learning. Of significance is the flexibility in the system which allows a
second chance to education for the large number of the children, adolescents and young
people who are out of school with commitments to reaching EFA goals by 2015.
68. In addition to two years of pre-school, basic education lasts 8 years and is split into grades
1-5 (elementary) and grades 6-8 (middle). Secondary education lasts four years (Grades 9-12)
and it provides general secondary education in arts and sciences. There are also technical and
vocational training secondary schools where students join from general education after the
completion of grade ten. Upon completion of secondary education and based on performance
in the secondary education certificate examination students join institutions of higher learning
(tertiary), or go into technical and vocational education and training (TVET).
69. The Government affirms that education is the cornerstone for all national development
efforts This is articulated in the Interim Poverty Reduction Strategy Paper (I-PRSP, 2004),
which states that developing Eritrea's human resources capacity through education, health and
human welfare sectors is one of the key strategies for attaining the goals and objectives of
economic growth and poverty reduction.
70. The Macro-policy (1994), the National Education Policy and Adult Education policy
provide guidelines to uphold the equitable access and delivery of quality education at all
levels for all citizens.
71. Since 1993 the education sector has experienced significant progress in terms of
rehabilitation of infrastructure and in the general expansion of the education system. The
government’s macro policy objectives for education are: i) development of a population
equipped with necessary skills, knowledge and culture for a self-reliant and modern
economy; ii) development of self-consciousness and self-motivation in the population to fight
disease, attendant causes of backwardness and ignorance; and iii) provision of basic
education to all, regardless of their ethnic origin, sex and religion. These macro objectives
have subsequently been reconfirmed by the current National Education Sector Plan 2013 -
2017 of the Ministry of Education.
72. The GSE emphasis on social justice is clearly articulated in the education system’s vision as
stated in the National Education Policy 20101:
Our education system aspires to produce all round citizens along with a firm
commitment to country, people and social justice. This aspiration includes the
1MoE, National Education Policy, 2010

4
development of creative and productive individuals who are capable of
contributing towards the attainment of a modern, competitive, harmonious
and self-reliant Eritrea.
73. The 2010 National Education Policy underlines the Ministry of Education’s commitment on
reaching the unreached and the goal for creating a literate society that can provide good
quality education to all the children and at all levels. It calls for the provision of free and
compulsory basic education; the use of the mother tongue teaching at the elementary level;
and the expansion of secondary and tertiary education opportunities as the most essential
components of the education system. It also provides alternative routes for those who may
not benefit from the formal provisions. These include the Complementary Elementary
Education (CEE) for children who fail to enrol into elementary school at the right age,
nomadic education for pastoral communities, and adult literacy, which targets adults who
missed out on their educational opportunities. Upon successful completion of grade 12 and
the National Secondary Education Certificate Examination (NSECE) a student can enter one
of the seven colleges2.
1.3 Financing Education 74. Based on its standing objective of nation building, the Government of Eritrea encourages
sectors that invest in programs that contribute to poverty eradication and national food
security program. Education is among the top priority sectors.
75. The Government has shouldered the responsibility of providing education to its citizens
since independence but the resources have not been sufficient to guarantee social justice in
education. Other constraints have equally contributed to the inability to guarantee social
justice in education. For example, despite the implementation of the free and compulsory
education agenda since independence, over 30% children of school age cannot access basic
education. These statistics undermine the resolve of government to promote equity and social
justice, they also threaten the government efforts to achieve EFA and MDG goals.
76. Whereas the Government plays the dominant role in the provision of education, there are
other non-governmental (private) education providers from pre-school up to the tertiary
levels. The MOE is responsible for the training of ECD, elementary, middle and secondary
school teachers, curriculum design and development, providing textbooks and the
supervision. The central government is responsible for paying and recruiting teachers, setting
standards, providing the overall policy framework and monitoring and evaluation for the
entire sector.
77. The overall government expenditure on education represents approximately 8-10% of the
total national budget. Education expenditure as a percentage of the Gross Domestic Product
(GDP) is in the range of 2.6% to 3.7% based on the GDP estimates of the World Bank. The
basic education sub-sector share of the total government spending in 2008 was 25.3% and in
2011 it slightly declined to 25.1%. The non-salary percentage of basic education spending in
2008 was 50.7% and declined to 42.3% in 20113.
2The seven new colleges are: Eritrea Institute of Technology at Mai Nefhi; Hamelmalo Agricultural College at Hamelmalo;
College of Health Sciences, Asmara; Orotta School of Medicine, Asmara; College of Marine Sciences and Technology,
Massawa; College of Business and Economics, Halhale; and, College of Arts and Social Sciences, AdiKeih.
3Ministry of Finance, Government spending on Education (2008-2011).

5
1.3.1 Actual Spending on Education
78. In projecting costs of an education sector plan, it is necessary to show them in the context
of the amount that is actually being spent on education at present. The Ministry of Finance
provided data to the ESDP costing team in December 2012, of which the overall total is
summarised in Table A. Together with World Bank estimates of Eritrea’s GDP, these data
show education spending as proportions of GDP and total government spending. They
indicate that, in its spending on education, Eritrea may be in the lower part of the spectrum of
countries of similar income levels, perhaps giving space for increased spending.
Education Spending (including higher education) in the Context of GDP and Total
Public Spending
Actual Actual Actual Actual
2008 2009 2010 2011
GDP US$ Mn (World Bank) $1,380.2 $1,856.7 $2,117.0 $2,609.0
GDP Nkf Mn (World Bank) Nkf20,702.4 Nkf27,850.5 Nkf31,755.0 Nkf39,135.0
Total Education Spending Nkf
Mn (MoF) Nkf 763.8 Nkf908.6 Nkf1,038.2 Nkf1,036.4
Education Spending as % GDP 3.7% 3.3% 3.3% 2.6%
Education Spending as %Total
Government Spending (MoF
data)
8% 10% 8% 8%
Education Spending excluding
Higher Education Nkf Mn (MoF) Nkf 601.5 Nkf 823.1
Source: Ministry of Finance, except GDP figures, which come from the World Bank
website database, converted to Nakfa at 15 to the US dollar.
79. Further analysis of actual expenditure is not presented here, since data from the MoE show
spending grouped in different ways. These presentational differences make it difficult for
sector decision-makers and planners to manage the system with a clear understanding of what
has actually been happening in the recent past, and the relative priorities of different parts of
the sector as shown by the resources committed to them. Given that the EMIS data on
enrolment and the school system are comprehensive and produced relatively quickly, a better
understanding of where money is spent would allow good analysis of system costs, which
would be helpful to all concerned. The two Ministries are working to resolve the problem,
and it is hoped in the near future to have available an analysis, presented in an agreed form,
that meets the needs of both.
80. The government therefore appreciates the support of development partners in
complementing its programmes. Key external support to the sector has been received towards
the following specific interventions:
i) The 2003-2008 Education Sector Investment Plan (ESIP) supported by the World Bank and later became part of the ESDP;
ii) The Education Sector Development Plan (2005-2009) supported by African Development Bank, European Union, Islamic Bank, UNDP, UNESCO, UNFPA, UNICEF, and World Bank. The funding of this programme was composed of loans, grants and government contribution total of USD 90,972,780.20 and Euro 53 million

6
iii) The ESDP (2013-2017): Currently the active development partners to the sector are the African Development Bank (USD 19.7 million), Islamic Development Bank (USD 200,000) and UNICEF (USD 9 million).
81. The current partners include the African Development Bank support to the Technical and
Vocational Education and Training sub sector, UNICEF support to the Basic Education sub
sector, and the Islamic Development Bank support to elementary education. Much as
education is free across the various levels, community financing constitutes a significant
proportion of funding to the sector. Community financing includes in-kind support in the
form of labour for the construction of classrooms, the provision of scholastic items to
schoolchildren (at subsidized cost), the provision of school uniforms and payment for utilities
like water and electricity by PTAs. However, community contributions have not been
systematically quantified to determine the percentage of the total contribution to the sector.
82. The government of Eritrea welcomes more external partnerships and has initiated
discussions with potential partners including the European Union with the view to mobilising
support towards the education sub-sectors that are under-funded.
83. It is estimated that the implementation of the new Education Sector Plan will cost at least
USD 700,000,000. Basing on previous Government inputs to the sector, amounting to USD
50 million annually, the projected Government contribution to the ESP is likely to amount to
USD 250 for the five years. Other confirmed contributions are from ADB ($ 19.7 million),
UNICEF ($9 million) and Islamic Bank ($ 0.2 million). The funding gap at the moment is
$421, 000,000
2. VISION
84. The Government’s economic growth and poverty reduction strategy seeks to transform
Eritrean society and create a modern, vibrant and competitive economy. The education sector
strategy, along with other elements of the development strategy in health, agriculture and
other sectors, is designed to contribute to the achievement of this vision. The social and
economic dimensions of education are reflected in a draft mission statement of the MOE:
“To provide all citizens of the State of Eritrea with access to learning opportunities and to
ensure a quality of education and training provision relevant and responsive to individual and
national development needs. This provision shall take note of the special circumstances of
specific social groups, including disadvantaged communities.”4
3. OVERALL OBJECTIVES
85. The Government’s Macro-Policy (1994) was the first document to establish the objectives
of the education sector. They remain valid today. The overall objectives are: (i) the
development of a population equipped with necessary skills, knowledge and culture for a
self-reliant and modern economy; (ii) development of self-consciousness and self-motivation
in the population to fight disease, attendant causes of backwardness and ignorance; and (iii)
provision of basic education to all, regardless of their ethnic origin, sex and religion.
4 Ministry of Education, Our People Are Our Future: A Framework for the Development of Human Resources
in the Education Sector,” 2001, 27.

7
86. The Macro-Policy also defined a policy framework for the sector, which envisaged:
Providing Universal Primary Education (up to seven years)
Meeting skilled manpower/labour requirements of both the public and private sectors by
steadily increasing enrolments at the secondary, technical and vocational schools.
Promoting continuing education through formal and informal channels to achieve higher
literacy rates and technical competence.
Expanding tertiary education to meet the envisaged manpower/labour requirements of the
country.5
87. The Concept Paper for a Rapid Transformation of the Eritrean Educational System (2002)
refers to problems of access to education at all levels including higher education, lack of
employment orientation and the wastage of resources. It states,
“The time is ripe for the Eritrean government to make all the necessary changes and
reforms … to make the Eritrean education system measure up to the needs of the country
to produce the people necessary to propel it forward as a viable … nation of the twenty
first century. The reforms must achieve the following:
All wastage of person power, resources, effort and time in the educational system
must be abolished inasmuch as it is humanly possible
All doors and opportunities must be open to Eritreans of all ages to develop to
their full potential both professionally and personally.
Education must be employment oriented such that at the end of any level of
education any person can find gainful employment commensurate with the
person’s level of education and training.
The standards and quality of education and training in the education system must
be high enough such that products of the educational system would have a high
degree of acceptability in … employment”.6
4. STRATEGIC PRIORITIES
88. The following priority areas have been adopted by the Ministry as the most important for
development over the coming five years:
Increasing equitable enrolment in basic and secondary education through the construction
of classrooms and ancillary facilities and targeted interventions aimed at girls and other
disadvantaged children.
enhancing and expanding the provision of literacy and continuing education for adults
and out of school youth;
Improving the quality of basic, secondary and technical and vocational education by
expanding teacher training and professional support, replacement of expatriate teachers
by Eritreans at secondary level; development of curriculum and pedagogical reforms;
improvement of educational support systems;
Developing technical skills and technology training, by expanding existing technical
schools and establishing new ones with due attention to cost-effectiveness and the
5 Eritrea, Macro- Policy, 1994, 39-40.
6 Concept Paper, 5-6.

8
technical skills and training geared to meet labour market demand. Training will be
imparted in trades selected in consultation with the local industry to create strong
employment linkages;
Strengthening sector capacity to deliver better quality educational services by developing
institutional capacity of the Ministry and regional offices in matters of policy planning,
management, and monitoring and evaluation to implement the intended transformation of
the education sector.
5. OVERALL TARGETS
89. The Government is committed to meeting the EFA goal of achieving universal primary
education by 2015. The Government aims to achieve a net enrolment ratio of 100% in
elementary school by 2016/17. At the middle level Gross and Net Enrolment Ratios
(GER/NER) will reach 106.4% and 50% respectively over the same period, with
corresponding GER and NER of 43.4% and 35% at the secondary level. In the next five
years, this increase requires an additional enrolment of 207,408 at the elementary level,
35,258 at middle level and 56,492 at secondary level. The projected enrolments are based on
the assumptions that GER at elementary, middle and secondary levels will reach 126.5%,
106.4% and 43.4% respectively by 2016/17. During the same period NER are expected to
reach 100%, 50% and 35% at elementary, middle and secondary levels respectively. It is also
targeted to reduce class sizes and number of double shift schools, and concentrate on
reducing repetition and dropout rates while at the same time increasing learning
achievements. These measures will enable significant gains in internal efficiency, which will
increase the number of age-appropriate children by about 190,468 at elementary level, over
the same five year period.
90. Ministry of Education (MOE) has established pre-primary (formal and non-formal) schools
within the education sector and has adopted a policy of support for 2 years of Early
Childhood Development for each child prior to enrolling in elementary school. The target of
the five year plan is to have 30% of the children within the 5-6 year age range enrolled in
these schools.
91. In the adult education program the target is to achieve 90% adult literacy (from the current
baseline of 74%).
92. The target for technical and vocational education is to admit about 20% of students who
complete grade 10 to Vocational high schools. Students will be provided with integrated
knowledge and skills-based education and training to ensure adequate supplies of competent
people, with adequate skills for the attainment of the government’s overriding national
development priorities.
93. Gender targets have been set for general education, adult education and technical and
vocational education to ensure that the participation and success of girls and women increase
in tandem with that of boys.
94. However, entrenched problems in Eritrea’s education and training system impede its ability
to accomplish the sector goals. These problems include: inadequate access to education, low
quality, low internal efficiency of education and limited delivery and human and financial
capacity. These problems are examined in sequence in Chapter 2, followed by the

9
Government’s policies (Chapter 3) and strategies, objectives and activities in Chapter 4 and
finally the implementation arrangements and monitoring and evaluation Chapter 5 onward.

10
CHAPTER II: INSTITUTIONAL CONTEXT
1. Progress and achievements
1.1 Access and Equity
95. When liberation was achieved in 1991, access to education was extraordinarily limited in
terms of coverage of the school-age population; infrastructure had deteriorated, the teaching
force was inadequate in terms of both quantity and qualifications, teaching and learning
materials were inadequate in quantity and quality, the curricula were out of date, and the
capacity to plan and manage the education system was markedly deficient at both the national
and zoba levels. These challenges confronted all levels/types of education: primary, middle,
secondary, vocational and technical, tertiary, and adult education.
96. Eritrea has achieved significant progress in rehabilitating and expanding the education
system. In the last five years (2005/06-2011/12):
The number of kindergartens at pre-school level increased from 462 to 476 out of
which 239 are Community Care Giver Centres. The gross enrolment ratio for pre-
primary increased from 21.6% to about 31.4% of the 5-6 age group. From 2005/06 to
2009/10 enrolments at elementary level decreased from 364,263 to 286,021 and
started to increase in 2010/11 to 334,245;
Over the same period enrolments at middle school increased from 148,082 to 167,928
students (Chart 1).
Adult Literacy rate has increased from 56% (DHS 2002) to 74% (EPHS 2010);
Secondary school enrolments increased from 77,644 in 2005/06 to 94,758 in 2010/11
(Chart 1);
Enrolments in Technical and Vocational Education increased from 1547 in 2005/06
to 4640 (an increase of 200%) in 2010/11.
Elementary education curricula have been developed and implemented in all nine
Eritrean languages. Instructional materials have been produced in all these languages;

11
Chart 17: Gross Enrolment by Level and Year, 2005/06 – 2010/11
Source: Eritrea: Essential Indicators, 2010/11.
Chart 2: Gross Enrolment Rate by Level and Year, 2005/06 – 2010/11
Adult Education
97. Despite the unfavourable socio-economic conditions in the region due to conflict, drought
and economic hardship, provision of a sustained adult literacy program in the past and the
increase of adult literacy rate can be taken as a remarkable achievement. The initiative taken
to introduce alternative education for out of school children in creating access to the basic
literacy program is also another important example of progress made where many boys and
girls benefited.
98. Among the remarkable achievements recorded in the past 20 years in the area of adult
literacy in the country, the major ones are the following:
It is encouraging to note that around 85.2 per cent of the youth population (15-24
years old) and 74% adults age 15-49 are literate. The latter increasing from about 20%
in the post-independence period (1991/1992);
7 Unless otherwise indicated, all tables and graphs derive from Eritrea: Essential Indicators, 2010/11.

12
Development of National Policy for Adult and non-formal education;
Curriculum developed and instructional materials prepared and published in all local
languages for the literacy program (literacy and post literacy);
More than 80 community reading rooms attached to literacy program established
contributing to the creation of a literate environment (cultivation of the habit of
reading and promotion of self-learning);
Preparation and use of different monitoring and evaluation forms and instruments;
Awareness creation among the population and stakeholders in the country on the
importance of literacy and continuing education;
The provision of alternative, complementary elementary education for out of school
children in which more than 800 children were mainstreamed to the formal school at
the middle level with encouraging progress; and
99. However, enrolments in adult literacy decreased sharply from 101,730 in 2005 to 46,125
participants in 2010, of whom 40,828 were female. (Chart 3)
Chart 3: Enrolment in the Literacy Program by Gender and Year, 2005/06 – 2010/11
100. According to survey findings and reports from the regions, the decline in literacy enrolment
as seen in Chart 3 is due to two main reasons: firstly, it is due to the decrease in the number
of illiterate peoples in areas where the literacy program had been functioning; and secondly,
related to rather loose co-operation of partners in motivating potential learners to attend
literacy learning centers. Nevertheless, a comprehensive survey will be required to
investigate the illiteracy status and establish accurate current figures.
101. Complementary Elementary Education (CEE) for out of school children is a government
program managed as part of the adult literacy and post-literacy program in the country. It
started as a pilot project in 4 zobas (Semenawi Keih Bahri, Debubawi Keih Bahri, Anseba &
Gash Barka). The main target groups are disadvantaged boys and girls 9-14 years old. In the
past five years (2007-2010) more than 10,000 children (about 50% girls) have benefited at
the first level and more than 800 joined the formal system at middle level.
102. This initiative is in line with the Education for All (EFA) national commitment as a second
chance opportunity. In this five year plan this initiative will be scaled up in order to
accommodate more children from the disadvantaged areas.

13
103. It is also intended to mainstream out-of-school children into appropriate levels in the formal
school system or into apprenticeship schemes or TVET depending on their age, capacity and
interest. It is therefore expected that successful completers of the four year program will be
admitted to grade 6 in the middle school phase.
Technical Education
104. The Government has given top priority to the production of high–quality human capital
which is highly trained and capable of mastering and exploiting available technology for
socio-economic development of the country. In this regard, the Technical and Vocational
Education and Training (TVET) sub-sector in Eritrea aims to produce semi-skilled and
skilled intermediate level technicians in order to meet the demand for labour and improved
productivity.
105. In the past decades considerable progress has been made to promote the provision of
technical and vocational education and training in Eritrea. Among these are:
The establishment of five skill development centers;
The construction of two technical schools and two agricultural schools at the secondary
school level;
A commercial school and a technical institute at advanced level;
The construction of a technical and commercial school in Massawa;
The establishment of the National Vocational Training Center (NAVCOT).
106. Technical and vocational education and training has been provided by various providers on
a numerically limited basis.
Chart 4: Technical and Vocational Training – Intermediate Level
Enrolment by Gender and Year, 2005/06 – 2010/11
107. As a result of the above mentioned interventions enrolments in Intermediate Technical and
Vocational Education has substantially increased from 1547 in 2005/06 to 4640 in 2010/11
(Charts 4 and 5).

14
108. Recently, the government has prepared a road map for development of education in Eritrea.
In line with the road map MOE has expanded the opportunity to technical and vocational
education by establishing a new post-secondary technical and vocational training center in
2007/08. As a result, enrolment has substantially increased in the last four years. As seen in
chart 5, the total enrolment in both TVET institutions has been decreasing from 5217 in
2007/08 to 4620, 4012 in 2008/09 and 2009/10 respectively. Then it increased to 4640 in
2010/11. The high enrolment recorded during the academic years 2007/08 and 2008/09 was
due to the temporary arrangement made to all technical schools to halt accepting students
from grade 10 and enrol students who finished grade 12. However, since 2009/10 they have
resumed their regular program and have started to enrol students who complete grade 10.
109. Recently, external financial support has been provided by the African Development Bank
(ADB). This will assist the equipping of schools and some new construction.
Chart 5: Total Enrolment in NAVCOT and Technical Schools,
2007/08 – 2010/11
1.2 Quality and Relevance of Education
Curriculum Planning and Development
110. As part of the governments’ decision to undertake strategic transformation of education,
MOE, since 2003 has undertaken a comprehensive curriculum review and is continuing to
implement the resultant program. Since then substantial progress has been achieved in terms
of articulating the new curriculum, developing procedural guidelines, designing of syllabus,
developing scope and sequence, and writing of textbooks8. To date a total of 500 titles of text
books have been developed, printed and distributed for general education. Significant efforts
have also been made to ensure participation of teachers in curriculum development processes
and to familiarize them with the newly produced materials so as to implement them
effectively. In addition, a National Curriculum Framework has been developed and
disseminated. The adult education curriculum has also been reviewed and will continue the
process.
8 All textbooks for grades 1-5 are made available in all nine mother tongue languages.

15
111. To improve the quality of the training in Technical and Vocational Education a competency
based curriculum has been developed. This will help competencies in various institutions to
be closer to the necessary standards.
112. Although some text books for TVET have been developed there are many areas like
citizenship education, physical education, Eritrean languages, and ICT where additional work
is required.
Monitoring and Quality Assurance
113. In order to improve the quality of education through the establishment of an effective and
efficient monitoring and quality assurance system in the country various interventions were
made in the last five years.
114. Policies, guidelines, rules and regulations, standards and manuals related to supervision,
school organization and pedagogy have been developed to enhance the implementation of
school-based support and supervision. Monitoring the implementation of the curriculum in
schools has also been introduced and on-going. In addition, a study on the application of
learner-centered and interactive pedagogy has been carried out leading to the provision of
hands-on professional support to teachers and school directors. Various in-service training
programs, workshops and seminars have also been conducted for teachers, school directors
and supervisors.
115. Moreover, the Pedagogic Resource Centers (PRC) have been strengthened through the
training of PRC coordinators and equipping them with basic tools and equipment. Efforts
have also been made to institutionalize school-based delivery of health and nutrition
services9. Monitoring of the opening and performance of nomadic schools has also been
conducted. Sample schools were targeted to become child-friendly schools by providing
materials and improving facilities. Endeavour has been made to consolidate the partnership of
schools and communities through the capacity-building of members of Parents Teachers and
Students Associations (PTSA).
116. In the last five years almost all secondary schools were equipped with adequate laboratory
chemicals, materials and equipment. A national conference on the Effective Usage of Science
Laboratories in Secondary Schools was conducted and a manual called Safe and Effective
Usage of Secondary School Science Laboratories issued. In addition, school libraries were
consolidated with modest number of books both from donation and through purchasing.
117. To enhance learning through the introduction of ICT, computer laboratories were
established in secondary schools and are being equipped with computers. Computer labs have
also been established in some middle level schools.
9 In remote areas it is impractical to send health workers to schools but a scheme to train one focal teacher per
school in the basics proved very successful. Health kits were provided and students screened on a regular basis
for infection in ears, eyes, skin, etc. for pupils requiring medical attention being referred to nearest health points
or hospital. Attitudes and practices improved dramatically and a positive correlation was found between hygiene
and performance.

16
Assessment and National Examination
118. Assessment and national examinations is another means of ensuring the quality and
relevance of education. Monitoring of students’ learning achievements have been conducted
through regular national examinations at the end of basic education as well as by conducting
Monitoring Learning Achievements (MLA) assessments.
119. In order to enhance the practice of continuous assessment a new guideline on Learner
Assessment and Progression Guide (LAPG) has been developed and since 2010 piloted in
some schools to ensure its effectiveness. In the last three years training and workshops on the
new assessment guideline have also been provided to teachers, directors, supervisors and
other concerned bodies at national and regional levels.
120. In response to a study on the alignment of curriculum and national examinations, the latter
will be redesigned to ensure that their content, style and approach fully complement the
objectives of the new curriculum. This will act as a powerful incentive to teachers, schools
and students to ensure that teaching and learning are oriented to the new curriculum’s
emphasis on the development of knowledge, skills and competences.
Teacher Development
121. To enhance learning and improve quality of education various in-service training programs
have been conducted for teachers at various levels and sub-sectors. These include the
following:
Trainings in educational research methodology were conducted for about 350
secondary school directors, teachers and MOE officials at various levels of the
sector.
In the area of pre-service training programs, 3,000 elementary school teachers were
trained at a certificate level. A variety of study materials such as life skills and fine
arts were developed by the trainers in collaboration with international consultants.
Asmara Teacher Education Institute (ATEI) curriculum was revised and a new
curriculum for diploma program was also designed. Several awareness raising
workshops were conducted at ATEI for the trainees. Teaching practice
consolidation is carried out annually.
About 2,080 under-qualified middle school teachers upgraded to a college diploma
level via Open & Distance Learning Program (ODLP) in collaboration with Eritrean
Institute of Technology (EIT). Upgrading for Directors, Internal Scholarship for
educational administrators, training on library science, laboratory science, for TVET
Instructors and adult education facilitators was conducted over the past few years.
Induction for newly appointed basic, middle and secondary school teachers has been
conducted annually.
The Ministry in collaboration with the EIT trained 47 existing instructors at diploma
level. However, as the TVET schools are at intermediate level it is required that in
the near future the qualification of instructors to be upgraded to degree level.

17
Fourteen TVET instructors completed a training course in methodology through in
service program graduating at certificate level.
1.3 Institutional Capacity
122. The capacity of MOE at all levels to deliver better quality educational services, is
comparatively limited. The limitations pertain to organization, policy and planning, staffing,
systems and procedures. Inadequate management systems are problematic, including lack of
modern financial management, budgeting, expenditure reporting and comprehensive
databases. Corresponding equipment and logistical procedures are also inadequate. However,
in the last five years MOE has made the following interventions to build the institutional
capacity:
123. In the area of research, the MOE has conducted a number of studies on a variety of
educational issues. The studies conducted on sector and sub-sector issues are the following:
Reviewing the National Education for All (EFA) Framework for Action,
Study on the ‘Management of Teachers’,
Study on The causes of Repetition and Dropout Rates in Secondary Schools’,
Study on the impact of financial incentives on girls’ enrolment, retention and
performance10
National Literacy Survey,
Preliminary study on the causes of enrolment decline in elementary schools.
A curriculum impact study,
Effectiveness of mother tongue,
Application of learner-centered and interactive pedagogy,
Alignment of curriculum and national examination,
Alignment of educational level Expected Learning Outcome (ELO) with Eritrea
National Qualification Framework (ENQF),
Pilot studies on the different textbooks under trial,
Follow up studies of 1,800 former ATEI graduates,
Sub-sector studies on ‘Eritrea Sub-Sector Review-Technical-Vocational
Education and Training’ and Adult Education.
124. To enhance the effective monitoring of the delivery of quality education, planning and
informed decision making the MOE has extensively worked to establish a comprehensive and
full-fledged Educational Management Information System (EMIS). As a result a situational
and stakeholders’ analysis has been made to initiate a comprehensive development of the
EMIS. Following the assessment a Functional Requirement Specification (FRS) and
Technical Requirement Specification (TRS) have been developed. Currently, the software
development is underway.
125. An intensive upgrading program has been made to enhance the management capacity of the
Ministry’s staff at all levels. About 400 MOE personnel have been upgraded to diploma,
degree and masters level through distance education.
10
The study showed that even a modest but well-targeted incentive scheme could be very successful leading to
postponement of marriage, regular attendance and marked increase in retention (through grade 8), and reduction
on dropout

18
126. In addition, sector and sub-sector policies have been developed.
The National Education Sector Policy has been updated.
A national curriculum framework which contains guiding principles for
curriculum development was prepared.
Early childhood development policy and a strategy guideline for Community
Caregivers have been developed.
A framework for Early Learning Development Standard has been prepared.
Policy and Strategy on Inclusive and Special Needs Education has been prepared.
A School Library Policy was prepared in collaboration with the Library and
Information Association of Eritrea (LIAE);
A National Policy Framework for Technical Education and Vocational Training
has been developed;
A National Policy on Adult Education has been prepared;
A teacher education development master plan has been developed;
The National strategy for teacher education has been developed;
A Policy statement on teacher education has been produced;
Continuing professional development (CPD) frame work was created;
More than 50 CPD modules have been produced.
2. Challenges
2.1 Low access/low equity
127. In this report “Access” refers to the opportunity to enter, remain and complete successfully
a level of education. “Equity” is defined by equal participation in education by various
groups, such as in relation to gender, geographical distribution and ethnicity.
128. Although access has expanded by a wide margin for Eritrean youth since independence, as
seen in Chart 2 the GER has recorded a decrease for all levels. This shows that the number of
children out of school still remains substantial, as shown in Chart 6. Despite all efforts, the
number of children not enrolled has been reduced only slightly, by about 5,000 over the past
5 years. Approximately 121,000 (30%) school age children (7-11) are not enrolled in
elementary school at present creating a major challenge for the Government and limiting the
potential for economic growth and development.

19
Chart 6: Number of Children age 7-11 out of school, 2005/06 – 2010/11
(Population age 7-11 less the net enrolment of children 7-11 in elementary level.)
129. The major challenges of adult and non-formal education are the high illiteracy rate in the
country (about 26% in 2010); the risk of relapsing into illiteracy and a very low practice of
evening programs limited only to certain cities and towns. Enrolment (access) and academic
attainments of continuing education (evening programs) have also been very low.
2.2 Equity by location.
130. Disparities exist in access by region and gender across all levels of the education system.
Gross and net enrolment ratios differ widely by region, as shown in Charts 7 and 8. For
instance, GER varies from 56.6% in Debubawi Keih Bahri to virtually 109.5% in Debub.
NER varies from 45.7% in Debubawi Keih Bahri to 86.3% in Debub.
Chart 7: Elementary Level Gross and Net Enrolment Ratios by Region, 2010/11
131. At the middle level, the range of GER performance is equally disparate, from 34.1% in
Debubawi Keih Bahri to 87.2% in Debub. The equivalent variance in NER in these two
zobas is 16.5% and 51.9%.

20
Chart 8: Middle Level Gross and Net Enrolment Ratios by Region, 2010/11
132. At the middle level several factors explain the disparities, including shortage of schools,
community attitudes to education, population density and difficult to reach populations such
as nomads. The latter has been informally estimated to reach some 30% in the region.
Chart 9 shows the GER and NER for secondary education by region.
Chart 9: Secondary Level Gross and Net Enrolment Ratios by Region, 2010/11
133. At the secondary level the range of disparity in GER among the regions is from 12% in
Gash Barka to 49% in Maekel. The equivalent NER range is from 9.1% in Gash Barka to
38% in Maekel.
2.3 Equity by gender.
134. Significant differences exist between boys and girls in school enrolment. As seen in the
gender parity index (Chart 10) the gap widens at successive stages of the education system.
The GPI is 0.81, 0.80 and 0.74 at elementary, middle and secondary levels respectively.

21
Chart 10: Gender Parity Index (GPI) by Level, 2010/11
Chart 11: Gross and Net Enrolment Ratios by Level and Gender, 2010/11
135. Chart 11 demonstrates how the gap for girls of GER and NER increases at successive
stages of the education system.

22
Chart 12: Enrolment by Level, Gender and Year, 2005/06 -2010/11
136. As demonstrated in charts 11 and 12, the gender gap widens with successive levels of the
education system. Clearly, Eritrea has a long way to go to achieve gender parity, particularly
in secondary level.
137. Significant differences also exist in rates of youth literacy aged 15-24 by gender. It has
been estimated that 88.3% of Eritrean men are literate, compared with only 61.4% of the
women (EPHS 2010). It is considered essential that learning needs of parents and their
children are addressed in parallel, accompanied by awareness raising measures to encourage
the parents as to the value of education.
138. The participation of girls and women in technical-vocational education and training is also
low. Only about 36.6% of the students enrolled in intermediate technical and vocational
schools in 2010/11 were female and 38.4% in the post secondary level technical and
vocational schools (Charts 4 and 5). These fields are perceived as male domains, yet they are
areas where women could acquire important employable skills.
139. There is also considerable scope for ‘on the job’ training, notably in agriculture and
construction, but also in small scale enterprises engaged in such sectors as apparel,
dressmaking, and hairdressing, considered to be well-paid jobs, yet can be trained for with
basic inputs. Small-scale production, e.g. Of eggs, honey and livestock, can be relatively
lucrative even on the basis of very small outputs.
140. As seen in chart 4 access in Technical and Vocational Training – Intermediate Level –
decreased to 1085 in 2006/07 and 697 in 2007/08 and then increased to 1304 in 2009/10 and
1992 in 2010/11 academic years.

23
Chart 13: Total Enrolment in Grade 12 and Number of Graduates from Technical
School by Year, 2004 -2011
141. As the graph in chart 13 indicates, the percentage of graduates from TVET institutions as
compared to grade 12 enrolment was insignificant. Graduates from TVET institutions were
7%, 7.8% and 6% in 2004, 2005 and 2006 respectively. However, during the interventions
made by the government in 2007 to expand Technical and Vocational Education, a new
centre for technical and vocational education was opened. As a result, enrolment as well as
the number and percentage of graduates have increased as seen in Charts 13 and 14.
Chart 14: Percentage of TVET Graduates by year, 2005 – 2011
142. The factors that hinder access of children to education emanate from both supply and
demand sides.
Educational (supply side) factors include: shortage of schools especially in sparsely
populated rural areas, combined with overcrowded classrooms; shortage of female
teachers; shortage of trained teachers in mother tongue; lack of sanitation facilities;
implementation of the school curriculum to adapt to local realities and inadequate
supply of learning and instructional materials.

24
Environmental (demand side) factors comprise: poverty including inability to afford
the direct costs of schooling as well as the indirect, opportunity costs (demand for
children’s labour); long distance to schools; limited parental and community
involvement in schooling; social and cultural obstacles, such as early marriage and
undervaluing the benefits of education.
143. The inadequate supply of female teachers is linked to low female enrolment. Only 40.6%,
14.4% and 14.4% of the teachers at elementary, middle, and secondary are female. Similarly,
another important barrier to girls’ (and other disadvantaged children’s) participation in
education is the domestic responsibilities assigned to them. Girls, more than boys, are
expected to carry out domestic chores such as fetching water, collecting firewood, caring for
siblings and grinding work. The Government raised the legal age of marriage to 18 years, but
many communities continue to support under-age marriages. Many parents traditionally have
viewed the education of girls as irrelevant for future wives and mothers.
2.4 Teacher Supply
144. Inadequate teacher supply exerts constraint on the capacity of the Ministry to expand and
improve enrolments, particularly at the middle and secondary levels11
. At present, only one
regular teacher training institute is mandated with responsibility of preparing teachers for the
elementary school system. The Asmara Teacher Education Institute (ATEI) has been
offering a one year pre-service teacher preparation for secondary school graduates. The
College of Teacher Education (attached to the Eritrea Institute of Technology) started a two-
year diploma course for middle school teachers and is expected to expand the training for
secondary schools. Teachers for secondary school are recruited from among graduates in the
various colleges, on average about 500 per year. However, plans were made to enrol more
teachers per year for secondary schools and technical schools at the College of Teacher
Education and other colleges in order to fill the gap. Continued recruitment of expatriate
qualified teachers at secondary level will be necessary over the next five years, but it is the
government’s intention that this will gradually be reduced to locally qualified and trained
Eritreans become available. Apart from graduates from the college of Education, most
recruits from various colleges are unlikely to have firm grounding in educational theory and
practice. Teachers with shorter initial training programmes will require intensive in-service
training and follow-up on the job.
145. The MOE recognizes that recruitment of suitable teachers for schools in sparsely populated
rural12
areas, especially among the nomadic population, will continue to present a challenge,
due to the perception that such locations are uncongenial and also because teachers need to be
fluent in the appropriate mother tongue in one of the nine languages. It therefore intends to
recruit some of the best young grade 10 leavers from such communities for employment in
their own areas and will use a mix of incentives and professional training to attract
candidates.
11
Nine mother tongue languages are used as the medium of instruction through grade 5, succeeded by the use of
English from grade 6. 12
A hardship allowance of between 10% and 25% is paid to teachers in lowland areas.

25
2.5 Low Learner Achievement
146. The Monitoring of Learning Achievement (MLA) study of 2008 showed the proportion of
students in elementary education who acquired learning competencies in core subjects.
Minimum mastery level (MML) was defined that 80% of the learners should attain at least
50% in each subject. The study found reason for deep concern that the massive effort done at
extending educational access is not producing the desired quality. None of the regions or
grade 3 tested achieved the minimum mastery level in any subject, but 52% of females
achieved the MML in mother tongue. Low performance in mathematics and English is a
matter for national concern. As with access, learning achievements also varied widely by
region, with Maekel 2.6 times higher than the Anseba region in overall Grade 3 mastery. The
performance of all regions was markedly lower in Grade 5 than in grade 3. An improvement
in girls’ education not only requires better access to school, but also better success in school.
Girls’ combined scores compared favourably with males at grade 3 in Mathematics, but
significant differences existed in English performing 12 percentage points below boys.
Nevertheless, girls have performed at grade 3 in Mother Tongue 9.6 percentage point higher
than boys. At grade 5 both girls and boys performed equally.
2.6 High wastage in general education
147. The general education system in Eritrea tends to be wasteful of resources. Until recently
repetition rates have been strikingly high at all three levels, with 11.3%, 10.9% and 10.6% at
elementary, middle and secondary levels respectively in 2010/11, as Chart 15 shows.
Chart 15: Percentage of Repeaters by Level and Gender, 2010/11

26
Chart 16: Percentage of Dropouts by Level and Gender, 2010/11
148. Dropout rates are also significant, including an average of 4.9% per year at elementary
level, 5.5% at middle level and 7.8% at secondary level in 2010/11. Repetition and late entry
account for the extraordinarily large differences between gross and net enrolment ratios. The
MOE estimates that it takes 6.5 student-years of inputs to graduate one student from grade 5,
or a coefficient of efficiency of 77%. Twenty two percentage points separate the gross and
net enrolment ratios at elementary level (92% compare with 70%, respectively) and 30
percentage points at middle level (62% compared with 32%). This means if there were
perfect internal flows and efficiency an additional 22% and 30% of the age group could be
accommodated within existing institutions. High repetition rates increase the cost of
education for government and families (the latter because of incurring opportunity costs over
an extended period) and deny other children the prospect of opportunity for schooling. Issues
of repetition and dropout must be faced in order to solve the access equation.
149. As with access and quality, the causes of repetition are rooted both in school and non-
school factors. Some of these have already been mentioned under access and quality. In
addition, repetition is encouraged by selective examinations and the limited places available
as learners progress up the education ladder. Learners may sometimes repeat grades several
times to improve their chances of qualifying for a place in the upper grades. The annual
reports of the regional offices showed that the reasons for child non-enrolment, absenteeism
and dropout among others are socio-economic conditions of the family/household, attitude
and cultural norms of parents and distance to school.
150. The reports show that bringing schools closer to the children could help encourage
enrolment and staying in school. However, it is not enough. Parental attitudes also need to
be changed, and in some cases incentives provided to boost enrolments.

27
Chart 17: Survival Rate to Grade 5 by Year, 2005/06 -2010/11
151. The trend of the survival rate to grade five (a cohort of pupils who enrolled in the first
grade of elementary education in a given year and who eventually reached grade five) was
70.0% in 2005/2006 and increased to 80.0% in 2010/2011. The lowest survival rate recorded
was in 2008/09, where it reached 68%. At national level, the survival rate to grade 5 was 80%
in 2010/11. Among the regions, survival rate to grade 5 was the highest in Maekel (92.9%),
followed by Anseba (83.7%), Debub (81.1%), Semenawi Keih Bahri (80.5%), Debubawi
Keih Bahri (70.9%) and Gash Barka (65%).
Chart 18: Transition Rate from Elementary to Middle Level
by Year, 2005/06 – 2010/11
152. The transition rate from elementary to middle education increased from 63% in 2005/2006
to 76.5% in 2010/11. The lowest transition rates were recorded in 2005/06 and 2008/2009
when they reached 62.8 and 63.1% respectively. The rates then started to increase to 72% and
77% in 2009/10 and 2010/11 respectively.

28
153. Across regions, Maekel has the highest transition rates from elementary to middle level
education (91.2%). It is followed by Anseba (81%), Semenawi Keih Bahri (77.5%), Debub
(77.4%), Debubawi Keih Bahri (67.9%), and Gash Barka (60.9%) over the same period.
Chart 19: Completion Rate of Grade 5 by Year, 2005/06 to 2010/11
154. Moreover, the elementary cohort completion rate (the ratio of total number of students
successfully completing the last year of elementary education grade 5 in a given year to the
total number of children of official graduation age in the population of age 11) has shown
some decrease over the last five years. It was 61.5% in 2005/06 and decreased to 51.2% in
2010/2011. Although completion rates for elementary education are fairly equal by gender,
about 49% of the students who enter do not remain and complete the cycle. In the coming
five years it is intended that as a result of various interventions the cohort completion rate in
elementary education will be increased.
2.7 Limited institutional and financial capacity
155. The capacity of MOE at all levels of the education sector to deliver quality educational
services is comparatively limited. The limitations pertain to organization, staffing systems
and procedures. The MOE has devolved many functions to the zobas, including managing,
administering and supporting basic and secondary schools. This has placed additional
responsibilities on the zobas without commensurate staffing resources, particularly of
managerial and administrative staff. The MOE itself has seriously tackled its functions of
planning, policy making, monitoring and regulating the educational system. However, MOE
staffing appears to be inadequate in key functions. Skills of staff may also be inadequate. In
addition, functions in the MOE could be distributed better to eliminate overlapping between
Departments. Inadequate management systems are other issues, including lack of modern
financial management, budgeting, expenditure reporting and comprehensive databases.
Corresponding equipment and logistical procedures are also inadequate. These problems
result in slow and inefficient delivery of services to the schools.

29
156. Finance. It is clear that EFA goals cannot be reached without substantial increases in
resources to education and training. One way would be for the Government to increase
markedly its spending on education. However, the ability of the Government to further
mobilise resources for education are constrained. The ability to mobilise sufficient domestic
funds to finance the provision of learning opportunity to all citizens is limited. The
participation of various groups to broaden financial resources for education becomes
imperative. At present parents share the costs of education by financing through registration
fee virtually all school expenditures outside teacher salaries and textbooks. Receipts from the
fees are virtually the only disposable funds available to schools for operating expenses. Low
income students are exempted, but the direct costs to other parents may be an obstacle to
enrol their children. Little cost sharing occurs with the private sector. Eritrea has low levels
of non-government provided education at all levels. As a result, the Government has had to
shoulder virtually all of the provision of education and training.
Table 1 shows some of the key features of the Ministry’s five year projections for pre-primary,
elementary, middle and secondary levels.
Table 1- Projected Transition Rates, Total Enrolment and Enrolment Ratios13
,
2011/12 to 2016/17
Base Year 2011/12 2016/17
Pre-primary
Total Enrolment 45,824 90,251
GER 31.4 40.0
NER 19.6 30.0
ELEMENTARY
GAR (%) 123.2 126.0
Total Enrolment 334,245 541,653
GER 93.2 126.5
NER 73.0 100.0
MIDDLE
Transition Rate (%) 89.3 90.3
Total Enrolment 167,928 202,931
GER (%) 70.2 106.4
NER (%) 39.9 50.0
SECONDARY
Transition Rate (%) 37.95 66.0
Total Enrolment 94,758 151,250
GER (%) 31.5 43.4
NER (%) 23.2 35.0
GAR = gross admission ratio; GER= gross enrolment ratio; NER = net enrolment ratio
Chart 19 shows the total projected enrolments by level.
13
Projections of school age-population are taken from estimates made by the National Statistics Office.

30
Chart 20: Projected Enrolment by Level, 2010/11 to 2015/16
157. The Government places top priority on the expansion of educational opportunities for
children across the country with more attention given to the disadvantaged areas and girls. In
accordance with this priority, it projects enrolment to increase to 90,251, 541,653, 202,931,
and 151,250 at pre-primary, elementary, middle and secondary levels respectively. Gender
parity will be achieved at elementary and middle secondary levels by 2015/16.
158. According to the projections, the female GPI reaches parity (1.0) in elementary and middle
education in 2015/16. Thus, the gender gap in elementary and middle education will be
closed by 2015/16. This compares favourably with the EFA goal of 2005 for gender parity in
elementary and middle levels. However, gender parity is not expected to be achieved in
secondary education until 2015/16. (Chart 20)
Chart 21: Gender Parity Index (GPI) by Level, 2010/11 to 2015/16

31
CHAPTER III: POLICY CONTEXT
159. The Government intends to tackle the issues analysed in Chapter Two and has assigned top
priority to the acceleration of efforts for educational development. Accordingly, it has
introduced several development policies since independence aimed at resolving the key
problems in the system, including the following:
1. The Declaration of Policy on Education (1991)
160. Access and Equity: The declaration of Policy on Education states that education policy
will reflect the government’s perception of education as a human right and as a means by
which equity can be achieved (PGE, 1991:3):
Every citizen has the full right to be schooled …. As such policy is being rendered
practical, special attention will be paid to those quarters of Eritrea which, so far,
have not had much schooling opportunities.
161. Education for National Integration, Productivity, and Development: Secondary School
level shall be used to prepare productive citizens through the provision of practical learning.
Another tenet of the declaration is the need to use education as a tool for national integration
and development (“… a united, solid and onward looking Eritrea”, PGE, 1991:2). These
principles reflect the adaptation of EPLF field experience of the past to the realities and
challenges of the present.
2. The Macro Policy of the Government of Eritrea (November 1994)
162. Education for National and Human Resource Development: “The overriding national
development objective is the creation of a modern, technologically advanced and
internationally competitive economy within the next two decades” (GSE, 1994:10). The
Macro-policy further stipulates that the key input in the attainment of this objective is the
provision of “broad based education incorporating widespread dissemination of skills and
languages and extensive human capital formation” (GSE, 1994:10).
163. Education for Citizenship, Democracy and Social Justice: The government’s macro-
policy (GSE, 1994:44) also states that
“Every effort will be made to cultivate in youth love and respect for country;
dedication towards work and self-reliance; excellence in the arts, sciences and sports;
and awareness of the needs of tolerance, justice and democracy in the context of
national political pluralism and cultural diversity”.
164. In the context of education in Eritrea, social justice is the provision of equitable access to
relevant education of high quality ensuring that those enrolled are retained and complete a
certain level of education or acquire a skill. Those disadvantaged in any way will be
supported to complete their education by various means of affirmative action or positive
discrimination as a temporary measure until a level playing field is created. Education is a

32
lifelong learning process, encompassing formal, non-formal, informal, technical and
vocational education and training. Social justice requires that there should be equality of
results among learners from the educational opportunities open to all. Equity is therefore an
enduring commitment of government.
3. The Transitional Constitution of the Peoples’ Front for Democracy and
Justice (PFDJ)
165. Education our Future: The emphasis on the development of patriotic, productive and
creative citizens is also clear from the declaration made at the Third Congress of the EPLF
held in Nakfa in February 1994 (PFDJ, 1994:22-23):
In the light of the decisive role played by young men and women during the war of
liberation, in view of the necessity to conserve and sustain the experiences and gains
of the liberation struggle, and since the question of the youth is the question of our
future, there is a need to map out concrete plans for the development of generations of
hard working, productive and creative citizens imbued with love of country and
people and nurtured by respect for justice and the truth.
166. In line with its principle of self-reliance and social justice the Eritrean Peoples’ Liberation
Front (EPLF) developed an education system that was designed to serve as an instrument of
nation building, social transformation and economic development. This principle has become
the cornerstone for the establishment of the National Education System in Eritrea, thus
countering the gross inadequacies and the abuses of the education policies of successive
colonial administrations.
4. Constitution of the State of Eritrea
167. Unity in Diversity: Article 6 of the Constitution of Eritrea declares that a basic principle
underpinning nation building and national development efforts in Eritrea shall be unity in
diversity:
As the people and government struggle to establish a unified and developed Eritrea,
they shall be guided by the basic principle “unity in diversity.”
168. This calls for a balance between the demands for uniformity and diversity. Within the
framework of this balance, the challenge is how to use education to promote a core of
common values running parallel to other and more diverse feelings of identity.
169. The Development of a Democratic Culture: Article 7 of the Constitution mandates the
state to “create the necessary conditions for establishing a democratic political culture defined
by the development of free and critical thinking, tolerance and national consensus”.
Education is expected to play a vital role in achieving this goal through the development of a
curriculum where this is a focal theme.
170. Using the curriculum to promote a democratic political culture characterized “by the
development of free and critical thinking…” is not only a matter of content but also a matter

33
of pedagogical process in the classroom. The implication here is that such a process involves
a range of interactive and participatory teaching/learning in all subjects.
5. The Concept Paper for a Rapid Transformation of the Eritrean
Education System (2002)
171. Employment Oriented Education: In addressing the academic and content orientation of
the curriculum, the Concept Paper (MOE, 2002a:6) recommended that Education must be
employment oriented such that at the end of any level of education any person can find
gainful employment commensurate with the person’s level of education and training.
6. The National Education Policy on Education (2003)
172. Sound Basic Education: National Policy on Education (MOE, 2003:5) stipulates that “the
provision of sound basic education is both a human right and a tool that raises the overall
awareness of citizens, which in turn enhances productivity.” This has clear implication for the
curriculum to offer a firm grounding in essential areas of learning, including literacy and
numeracy.
173. Knowledge and Skills at Middle and Secondary Level: Furthermore, The National
Policy on Education states that learning provision at middle and secondary schools will
“integrate knowledge and skills-based education” in order to facilitate learners’ transition
from school to further education and work context (MOE, 2003:6)
7. National Economic Policy Framework and Programme (NEPF) – 1998-
2000 (1998)
174. Education and Economic Growth: The government’s economic growth strategy as stated
in the National Economic Policy Framework seeks to transform Eritrean society and to create
a modern, vibrant and competitive economy through investment in human resource
development (GSE, 1998:10):
Eritrea’s medium term objective is to complete the transition phase of rehabilitation
and reconstruction and embark the economy on a path of sustainable development…
the solution lies in accelerated human resources development.
175. Education and Poverty Alleviation: The government’s strategy paper on poverty
alleviation (GSE, 2004:32) also states that a key factor in alleviating poverty is “raising the
skill and well-being of the people by investing in education, health care and sanitation
systems.”
8. Poverty Reduction Strategy Paper (PRSP) (2003)
176. The PRSP clearly states that education is the “hallmark of Eritrea’s economic growth and
poverty reduction strategy”. In addition, the Government has issued sector policy, strategy

34
and progam documents. Similarly, the Eritrean Government recognizes that education is vital
for the development of a broadly based civil society that includes the poor, and considers
Basic Education (BE) as a key element of its PRSP.
177. In addition, the following policy and strategies have been developed to tackle the
challenges encountered in the education sector:
178. The Government, recognizing that Early Childhood Development (ECD) is an important
platform to achieving EFA goals, has adopted a government-wide policy concerning
integrated ECD. The policy goal is to promote the satisfaction of basic needs for the healthy
growth and holistic development of children. The education aspects of the policy seek to
develop and implement a quality formal and non-formal pre-school curriculum; enhance
centre-based and non-centre based early stimulation and learning opportunities and ensure the
smooth transition into elementary schools for all children, including those with disabilities. 14
The main role of the MOE is to ensure age-appropriate curricula and child friendly learning
environments for children below the age of eight. Implementation is assigned to the regional
and local levels.
179. Elementary education is free and compulsory for all Eritrean citizens. Middle level
education is free and compulsory for the relevant age group.
180. A new curriculum has been developed and introduced based on previous analyses. It
features vertical and horizontal integration of subjects as well as coherence and continuity in
learning experiences. The curriculum uses integration as a means of providing a holistic
approach to learning and as a way for reducing content overload and overlap in the subject
areas. At the basic level, the new curriculum focuses on a firm grounding in essential
knowledge and skills focused on literacy and numeracy. The new curriculum includes the
adoption of expected learning outcomes (ELOs) for each grade and subject as the standards
for teaching. The new curriculum facilitates horizontal linkages, so that students who have
mastered the required ELOs for a particular level through non-formal education can rejoin the
formal school system. Textbooks and teaching materials have been developed closely
aligned with the new curriculum. Science and technology (including ICT) has been
emphasised throughout the post-elementary system. The teaching of English has also been
emphasised throughout the school system.
181. Learner-centred and interactive teaching methods that actively engage students in
classroom participation have been introduced. Such methods include discussions, group
work and peer learning. The MOE has developed manuals on active teaching methods and
held workshops for teachers since 2004. One of the first steps to change pedagogy in schools
will be to enhance the pedagogical methods used in the teacher training institutions.
Interactive teaching methods, even though far superior to traditional methods, face serious
obstacles to widespread adoption in the crowded classrooms that prevail in Eritrean education
system.
182. The Ministry also intends to use assessment as a means of improving learning. Continuous
assessment will be given a prominent role in monitoring and reinforcing learning at the
classroom level. In addition, the Monitoring of Learning Achievement (MLA) program will
be resumed in elementary education to gauge progress and will be introduced in other sub-
14
Eritrea: Integrated ECD Policy: Creating a fair start for our children, draft, November 2004, 4.

35
sectors as well. To enhance the practice of continuous assessment a new guideline on Learner
Assessment and Progression Guide (LAPG) has been developed. A National standard
examination has introduced at the end of middle (grade 8) schools. The assessments have
supported monitoring of the standard and quality of education obtained at the various levels,
while grade 8 examination has helped guide selection into secondary education. In 2009 a
study was conducted into the appropriateness of the National examination as an instrument
with which to assess achievement in the context of the recently introduced competency-based
curriculum. The MOE intends to insure that the national examination is ‘fit for purpose’ by
acting as a powerful encouragement to, and reinforcement of, the new curriculum and its
approach to teaching and learning. It will do this by designing and including test items which
give candidates the opportunity to demonstrate that they know, understand and can do in the
context of the new curriculum. The Eritrean Secondary Education Certificate Examination
(ESECE) at the end of grade 12 serves to guide admission to higher education. The ESECE
will also be reformed as necessary to become aligned with the new curriculum and related
syllabuses.
183. In addition, the MOE has drafted a policy on inclusive education with the objective of
institutionalizing special needs education (SNE) at the national level. Apart from the type of
education offered to learners with severe disabilities special needs education is more
effectively provided within the framework of mainstream curriculum in inclusive schools. To
this end, a pilot project for introducing inclusive education is currently being carried out in a
sample of schools and arrangements for SNE will be reformed in the light of experience
gained thereby. MOE will provide pedagogical skills to partially sighted high school
graduates who already have Brail and sign language to enable them to teach pupils with the
same disabilities
184. Greater relevance will be introduced in secondary education by diversifying the curriculum,
taking full account of curriculum changes at lower levels.
185. Plans for TVET include the establishment of post-school vocational training programmes,
which will be offered at three levels -- after completion of elementary school, middle school
and high school. The intention is that who pursue this kind of skills development will have
the opportunity to return to the educational mainstream or continue with their education while
employed.
186. Plans to expand higher education are underway with the impetus for reforms stemming
from the Concept Paper15
. The fundamental aim is to break the bottleneck in access of
secondary school graduates to higher education16
by expanding substantially the number and
size of institutions. The Eritrean Institute of Technology and Teacher Education (EIT) was
established in 2003 and, since then about 2000 students who passed the National Examination
have been enrolled in various colleges. Projected total enrolment is 10-12,000 students at
EIT. In addition, the Government has established five new specialized degree-level colleges
in various parts of the country and they are offering a degree and a diploma program in
various areas of specialization. 17
Currently, the situation is favourable and students who pass
from high school enrol directly into the institutions of higher education.
15
Concept Paper for a Rapid Transformation of the Eritrean Educational System (2002) 16
Previously, only about 15% of secondary graduates passed the school leaving examination and got access to
higher education. 17
College of Agriculture at Hamelmalo, College of Marine Sciences and Technology at Massawa, College of
Business and Economics at Halhale, College of Health Sciences Asmara and a College of Arts and Social

36
187. This rapid expansion of higher education will supply much-needed teachers for the rapid
expansion of lower levels of the system. The College of Education located together with EIT
at Mai-Nefhi will enable the output of about 1000 trained teachers per year, 700 at diploma
level for basic education and 300 at degree level for secondary education. Moreover, the two
institutions working in tandem have allowed for the first time the pre-service training of
teachers and instructors for TVET intuitions. After first obtaining a diploma in technology
students can take intensive training in pedagogy.
188. In terms of financing, basic education is free and compulsory through grade 8. The policy
beyond that point has not been defined. There is some intention, as expressed in the Concept
Paper, for some cost sharing at the tertiary level, but means to implement this policy have not
been formulated. Neither has it been decided whether to introduce some form of cost sharing
in secondary education. However, the establishment of private schools that maintain the
standards set by the Ministry of Education is encouraged at all levels of education.
189. In accordance with government-wide policy HIV/AIDS education is being integrated into
the curriculum of the education system from the end of elementary education through tertiary
education. Information, education and communication activities are being undertaken to
promote HIV/AIDS prevention, care and support and treatment.
Sciences in Adikeih.

37
CHAPTER IV: STRATEGIES FOR EDUCATIONAL
DEVELOPMENT
1. Expanded and Equitable Access
190. The Ministry’s strategy to expand access equitably features the following elements:
Identifying of inequality of access to education by zoba, and gender. This
identification of inequalities will be used to set priorities and locate areas in greatest
need and will provide a basis for monitoring progress.
Constructing new schools and classrooms so as to bring the schools close to the
disadvantaged populations, carefully planning and targeting underserved areas and
populations; constructing student hostels where necessary; adoption of multi-grade
teaching, single teacher schools, mobile teaching arrangements and combined
schools in areas of low population density;
Constructing new make shift classrooms to enhance the participation of adults and
out-of-school children.
Breaking the bottleneck on the output of trained teachers by expanding teacher
training institutions and programmes – especially for female teachers and teachers in
mother tongue languages;
Implementing community-based campaigns to increase appreciation of the value of
education;
Relieving financial constraints on enrolment of children from poor families by
reducing direct and opportunity costs, such as by free school supplies, free uniforms,
and bursaries; and
For the disabled, adopting a policy and provision of support within the framework of
inclusive education.
191. In addition, to expand access for out-of-school youth equivalencies are being established
for literacy training and TVET. At present completion of three years of adult literacy
programs is the equivalent of grade 5 education. The Skills Development Centres will also
be organised so that some of the graduates may re-enter school to continue their formal
education.
2. Girls’ and Women’s Education
192. The Government has drafted a gender policy and strategy18
in recognition of the fact that
sustainable development cannot be realized without the full and equal participation of girls at
all levels of education. The main strategic elements include raising gender awareness of the
communities as the key to successful mainstreaming of gender education. This requires:
o undertaking training and mobilization campaigns for the community;
o formulation of gender awareness training materials to sensitize communities
and teachers about gender issues and the socio-cultural practices that hamper
the participation of girls and women in education;
18
Ministry of Education, Eritrea: National Education Gender Policy and Strategic Framework of Action, draft,
May 2004.

38
o strengthening relations between schools and communities through devolution
of responsibilities for school management to the school and community level;
o Reviewing curriculum and teaching materials to make them more gender
sensitive –in general, adult, TVET education and teacher training;
o Expanding the number of female teachers in schools by expanding their
enrolment in teacher training institutions;
o Opening boarding schools and hostels for girls in remote areas, as well as for
nomadic and semi-nomadic communities;
o In particular, ensuring that girls enter grade 1 at the proper time (age 7) and
progress normally through the system because past experience shows that they
start dropping out at age 14-16;
o Expanding opportunities for non-formal education, including adult education
and skills training, for those who have been bypassed by the educational
system;
o Improving the collection and production of gender disaggregated data on
education, enhancing gender-based research and monitoring of progress
towards EFA and MDG goals.
o Providing guidance and counselling services to help girls overcome problems
that affect their education;
o Providing girls from low-income families with financial support as an
incentive to compensate for the opportunity costs of their attendance19
; and
o Conducting extra tutorial classes to girls in need of support in core subjects
where they lag behind.
3. Quality and Relevance of Education
193. The strategy for increasing student achievement focuses on curricula, textbooks, assessment
teachers and school support systems. It has the following principal elements:
Revision of curricula of all levels and sub-sectors to focus on competence-based
standards for expected learning outcomes and vertical/horizontal integration of
subjects;
Provision of adequate textbooks and learning materials consistent with the new
curricula;
Ensuring that national examination at grade 8 and 12 are redesigned as necessary to
reward the demonstration of mastery of knowledge, skills and competencies, as
identified in the new curricula, and therefore reinforce appropriate teaching and
learning;
Increasing school leadership and teacher competencies through systematic and well-
targeted in-service staff development programs on the new curricula, new teaching
methods, continuous assessment as well as strengthening language competencies;
Upgrading teachers and providing them with continuous professional development,
including by distance education;
Improving teaching methods and student time on task in the classroom;
Reduction in class sizes; provision of necessary classrooms, furniture and
equipment to relieve overcrowding;
19
Sone innovative approaches have already had success, e.g. providing kerosene to families to reduce the
necessity for girls to spend time gathering firewood
39
Provision of facilities and equipment for science, libraries and instructional
materials (termed the ‘school support system’);
Establishment of computer access through ICT, including computer laboratories and
e-learning;
Gradually reducing in the number of schools using the double shift system;
Stimulation of greater parental and community interest in student performance;
Continuing MLA studies to track progress on learning achievements and target
areas in need of special help; and
Expanding community reading rooms and providing varied supplementary reading
materials to enhance and sustain literacy skills acquired in literacy centers.
Expanding continuing education to assist adults who complete the first and second
phases of literacy and post-literacy programs to further their education through
evening programme, as well as to create access to those who are capable and are
interested in advancing their academic qualifications.
4. Reduction in wastage
194. The challenges of educational wastage in the education system have been discussed in
Chapter II. The challenge is to improve the flow of students through the system focusing on
improving the quality of education. Although all of the interventions designed to increase
access and boost quality will also address wastage issue (reduction of repetition and dropout)
the following strategies will be adopted:
Recruit and train more female teachers,
Enhance the training in interactive pedagogy,
Review and develop more relevant content and clearer learning objectives,
Conduct continuous assessment of student progress,
Create opportunities for remedial instruction for those falling behind and closer
supervision through local education offices.
Conduct information campaigns to counter traditional parental resistance to
enrolling girls by communicating the benefits of education and the life-long
consequences of non-attendance,
Conduct meetings and trainings with parent-teacher-students association (PTSA)
and other community groups to overcome negative parental attitudes,
Use radio media more intensively and widely,
Provide other direct incentives for enrolment and retention, and
Provide bursaries for children of the poorest parents, to overcome the direct and
opportunity costs of non-enrolment.
5. Technical and Vocational Skills Development.
195. Overall, the objective for TVET is to ensure adequate supplies of young people and adults
with competent, adaptable skills for wage and self-employment. This objective will be sought
through five principal means.
Building demand-orientation into the training system, in part by undertaking a study
with a view to the establishment of a mechanism of coordination with employer

40
involvement; development and systematic use of market information to guide the
system offerings; and diversifying the occupational composition of training outputs;
Broadening coverage and expanding the quantitative output of skills to meet
economic requirements, including technology-related training, non-formal skills
development and training for the informal sector;
Achieving more effective mastery of skills and competencies through development
of outcomes-based content, external assessment of achievements and expansion of
pre- and in-service training for instructors and managers;
Mobilising adequate financing to augment operating costs of training institutions;
and
Strengthening the management capacity for skills development, including MIS,
policy development, evaluation capacity and devolution of authority to training
institutions.
6. Institutional Capacity Development
196. The achievement of overall objectives of the Plan, the specific objectives of each of its
forgoing two components, the effective implementation of strategies, and the effective
execution of means and activities will require effective and efficient delivery capacity of the
sector. Yet, it is well recognized that the delivery capacity of the Ministry of Education at all
levels of the sector is not adequate.
197. Recognizing this challenge, the MOE has sets out strategies for the development of
institutional capacity. Besides, as capacity is strengthened through practice, the
implementation of the capacity development strategies outlined below will be mainstreamed
and integrated with the implementation of the first two components. The capacity
development strategies for the MOE covers the following:
Develop the human capacity of MOE to acquire relevant skills, competencies and
qualifications;
Improve the organizational capacity related to the definition of roles, tasks and
responsibilities of various departments and through the provision of adequate human and
non-human resources required for the effective performance of tasks;
Develop the institutional capacity related to policy, legal and institutional frameworks,
including information management systems that enable the system function efficiently.
7. Financing Strategy
198. The strategy to finance the education sector in order to achieve the planned reform will be
done through various means: increasing expenditure by Government, community
contribution, involvement of the private sector and Development Partners’ (DP) assistance
for Education. With regard to the latter it is anticipated that support will be available from the
Global Partnership for Education (GPE). A number of DPs have also signed informally that
they may be prepared to support the Plan.
199. A detailed analysis of the costing and financing of the Plan is provided in Chapter V.
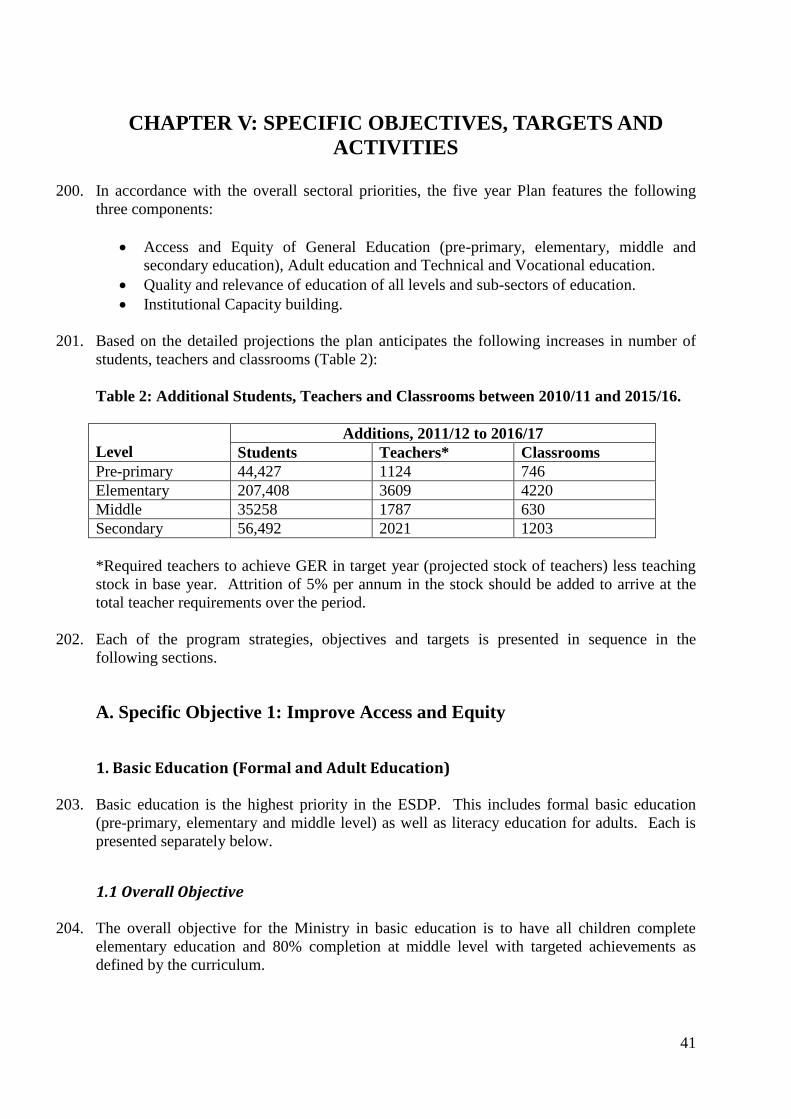
41
CHAPTER V: SPECIFIC OBJECTIVES, TARGETS AND
ACTIVITIES
200. In accordance with the overall sectoral priorities, the five year Plan features the following
three components:
Access and Equity of General Education (pre-primary, elementary, middle and
secondary education), Adult education and Technical and Vocational education.
Quality and relevance of education of all levels and sub-sectors of education.
Institutional Capacity building.
201. Based on the detailed projections the plan anticipates the following increases in number of
students, teachers and classrooms (Table 2):
Table 2: Additional Students, Teachers and Classrooms between 2010/11 and 2015/16.
Level
Additions, 2011/12 to 2016/17
Students Teachers* Classrooms
Pre-primary 44,427 1124 746
Elementary 207,408 3609 4220
Middle 35258 1787 630
Secondary 56,492 2021 1203
*Required teachers to achieve GER in target year (projected stock of teachers) less teaching
stock in base year. Attrition of 5% per annum in the stock should be added to arrive at the
total teacher requirements over the period.
202. Each of the program strategies, objectives and targets is presented in sequence in the
following sections.
A. Specific Objective 1: Improve Access and Equity
1. Basic Education (Formal and Adult Education)
203. Basic education is the highest priority in the ESDP. This includes formal basic education
(pre-primary, elementary and middle level) as well as literacy education for adults. Each is
presented separately below.
1.1 Overall Objective
204. The overall objective for the Ministry in basic education is to have all children complete
elementary education and 80% completion at middle level with targeted achievements as
defined by the curriculum.

42
205. This overall objective requires three principal accomplishments, equity of access, efficient
student flows and quality, i.e. to:
1. Enrol all children in elementary and 80% of students complete middle school by 2015/16;
2. Retain all children in school, progressing at a reasonable pace; and
3. Ensure that the students have mastered the essentials of the curriculum.
206. Three elements have top priority in the Ministry’s strategy to reach these objectives: new
school construction; expanded output of qualified teachers; and adequate provision of
textbooks supporting the new curriculum.
1.2 Targets
1.2.1 Pre-primary Level Education
207. The main target for pre-primary by 2015 will be to improve enrolment rates and the MOE
will attempt to achieve a GER of 40% and a NER of 30% by 2016/17 from 31.4% GER and
19.6% NER in 2011/12.
Table 3-Projection of Enrolments in Pre-primary Education by year, 2010/11 to 2015/16
Base Year
2011/12 2012/13 2013/14 2014/15 2015/16 2016/17
Gross Enrolment 45,824 55,112 66,513 78,026 86,440 90,251
Net Enrolment 28,579 36,045 45,333 55,127 63,035 67,688
GER 31.4 33.1 34.9 36.6 38.3 40.0
NER 19.6 21.7 23.8 25.8 27.9 30.0
1.2.2 Elementary and Middle Level Education
208. The main target by 2016/17 will be to improve enrolment rates, progression and completion
rates matched by improved learning achievement and moving towards Education for All and
Millennium Development Goals. Specifically, the Ministry of Education will attempt to
achieve GER of 126.5% and 106.4%, for elementary and middle schools respectively. The
Ministry also aims at achieving the gross and net admission rate of 126% and 100% in grade
one by the year 2016/17 (Table 4). Further the Ministry is putting various interventions in
place to ensure that pupils who enrol in school remain in school until the end of the cycle.
209. Table 4 shows Program projections for enrolment by level and year for elementary education.

43
Table 4 - Projection of Enrolments in Elementary Education by level and year,
2010/11 to 2016/17
Base Year
2011/12 2012/13 2013/14 2014/15 2015/16 2016/17
Gross Admission 80138 87,923 100,595 115,537 129,396 123,292
Net Admission 31,011 46,262 66,806 92,522 103,156 97,851
GAR 123.2 123.7 124.3 124.9 125.4 126.0
NAR 47.7 65.1 82.6 100.0 100.0 100.0
Gross Enrolment 334,245 362,974 403,009 454,625 505,547 541,653
Net Enrolment 246,582 264,487 297,491 352,188 428,269 399,435
Pop 7-11 337,784 331,645 343,920 377,681 428,269 399,435
GER 93.2 107.5 121.5 132.2 133.9 126.5
NER 73.0 79.8 86.5 93.3 100.0 100.0
210. The projections assume a major reduction in repetition rates, from about 11% per year to 8%.
The Ministry will ensure a transition rate of 90.3% between elementary and middle schools in
2016/17, and the projections assume a major reduction in repetition rates from about 11% in
2010/11 to 0% in grades 1-3 and to 7% in grades 4-5 in elementary schools in 2016/17.
211. This greater efficiency will mean a substantial increase in the net enrolment by 152,781
elementary students in grades 1-5 over the five year period of the ESDP, an increase of 80%.
(Table 4)
Table 5- Projected Increases in Student Flows (%) in Elementary Education
Grade
Repetition Dropout
2011/12 2016/17 2011/12 2016/17
1 11 0 7 2
2 13 0 4 2
3 11 0 4 2
4 10 7 4 2
5 7 7 4 2
212. This greater efficiency, plus projected construction of new schools, means the NER will also
increase substantially at the elementary level, from 73.5% to 100%.
Table 6 shows program projections for student enrolment in middle schools:

44
Table 6- Program projections: Enrolments in middle schools
Base year
2011/12 2012/13 2013/14 2014/15 2015/16 2016/17
Transition Rate 89.3% 89.0% 89.3% 89.7% 90.0% 90.3%
Gross Enrolment 167,928 163,184 159,747 160,563 177,440 202,931
Net Enrolment 95,439 93,723 90,417 94,567 91,481 95,327
Pop 12-14 249,422 239,110 223,516 205,734 190,654 190,654
GER 70.2 73.0 77.6 78.0 93.1 106.4
NER 39.9 41.9 43.9 46.0 48.0 50.0
213. Under the ESDP 35, 258 additional students are projected to be accommodated in Grades 6-8
over the five year period, an increase of 21%. This will increase the GER from 70.2% to
106.4% while the NER will increase from 39.9% to 50% over the same period.
214. The average repetition rates at the middle level are projected to decline from about 18% per
annum per level to 2% by 2016/17. (Table 7) This will raise the NER by 11.7 percentage
points from 39.9% 2011/12 to 50% in 2016/17.
Table 7- Projected Increases in Student Flows (%) in Middle Level
Grade
Repetition Dropout
2011/12 2016/17 2011/12 2016/17
6 13 7 6 3
7 8 5 5 3
8 35 25 7 5
215. Considerable improvement is expected in gender equity under the five year plan. The
enrolment of females is expected to increase substantially at the elementary level, over the
five year plan period. The female GER will be increased in parallel with that of boys to
achieve gender parity by 2016/17. Greater progress is expected in enrolment of age-
appropriate females (age 7-11). The NER at elementary level is expected to reach 100% by
2015/16 to achieve the EFA goal. The gender parity index is expected to improve from 0.84
in 2010/11 to 1.00 in 2015/16.
216. Major gender improvements are also foreseen at middle level. Total female enrolment will
increase in parallel to that of boys. This will raise the GER in the same way as the boys’
improvement. Progress will be even greater in terms of net enrolments, lifting the NER for
the 12-14 female population by 2015/16. The GPI will improve from 0.81 to 1.00 between
2011/12 and 2016/17.
1.3 Strategies/Activities for Basic Education
Provision of schools, classrooms for basic education to expand access with equity and
to relieve over-crowding, targeting underserved areas;

45
Earmarking a share of the value of the physical assets for rehabilitation of schools. In
general, responsibilities for preventive maintenance will be assigned to the schools
and communities;
Provision of new teachers (expansion of teacher training outputs);
Expanding special needs education through the program of inclusive education and
construction of new schools for the deaf and the blind.
Conducting awareness campaign in order to ensure girls’ participation.
217. The required construction and rehabilitation of classrooms and the projected enrolments are
described in the following tables by levels:
218. Pre-primary Education: The five year plan makes a provision for early childhood care and
education (ECD) in the form of kindergarten construction and teacher training. New
classroom requirements for pre-primary schools are shown in Table 8. This is based on a
reduction in the number of students per section from 41 to 40.
Table 8: Projected classroom requirements in pre-primary schools
2012/13 2013/14 2014/15 2015/16 2016/17
a) Required classrooms expansion 125 149 146 104 48
b) Classroom to be replaced 34 35 35 35 35
c) Required classrooms construction -
(a+b) 159 184 181 139 83
d) Classroom rehabilitation 26 30 33 37 40
219. Elementary Education: New classroom requirements for elementary schools are shown in
Table 9. This is based on a reduction in the number of students per section and in classrooms
used in double shifts from 2100 to 1890 (10%).
Table 9: Projected classroom requirements in elementary schools
2012/13 2013/14 2014/15 2015/16 2016/17
a) Required classrooms expansion 431 596 768 758 539
b) Required double shift classroom
reduction 45 45 45 45 45
c) Classroom to be replaced 140 145 155 169 170
d) Required classrooms construction -
(a+b+c) 616 786 968 972 754
e) Classroom rehabilitation 90 103 118 138 157
220. Most of the classrooms are required for reduction in the average number of students per
section and classrooms using double shift (by 45 per annum, or 225 classrooms). As part of
improved access, special needs education schools for disabled persons will be constructed to
provide relevant education and skills that will enable learners to support their lives after
completion of their education.
221. In summary, the Ministry will provide 207, 408 new elementary school places over the five
year period in 4220 new classrooms.
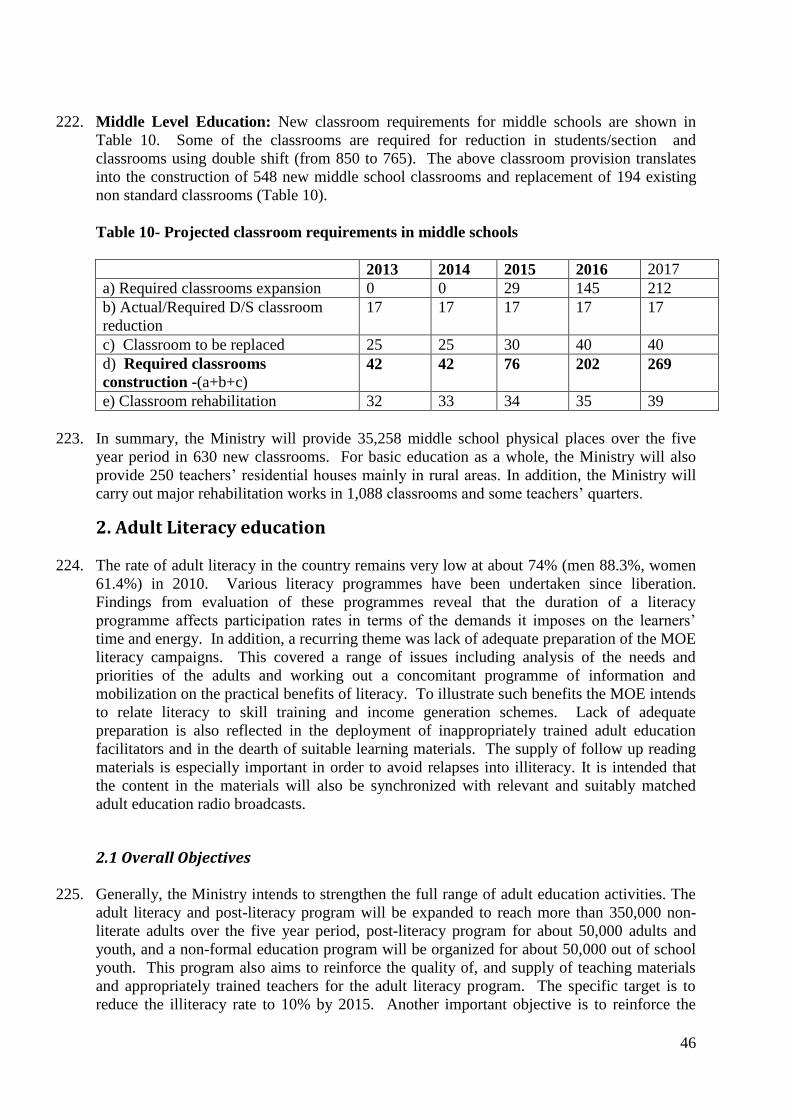
46
222. Middle Level Education: New classroom requirements for middle schools are shown in
Table 10. Some of the classrooms are required for reduction in students/section and
classrooms using double shift (from 850 to 765). The above classroom provision translates
into the construction of 548 new middle school classrooms and replacement of 194 existing
non standard classrooms (Table 10).
Table 10- Projected classroom requirements in middle schools
2013 2014 2015 2016 2017
a) Required classrooms expansion 0 0 29 145 212
b) Actual/Required D/S classroom
reduction
17 17 17 17 17
c) Classroom to be replaced 25 25 30 40 40
d) Required classrooms
construction -(a+b+c) 42 42 76 202 269
e) Classroom rehabilitation 32 33 34 35 39
223. In summary, the Ministry will provide 35,258 middle school physical places over the five
year period in 630 new classrooms. For basic education as a whole, the Ministry will also
provide 250 teachers’ residential houses mainly in rural areas. In addition, the Ministry will
carry out major rehabilitation works in 1,088 classrooms and some teachers’ quarters.
2. Adult Literacy education
224. The rate of adult literacy in the country remains very low at about 74% (men 88.3%, women
61.4%) in 2010. Various literacy programmes have been undertaken since liberation.
Findings from evaluation of these programmes reveal that the duration of a literacy
programme affects participation rates in terms of the demands it imposes on the learners’
time and energy. In addition, a recurring theme was lack of adequate preparation of the MOE
literacy campaigns. This covered a range of issues including analysis of the needs and
priorities of the adults and working out a concomitant programme of information and
mobilization on the practical benefits of literacy. To illustrate such benefits the MOE intends
to relate literacy to skill training and income generation schemes. Lack of adequate
preparation is also reflected in the deployment of inappropriately trained adult education
facilitators and in the dearth of suitable learning materials. The supply of follow up reading
materials is especially important in order to avoid relapses into illiteracy. It is intended that
the content in the materials will also be synchronized with relevant and suitably matched
adult education radio broadcasts.
2.1 Overall Objectives
225. Generally, the Ministry intends to strengthen the full range of adult education activities. The
adult literacy and post-literacy program will be expanded to reach more than 350,000 non-
literate adults over the five year period, post-literacy program for about 50,000 adults and
youth, and a non-formal education program will be organized for about 50,000 out of school
youth. This program also aims to reinforce the quality of, and supply of teaching materials
and appropriately trained teachers for the adult literacy program. The specific target is to
reduce the illiteracy rate to 10% by 2015. Another important objective is to reinforce the

47
concept of ‘equivalencies’ so that people who complete a certain level will be able to re-enter
the formal school system.
2.2 Targets
Table 11 sets out the projection for literacy programme over the five year period. The
proposed scale of intervention is substantial, necessitating close scrutiny of resource
requirements.
Table 11 – Adult literacy projection of age 15-49, 2010-2015
2010 2011 2012 2013 2014 2015
Population age 15-49 1,304,061 1,351,767 1,409,521 1,472,855 1,535,772 1,592,645
No. of Literate Population
age 15-49
969,625
1,047,395
1,136,251
1,233,394
1,334,138
1,433,380
Adult Literacy Rate 74.35 77.48 80.61 83.74 86.87 90.00
226. To achieve the target – 90% rate – by 2015, precise planning needs to be made of resources’
requirements (teachers, textbooks, teaching/learning materials and classrooms). In particular,
the sources of teachers will be carefully identified.
227. By targeting 20% of the illiterate population, about 45,000 students on average should be
enrolled annually to achieve the target.
2.3 Strategies/Activities
228. Construction of makeshift classrooms and reading rooms (i.e. that can be disassembled and
reassembled at other locations) will be undertaken to provide literacy education for adults. In
addition, the MOE’s programme of media and distance education will be reinforced and
expanded. Also, the following interventions will be made:
Intensification of the awareness raising campaign;
Expansion of reading room in literacy centers supported with books and other
materials;
Development curriculum and printing of textbooks;
Provision of teaching and learning materials;
Expansion of the continuing education program (evening classes)
3. Secondary Education
229. Several factors demonstrate the importance of increased attention to secondary education in
Eritrea and why it is an important objective of the five year plan. Secondary education plays
a central and pivotal role in the education and employment system. It has the potential for
huge vertical and horizontal multiplier effects on the education system and the economy as a
whole.

48
First, the growth of the modern sector of the economy depends to a large extent on the
supply of educated and trainable secondary graduates. At present only a small fraction of
the labour force has attended secondary education. Most of those in formal employment
and the public sector will continue to be secondary school leavers, including teachers for
basic education. Even people in the informal sector have a better chance to prosper when
they have a secondary education that makes them more self-reliant and productive.
Second, secondary education is an essential foundation for the human resources required
to build a competitive economy. In an information age with globalisation of markets and
rapidly changing demands, secondary education develops and reinforces the capacity for
continuous learning and flexible skill training. National competitiveness, especially in
high value added economic activity, depends on knowledge, skills and competencies
associated with abstract reasoning, analysis, language and communication skills, and the
applications of science and technology. There is much evidence to suggest that export led
growth is associated more with investments at post-primary than at primary levels.
Thirdly, pressure for an expansion of the secondary intake is likely to mount quickly.
The number of middle school graduates seeking admission to secondary is projected to
increase substantially as a result of earlier, current and planned efforts to expand basic
education. The chance for access to secondary education provides a motive for many
students to remain in middle school. If transition rates to secondary fall dramatically,
retention in middle school would probably decrease as it becomes clear that for many
there would be no progression possible to higher educational levels;
Fourthly, secondary education has many positive externalities, such as improved health,
reduced infant mortality and better family planning, HIV/AIDs prevention and enhanced
social participation. More and better secondary education for girls contributes directly to
the empowerment of women, allowing the economy to absorb both sexes.
Finally, the scope, quality and gender balance of tertiary education, an MDG and Dakar
commitment, depends on the graduates of secondary education.
Thus, secondary education occupies a strategic place for future growth and development
of our country.
3.1 Overall Objectives
230. The secondary education component of the five year plan aims at two objectives: (1)
increased access and equity; and (2) improved quality and relevance of learning outcomes.
3.2 Targets
231. Increase the proportion of the age group enrolled (enrolment of girls and underserved areas)
from 23.2% at present to 35% by 2016/17; and increase the proportion of girls in total
secondary enrolment by raising the female gender parity index (GPI) in total secondary
enrolments from 0.74 at present to 0.96 by 2015/16.
Table 12 shows projected enrolments for secondary education by grade and year.

49
Table 12- Programme projections: Enrolment in secondary schools Base Year
2011/12 2012/13 2013/14 2014/15 2015/16 2016/17
Transition Rate 37.95% 58.00% 60.00% 62.00% 64.00% 66.00%
Gross Enrolment 94,758 110,772 125,941 135,309 147,277 151,250
Net Enrolment 69,812 80,011 90,501 99,683 106,029 121,858
GER 31.5 35.4 38.9 41.1 45.3 43.4
NER 23.2 25.6 27.9 30.3 32.6 35.0
232. Over the next five years the transition rate from middle school (Grade 8 leavers) to secondary
education is projected to be 66% (an increase from 38% in 2011/12). The number of students
enrolled in secondary education is projected to increase by 56,492 students (an increase of
59.6%) raising the GER from 31.5% to 43.4%. Whereas, the net enrolment will increase by
52,046, an increase of 74.5%. This will increase the NER from 23.2% to 35%, increasing the
number of age-appropriate (15-18) students increased substantially during the five year
period.
233. Repetition rates are projected to decrease from an average of 8.6% per level per year to about
6% per year. (Table 13)
Table 13- Projected Increases in Student Flows (%) in Secondary Education
Grade
Repetition Dropout
2011/12 2016/17 2011/12 2016/17
9 13 8 7 5
10 13 8 7 5
11 2 2 7 5
234. This improvement in internal efficiency will raise the net enrolment ratio from 23.2% to 35%.
235. The enrolment of females is expected to increase substantially, alongside male students, over
the five year plan period. This will lift the female GER and reduce gender gap. Even greater
progress is expected in enrolment of age-appropriate females (age 15-18). The NER of girls
at secondary level is expected to increase in parallel with that of the boys. The female GPI is
expected to improve substantially in the coming five years.
3.3 Strategies/Activities
236. New classroom requirements for secondary schools are shown in Table 14. This is based on
projected enrolment increases and a reduction in double shift classrooms from 495 to about
446 (10%).

50
Table 14: Projected classroom requirements in Secondary schools
2013 2014 2015 2016 2017
a) Required classrooms expansion 219 247 208 276 185
b) Required double shift classroom reduction 10 10 10 0 18
c) Classroom to be replaced 4 4 4 4 4
d) Required classrooms construction - (a+b+c) 232 261 221 280 207
e) Classroom rehabilitation 19 23 29 33 39
237. Class sizes (students/section) are expected to reduce over the five year period from 63 to 50.
In total, about 56,492 additional students are expected to be accommodated in the 1203 new
classrooms. In line with EFA and MD goals, special emphasis will be placed on expanding
female enrolment and that of other disadvantaged groups through, inter alia, judicious
construction of boarding20
facilities – and expanding the number of female teachers.
238. In addition, textbooks will be produced and distributed in order to enhance student learning;
provision of school support systems including ICT will be expanded and consolidated and in-
service training for teachers and school directors will be conducted.
4. Technical and Vocational Education 239. In view of the importance of skills development for Eritrean economic growth the overall objective
of technical-vocational education and training (TVET) is the following:
4.1 Overall Objectives
240. The overall objective for TVET is to broadening coverage and expanding the quantitative output of
skills to meet economic requirements.
4.2 Targets
241. The target for TVET is to provide access to Vocational High Schools for about 20% of the
students who complete grade 10. To ensure adequate supplies of competent, adaptable skills
for the attainment of the government’s overriding national development objective integrated
knowledge and skills based education and training will be provided.
4.3 Strategies/activities
242. In view of shortages of skilled workers and the lack of skills provision in important parts of the
country, over the next five years three new Technical Schools will be established. The schools will
have a capacity of 500 trainees each and will offer fourteen trades, in accordance with market
requirements. This will bring total enrolment capacity in Technical Schools to about 10,000 trainees
annually, still only 10% of the enrolment at secondary level. In addition the Center for Vocational
Training will be upgraded to accommodate 5000 trainees who graduate from grade 12 each year. In
20
Some of these arrangements are termed ‘para-boarding’ as they involve provision of some accommodation
and some meals; there is provision of one meal per day, and pupils tend to return to their homes at weekends.
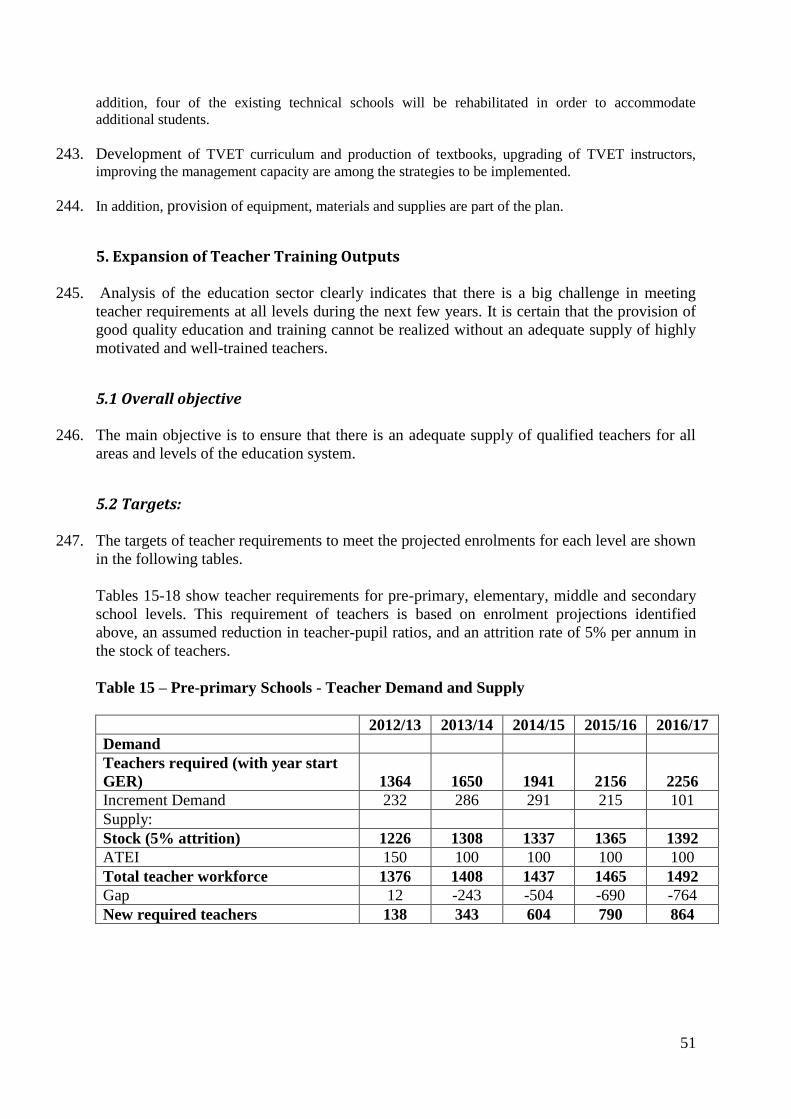
51
addition, four of the existing technical schools will be rehabilitated in order to accommodate
additional students.
243. Development of TVET curriculum and production of textbooks, upgrading of TVET instructors,
improving the management capacity are among the strategies to be implemented.
244. In addition, provision of equipment, materials and supplies are part of the plan.
5. Expansion of Teacher Training Outputs
245. Analysis of the education sector clearly indicates that there is a big challenge in meeting
teacher requirements at all levels during the next few years. It is certain that the provision of
good quality education and training cannot be realized without an adequate supply of highly
motivated and well-trained teachers.
5.1 Overall objective
246. The main objective is to ensure that there is an adequate supply of qualified teachers for all
areas and levels of the education system.
5.2 Targets:
247. The targets of teacher requirements to meet the projected enrolments for each level are shown
in the following tables.
Tables 15-18 show teacher requirements for pre-primary, elementary, middle and secondary
school levels. This requirement of teachers is based on enrolment projections identified
above, an assumed reduction in teacher-pupil ratios, and an attrition rate of 5% per annum in
the stock of teachers.
Table 15 – Pre-primary Schools - Teacher Demand and Supply
2012/13 2013/14 2014/15 2015/16 2016/17
Demand
Teachers required (with year start
GER) 1364 1650 1941 2156 2256
Increment Demand 232 286 291 215 101
Supply:
Stock (5% attrition) 1226 1308 1337 1365 1392
ATEI 150 100 100 100 100
Total teacher workforce 1376 1408 1437 1465 1492
Gap 12 -243 -504 -690 -764
New required teachers 138 343 604 790 864

52
Table 16 – Elementary Schools - Teacher Demand and Supply
2012/13 2013/14 2014/15 2015/16 2016/17
Demand:
Teachers required with year start
GER
8,535 9,237 10,149 10,985 11,775
Increment Demand 483 702 913 836 790
Attrition @ 5% from previous year 403 427 462 507 549
Total demand for new teachers 886 1,129 1,375 1,343 1,339
Supply:
Stock (5% attrition) 7,594 8,278 8,935 9,880 10,721
ATEI certificate teachers 500 250 50 0 0
ATEI diploma teachers 0 0 345 345 395
Higher Education Institutes 550 807 950 940 820
Upgrading to Diploma -50 -50 -50 -50 -50
Teachers returning from upgrading
program
50 50 50
Teachers recruited from communities
(nomad schools)
120 120 120 120 120
Total teacher workforce 8,714 9,405 10,400 11,285 12,056
Gap 179 169 251 300 281
New required teachers compared
with previous year
941 958 1214 1105 1054
Table 17 – Middle Schools - Teacher Demand and Supply
2012/13 2013/14 2014/15 2015/16 2016/17
Demand:
Teachers required with year start GER 3726 3616 3602 3943 4464
Increment Demand -140 -110 -14 341 521
Supply:
Stock (5% attrition) 3346 3539 3434 3423 3746
ATEI Output Diploma Teachers 55 100 100 100
Higher Education Institutes 430 70 70 420 610
Middle school upgrading program -50 -50 -50 -50 -50
Teachers returning from upgrading
programs
50 50 50
Total teacher workforce 3726 3614 3604 3943 4456
Gap -1 -2 1 0 -8
New required teachers 381 77 169 520 718

53
Table 18 - Secondary Schools - Teacher Demand and Supply
2012/13 2013/14 2014/15 2015/16 2016/17
Demand:
Teachers required with year start GER 2723 2988 3084 3077 3327
Expatriate teachers 155 155 155 155 155
Domestically recruited teachers 2568 2833 2929 2922 3172
Increment Demand - domestic teachers 320 265 96 -7 251
Supply domestic:
Stock (5% attrition) 2183 2582 2843 2928 2925
Higher Education Institutes 585 460 240 150 400
Teachers attending upgrading programs -50 -50 -50 -50 -50
Teachers returning from upgrading
programs
50 50 50
Total domestic teacher workforce 2718 2992 3083 3078 3325
Gap -4 4 -1 2 -3
Supply foreign: 155 155 155 155 155
Total domestic/foreign teacher
workforce
2873 3147 3238 3233 3480
New required teachers 539 406 241 148 403
5.3 Strategies/Activities
248. The strategy to recruit teachers qualified at diploma and degree levels include recruitment
from the College of Education and other colleges. To the extent that new recruits from other
colleges lack a solid foundation in educational theory or practice they will be provided with
short orientation courses during the summer prior to their deployment as teachers.
249. Increasing female teachers: The recruitment of female teachers has always been encouraged
by the Ministry. In spite of this, at present, female teachers at elementary level comprise
40.6% of the total elementary teacher population, whereas at the middle and secondary levels
they merely comprise about 14.4% and 14.4% respectively. In order to raise female
participation in the teaching service and to fill the gap in teacher output, the Ministry shall
endeavour to recruit more female teachers through affirmative actions.
250. The specific interventions are outlined below:
Consolidation and upgrading of ATEI to college level
Expansion of College of Education with the capacity to produce about 1000 teachers a
year for the needs of schools, including TVET and vocational education schools.
Implementation of a Master Plan for Teacher Education and Development.
In line with the newly reviewed and developed curriculum and the projected increases
in enrolments in the next five years, there is a need for far- reaching changes in the
system of teacher training, development and support. Therefore, implementation of
the Master Plan, need to address the issues of recruitment, training, deployment,
support and continuing professional development of the teaching force and provide a
roadmap for the next five to ten years.

54
Fast –Track Training Program for Elementary School and Adult Literacy Teachers -
the target group for this program consists of an intake of 500–550 directly recruited
elementary school teachers. The program is expected to last between six and eight
weeks. The trainees will be acquainted with the curriculum for the elementary level
and adult literacy facilitators with the basics of teaching methodology, classroom
management, documentation of student activities, etc.
The Ministry intends to empower the community to play a leading role in expanding
Kindergarten and Community Care Giving Education throughout the country.
However, the Ministry will bear the main responsibility of producing adequate and
qualified teachers. Thus, this sub-component, on top of providing access is aimed at
equipping Kindergarten and Community Care Givers’ Centres with trained teachers
and directors.
The current shortage of trained Eritrean teachers for general secondary schools
compels the Government to recruit and employ expatriate teachers pending the
availability of a sufficient supply of national teachers. Therefore, the Plan makes
provision for financing the temporary expatriate teachers’ salaries and for an internal
scholarship program for Eritrean teachers to gradually replace the expatriate teachers.
In addition, to boost the local supply of teachers for secondary schools, the five year
plan includes the following measures:
o Recruit about 700 graduates each year from the College of Education at Mai
Nefhi Institute of Technology;
o Recruit and orient about 100 graduates during the coming five years from
other Colleges and deploy them as teachers. Apart from the graduates from the
College of Education, most of the other new recruits are unlikely to have any
solid foundation either in educational theory or practice. This constraint will
be addressed by providing them with short orientation courses in educational
theory and pedagogy during the summer, prior to their deployment as teachers.
o Deliver a training program for IT instructors to provide secondary schools
with qualified IT instructors.
o Draw on the pool of 50 returning graduates who have been studying in
College of Education to upgrade their qualification.
251. There is a need to review and revise teachers’ conditions of service to ensure that there are
sufficient incentives to enter and remain in the teaching profession. Upgrading the
professional status of teachers is necessary, but not sufficient, to retain them in schools. To be
sufficiently motivated, teachers must be accorded recognition in the form of a comprehensive
incentive scheme. The MOE will review the salary structure with the aim of developing a
promotional ladder with a view to offering teachers career advancement opportunities
without them having to move from active classroom practice.
252. Teacher’s salaries were increased substantially a few years ago. In addition, efforts were
made to provide leaving quarter and solar panels for teachers serving in remote areas.
However, recent increases in the costs of living have adversely affected the purchasing power
of theses salaries. The government is now in the process of undertaking a series of studies
with a view of improving the conditions of service of teachers and other civil service staff.

55
B. Specific objective 2: Improve the Quality of Learning and Relevance of
Education
1. Basic (Formal and Adult Education) and Secondary Education
253. The strategy for increasing student achievement focuses on curricula, teachers, school
management, textbooks and teaching/learning materials. It has the following principal
elements:
Revision of curricula to focus on standards for expected learning outcomes and
vertical/horizontal integration of subjects;
Provision of adequate textbooks and learning materials consistent with the new
curricula;
Increasing school leadership and teacher competencies through systematic and well-
targeted in-service staff development programs on the new curricula, new teaching
methods, continuous assessment as well as strengthening language competencies;
Upgrading teachers and providing them with continuous professional development,
including by distance education;
Improving teaching methods and student time on task in the classroom;
Reducing class sizes; provision of necessary classrooms, furniture and equipment to
relieve overcrowding;
Provision of facilities and equipment for science, libraries and instructional
materials (termed the ‘school support system’.)
Establishment of computer access through ICT, including computer laboratories and
e-learning;
Gradual reduction in the number of schools using the double shift system;
Stimulation of greater parental and community interest in student performance;
Continuing MLA studies to track progress on learning achievements and target
areas in need of special help; and
Ensuring that national examinations at grade 8 and 12 are redesigned as necessary to
reward demonstration of mastery of knowledge, skills and competences, as
identified in the new curriculum, and therefore reinforce appropriate teaching and
learning.
2. Technical and Vocational Skills Development
254. In view of the importance of skills development for Eritrean economic growth technical-
vocational education and training (TVET) has been given greater importance in the five year
plan.
255. A sub-sector analysis of the TVET system was carried out in 2005 and the proposals
presented here are based on the findings of that review.
2.1 Overall Objectives
256. The overall objective for TVET is to ensure adequate supplies of competent, adaptable skills
for wage and self-employment and to the economic growth of the country.

56
2.2 Strategies/activities
257. This objective will be sought through the following three principal means:
a. Organisational and management development of TVET, through:
Development of a policy for TVET;
Establishment of a system for coordinating skills development with relevant
ministries (Labour and Welfare, Trade and Industry, Agriculture, etc.), employers
and labour unions.
Development and systematic use of labour market information to guide the
development of TVET.
Strengthening the central capacity of the MOE to conduct policy formulation,
monitoring and evaluation and quality assurance.
Strengthening the organization and management of training institutions through
capacity development of the management staff of training institutions;
b. Raising the standards of quality and achievement in skills development, through:
Development and implementation of output-based curricula: The aim is to achieve
more effective mastery of skills competencies through introduction of outcomes-
based content and adoption of external assessment of learning results.
Strengthening instructor training: The competencies of instructors essentially dictate
the eventual skills acquired by trainees. The shortage of instructors for TVET, both
in number and competence, remains the main constraint for the transfer of
technological know-how in the country. The Ministry will expand the output of
qualified national instructors through expansion of college of teacher education.
Conducting staff development programmes in order to improve the professional
competencies of instructors, school directors, supervisors and other professionals in
the TVET Department.
Re-equipping of Technical Schools: Technical Schools suffer from outmoded and
inoperable equipment. Therefore, the Plan includes funds mainly for re-equipping
eight Technical Schools:
Supplying textbooks and teaching materials to all existing technical-vocational
institutions.
c. Expanding the output of skills in critical areas for national development, through:
258. Establishment of Skills Development Centres (SDCs): Under the plan five Skills
Development Centres will be established as flexible, multipurpose training institutions.
These institutions are intended to serve out-of-school youth and adults with short-term
modular training that can be adapted to varying market demands. SDCs will be the main
avenue for introducing post-schooling skills development, as called for in the Concept Paper.
259. Building of new Technical Schools: In view of shortages of skilled workers and the lack of
skills provision in important parts of the country, the Plan will establish six new Technical
Schools. The schools will have a capacity of 540 trainees each and will offer nine trades, to
be selected in accordance with market requirements.

57
3. Reduction in wastage.
260. The challenge is to improve the flow of students through the system in tandem with
improving the quality of education. Virtually all of the interventions designed to increase
access and boost quality will also reduce repetition and dropout. Such reductions are
essential to reduce costs in the system (i.e. avoid taking up a student place by teaching a
student in the same year twice) and free up capacity for new students. The Ministry is
studying its promotion policy and examinations and will develop and implement a strategy to
assist slow learners. The MOE is looking investigating measures to combat student wastage.
Through consultations and studies it plans to arrive at an integrated set of policy measures to
tackle the problem. Meanwhile, a tentative set of measures would include educational
interventions, community interventions and measures to provide financial incentives. Each is
briefly outlined below.
261. Educational measures include more female teachers, better training in interactive pedagogy,
more relevant content, clearer learning objectives, continuous assessment of student progress,
opportunities for remedial instruction for those falling behind and closer supervision through
local education offices. Non-school factors must also be addressed. Information campaigns
can be effective means to counter traditional parental resistance to enrolling girls by
communicating the benefits of education and the life-long consequences of non-attendance.
In addition, parent-teacher organisations and other community groups can help overcome
negative parental attitudes. This will be done through meetings at the community level,
particularly in parent-teacher-student-Associations, and more widely through radio media.
Finally, it may be necessary to provide other direct incentives for enrolment and retention. In
addition, to overcome the direct and opportunity costs of non-enrolment the Ministry will
provide bursaries for children of the poorest parents, as well as assistance in transportation
(e.g. bicycles) and in purchasing school uniforms.
C. Specific Objective 3: Institutional Capacity Development
3.1 Overall Objective
262. The central thrust of the strategy for institutional development is to strengthen capacity of
MOE staff at all levels. Consistent with the decentralization process, the strategy seeks to
ensure that management and operational activities will be progressively handed to Zobas,
local communities and schools. The strategy aims to achieve enhanced capacity at the local,
zoba and central levels. The capacities required to be developed are for sector policy, strategy
planning, programming and budgeting; program implementation, monitoring and evaluation;
quality education monitoring, developing systems and tools. It also aims, to develop the
capacity of schools to deliver quality education services and the empowerment of local
communities for school management, school planning and budgeting.
3.2 Strategies/activities
263. The strategies of the five year plan for capacity building will focus on human, organizational,
and institutional capacities.

58
264. At each level of the education sector the following strategies will be implemented to address
the capacity gaps:
Strengthening professional capacity of MOE staff at all levels to address the required
capacity and adequacy of competencies;
Enhancing organizational capacity for efficient education services through adopting
clear definition of tasks and responsibilities and provision of adequate working space,
furniture and equipment;
Developing institutional capacity covering policy, legal, and institutional frameworks
and systems that define how the system works.
265. The following implementation modalities will be used to achieve the objective of the capacity
building program.
266. Strengthening Human Capacity: Human capacity in various professions and competencies
at the managerial level will be strengthened through long-term training both at the under-
graduate and post-graduate levels, through distance learning and face-to-face instruction, or a
combination of the two. Short-term training will also be undertaken in the areas of leadership,
including through specific modules and exchange of experiences with other countries in
comparable situations.
267. A substantial number of study tours will be appropriately sequenced through the five year
plan in line with the demands for associated experiences. The study tours will explore,
reflect upon and apply as appropriate experience in other countries of the following areas:
a. Educational Management Information System (EMIS);
b. Teacher Education and Development;
c. Early Childhood Development;
d. Curriculum planning and development;
e. Special Needs Education (inclusive education);
f. Development, management and quality assurance for TVET;
g. Guidance and Counselling;
h. Adult education (including continuing and lifelong education);
i. Supervision and monitoring;
j. Participation in SACMEC;
k. Assessment and National Examinations; and
l. Parent-Teacher-Student-Associations (PTSA)
268. The achievement of overall objectives of the ESDP, the specific objectives of each of its
forgoing two components, the effective implementation of strategies, and the effective
execution of means and activities will require effective and efficient delivery capacity of the
sector. Yet, it is well recognized that the delivery capacity of the MOE is inadequate for
overseeing and managing sector development activities. The ESDP will place even higher
demands on this already stressed delivery capacity and will be essential to ensure that this
part of the system is adequately resourced..
269. Improvement of Staff Motivation and Consequent Performance: Even where there are
appropriately equipped staffs, and in the right numbers, the level of motivation to perform has
been identified as a real threat to the effective implementation of the sector plan. To mitigate
this threat, the current incentive system for all MOE staff will be reviewed to develop a

59
restructuring of this system. This exercise is strongly proposed against the well-considered
constraints in the broader national environment, but with due consideration to the reality that
ignoring incentives and their impact on effective service delivery is untenable.
270. Strengthening Organizational Capacity: Effectively strengthening all the above human
capacities will not guarantee an effective delivery of the sector plan, if those human resources
find themselves operating in organizational environments that are unresponsive to the
demands and requirements of the Plan. If this issue is not addressed there is a risk that the
expertise, commitment, and motivation of staff will remain an unrealized potential. To turn
the MOE and its structures into enabling organizational environments, the following actions
will be taken in the coming years.
Some restructuring of the MOE will be required in view of the GOSE’s decision to
transform the whole educational system. This restructuring will be based on a
comprehensive review of the MOE’s organizational structure, the main functions and
tasks of its various Departments, as well as all the positions and job descriptions.
271. Defining and reinforcing organizational linkages for effective delivery: The effective
implementation of the five year plan will require that each Department and other stakeholders
effectively contributes to program implementation, especially around shared and/or
interrelated tasks. To ensure the effective implementation of the plan, the following
institutional linkages need to be reviewed and strengthened:
a. The MOE’s Research Division with other research centres and institutions of higher
learning;
b. MOE’s Teacher Training, Development and Support System on the one hand, and
Teacher Education Institutions and the National Association of Teachers on the other
hand;
c. The Department of TVET and other major stakeholders, such as the Ministry of
Trade and Industry, Ministry of Labour and Human Welfare, the National
Confederation of Eritrean Workers, the National Association of Employers, etc.;
d. MOE’s efforts to develop Media Education with the activities of the Ministry of
Information.
272. Strengthening Institutional Capacity: Steps to strengthen institutional capacity will include
the development of the following:
Strengthening the policy and legal frameworks
Establishing and/or consolidating a variety of institutional frameworks
273. The above-listed institutions may require policy revisions and legal frameworks. Their
capacities will be carefully analyzed and appropriately developed.
274. In terms of procedures, rules and regulations, priority will be given to the updating of the
existing Procedures, Rules and Regulations (PRR) and developing new ones.
275. Studies on sector and sub-sector issues will be carried out. Technical assistance will be
required to conduct some studies to develop various aspects of the management system.

60
276. Management Delivery Systems: To ensure that the education sector delivers as expected, a
whole set of management systems and tools must be put in place over the long term.
However, some of these are more urgently needed and will affect the success of the plan to a
greater extent than others. The most urgently required management delivery systems that will
be reviewed and reformed as required are the following:
a. Educational Management Information System (EMIS);
b. Financial Management and Budgeting System;
c. Teacher Training, Professional Development and Support System;
d. Staff performance appraisal system;
e. Incentive Schemes and career Ladders for all categories of staff;
f. Quality Assurance System;
g. Monitoring and Evaluation System; and
h. Internal and external communications systems, including the systems for managing
the flow of information.
3.3 Financing Strategy.
277. The strategy of the Government for financing needed reforms, improvements and expansion
is the following:
The Government will increase its expenditures on education in line with its
commitment to EFA and MDG goals and its ability to raise domestic revenues;
The community and direct beneficiaries will be mobilised to contribute towards
financing educational costs, exempting those from low-income households;
The private sector will be encouraged to invest in the establishment, operation and
expansion of schools; and
Development partners (DP) will be encouraged to assist in closing the financial gaps.
The government is in the process of requesting financial and other assistance from
the Global Partnership for Education (GPE).
GSE intends to adhere to the principles of the 2005 Accra Declaration on Aid
Effectiveness (and other subsequent international accords), which seek to enhance
harmonization of efforts among DPs and alignment with government systems to the
fullest possible extent. To this end it welcomes the financial and other support of
DPs, with scope to provide funding utilizing a range of modalities. In line with the
guidance of the Global Partnership for Education (GPE), funding modalities
acceptable to GSE are: budget support, both i) general and ii) sectoral; iii) pooled
funding among DPs; iv) stand-alone projects, with a preference for the order i) to
iii), as stated here.
3.3.1 Costs of the Plan
Actual Spending on Education
278. In projecting costs of an education sector plan, it is necessary to show them in the context of
the amount that is actually being spent on education at present. The Ministry of Finance
provided data to the ESDP costing team, of which the overall total is summarised in Table A.
Together with World Bank estimates of Eritrea’s GDP, these data show education spending
as proportions of GDP and total government spending. They indicate that, in its spending on

61
education, Eritrea may be in the lower part of the spectrum of countries of similar income
levels, perhaps giving space for increased spending.
Table A – Education Spending (including higher education) in the Context of GDP
and Total Public Spending
Source: Ministry of Finance, except GDP figures, which come from the World Bank
website database, converted to Nakfa at 15 to the US dollar.
279. Further analysis of actual expenditure is not presented here, since data from the MoE show
spending grouped in different ways. These presentational differences make it difficult for
sector decision-makers and planners to manage the system with a clear understanding of what
has actually been happening in the recent past, and the relative priorities of different parts of
the sector as shown by the resources committed to the sector. Given that the EMIS data on
enrolment and the school system are comprehensive and produced relatively quickly, a better
understanding of where money is spent would allow good analysis of system costs, which
would be helpful to all concerned. The two Ministries are working to resolve the problem,
and it is hoped in the near future to have available an analysis, presented in an agreed form,
that meets the needs of both.
3.3.2 Overall Costs of the ESDP
280. The ESDP’s objectives are ambitious and highly desirable. Achieving them, however, will be
costly. The Plan will need considerable extra resources to fund its development activities and
other investments. In addition, the expanding education system will cost more to run, due to
increased enrolment:
the total salary bill will increase as more teachers are needed,
as more students are enrolled they will need more textbooks and materials,
and the other operating costs of the system will grow.
281. The expenditure data and projections in the following section refer to the total Eritrean
education sector excluding Higher Education. In other words, they include the development
costs, running costs, and salaries of:
general education;
Actual Actual Actual Actual
Nkf 2008 2009 2010 2011
GDP US$ Mn (World Bank) $1,380.2 $1,856.7 $2,117.0 $2,609.0
GDP Nkf Mn (World Bank) Nkf20,702.4 Nkf27,850.5 Nkf31,755.0 Nkf39,135.0
Total Education SpendingNkf
Mn (MoF) Nkf 763.8 Nkf908.6 Nkf1,038.2 Nkf1,036.4
Education Spending as % GDP 3.7% 3.3% 3.3% 2.6%
Education Spending as %Total
Government Spending (MoF
data) 8% 10% 8% 8%
Education Spending excluding
Higher Education Nkf Mn
(MoF) Nkf 601.5 Nkf 823.1

62
teacher training;
adult literacy, complementary education, and continuing education;
technical and vocational education and training (TVET); and
the administration of the education system.
282. Projected Incremental Cost of the ESDP: Table B shows projections of incremental and
annual development spending needed to achieve the ESDP objectives, compared with
Ministry of Finance estimates of development spending for 2011.21
The average additional
annual cost of the programme, over the period of the ESDP (2013-17), is $143.2 million,
composed of $138.5 million development costs (that is, physical investment in buildings and
equipment, together with the costs of training, capacity expansion, books and materials, and
other development programmes intended to achieve the ESDP objectives), and $4.7 million
incremental operational costs.
The scale of the planned investment and development activities – capital spending – is
shown by comparing the Plan’s projected $138.5 million average annual capital
expenditure with the $4.7 million capital spending in 2011 (Ministry of Finance data).
The $4.7 million projected average annual increment in operating costs represents the
additional amount needed each year to pay for the extra teachers and running costs
required as enrolment expands. It represents an annual increase of about 9%
compared with the Ministry of Finance estimate of $50.2 million for recurrent
education spending in 2011.
Table B: Projected Summary Incremental Cost of the Eritrea ESDP, presented as the
total of (a) the Programme’s development costs, and (b) the projected increase in the
cost of operating the education sector caused by the ESDP.
SUMMARY COSTS, TOTAL ESDP $'000 2011 2013 2014 2015 2016 2017
Average Annual Costs 2013-17
Total Incremental Education Program Cost
127,838
139,008
161,348
142,657
121,595
138,489
Of which:
Development Costs 127,838
139,008
161,348
142,657
121,595 138,489
Ministry of Finance estimate of capital spending on education 4,7
Incremental Salary and Operational Costs
2,771
4,558
2,682
8,376
4,924
4,662
Source: MoE and MoF estimates, EMIS data, MoE projections, NSO population projections
283. Projected Operating Costs: Another way of looking at the cost impact of the ESDP is
shown by Table C. This Table presents projections of total annual spending on education:
21
The Ministry of Finance estimates include other items and are not strictly comparable with the projections.
Further analysis to obtain data for actual spending on a basis comparable with the projections is now under way.
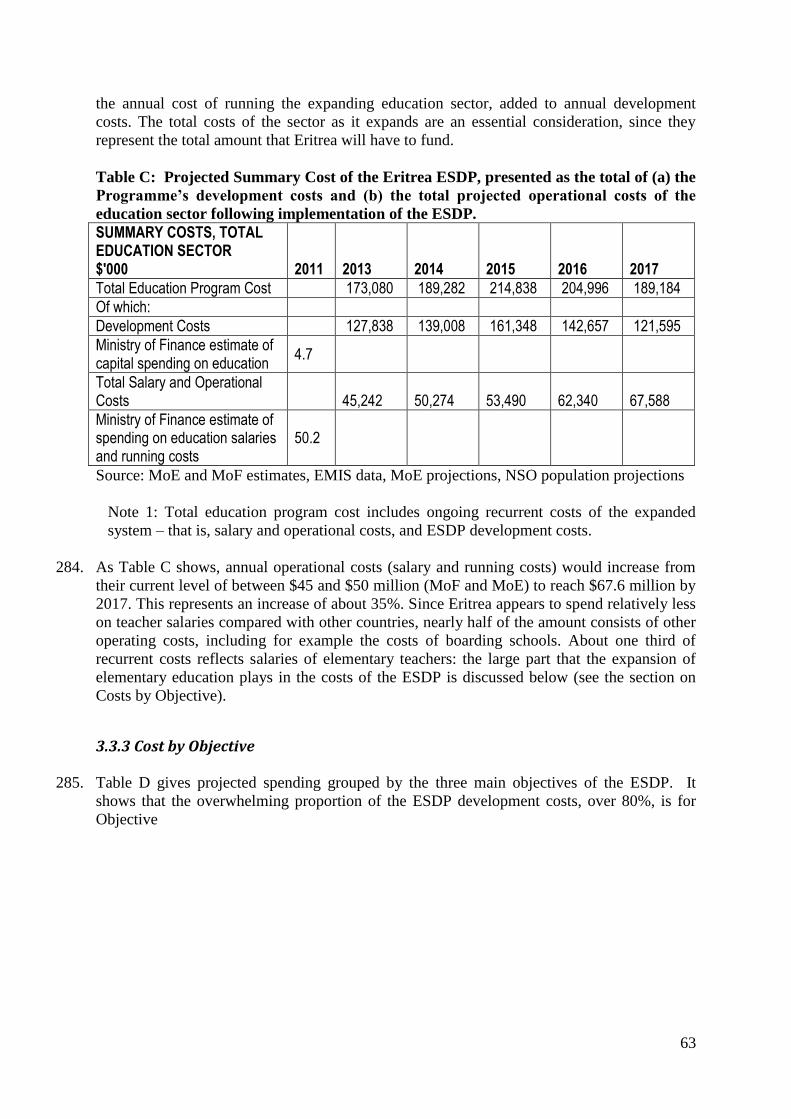
63
the annual cost of running the expanding education sector, added to annual development
costs. The total costs of the sector as it expands are an essential consideration, since they
represent the total amount that Eritrea will have to fund.
Table C: Projected Summary Cost of the Eritrea ESDP, presented as the total of (a) the
Programme’s development costs and (b) the total projected operational costs of the
education sector following implementation of the ESDP.
SUMMARY COSTS, TOTAL EDUCATION SECTOR $'000 2011 2013 2014 2015 2016 2017
Total Education Program Cost 173,080 189,282 214,838 204,996 189,184
Of which:
Development Costs 127,838 139,008 161,348 142,657 121,595
Ministry of Finance estimate of capital spending on education
4.7
Total Salary and Operational Costs
45,242
50,274
53,490
62,340
67,588
Ministry of Finance estimate of spending on education salaries and running costs
50.2
Source: MoE and MoF estimates, EMIS data, MoE projections, NSO population projections
Note 1: Total education program cost includes ongoing recurrent costs of the expanded
system – that is, salary and operational costs, and ESDP development costs.
284. As Table C shows, annual operational costs (salary and running costs) would increase from
their current level of between $45 and $50 million (MoF and MoE) to reach $67.6 million by
2017. This represents an increase of about 35%. Since Eritrea appears to spend relatively less
on teacher salaries compared with other countries, nearly half of the amount consists of other
operating costs, including for example the costs of boarding schools. About one third of
recurrent costs reflects salaries of elementary teachers: the large part that the expansion of
elementary education plays in the costs of the ESDP is discussed below (see the section on
Costs by Objective).
3.3.3 Cost by Objective
285. Table D gives projected spending grouped by the three main objectives of the ESDP. It
shows that the overwhelming proportion of the ESDP development costs, over 80%, is for
Objective

64
1. Improving Access and Equity.
286. Indeed, nearly two-thirds of total development costs consist of Objective 1’s physical
investment costs: construction, rehabilitation of buildings, equipment and furniture. The
largest parts of the whole ESDP programme are:
Construction of elementary classrooms (19% of total ESDP development costs); and
Construction of teachers’ residential quarters, representing 7% of the total.
287. Expenditure on elementary classrooms (and on teachers, see above) reflects the expected
rapid expansion in enrolment. Enrolment at this level is growing for two main reasons.
Elementary education will expand rapidly in the period of the ESDP, to meet Eritrea’s
target of having all children attend primary school.
Elementary expansion is also particularly rapid because the primary school age group
is expanding fast, reflecting high birth rates after about 2003 (information from
National Statistics Office). By contrast, the age group which is now going through
middle and secondary school is part of the cohort born between 1995 and 2002, when
Eritrea’s birth rate was low. Thus there will be relatively few children to enrol in
middle and secondary school during the Plan period. After about 2015, middle school
will need to expand rapidly as the cohort born after 2003 reaches that level, followed
three years later by secondary education.
On the other hand, as described in the ESDP, efforts to reduce repetition could reduce
gross enrolment, while not affecting the objective of universal primary education.
This could have an important effect on costs.
288. Construction spending also has to take into account the $30,000 average cost per classroom.
Table D: Costs by ESDP Objective, as % of total ESDP Development Cost
Development Cost by Objective 2013 2014 2015 2016 2017
Annual
average
Objective 1 - total development
cost 75% 78% 81% 81% 77% 79%
Physical investment 57% 60% 65% 64% 57% 61%
Other development 18% 18% 16% 17% 20% 18%
Objective 2 - total development
cost 13% 14% 12% 11% 14% 13%
Physical investment 2% 2% 2% 2% 3% 2%
Other development 11% 12% 10% 9% 11% 11%
Objective 3 - total development
cost 12% 8% 7% 8% 8% 8%
Physical investment 7% 4% 3% 4% 3% 4%
Other development 5% 4% 4% 4% 5% 4%
Total ESDP Development 100% 100% 100% 100% 100% 100%
Source: MoE and MoF estimates, EMIS data, MoE projections, NSO population projections

65
289. The planned cost of housing for teachers (averaging $10 million a year) is intended to
respond to the difficulties of employing experienced, qualified teachers in hard-to-reach
places. The housing is intended to provide for teachers at all levels of education.
290. The total cost of all other development activities for Objective 1, summarised in Annex Table
3.1, is also about 18% of total development costs, averaging $24.8 million annually. A large
part of “other development” covers provision of books and materials (with TVET by its
nature requiring a large proportion); other development activities include campaigns to
sensitize parents and communities about education, the proposed mass literacy campaign, and
the consolidation of Arabic teaching in schools.
3.3.4 Financing the Plan
291. The costs of implementing the ESDP will be substantially greater than amounts so far spent
on education in Eritrea. Table E compares projected ESDP costs with Ministry of Finance
estimates of recent total education spending, and other sources of finance. It projects an
average annual financing gap of over $130 million during the ESDP. On the one hand, the
ESDP indicates areas (such as reducing repetition rates) where increased efficiency could
reduce costs. On the other hand, there is significant potential for increased funding from
external partners. The GPE has already indicated a readiness to consider contributing to the
ESDP; the African Development Bank and UNICEF are already contributing, while the
World Bank has provided funds to Eritrean education in the past. It is hoped that further
discussions with other potential partners will allow funds to be found.
Table E: Financing the ESDP
2012 2013 2014 2015 2016 2017
Projected Costs of the
ESDP - Development
& Incremental
Operational Costs
130,609 143,566 164,030 151,032 126,520
Total Education
Program Cost,
including ongoing
recurrent costs of the
expanded system, and
ESDP development
costs
173,080 189,282 214,838 204,996 189,184
Total Education
Program Cost, 2011:
Ministry of Finance
data for education
spending
54,873
Education Spending
as Proportion of
Total Government
Spending, MoF data
2011 8%
Projected 57,617 60,497 63,522 66,698 70,033

66
Government
Spending on
Education,
Projected Funding
Gap 115,464 128,785 151,316 138,298 119,150
Potential & Secured
External Funding:
African Development
Bank 6,600,000 6,600,000 6,600,000
GPE 5,000 10,000 10,000
UNICEF 2,200,000 2,200,000 2,200,000 2,200,000 2,200,000
Islamic Development
Bank 200,000
GPE 10,000,000 8,000,000 7,300,000
Others Development
Partners
Community
contributions
Source: MoE and MoF estimates, EMIS data, MoE projections, NSO population projections
Note 1: These figures refer to the education sector including general education; technical and
vocational education; adult literacy and complementary education; and teacher training.
They do not include higher education.
Note 2: Government spending on education is projected by assuming total government
spending increases at 5% a year, and that the proportion spent on education remains constant
at 8%.
3.4 Tertiary Education and Training Institutions
292. Tertiary level institutions are not included in the five year plan. However, the government
intends to conduct a comprehensive analysis of higher education in order to define, elaborate
and articulate the various requirements of tertiary education and training. This process will
lead to the strengthening of the policy and legal framework for tertiary education and
training. Findings of this analysis will be used to provide the technical and analytical base
for the government’s vision for the future of this sub-sector, leading among other aspects to
the strengthening of the policy and legal framework. The analysis will equally be used to
interrogate, sharpen and provide technical soundness of this vision. All the above will be
undertaken with the express purpose to ensure that this sub-sector can play its expected role
in providing the high-level human resources required for the economy and the general
development of the country.

67
CHAPTER VI: IMPLEMENTATION ARRANGEMENTS
293. The overall objective of the implementation framework of the ESDP is to ensure that the plan
gets implemented fully, on time and within budget. This requires, inter alia, an effective
administrative structure, efficient procedures, capable human resources and sufficient
financing for implementation.
294. The implementation framework for the plan is built on the following basic principles:
Functions that are best or most effectively concentrated in one place, such as expertise
for procurement, will be centralized;
Clear division of labour among the various actors to minimize duplication;
Clear reporting responsibilities;
Clear accountabilities;
Units authorized to act with sufficient resources to do so;
Maximum use of existing structures, suitably strengthened, so as to avoid overlap;
Rationalization and simplification of procedures where possible.
295. Key implementers of the plan will comprise the MOE, the zoba and local education offices.
In recognition of the fact that the Plan calls for a comprehensive, cross government approach.
MOE will be assisted by other government ministries, chiefly the Ministries of National
Development, Finance, Public Works, and Justice together with regional administrations.
Ministry of Education (MOE)
296. The MOE will be responsible for the policy development and implementation of strategic,
legal, and institutional aspects of the plan and will retain oversight of these aspects. The
MOE will also retain responsibility for the management of the entire implementation process
of the plan.
The Steering Committee
297. The implementation management function will be executed by a steering committee. The
Steering Committee is chaired by the Minister of Education and is composed of five MOE
Directors-General. Thus, all divisions and units of the MOE involved in plan implementation
will be represented. This committee will meet monthly or more frequently as dictated by the
pace of work.
298. The Steering Committee’s functions are the following:
Foster a common understanding of the plan goals and policies;
Provide strategic oversight;
Review and approve annual work plans and budgets;
Coordinate the various branches of the MOE in plan implementation;
Assess the performance of the MOE in plan implementation;

68
Take corrective actions to avoid or overcome problems;
Report on program implementation to higher levels of government
MOE Departments, Divisions and Units
299. The implementation/execution functions of the MOE will be undertaken by the respective
structures of the MOE within which the substantive, technical aspects of the plan will be
mainstreamed. These structures include the various divisions and units at headquarters, Zoba
offices, Sub-zoba offices and schools. The roles and functions of these MOE structures are
elaborated below.
300. The responsibilities generally are focused on the substantive (i.e., the educational) aspects of
the plan. The MOE Departments will define requirements, and will then be passed to the
Department of Administration and Finance for actual procurement. The MOE Divisions and
Units at all levels of the education sector will be responsible for operating their specific
activities of the plan. These Divisions and Units will also be responsible for supervising their
activities. They will be responsible generally for developing curricula and teaching
programs, selecting or developing instructional materials, designing, organizing and carrying
out training programs, etc. In addition, they will monitor and evaluate their respective
activities, help prepare annual work plans, and report to the higher level authority on their
activities, as needed.
301. An Annual Work Plan and Budget (AWPB) will be prepared each year in November,
consistent with overall plan and component objectives and design. As the activities of the
plan were defined during the preparation stage, the implementation plan for the activities may
need to be modified during the course of the ESDP, both in terms of content and timescale, in
line with the experience and capacity gained in Plan implementation. Thus, an AWPB will
need to be developed every year. The planning process will embody consideration of past
performance, including results, and planned activities for the coming year. The Departments
of MOE in close collaboration with Zoba education offices will assume overall responsibility
for preparing the AWPB, which once drafted will be approved by the Steering Committee.

69
CHAPTER VII: MONITORING AND EVALUATION (M&E)
302. In order to assess whether the development objectives of the ESDP are being met, a
monitoring and evaluation system will be established in the MOE. Monitoring and evaluation
of project performance will be systematically carried out during the life of the plan and
integrated into the ongoing operation of the plan at all levels and used to provide feedback,
encourage innovation, team building, and project ownership. As the plan aims to contribute to
sectoral goals by carrying out specific activities, MOE will ensure the timely implementation
of the planned activities, which are critical to meeting the plan’s development objectives, and
assess the overall performance of the education sector as a whole and improvements in the
sectoral indicators.
303. The foundation of the programme monitoring and reporting systems will be the Logical
Framework (Annex 5) and its key performance indicators.
304. The implementing Departments of MOE will collect evidence required to develop baseline
data on each component. With the support of the Research Division of the Department of
Research and Human Resources Development, all Departments will contribute component
baseline into a comprehensive baseline against which the monitoring performance indicators
will be applied.
305. Monitoring and evaluation of project performance will be carried out by the MOE at all
levels of the sector, in close collaboration with the Steering Committee which will have
overall responsibility for the management and coordination of this important activity.
Review and reporting issues
306. Quarterly progress report: which will summarize the progresses of activities carried out
within the reporting period against the performance indicators, including a report integrating
the results of the monitoring and evaluation activities performed, on progress achieved in the
carrying out of the plan;
307. Annual report: On or about November 30 in each calendar year, a report on the progress
achieved in carrying out the plan, as measured against the indicators set for the year, together
with the results of the relevant monitoring and evaluation exercise conducted during the year
will be prepared and setting out the measures recommended to ensure the efficient carrying
out of the Plan and the achievement of the objectives thereof during the period following
year;
308. Joint Annual Review Meeting: In December of each year, or at another appropriate time
consistent with the wider GSE financial and physical planning cycles, a Joint Annual
Reviews meeting will be held, during which the findings of the Annual Report will be
considered, in order to reach a conclusion as to the level of success achieved in carrying out
the Plan; to identify problematic aspects which have hampered progress, and to make
recommendations on steps to be taken to address deficiencies. The latter may include
suggestions fro studies to examine more closely how matters can be improved and may lead
to pilot schemes to test innovative approaches. Given that performance of the sector is

70
dependent on a number of GSE Ministries and agencies in addition to the MOE, participants
in the JARM should include representatives of these key government stakeholders; also
representatives of civil society and Development Partners. The participation of the latter is
essential given that they are in partnership with the GSE and commit themselves to support
the achievement of the government’s objectives for the sector as encapsulated in the ESDP.
This process will satisfy the joint education sector monitoring arrangements by the Local
Education Group (LEG), necessary under the requirement of the Global Partnership for
Education (GPE), which specify the conduct of annual joint sector review, led by the
government. For GPE purposes the key product of the JARM is a brief aide-memoire, which
summarizes the implementation of the education sector plan;22
309. Mid Term Review of the plan will be undertaken halfway through the plan to assess the
implementation of the activities and to discuss if some adaptations are needed. It will cover
among other things: (i) progress made in meeting the Plan’s objective; and (ii) overall
performance as measured against the performance indicators.
310. At the end of the programme, a final evaluation of the ESDP will be carried out.
22
It is important that JARM is organized so as to minimize transaction costs by removing the requirement for
other additional reviews, e.g. for the GPE, or to satisfy the requirements of multi-lateral or bi-lateral DPs which
are providing funds in support of the ESDP.

71
REFERENCES

72
ANNEXES
Annex 1: Eritrea - Projected Costs of the ESDP, 2013-17
Note: These figures refer to the education sector including general education, technical and vocational education, adult literacy and
complementary education, and teacher training. They do not include higher education.
The sources for all tables include MoE and MoF estimates, EMIS data, MoE projections and NSO population projections.
Table 1(a): Projected Summary Cost of the Eritrea ESDP, presented as the total of (A) the Programme’s development costs, and (B) the
projected increase in the cost of operating the education sector caused by the ESDP.
SUMMARY COSTS,
TOTAL ESDP, $'000 2012 2013 2014 2015 2016 2017
Average
Annual
Costs
2013-17
Total Incremental
Education Program Cost
130,60
9
143,56
6
164,03
0
151,03
2
126,52
0 143,151
Of which:
Development Costs
127,83
8
139,00
8
161,34
8
142,65
7
121,59
5 138,489
Incremental Salary and
Operational Costs
2,771
4,558
2,682
8,376
4,924
4,662
Note 1: Cost figures in this table are preliminary and may change as data in the projection model are updated.
Note 2: Incremental education program cost in each year includes (a) the incremental recurrent costs of the expanded system, compared with the
previous year – that is, incremental salary and operational costs, and (b) ESDP development costs

73
Table 1 (b): Projected Summary Cost of the Eritrea ESDP, presented as the total of (A) the Programme’s development costs and (B) the total
projected operational costs of the education sector caused by implementing the ESDP.
SUMMARY COSTS, TOTAL EDUCATION SECTOR, FROM
IMPLEMENTING THE ESDP, $'000 2012 2013 2014 2015 2016 2017
Total Education Program Cost 173,080 189,282 214,838 204,996 189,184
Of which:
Development Costs 127,838 139,008 161,348 142,657 121,595
Total Salary and Operational Costs
45,242
50,274
53,490
62,340
67,588
Note 1: Cost figures in this table are preliminary and may change as data in the projection model are updated
Note 2: Total education program cost includes (a) ongoing recurrent costs of the expanded system – that is, salary and operational costs, and (b)
ESDP development costs

74
Table 2: Financing the ESDP
Note1: These figures refer to the education sector including general education; technical and vocational education; adult literacy and complementary
education; and teacher training. They do not include higher education.
Note 2: Government spending on education is projected by assuming total government spending increases at 5% a year, and that the proportion spent on
education remains constant at 8%.
2012 2013 2014 2015 2016 2017
Projected Costs of the ESDP - Development & Incremental Operational Costs 130,609,000 143,566,000 164,030,000 151,032,000 126,520,000
Total Education Program Cost, including ongoing recurrent costs of the
expanded system, and ESDP development costs 173,080,000 189,282,000 214,838,000 204,996,000 189,184,000
Total Education Program Cost, 2011: Ministry of Finance data for education
spending
54,873,000
Education Spending as Proportion of Total Government Spending, MoF data
2011 8% 8% 8% 8% 8% 8%
Projected Government Spending on Education,
57,617,000
60,497,000
63,522,000
66,698,000
70,033,000
Projected Funding Gap 115,464,000 128,785,000 151,316,000 138,298,000 119,150,000
Potential & Secured External Funding:
African Development Bank 19,800,000
Islamic Development Bank 200,000
GPE 10,000,000 8,000,000 7,300,000
UNICEF 2,200,000 2,200,000 2,200,000 2,200,000 2,200,000
Other Development Partners
Community Contribution
Note: Cost figures in this table are preliminary and may change as data in the projection model are updated

75
Projected Cost of the Eritrea ESDP, Presented by Objective Table 3-1: Projected Cost of Objective 1, Improve Access and Equity
COSTS OF THE ESDP, BY MAIN OBJECTIVE, $'000 2012 2013 2014 2015 2016 2017
Average 2013-
17
Objective 1: Improve Access & Equity.
1A: Development Activities
1A1: Investment costs
Construct Pre-primary classrooms & schools 3,574.0 4,135.0 4,064.7 3,138.2 1,871.6 3,357
Construct Elementary classrooms & schools 21,596.7
26,032.4
30,824.1
30,049.6
22,396.1 26,180
Construct Middle School classrooms & schools 1,347.8 1,347.8 2,429.1 6,454.0 8,611.0 4,038
Construct Secondary classrooms & schools 9,287.1 10,431.8 8,852.3
11,205.6 8,281.9 9,612
Construct Boarding School for disadvantaged communities 350.0 1,000.0 270
Rehabilitate classrooms, schools, boarding schools 1,607.6 1,830.2 2,091.9 2,383.9 2,701.6 2,123
Expand ATEI - 600.0 6,000.0 - - 1,320
Construct CEE Centres 1,200.0 1,500.0 2,100.0 1,500.0 - 1,260
Construct Adult Literacy Centres, Reading Rooms 2,256.0 2,257.8 2,257.8 2,257.8 2,257.8 2,257
Mobile Libraries 500.0 - 600.0 - 1,150.0 450
Construct two Special Needs schools, & SNE classrooms in existing elementary schools; expand School for the
Deaf; hostels for SNE schools 120.0 2,000.0 820.0 1,920.0 720.0 1,116
Furniture for new & rehabilitated classrooms - all levels; SNE facilities for new SNE buildings, science kits middle schools 9,270.7
10,868.4
12,150.8
13,991.5
11,327.7 11,522
Construct & equip girls hostels 1,200.0 - 1,200.0 - - 480
Construct teacher residential quarters 10,000.0 10,000.0 10,000.0 10,000.0 10,000.0 10,000
ADB Finance (NACVOT) 19,8000.0
Upgrading Existing TVET schools 3,500.0 5,500.0 3,500.0 1,500.0 - 2,800
Construct new Skills Development centres & 3 new technical schools 500.0 6,500.0 6,000.0 5,000.0 - 3,600
Equip new & upgraded TVET 7,078.0 -
10,400.0 1,700.0 - 3,836
1A1 Total Investment 73,037.9 83,353.4 104,290.6 91,100.6 69,317.6 84,220

76
Table 3-1, Objective 1 (continued) 1A2: Other Development 2012 2013 2014 2015 2016 2017 Average
Books & Materials - PPE 510.3 607.2 703.0 776.1 817.2 683
Books & Materials - Elem 2,978.8 3,395.4 3,938.0 4,478.9 4,892.5 3,937
Books & Materials - Mid 1,512.1 1,526.0 1,574.1 1,749.5 1,993.2 1,671
Books & Materials - Sec 1,682.7 2,013.4 2,277.4 2,611.4 2,837.9 2,285
Books & Materials - CEE & Literacy 602.9 685.8 779.9 862.8 917.6 770
Materials & supplies for new & existing TVET centres; develop, supply TVET books 8,705.0 10,150.0 11,800.0 11,430.0 11,750.0 10,767
Awareness-raising & Sensitization - general educ, gender, literacy 3,520.0 3,650.0 3,140.0 1,930.0 1,290.0 2,706
Mass Literacy Campaign 3,280.0 1,500.0 1,425.0 475.0 180.0 1,372
Zoba study "illiteracy-free" villages; Natl Literacy Survey 60.0 2,060.0 560.0 60.0 60.0 560
Total 1A2: Other Development Costs 22,851.7 25,587.7 26,197.4 24,373.7 24,738.4 24,750
Total 1A: Development Cost 95,889.6 108,941.1 130,488.0 115,474.3 94,056.0 108,970
1b1: Annual Recurrent Costs - Total 2012 2013 2014 2015 2016 2017 Average
Total domestic teacher salaries general education 14,051.1 15,044.9 16,231.4 17,509.3 18,845.9 20,417.4
Expatriate Teacher Costs - Sec 2,889.0 2,890.0 2,300.0 2,350.0 3,262.0 2,890.0
Total salaries CEE/Literacy 2,955.5 3,595.6 4,121.1 4,726.7 5,252.2 5,577.8
Total domestic salaries - TVET (inc TVET admin staff) 1,282.5 1,323.9 1,410.8 1,570.5 1,772.0 1,983.9
Expat Teacher Costs - TVET 188.0 188.0 188.0 188.0 188.0 188.0
Operating costs - All levels, inc TVET, boarding schools 16,660.2 18,065.7 21,664.1 22,468.3 27,981.8 31,427.5
TOTAL 1B1: ANNUAL RECURRENT COSTS 38,026.3 41,108.1 45,915.4 48,812.9 57,301.9 62,484.6 Note: Figures for 2012 are calculated on the same basis as the projections for 2013-17. They are not actual spending figures.
1b1: Annual Recurrent Costs - Incremental 2012 2013 2014 2015 2016 2017 Average
Incremental teacher salaries - PPE 216.1 266.5 270.5 199.8 93.7 209
Incremental teacher salaries - Elem 604.2 769.6 928.5 811.1 726.7 768
Incremental teacher salaries - Mid (136.3) (106.9) (13.9) 332.3 508.2 117
Incremental domestic teacher salaries - Sec 309.8 257.3 92.9 (6.7) 242.9 179
Incremental Expatriate salaries & costs - Sec 1.0 (590.0) 50.0 912.0 (372.0) 0
Incremental teacher salaries - CEE & Literacy 164.5 51.5 71.5 51.5 1.5 68
Incremental domestic teacher salaries - TVET 41.4 86.9 159.8 201.4 212.0 140
Incremental Expatriate Teacher Costs - TVET - - - - - -
Incremental operating costs - All levels, inc TVET, literacy, boarding schools 1,405.5 3,598.3 804.2 5,513.5 3,445.7 2,953
Total 1b2: Incremental Recurrent Costs 2,606.2 4,333.3 2,363.4 8,015.0 4,858.7 4,435
Total Objective 1: Development & Incremental Recurrent Costs 98,495.7 113,274.4 132,851.4 123,489.3 98,914.7 98,495.7

77
Table 3-2: Projected Cost of Objective 2, Improve Quality of Education
COSTS OF THE ESDP, OBJECTIVE 2 $'000 2012 2013 2014 2015 2016 2017 Average
Objective 2: Improve Quality of Education
2A: Development Activities
2A1: Investment costs
Information and Communications Technology (includes equipment supply & ICT-related
training) - all levels general education.
2,552.8
2,462.2
2,774.2
2,762.2
3,660.9
2,842
Produce and supply educational audio & video materials
60.0
120.0
200.0
250.0
300.0
186
Total 2A1: Investment costs
2,612.8
2,582.2
2,974.2
3,012.2
3,960.9
3,028
2A2: Other Development Costs
Pre-service training basic education teachers, with teaching practice (Total costs ATEI);
also Pre-service training middle & secondary teachers
1,765.0
2,205.0
2,640.0
3,095.0
3,615.0 2,664
Teacher Upgrading & CPD Programs & Activities (In-Service training) - all levels,
including TVET, SNE teachers
7,049.5
7,340.0
7,222.5
4,990.0
4,185.5
6,158
Consolidation of Arabic language teaching - all levels
533.3
534.3
552.3
529.3
516.3
533
Curriculum Planning, Development for General Education, Literacy, TVET
2,222.6
2,465.6
2,024.9
1,285.6
725.3
1,745
School support: including development &/or supply of reference books, equipment,
teaching-learning materials; school health program; school guidance, counselling &
support. Includes training.
1,502.5
1,640.5
1,464.0
655.2
1,515.6
1,356
Workshops, seminars, in-service training sessions for teachers, school directors
809.0
808.5
851.5
748.0
805.5
805
Enhance & expand continuing education programs
225.0
430.0
485.0
620.0
820.0
516
Workshops and general orientation - literacy, complementary, adult ed; Support other adult
education providers
515.0
825.0
985.0
1,175.0
1,480.0
996
Total 2A2: Other Development Costs
14,621.9
16,248.9
16,225.2
13,098.1
13,663.2
14,771
Total 2A: Development Costs
17,234.6
18,831.1
19,199.4
16,110.3 17,624.1
17,800
Total Cost Objective 2 17,234.6 18,831.1 19,199.4 16,110.3 17,624.1 17,800

78
Table 3-3: Projected Cost of Objective 3, Enhance Institutional Capacity
(Includes costs of Ministry of Education “Administration and Finance”)
COSTS OF THE ESDP, OBJECTIVE 3, $'000 2012 2013 2014 2015 2016 2017 Average
3A: Development Activities
3A1: Investment costs Construction, equipment & furniture for MoE; including building, rehabilitation, re-equipping of printing workshops,
stores, & other facilities of MoE agencies 6,684.4 3,940.2 3,450.6 4,190.1 2,182.1
4,089
Establish fully functional Educational Management Information System 1,752.0 1,252.3 1,396.6 1,251.7 1,248.4
1,380
Procure motorbikes, bikes, monitoring and supervision 212.0 256.7 268.4 165.0 180.0 216
Total 3A1 Investment Activities 8,648.4 5,449.2 5,115.6 5,606.8 3,610.5
5,686
3A2: Other Development Activities
Professional upgrading of MoE staff 3,464.0 3,996.0 4,171.0 4,280.0 4,940.0
4,170
Promote effective educational management & quality education through research; enhance school-based research 672.3 594.7 1,047.6 329.8 934.6
716
Enhance and develop MoE documentation capacity 574.4 18.9 17.5 18.9 17.5
129
Enhance MoE institutional & management capacity: surveys, guidelines, training & workshops, printing & distributing
documents 1,052.0 783.8 1,006.2 593.3 199.8
727
Study tours to acquire best practices 120.0 210.0 120.0 60.0 30.0
108
Monitoring & Evaluation - costs of recurrent activities 183.0 183.0 183.0 183.0 183.0
183
3A2: Other Development Activities 6,065.7 5,786.4 6,545.2 5,465.0 6,304.8
6,033
Total 3A: Development Activities 14,714.1 11,235.5 11,660.9 11,071.8 9,915.3
11,720
3B1: Recurrent Costs
MoE Administration & Finance - salaries 1,455.2 1,519.7 1,598.6 1,687.3 1,790.7 1,869.7
MoE Administration & Finance - operating cost
2,514.4 2,614.3 2,760.3 2,989.9 3,247.3 3,234.0
Total 3B1: Recurrent Costs
3,969.6 4,134.0 4,358.8 4,677.1 5,038.0 5,103.7
3B2: Incremental Recurrent Costs
MoE Admin & Finance - incremental salaries 64.6 78.8 88.7 103.4 79.0
83
MoE Administration & Finance - incremental operating cost 99.9 146.0 229.6 257.4
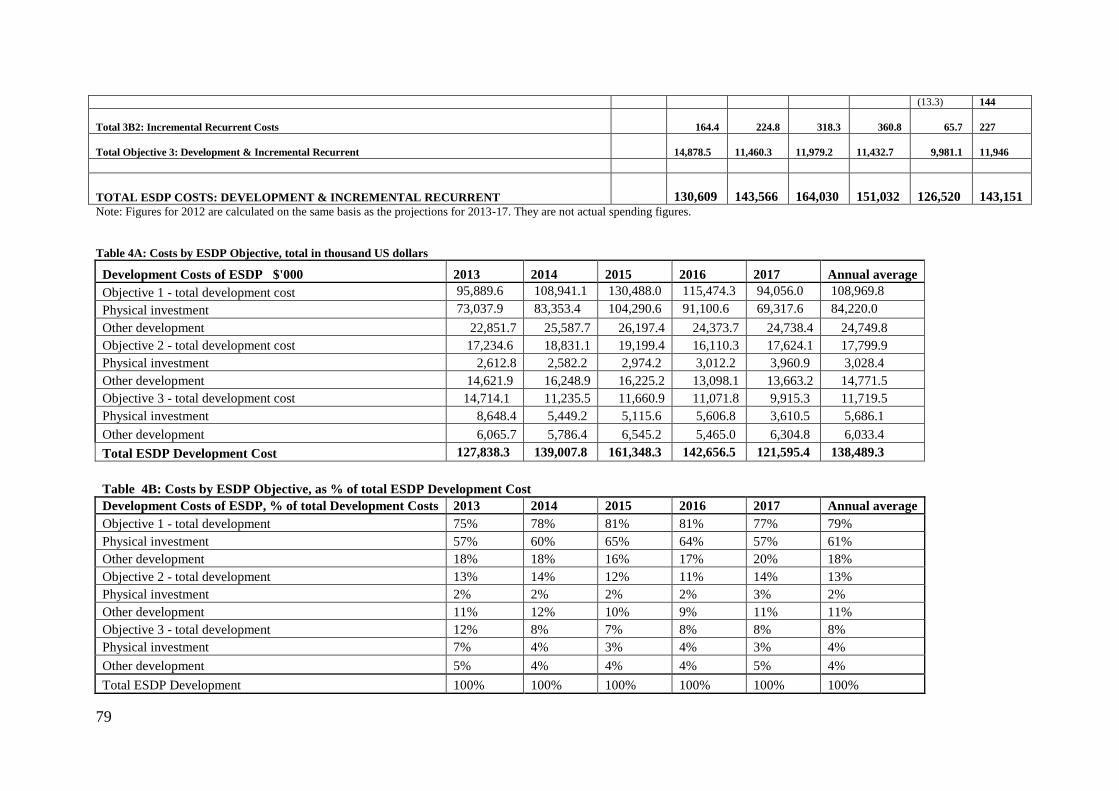
79
(13.3) 144
Total 3B2: Incremental Recurrent Costs 164.4 224.8 318.3 360.8 65.7
227
Total Objective 3: Development & Incremental Recurrent
14,878.5
11,460.3
11,979.2
11,432.7 9,981.1
11,946
TOTAL ESDP COSTS: DEVELOPMENT & INCREMENTAL RECURRENT 130,609
143,566
164,030
151,032 126,520 143,151 Note: Figures for 2012 are calculated on the same basis as the projections for 2013-17. They are not actual spending figures.
Table 4A: Costs by ESDP Objective, total in thousand US dollars
Development Costs of ESDP $'000 2013 2014 2015 2016 2017 Annual average
Objective 1 - total development cost 95,889.6 108,941.1 130,488.0 115,474.3 94,056.0 108,969.8
Physical investment 73,037.9 83,353.4 104,290.6 91,100.6 69,317.6 84,220.0
Other development 22,851.7 25,587.7 26,197.4 24,373.7 24,738.4 24,749.8
Objective 2 - total development cost 17,234.6 18,831.1 19,199.4 16,110.3 17,624.1 17,799.9
Physical investment 2,612.8 2,582.2 2,974.2 3,012.2 3,960.9 3,028.4
Other development 14,621.9 16,248.9 16,225.2 13,098.1 13,663.2 14,771.5
Objective 3 - total development cost 14,714.1 11,235.5 11,660.9 11,071.8 9,915.3 11,719.5
Physical investment 8,648.4 5,449.2 5,115.6 5,606.8 3,610.5 5,686.1
Other development 6,065.7 5,786.4 6,545.2 5,465.0 6,304.8 6,033.4
Total ESDP Development Cost 127,838.3 139,007.8 161,348.3 142,656.5 121,595.4 138,489.3
Table 4B: Costs by ESDP Objective, as % of total ESDP Development Cost
Development Costs of ESDP, % of total Development Costs 2013 2014 2015 2016 2017 Annual average
Objective 1 - total development 75% 78% 81% 81% 77% 79%
Physical investment 57% 60% 65% 64% 57% 61%
Other development 18% 18% 16% 17% 20% 18%
Objective 2 - total development 13% 14% 12% 11% 14% 13%
Physical investment 2% 2% 2% 2% 3% 2%
Other development 11% 12% 10% 9% 11% 11%
Objective 3 - total development 12% 8% 7% 8% 8% 8%
Physical investment 7% 4% 3% 4% 3% 4%
Other development 5% 4% 4% 4% 5% 4%
Total ESDP Development 100% 100% 100% 100% 100% 100%
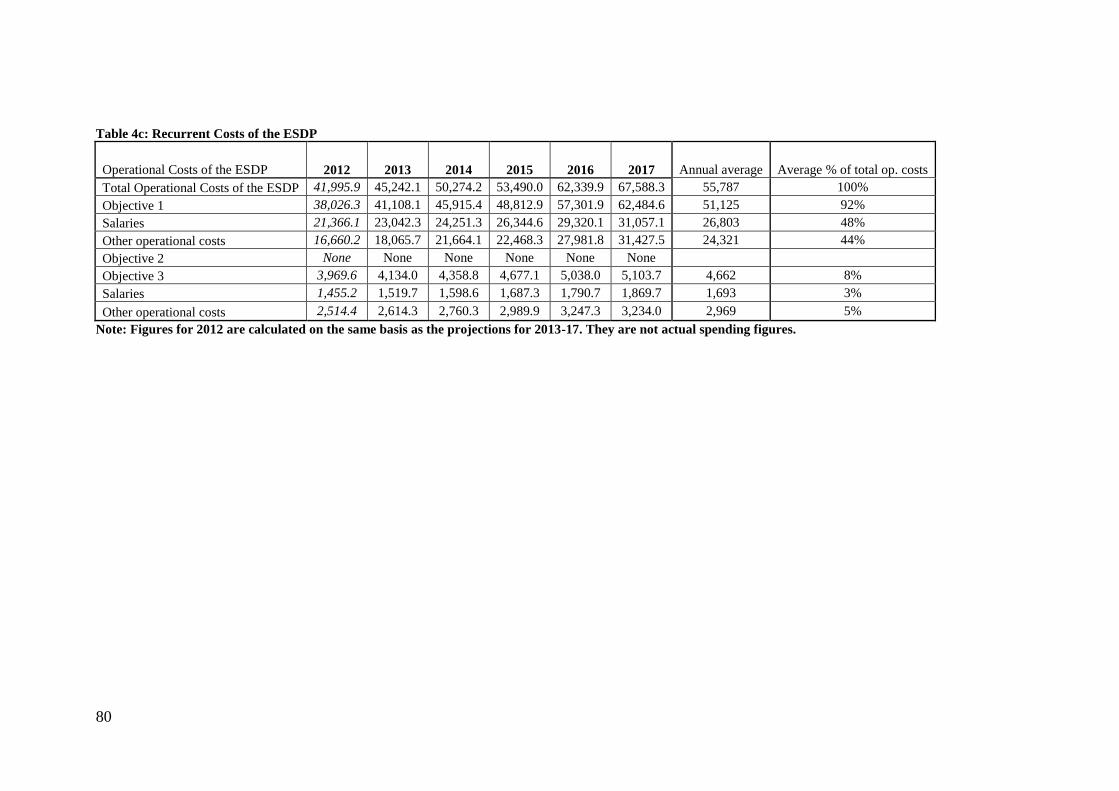
80
Table 4c: Recurrent Costs of the ESDP
Operational Costs of the ESDP 2012 2013 2014 2015 2016 2017 Annual average Average % of total op. costs
Total Operational Costs of the ESDP 41,995.9 45,242.1 50,274.2 53,490.0 62,339.9 67,588.3 55,787 100%
Objective 1 38,026.3 41,108.1 45,915.4 48,812.9 57,301.9 62,484.6 51,125 92%
Salaries 21,366.1 23,042.3 24,251.3 26,344.6 29,320.1 31,057.1 26,803 48%
Other operational costs 16,660.2 18,065.7 21,664.1 22,468.3 27,981.8 31,427.5 24,321 44%
Objective 2 None None None None None None
Objective 3 3,969.6 4,134.0 4,358.8 4,677.1 5,038.0 5,103.7 4,662 8%
Salaries 1,455.2 1,519.7 1,598.6 1,687.3 1,790.7 1,869.7 1,693 3%
Other operational costs 2,514.4 2,614.3 2,760.3 2,989.9 3,247.3 3,234.0 2,969 5%
Note: Figures for 2012 are calculated on the same basis as the projections for 2013-17. They are not actual spending figures.

81
Table 4d: Incremental Recurrent Costs of the ESDP
Incremental Operational Costs of the ESDP 2013 2014 2015 2016 2017 Annual average Average % of total incrmtl op. costs
Total Incremental Operational costs 2,770.6 4,558.1 2,681.7 8,375.8 4,924.4 4,662.1 100%
Objective 1 2,606.2 4,333.3 2,363.4 8,015.0 4,858.7 4,435.3 95%
Salaries 1,200.7 735.0 1,559.2 2,501.5 1,413.0 1,481.8 32%
Other operational costs 1,405.5 3,598.3 804.2 5,513.5 3,445.7 2,953.4 63%
Objective 2
Objective 3 164.4 224.8 318.3 360.8 65.7 226.8 5%
Salaries 64.6 78.8 88.7 103.4 79.0 82.9 2%
Other operational costs 99.9 146.0 229.6 257.4 (13.3) 143.9 3%
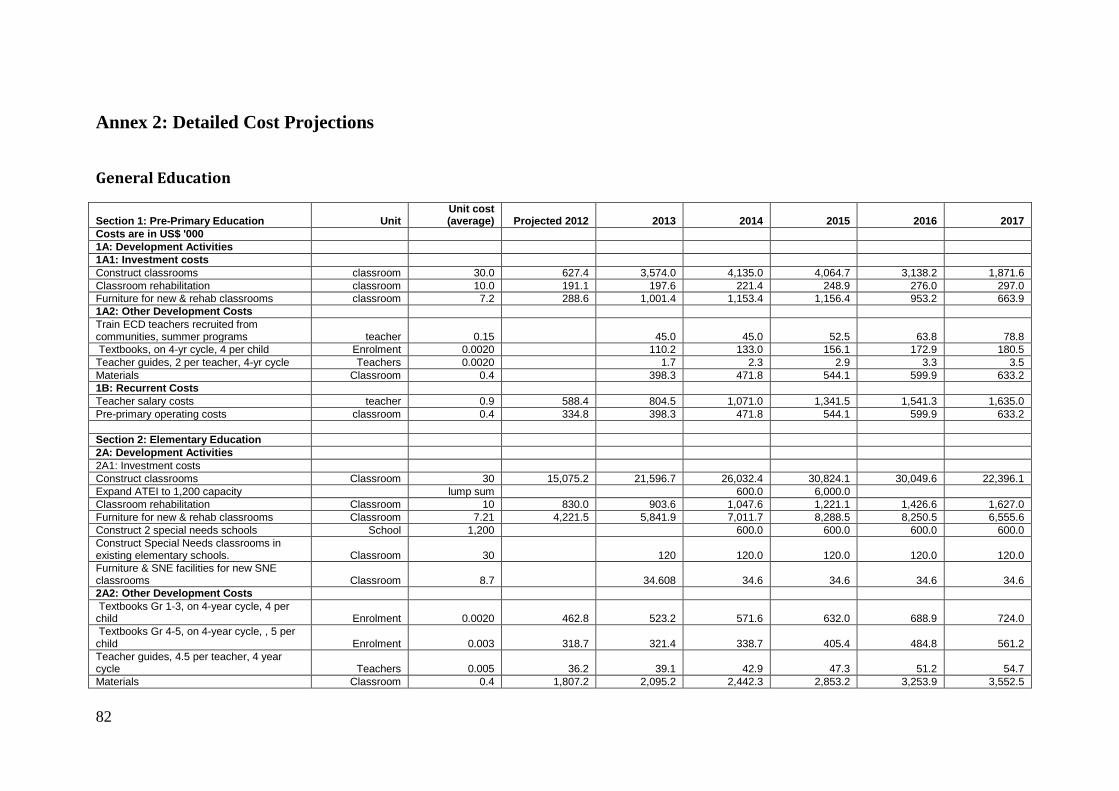
82
Annex 2: Detailed Cost Projections
General Education
Section 1: Pre-Primary Education Unit Unit cost (average) Projected 2012 2013 2014 2015 2016 2017
Costs are in US$ '000
1A: Development Activities
1A1: Investment costs
Construct classrooms classroom 30.0 627.4 3,574.0 4,135.0 4,064.7 3,138.2 1,871.6
Classroom rehabilitation classroom 10.0 191.1 197.6 221.4 248.9 276.0 297.0
Furniture for new & rehab classrooms classroom 7.2 288.6 1,001.4 1,153.4 1,156.4 953.2 663.9
1A2: Other Development Costs
Train ECD teachers recruited from communities, summer programs teacher 0.15 45.0 45.0 52.5 63.8 78.8
Textbooks, on 4-yr cycle, 4 per child Enrolment 0.0020 110.2 133.0 156.1 172.9 180.5
Teacher guides, 2 per teacher, 4-yr cycle Teachers 0.0020 1.7 2.3 2.9 3.3 3.5
Materials Classroom 0.4 398.3 471.8 544.1 599.9 633.2
1B: Recurrent Costs
Teacher salary costs teacher 0.9 588.4 804.5 1,071.0 1,341.5 1,541.3 1,635.0
Pre-primary operating costs classroom 0.4 334.8 398.3 471.8 544.1 599.9 633.2
Section 2: Elementary Education
2A: Development Activities
2A1: Investment costs
Construct classrooms Classroom 30 15,075.2 21,596.7 26,032.4 30,824.1 30,049.6 22,396.1
Expand ATEI to 1,200 capacity lump sum 600.0 6,000.0
Classroom rehabilitation Classroom 10 830.0 903.6 1,047.6 1,221.1 1,426.6 1,627.0
Furniture for new & rehab classrooms Classroom 7.21 4,221.5 5,841.9 7,011.7 8,288.5 8,250.5 6,555.6
Construct 2 special needs schools School 1,200 600.0 600.0 600.0 600.0
Construct Special Needs classrooms in existing elementary schools. Classroom 30 120 120.0 120.0 120.0 120.0
Furniture & SNE facilities for new SNE classrooms Classroom 8.7 34.608 34.6 34.6 34.6 34.6
2A2: Other Development Costs
Textbooks Gr 1-3, on 4-year cycle, 4 per child Enrolment 0.0020 462.8 523.2 571.6 632.0 688.9 724.0
Textbooks Gr 4-5, on 4-year cycle, , 5 per child Enrolment 0.003 318.7 321.4 338.7 405.4 484.8 561.2
Teacher guides, 4.5 per teacher, 4 year cycle Teachers 0.005 36.2 39.1 42.9 47.3 51.2 54.7
Materials Classroom 0.4 1,807.2 2,095.2 2,442.3 2,853.2 3,253.9 3,552.5

83
Train Nomad School teachers recruited from communities Teacher 0.3 60.0 150.0 210.0 186.0 132.0
2B: Recurrent Costs
Teacher salary costs teacher per year 0.9 7,514.7 8,118.8 8,888.5 9,816.9 10,628.0 11,354.7
Elementary education operating costs classroom 0.6 2,829.5 3,280.3 3,823.8 4,467.2 5,094.5 5,562.1
Pre-service teacher training (ATEI recurrent costs) student years 1.5 1,056.0 1,057.5 1,207.5 1,425.0 1,500.0 1,725.0
Consolidate teaching practice in ATEI teacher training 25.0 15.0 15.0 20.0 15.0
Section 3: Middle School
3A: Development Activities
3A1: Investment costs
Construct classrooms classroom 32.0 5,824.0 1,347.8 1,347.8 2,429.1 6,454.0 8,611.0
Classroom rehabilitation classroom 10.0 283.0 319.4 327.8 336.2 351.4 391.8
Furniture for new & rehab classrooms Classroom 7.2 1,516.3 534.0 540.0 789.7 1,707.6 2,222.6
Science kits school 1.0 50.0 80.0 80.0 80.0 80.0
Other Development
Textbooks on 4-yr cycle, 5 per child Enrolment 0.0031 524.8 509.9 499.2 501.8 554.5 634.2
Teacher guides, 5 per teacher, 4 yr cycle Teachers 0.0050 19.3 18.6 18.1 18.0 19.7 22.3
Materials Classroom 0.6 958.2 983.5 1,008.7 1,054.3 1,175.3 1,336.8
3b: Recurrent Costs
Teacher salary costs teacher 1.0 3,768.7 3,632.4 3,525.4 3,511.5 3,843.9 4,352.1
Middle education operating costs classroom 0.6 920.7 945.0 969.3 1,013.1 1,129.3 1,284.5
Pre-service teacher training student per year 1.5 81.0 82.5 232.5 300.0 525.0 825.0
Section 4: Secondary
Costs are in US$ '000 Unit Unit cost
(average) 2013 2014 2015 2016 2017
4 A: Investment costs
Construct classrooms classroom 40 800.0 9,287.1 10,431.8 8,852.3 11,205.6 8,281.9
Classroom rehabilitation classroom 10 187.0 187.0 233.4 285.6 329.9 385.9
Furniture for new & rehab classrooms classroom 7.21 279.0 1,808.8 2,048.6 1,801.5 2,965.6 1,771.0
Other Development
Textbooks on 4-yr cycle, 6 per child, $3 per book Enrolment 0.0045 426.4 498.5 566.7 608.9 662.7 680.6
Teacher guides, 5 per teacher, 4 yr cycle, $5 per book Teachers 0.0063 15.0 17.0 18.7 19.3 19.2 20.8
Materials Classroom 1.00 935.0 1,167.2 1,428.0 1,649.3 1,929.4 2,136.5
4B: Recurrent Costs
Teacher salary costs (domestic) teacher 0.97 2,179.4 2,489.2 2,746.5 2,839.4 2,832.7 3,075.6
Expatriate teacher salary etc. teacher 18.8 2,889.0 2,890.0 2,300.0 2,350.0 3,262.0 2,890.0
Secondary education operating costs classroom 2.1 2,004.5 2,502.2 3,061.3 3,535.7 4,136.3 4,580.2
Operating costs of Grade 12 College Gr 12 student 0.3 5,930.8 6,067.9 7,978.7 6,653.0 9,637.0 10,794.5
Pre-service teacher training student years 1.5 600.0 750.0 900.0 1,050.0 1,050.0

84
Unit Unit cost (average) Projected 2012 2013 2014 2015 2016 2017
Section 5: All Levels - Activities relating to more than one level
5 A: Investment costs
Construct & equip boarding schools for the Bidawiyet communities
School Lump Sum 350.0 1,000.0
Rehabilitation boarding schools Lump Sum 600.0 600.0
Construct 2 girls hostels Lump Sum 1,200.0 1,200.0
Expand Keren School for the Deaf - classrooms & dormitories
Lump Sum 80.0 100.0
Construct 2 special needs hostels Lump Sum 1,200.0 1,200.0
Construction of teachers' residential quarters Summary total 10,000 10,000 10,000 10,000 10,000
Information and Communications Technology (includes supply of systems & ICT-related training)
Summary total 2,552.8 2,462.2 2,774.2 2,762.2 3,660.9
Awareness-raising & Sensitization Summary total 1,385.0 1,650.0 1,520.0 965.0 645.0
Consolidation of Arabic language teaching Summary total 533.3 534.3 552.3 529.3 516.3
Curriculum Planning and Development for General Education. Note - printing & supply of books is also included in sub-sector costs
Summary total 2,070.6 1,719.6 1,174.9 692.6 370.3
Workshops, seminars, in-service training sessions for teachers, school directors
Summary total 809.0 808.5 851.5 748.0 805.5
Teacher Training Programs & Activities - teacher up-grading & other in-Service CPD Programs.
Summary total 6,977.0 7,093.5 6,916.0 4,733.5 4,041.0
Train Special Needs teachers (qualified teachers receiving SNE training)
trainee 0.50 12.5 12.5 12.5 12.5 12.5
School support: including development &/or supply of reference books, equipment, teaching-learning materials; school health program; school guidance & support. With training
Summary total 1,502.5 1,640.5 1,464.0 655.2 1,515.6
Produce and supply educational audio & video materials
Summary total 60.0 120.0 200.0 250.0 300.0
5B: Recurrent Costs
Boarding School - salaries MoE data 167.5 172.6 177.7 183.1 188.6
Boarding School - running costs MoE data 3,867.5 3,983.5 4,103.0 4,226.1 4,352.9

85
SUMMARY COSTS GENERAL EDUCATION
2013 2014 2015 2016 2017
1. Pre-primary
Investment Costs 5,328.3 6,161.9 6,225.6 5,207.3 3,728.5
Recurrent Costs, of which: 1,202.8 1,542.9 1,885.6 2,141.2 2,268.2
Salaries 804.5 1,071.0 1,341.5 1,541.3 1,635.0
Other recurrent 398.3 471.8 544.1 599.9 633.2
Total Pre-primary 6,531.1 7,704.8 8,111.2 7,348.6 5,996.7
2. Elementary
Investment Costs 31,535.6 38,991.7 51,236.3 45,146.2 36,357.6
Recurrent Costs, of which: 12,481.7 13,934.7 15,724.1 17,242.5 18,656.7
Salaries 8,118.8 8,888.5 9,816.9 10,628.0 11,354.7
Other recurrent 4,362.8 5,046.3 5,907.2 6,614.5 7,302.1
Total Elementary 44,017.2 52,926.4 66,960.4 62,388.7 55,014.4
3. Middle School
Investment Costs 3,763.3 3,821.7 5,209.1 10,342.5 13,298.6
Recurrent Costs, of which: 4,659.9 4,727.2 4,824.6 5,498.2 6,461.6
Salaries 3,632.4 3,525.4 3,511.5 3,843.9 4,352.1
Other recurrent 1,027.5 1,201.8 1,313.1 1,654.3 2,109.5
Total Middle School 8,423.1 8,549.0 10,033.7 15,840.7 19,760.2
4. Secondary
Investment Costs 12,965.6 14,727.3 13,216.9 17,112.5 13,276.7
Recurrent Costs, of which: 14,549.2 16,836.5 16,278.1 20,918.1 22,390.3
Salaries (domestic) 2,489.2 2,746.5 2,839.4 2,832.7 3,075.6
Salaries (expatriate) 2,890.0 2,300.0 2,350.0 3,262.0 2,890.0
Other recurrent 9,170.1 11,790.0 11,088.8 14,823.4 16,424.7
Total Secondary 27,514.8 31,563.7 29,495.0 38,030.6 35,667.0
5. Activities Relating to All Levels General Education
Investment Costs 27,702.6 27,671.1 28,365.4 22,548.3 21,867.1
Recurrent Costs, of which: 4,035.0 4,156.1 4,280.7 4,409.2 4,541.4

86
Salaries 167.5 172.6 177.7 183.1 188.6
Other recurrent 3,867.5 3,983.5 4,103.0 4,226.1 4,352.9
Total Activities Relating to All Levels General Education
31,737.6 31,827.2 32,646.2 26,957.5 26,408.5
All General Education
Investment Costs 81,295.3 91,373.7 104,253.3 100,356.8 88,528.5
Recurrent Costs, of which: 36,928.6 41,197.4 42,993.2 50,209.1 54,318.2
Salaries (total) 18,102.4 18,704.0 20,037.1 22,290.9 23,495.9
(Salaries domestic) 15,212.4 16,404.0 17,687.1 19,028.9 20,605.9
(Salaries expatriate) 2,890.0 2,300.0 2,350.0 3,262.0 2,890.0
Other recurrent 18,826.2 22,493.4 22,956.1 27,918.2 30,822.2
Total General Education 118,223.9 132,571.1 147,246.5 150,566.0 142,846.6

87
TVET
Section 1: Number of Teachers, Students 2012 2013 2014 2015 2016 2017
Enrolment
Technical Schools (certificate) 1,992 2,092 2,301 2,531 2,784 3,062
NACVOT 2,648 2,780 3,058 3,364 3,701 4,071
New technical schools 540 1080
Skills Development Centres 360 360 360
Total enrolment 4,640 4,872 5,359 6,255 7,385 8,573
Teachers
All teachers 424 436 460 505 561 621
Expat teachers 10 10 10 10 10 10
Domestic teachers 414 426 450 495 551 611
Administrative & other staff 165 173 191 222 263 305
Section 2: Costs Unit Unit cost (average) Projected 2012 2013 2014 2015 2016 2017
Investment costs
NACVOT development (ADB finance) to be entered
Upgrading Existing TVET schools Summary total 3,500.0 5,500.0 3,500.0 1,500.0
Construct new Skills Development centers Summary total 500.0 1,500.0 1,000.0
Construct 3 new technical schools Summary total 5,000.0 5,000.0 5,000.0 0
Equipping existing TVET schools Summary total 7,000.0
Equipping New TVET Schools Summary total 78.0 7,400.0 1,700.0
Equipping New SDCs Summary total 3,000.0
Materials, supplies existing TVET schools Summary total 3,500.0 4,000.0 4,000.0 4,000.0 4,500.0
Books for TVET Schools & Centres
Materials, supplies new TVET schools Summary total 3,000.0 3,500.0 4,500.0 4,500.0 4,500.0
Materials, supplies new SDCs Summary total 2,200.0 2,150.0 2,650.0 2,620.0 2,700.0
Curriculum & textbook development for TVET Summary total 5.0 500.0 650.0 310.0 50.0
Recurrent Costs
Expat teachers 18.8 188.0 188.0 188.0 188.0 188.0 188.0
Domestic teachers 2.50 1,035.0 1,064.0 1,124.9 1,236.9 1,378.1 1,526.6
Administrative personnel 1.50 247.5 259.9 285.9 333.7 393.9 457.3
Train teachers 2 year course (none in 2013) student 2.3 - 446.5 386.9 379.5 358.8
Training directors, teacher CPD - 84.0 84.0 58.0 -
Running cost enrolment 0.8 3,500 3,675.0 4,042.5 4,718.3 5,570.3 6,466.8

88
ADULT LITERACY & COMPLEMENTARY EDUCATION FOR OUT OF SCHOOL CHILDREN
Adult Literacy & Complementary Education Unit
Unit cost (average)
2012 2013 2014 2015 2016 2017
Section 1: Numbers of Centres, Students
Adult Literacy centres, number
1,111
1,111
1,222
1,333
1,444
1,556
Participants enrolled 49,999 50,000 55,000 60,000 65,000 70,000
Rural Reading Rooms - total number
90
120
150
180
210
240
Current enrolment in CEE
11,000
13,000
18,000
25,000
30,000
30,000
Sections (30 students) 367 433 600 833 1,000 1,000
Centres needed 90 130 180 250 300 300
Section 2: Costs $'000
Investment Costs
Annual increase in Adult Literacy centres Centres 16.0
1,776.0
1,777.8
1,777.8
1,777.8
1,777.8
Annual increase in reading rooms - including furniture, equipment Reading rooms 16.0
480.0
480.0
480.0
480.0
480.0
Annual increase in CEE centres Centres 30.0
1,200.0
1,500.0
2,100.0
1,500.0
-
Mobile libraries Vehicle 200.0 500.0 600.0 1,150.0
Materials (note: average cost covers books, stationery, etc.) Materials per participant 0.01
500.0
550.0
600.0
650.0
700.0
Teachers' guides 2 per facilitator per year 0.003
17.7
19.5
21.3
23.1
24.8
Training facilitators Trainee 0.05 147.8 162.6 177.3 192.1 206.9
Mass Literacy Campaign Summary total
3,280.0
1,500.0
1,425.0
475.0
180.0
Reading Room Materials & books Per room 0.1
12.0
15.0
18.0
21.0
24.0
Train library attendants Staff 0.15 5.2 5.4 5.6 5.9 6.1
CEE Books, 4-yr cycle, 5 per child Students 0.0025
32.5
45.0
62.5
75.0
75.0
CEE Teacher guides, 4-yr cycle, 5 per teacher Teacher 0.0038
1.6
2.3
3.1
3.8
3.8
CEE Materials Centre 0.3 39.0 54.0 75.0 90.0 90.0
Train CEE teachers, 3 summer sessions, 5% attrition Teacher 0.15
39.0
54.0
75.0
90.0
90.0
Enhance & expand continuing education programs Summary total
225.0
430.0
485.0
620.0
820.0
Support other adult education providers Summary total
290.0
395.0
500.0
555.0
660.0
Zoba study of villages - "illiteracy-free" Summary total

89
60.0 60.0 60.0 60.0 60.0
National literacy survey Summary total
2,000.0
500.0
Workshops and general orientation Summary total
30.0
30.0
30.0
30.0
30.0
Develop Curriculum preparation of books, guides supplementary readers for literacy, CEE Summary total
147.0
246.0
200.0
283.0
305.0
Literacy sensitization programs Summary total
2,135.0
2,000.0
1,620.0
965.0
645.0
Recurrent Costs
Adult Literacy:
Facilitators, salary cost 1.1 3,251.1 3,576.2 3,901.3 4,226.4 4,551.6
Reading Room Staff salary cost Attendant 1.1 132.0
165.0
198.0
231.0
264.0
CEE Teachers, salaries, 1.2 teachers per section Teacher 0.9 468.0
648.0
900.0
1,080.0
1,080.0

90
ADMINISTRATION & CAPACITY DEVELOPMENT
Unit
Unit cost (average)
2012 2013 2014 2015 2016 2017
A: Investment costs
Building, rehabilitation, re-equipping of printing workshops, stores, offices & other facilities of MoE Summary Total
4,672.4
3,940.2
3,450.6
2,178.1
2,182.1
Equipment & furniture for MoE Summary Total
2,012.0
2,012.0
EMIS: Establish a fully functional Educational Management Information System Summary total
1,752.0
1,252.3
1,396.6
1,251.7
1,248.4
Procure motorbikes and bicycles for monitoring and supervision Summary Total 212.0 256.7 268.4 165.0 180.0
B: Recurrent Costs
Administration and Finance - Salary
1,455.2
1,519.7
1,598.6
1,687.3
1,790.7
1,869.7
Administration and Finance - Running Costs
2,514.4
2,614.3
2,760.3
2,989.9
3,247.3
3,234.0
Professional upgrading of MOE staff Summary total
3,464.0
3,996.0
4,171.0
4,280.0
4,940.0
Promote effective educational management & quality education through research; enhance school-based research
Summary total 672.3 594.7
1,047.6 329.8 934.6
Enhance and develop the documentation capacity of MOE Summary total 574.4 18.9 17.5 18.9 17.5
Enhance MoE institutional & management capacity: surveys, guidelines, training & workshops, printing & distributing documents
Summary total
1,052.0 783.8
1,006.2 593.3 199.8
Study tours to acquire best practices Summary total 120.0 210.0 120.0 60.0 30.0
Monitoring & Evaluation - costs of recurrent activities Summary total 183.0 183.0 183.0 183.0 183.0
Note: Administration and Finance salary & system running costs are taken from Ministry of Education 2012 expenditure data, increased at a rate equivalent to half the increase in total general education
enrolment

91
Annex 3: Enrolment Projections (2013-2017)
PROGRAMME PROJECTION FOR PRE-PRIMARY EDUCATION (2011-2017) Note - Data includes non-government, about 50% of teachers
Assume expansion will mostly occur in Government schools
2009/10 2010/11 2011/12
Base Yr
2012/13 2013/14 2014/15 2015/16 2016/17
Population 5-6 133,259 133,756 145,775 166,261 190,796 213,339 225,770 225,627
Gross Enrolment 40,506 46,108 45,824 55,112 66,513 78,026 86,440 90,251
Net Enrolment 27,163 31,084 28,579 36,045 45,333 55,127 63,035 67,688
GER 30.4 34.5 31.4 33.1 34.9 36.6 38.3 40.0
NER 20.4 23.2 19.6 21.7 23.8 25.8 27.9 30.0
Classroom Parameters:
Pupil/Section 45.0 40.6 40.5 40.4 40.3 40.2 40.1 40.0
Sections Required 986 1136 1132 1364 1650 1941 2156 2256
Number of classrooms 1274 1317 1476 1660 1840 1980 2063
Classrooms with double shift 350 315 309 302 296 290 284
Required classrooms expansion -2 125 149 146 104 48
Required double shift classroom reduction
Classroom to be replaced (239) 30 34 35 35 35 35
Required classrooms construction 28 159 184 181 139 83
Classroom rehabilitation (2%) 25 26 30 33 37 40
Teacher Parameters:
Teachers/Section 0.95 1.00 1.00 1.00 1.00 1.00 1.00
P/T 38 40 40 40 40 40 40
Teachers required (with year start GER) 1201 1132 1364 1650 1941 2156 2256
Increment Demand 0 232 286 291 215 101
Stock (5% attrition) 1201 1141 1226 1308 1337 1365 1392
ATEI 150 150 100 100 100 100
Higher Education Institutes
Direct recruitment
Total teacher workforce 1201 1291 1376 1408 1437 1465 1492
Gap 159 12 -243 -504 -690 -764
New required teachers 0 138 343 604 790 864

92
PROGRAMME PROJECTION FOR ELEMENTARY EDUCATION (2011-2017) Includes nomad education and special needs
2009/10 2010/11 2011/12
Base year
2012/13 2013/14 2014/15 2015/16 2016/17
Population aged 7 69,641 65,141 65,054 71,049 80,921 92,522 103,156 97,851
Gross Admission 59,097 87,235 88,126 94,902 106,556 120,081 131,929 123,292
Net Admission 23,627 33,135 32,787 44,619 60,853 81,049 103,156 97,851
GAR 84.9 133.9 135.5 133.6 131.7 129.8 127.9 126.0
NAR 40.0 38.0 50.4 62.8 75.2 87.6 100.0 100.0
Grade 1 69,624 87,235 89,836 104,784 106,556 120,081 131,929 123,292
Grade 2 58,787 66,971 79,482 83,998 98,322 100,873 114,677 127,092
Grade 3 51,955 55,552 62,092 72,800 80,918 95,045 97,847 111,619
Grade 4 52,813 52,177 54,376 58,216 75,661 85,030 99,421 103,192
Grade 5 52,842 49,802 48,459 50,155 54,062 70,114 80,160 94,427
Gross Enrolment 286,021 311,737 334,245 369,954 415,520 471,144 524,035 559,623
Net Enrolment 214,592 237,801 246,582 264,487 297,491 352,188 428,269 399,435
Pop 7-11 389,401 358,801 337,784 331,645 343,920 377,681 428,269 399,435
GER 73.5 80.1 93.2 109.5 125.3 137.0 138.8 130.7
NER 55.1 66.3 73.0 79.8 86.5 93.3 100.0 100.0
Classroom Parameters:
Pupil/Section 44.0 46.1 46.1 46.1 46.1 46.0 46.0 46.0
Sections Required 6,504 6,763 7,245 8,029 9,021 10,233 11,387 12,166
Number of classrooms 4,150 4,518 5,238 6,106 7,133 8,135 8,881
Classrooms with double shift 2,150 2,100 2,304 2,574 2,913 3,234 3,436
% clerk DS 52% 46% 44% 42% 41% 40% 39%
Required classroom expansion 318 535 678 827 788 532
Required double shift classroom reduction 50 45 45 45 45 45
Classroom to be replaced (744) 135 140 145 155 169 170
Required classrooms construction 503 720 868 1027 1002 747
Classroom rehabilitation (2%) 2% 83 90 105 122 143 163
Teacher Parameters:
Teachers/Section 1.16 1.14 1.11 1.08 1.06 1.03 1.00 1.00
P/T 38 40 42 43 44 45 46 46
Teachers required with year start GER 7,535 7,704 8,051 8,699 9,523 10,518 11,387 12,166
Increment Demand 347 647 825 995 869 779
Attrition @ 5% from previous year 385 403 435 476 526 569
Total demand for new teachers 733 1,050 1,260 1,471 1,395 1,348
Stock (5% attrition) 7,536 7,704 7,319 7,594 8,278 8,935 9,880 10,721
ATEI certificate teachers 500 500 250 50 0 0
ATEI diploma teachers 0 0 0 345 345 395
Higher Education Institutes 175 550 807 950 940 820
Upgrading to Diploma -50 -50 -50 -50 -50

93
Teachers returning from upgrading 50 50 50
Teachers recruited from communities (nomad
schools)
120 120 120 120 120
Total teacher workforce 7,704 7,994 8,714 9,405 10,400 11,285 12,056
Gap 733 1105 1245 1583 1507
New required teachers compared previous year 15 -118 -118 -102 -110
Asmara Teacher Education Institute Enrolment and Output: Projection by Ministry of Education Human Resources Department
2011/12 2012/13 2013/14 2014/15 2015/16 2016/17
Enrolled Certificate students 650 650 350 150 100 100
Enrolled Diploma first year 55 400 400 500 550
Enrolled Diploma second year 55 400 400 500
Output Certificate students 650 650 350 150 100 100
Output Diploma students 55 400 400 450
Certificate students to Elementary 500 500 250 50 0 0
Certificate students to PPE 150 150 100 100 100 100
Diploma students to Middle 55 55 55 55
Diploma students to Elementary 0 345 345 395

94
PROGRAMME PROJECTION FOR MIDDLE SCHOOL EDUCATION (2011-2017)
2009/10 2010/11 2011/12
Base year
2012/13 2013/14 2014/15 2015/16 2016/17
Transition Rate 85.7% 86.9% 89.3% 89.0% 89.3% 89.7% 90.0% 90.3%
Previous year Grade 5 Enrolment 60,705 52,842 49,802 48,459 50,155 54,062 70,114 80,160
New Admission both sexes 52,024 45,920 44,473 43,129 44,806 48,475 63,103 72,411
Grade 6 57,013 55,483 53,284 50,055 50,812 54,065 68,509 78,577
Grade 7 49,084 49,410 48,850 47,601 45,283 46,191 49,498 62,801
Grade 8 45,605 49,634 65,794 65,527 63,652 60,307 59,433 61,552
Gross Enrolment 151,702 154,527 167,928 163,184 159,747 160,563 177,440 202,931
Net Enrolment 91,194 96,262 95,439 93,723 90,417 94,567 91,481 95,327
Pop 12-14 245,960 250,784 249,422 239,110 223,516 205,734 190,654 190,654
GER 60.5 62.0 70.2 73.0 77.6 78.0 93.1 106.4
NER 36.4 38.6 39.9 41.9 43.9 46.0 48.0 50.0
Classroom Parameters:
Pupil/Section 57 56 54 53 52 51 50
Sections Required 2,715 2,718 3,019 2,994 2,993 3,073 3,471 4,059
Number of classrooms 1,415 1,597 1,639 1,681 1,757 1,959 2,228
Classrooms with double shift 850 856 839 822 805 788 770
Required classrooms expansion 182 0 0 29 145 212
Actual/Required D/S classroom
reduction -6 17 17 17 17 17
Classroom to be replaced 25 25 30 40 40
Required classrooms
construction 182 42 42 76 202 269
Classroom rehabilitation (2%) 28 32 33 34 35 39
Teacher Parameters:
Teachers/Section 1.36 1.28 1.24 1.21 1.17 1.14 1.10
Pupil/Teacher 41.7 43.4 43.8 44.2 44.6 45.0 45.5
Teachers required 3680 3707 3866 3726 3616 3602 3943 4464
Increment Demand -140 -110 -14 341 521
Stock (5% attrition) 3680 3707 3522 3346 3539 3434 3423 3746
ATEI Output Diploma Teachers 55 100 100 100
Higher Education Institutes 430 70 70 420 610
Middle school upgrading
program -50 -50 -50 -50 -50
Teachers returning from
upgrading programs 50 50 50
Total teacher workforce 3680 3707 3522 3726 3614 3604 3943 4456
Gap -1 -2 1 0 -8
New required teachers 344 381 77 169 520 718

95
PROGRAMME PROJECTION FOR SECONDARY EDUCATION (2011-2017)
2009/10 2010/11 2011/12
Base
Yr
2012/13 2013/14 2014/15 2015/16 2016/17
Transition Rate 76.2% 83.6% 38.0% 58.0% 60.0% 62.0% 64.0% 66.0%
Previous year Grade 8 Enrolment 45,640 45,605 49,634 65,794 65,527 63,652 60,307 59,433
Total New Admission 34,764 38,126 18,836 38,161 39,316 39,464 38,597 39,226
Grade 9 33,996
36,235
26,907
41,389
44,007
44,158
43,012
43,240
Grade 10 25,357 26,870 31,434 25,567 36,837 40,455 41,138 40,400
Grade 11 20,955 19,504 19,736 25,856 21,482 31,004 34,603 35,660
Grade 12 14,768 17,384 17,554 17,960 23,615 19,692 28,524 31,950
Gross Enrolment 95,076 99,993 94,758 110,772 125,941 135,309 147,277 151,250
Net Enrolment 63,772 72,963 69,812 80,011 90,501 99,683 106,029 121,858
Population aged 15-18 280,048 289,700 300,482 313,034 324,145 329,204 324,845 348,165
GER 33.9 34.5 31.5 35.4 38.9 41.1 45.3 43.4
NER target 22.8 25.2 23.2 25.6 27.9 30.3 32.6 35.0
Classroom Parameters:
Pupil/Section 64.0 64.5 63.3 60.6 58.0 55.3 52.7 50.0
Sections Required 1485 1550 1498 1828 2173 2447 2797 3025
Number of classrooms 935 935 1167 1428 1649 1929 2136
Classrooms with double shift 495 475 466 456 446 446 428
Required classrooms expansion 219 247 207 276 185
Double shift classroom
reduction 20 10 10 10 0 18
Classroom to be replaced (20) 4 4 4 4 4
Required classrooms
construction
20
232
261
221
280
207
Classroom rehabilitation (2%) 19 19 23 29 33 39
Teacher Parameters
Teachers/Section 1.7 1.7 1.6 1.5 1.4 1.3 1.1 1.1
P/T 38 39 39 41 42 44 34 37
Teachers required with year
start GER 2472 2593 2403 2723 2988 3084 3077 3327
Expatriate teachers 300 300 155 155 155 155 155 155
Domestically recruited teachers 2172 2293 2248 2568 2833 2929 2922 3172
Increment Demand - domestic
teachers 320 265 96 -7 251
Supply domestic:
Stock (5% attrition) 2172 2293 2248 2183 2582 2843 2928 2925
Higher Education Institutes 50 585 460 240 150 400
Teachers attending upgrading
programs -50 -50 -50 -50 -50

96
Teachers returning from
upgrading programs 50 50 50
Total domestic teacher workforce 2172 2293 2298 2718 2992 3083 3078 3325
Gap -4 4 -1 2 -3
Supply foreign: 155 155 155 155 155 155
Total domestic/foreign
teacher workforce 2172 2293 2453 2873 3147 3238 3233 3480
New required teachers 300 300 155 539 406 241 148 403
Repetition and Drop-out Targets
REPETITION TARGETS, 2011-17 2009/10 2010/11 2011/12 2012/13 2013/14 2014/15 2015/16 2016/17 2017/18
ELEMENTARY SCHOOL
Grade 1 0.13 0.12 0.11 0.00 0.00 0.00 0.00 0.00 0.00
Grade 2 0.17 0.14 0.13 0.00 0.00 0.00 0.00 0.00 0.00
Grade 3 0.13 0.11 0.11 0.00 0.00 0.00 0.00 0.00 0.00
Grade 4 0.13 0.11 0.10 0.10 0.09 0.09 0.08 0.08 0.07
Grade 5 0.09 0.07 0.07 0.07 0.07 0.07 0.07 0.07 0.07
MIDDLE SCHOOL
Grade 6 0.16 0.14 0.13 0.12 0.11 0.10 0.09 0.08 0.07
Grade 7 0.11 0.09 0.08 0.08 0.07 0.07 0.06 0.06 0.05
Grade 8 0.11 0.54 0.35 0.33 0.32 0.30 0.28 0.27 0.25
SECONDARY SCHOOL
Grade 9 0.22 0.13 0.12 0.11 0.11 0.10 0.09 0.09 0.08
Grade 10 0.12 0.13 0.12 0.11 0.11 0.10 0.09 0.09 0.08
Grade 11 0.03 0.02 0.02 0.02 0.02 0.02 0.02 0.02 0.02
Grade 12 0.00 0.00 0.00 0.00 0.00 0.00 0.00 0.00 0.00
DROP-OUT TARGETS, 2011-17 2009/10 2010/11 2011/12 2012/13 2013/14 2014/15 2015/16 2016/17 2017/18
ELEMENTARY SCHOOL
Grade 1 0.08 0.08 0.07 0.06 0.05 0.05 0.04 0.03 0.02
Grade 2 0.05 0.04 0.04 0.04 0.03 0.03 0.03 0.02 0.02
Grade 3 0.05 0.04 0.04 0.04 0.03 0.03 0.03 0.02 0.02
Grade 4 0.05 0.04 0.04 0.04 0.03 0.03 0.03 0.02 0.02
Grade 5 0.05 0.04 0.04 0.04 0.03 0.03 0.03 0.02 0.02
MIDDLE SCHOOL
Grade 6 0.06 0.06 0.05 0.05 0.04 0.04 0.04 0.03 0.03
Grade 7 0.05 0.05 0.05 0.05 0.04 0.04 0.04 0.03 0.03

97
Grade 8 0.06 0.08 0.07 0.07 0.06 0.06 0.06 0.05 0.05
SECONDARY SCHOOL
Grade 9 0.08 0.08 0.07 0.07 0.06 0.06 0.06 0.05 0.05
Grade 10 0.08 0.07 0.07 0.07 0.06 0.06 0.06 0.05 0.05
Grade 11 0.11 0.08 0.07 0.07 0.06 0.06 0.06 0.05 0.05
Grade 12 0.00 0.00 0.00 0.00 0.00 0.00 0.00 0.00 0.00

98
Annex 4: Logical Framework
Intervention Logic Objectively verifiable indicators Means of verification Assumptions
OVERALL OBJECTIVE: I. IMPROVE ACCESS/EQUITY OF EDUCATION SPECIFIC
OBJECTIVES
1. Construction and
rehabilitation of
classrooms, TVET
schools, Girls’ hostels,
boarding schools,
teachers’ residential
quarters and ATEI
expansion.
- 44,200 new students in 807 new classrooms and 158 rehabilitated and furnished
schools enrolled at pre-primary level by targeting the disadvantage areas.
- Achieve pre-primary gross and net enrolment ratios of 40% and 30% respectively by
2015/16.
- 153,690 new students in 2776 new classrooms and 520 rehabilitated and furnished
schools enrolled by targeting the disadvantage areas.
- Achieve gross and net enrolment ratios of 124% and 100% respectively at elementary
level by 2015/16.
- 215 classrooms converted from double to single shift and reduced double shifts will
increase student time on task
- 34,332 new students in 548 new classrooms and 165 rehabilitated and furnished
schools enrolled at middle level by targeting the disadvantage areas.
- Achieve gross and net enrolment ratios of 99% and 50% respectively by 2015/16.
- 85 classrooms converted from double to single shift and reduced double shifts will
increase student time on task.
- 46,893 new students in 572 new classrooms and 105 rehabilitated and furnished
schools enrolled at secondary level by targeting the disadvantage areas.
- Achieve gross and net enrolment ratios of 45% and 35% respectively by 2015/16.
- 50 classrooms converted from double to single shift and reduced double shifts will
increase student time on task
- At least 20% of teachers’ benefited from the houses by the end of year 5.
- 3 new TVET schools constructed & 6980 students got access to skills training
annually.
- 4 TVET schools upgraded & 3060 students get access to skills training annually.
- Changes in number and occupational distribution of training outputs
- 1800 students got access to skills training annually.
- Engineers’ reports
- Schools actually located
(physical structures) in areas of
maximum need according to the
plan
- Supervision and school records
- Employer satisfaction with
training outputs.
- SDC records and supervision
reports
- Procurement officer reports on
both equipment and materials
- Zoba and School reports
(confirming houses have been
occupied)
- EMIS report
Governments'
commitment to
expand education
and willing to
provide financing
for the
construction fund

99
2. Enhance & expand
the existing adult
literacy and post-
literacy program
- About 450,000 adults and youth got access to basic literacy and as the result adult
illiteracy rate decreased to about 10 % by 2015.
- Adult literacy access ensured to more than 600 new disadvantaged villages until 2015.
- Female participation in adult and out of school literacy program sustained and gender
literacy gap reduced to less than 10 %.
- Dropout rate in adult literacy and out of school children declined to at least about 15%
(from the current about 30%).
- At least 60% of basic literacy participants complete post literacy level (3rd level).
- Access to about 50,000 out of school children (of which about 50% girls) ensured and
more than 30% mainstreamed to formal schools at middle level.
- Quality of adult literacy education enhanced.
- Illiteracy free areas identified and declared.
-Drop outs and absenteeism decreased/controlled
- Supervision report
-Survey reports
- Literacy center documents and
records
- Procurement officer report
- Sustained
Government
commitment.
- Strong co-
operation of
partners.
- organized and
continuous
sensitization.
Sustained.
- Government
commitment.
3. Launch mass
literacy campaign in
selected disadvantaged
areas
- Access increased in rural and urban areas.
- At least 30% of literacy graduates got access to evening classes.
- Gender literacy gap narrowed to less than 10% and urban- rural gap reduced to less
than 15%.
- More than 600 villages benefited from the literacy campaign.
- Relapsing into illiteracy minimized/checked.
Supervision, survey , reports from
the zobas etc
Strengthened
motivation and
readiness of
implementers and
beneficiaries
4. Enhance & expand
continuing education
programs
-Access to evening program enhanced and increased in urban and rural localities.
- 30% of post literacy graduates participated in continuing education.
- Partners awareness and collaboration strengthened.
- Enhanced teachers and learners satisfaction
- Supervision, survey, reports
from the zobas etc.
- Status of enrolment and
retention of learners (from center
documents and records)
- Government and
relevant agencies
committed in
supporting
learners and
implementers.
5. Awareness raising
and sensitizations
- Awareness and understanding about the importance of adult and non-formal education
improved and sustained.
- Partners and beneficiaries participation and contribution increased.
- Stakeholders collaboration and partnership strengthened.
- Communication materials produced and disseminated
- Motivation of learners and teachers increased
- Number of communities sensitized
- Meetings and workshops reports
- Symposium report
- Produced materials for
exhibition and cultural show.
- Prepared promotional materials
- Reports on the competition
Reports of the award provided
- Government
commitment and
strong
collaboration of
stakeholders.

100
6. Consolidation of
Arabic language
teaching
- Number of Produced and distributed textbooks
- Improved Arabic language achievement by learners
- Learning enhanced
- Capacity to develop Arabic language curriculum enhanced
- Number of schools with number of students upgraded to middle and secondary
education
- Students learning achievement developed
- Textbook distribution list
- Training report
-Schools actually upgraded
Government’s
decision to
introduce and
expand Arabic
education
II. Teacher Training & recruitment (Pre-service)
7. Pre-Service
Training Programs
- 4,000 basic education Teachers trained at diploma + certificate levels
- Popular language committees strengthened.
- Effective Implementation of Mother Tongue Education enhanced.
- Awareness of 4,000 basic education teacher trainees’ on
- Gender-Fair Teaching, Life Skills and HIV/AIDS improved.
- Teaching practice of teacher trainees consolidated
- Diploma level curriculum of ATEI developed, printed and in use.
- Adequate Staff (coordinators & supervisors at zoba and sub-zoba levels) recruited and
trained.
- Certificates and Diplomas.
- ATEI records
- Report of the meetings
- Workshop reports
- Teaching practice reports
- Printed study materials
- Recruitment records.
- Report of the orientation
- Government
commitment to
achieve EFA
Goals.
8. Recruitment and
Deployment of
Expatriate Teachers
750 expatriate teachers recruited and deployed
750 expatriate teachers inducted/introduced with the Eritrean Education System.
Recruitment and deployment
reports
Induction reports
Government
commitment to
expand secondary
education

101
OVERALL OBJECTIVE: II. IMPROVE QUALITY OF EDUCATION SPECIFIC
OBJECTIVES:
1. In-service teacher
training
1.1 Upgrading
Training Programs &
Activities (In-Service
CPD Programs)
- 2000 basic education teachers trained to diploma level through ODLP (Batch I)
- 2000 basic education teachers trained to diploma level through ODLP (Batch II)
- 1050 uncertified basic education teachers trained at certificate level
- 500 uncertified basic education teachers trained at certificate level
- Teaching and management capacity of 2,500 teachers, 1,350 directors &
supervisors and 250 adult education facilitators developed through continuing
profession development (CPD)
- 600 nomadic education teachers trained through summer programs.
- Number of children from nomadic areas got the opportunity to education.
- 360 TVET Instructors upgraded by occupational specialization to diploma level at
EIT
- 1500 Adult Education Facilitators completed secondary school level and their
teaching capacity improved.
- MOE policies and strategy on Teacher Education Development finalized and
disseminated
- 11,000 newly appointed basic & secondary School Teachers inducted/introduced
to the school system and activities.
- 150 newly appointed Directors & Supervisors inducted with the school system
and their role and responsibilities.
- Best practices among teachers of all levels shared to enhance teaching and
learning process.
- Best practices among high school students shared to enhance learning.
- Effective School Development Plan in 3 selected schools initiated, implemented
and shared.
- Records of the trainees’
- College diplomas
- Certificates
- Training report
- ATEI Certificates and records
- College records
- Secondary school completion
certificates and trainees records
- Finalized policies and strategy
documents
- Induction reports
- Workshop & Seminar papers
- Evaluation reports
- School Development Plan Interim &
final reports
- Strong
collaboration of
higher
education
institutes and
colleges
-Availability of
evening schools
-Commitment
of MOE’s high
officials
-Commitment
of regional
officers
-Collaboration
of Zobas and
Schools
2. Incentive Schemes
for Teachers and
Supervisors
90 exemplary teachers awarded at a national level - Selection Criteria Format
- Awards Report
Commitment of
regional
officers

102
3. Curriculum Planning and Development
3.1 Preparation ,
Printing and
Familiarization of
Materials for General
Education
- Enhance the capacity of teachers by familiarizing them with the content and
pedagogy of the newly produced materials; Equip learners and teachers with
appropriate teaching learning materials
- Pertinent Policies, Guidelines, Rules, Standards ,Manuals developed and
disseminated.; Schools professionally supported
- Pertinent materials translated into Eritrean languages
- Number of textbooks printed and distributed
- Procurement officer report
- Training reports
- Printed guidelines, policies, standards,
rules, regulations and manuals
- Printed teaching learning materials
Government
commitment to
transform the
education
sector.
3.2 Curriculum
development and
materials preparation
for literacy &
continuing education
programs
- Reliable data on curriculum implementation obtained for action
- Curriculum adapted to enhance earning achievement of students.
- Learning needs identified and training provided
- Capacity of teachers to implement the new curriculum developed
- Teachers and learners supported with teaching learning materials
- Facilitated the records of student assessment
- Curriculum Developed and enhanced student learning
- Textbook developed and enhanced learning
- Syllabus prepared
- Number of textbooks printed
- Reviewed curriculum
- Adapted curriculum
- Assessment report
- Training report
- Printed forms and certificates
Government
commitment to
transform the
education
sector.
4. Teacher Training
and staff development
- Teaching competence of180 VET teachers improved
- Management capacity of 20 VET directors improved
Training report
Ministry’s
commitment to
develop quality
teaching
5. Consolidation of
school support system
- School science laboratories equipped with necessary equipment and chemicals to
undergo hands on experimental works.
- Enhanced teaching learning using multi media audio visual materials.
- Schools equipped with teaching aid materials, reference books and e-learning
materials and enhanced student learning
- Facilitated children’s learning
- School Health Services consolidated
- Guidance and Counseling Services introduced and consolidated at middle and
secondary schools
- Pedagogic Resource Centers (PRC) Strengthened
- Enrolment of girls and other disadvantaged groups enhanced
- Procurement officer report
- Zoba and schools reports on the usage
of the labs
Ministry’s
commitment to
develop quality
of learning and
teaching
process.
6. Information and
Communications
Technology (ICT)
- ICT Labs established in 204 schools
- Solar power installed in 68 rural schools
- 204 directors trained on ICT
Procurement officer report
Training report
Government

103
- 408 Master trainers trained on ICT
- 4080 teachers trained on computer application
- E-Learning tools developed to enhance learning
- Warsay Yikealo & NaCVoT ICT Services consolidated
- Obsolete IT equipment disposed
Implementation report
Monitoring report
commitment to
introduce and
expand ICT in
education.
7. Create literate
environment as part of
the provision of
literacy and
continuing education
programs
- More reading rooms opened to reach at least to a ratio of 1 reading room to 5-10
villages.
- Varied supplementary reading materials produced in mother tongue and English
distributed and used.
- Number of readers/ customers increased annually.
- Mobile libraries introduced and assessed
- Library services expanded and learners participation and achievement enhanced.
- Varied reading materials (in mother tongue & English through community
reading rooms.
- Mobile libraries introduced
- Supplementary reading materials prepared and enhanced student achievement
- Reading rooms equipped as local resources centers
- Reading rooms and mobile libraries
actually opened in regions.
- Procurement officer report.
Government
commitment to
consolidate
literacy and
continuing
education
programs.
8. Provide professional
and material support
to other adult
education providers
- Quality of adult education service improved
- Partners’ collaboration strengthened
- Learning enhanced
- Capacity of adult education implementers enhanced
Supervision and activity report.
Ministry’s
willingness to
expand and
cooperate with
other adult
education
providers.
9. Production of
educational audio
&video materials to
promote learning
Different educational materials prepared and used as inputs for improving qualities
of adult education programs in place.
Activity report
- Ministry’s
initiative to
introduce audio
visual learning
10. Equipping and
materials and supplies
for TVET Schools
- Teaching and learning of skills improved through equipping of existing TVET
schools including Sawa
- Quality of training improved through the provision of practical training
- The quality of on-the-job training centers in the 6 Zobas enhanced
- Quality of training improved through the provision of practical training
- Procurement officer report
- Supervision report.
Government’s
commitment to
improve the
quality of
training

104
OVERALL OBJECTIVE: III. ENHANCE INSTITUTIONAL CAPACITY SPECIFIC
OBJECTIVES:
1. Establish a full-
fledged and functional
Educational
Management
Information System
(EMIS)
1.1 Develop a
comprehensive
Educational
Management
Information System
(EMIS) at all levels.
- EMIS software developed and installed
- Trial test conducted and the review report prepared
- Capacity of 85 staff to use the new software developed
- Knowledge of 60 EMIS users enhanced
- Operational software
- EMIS assessment report produced and disseminated
- Adult education data base and network established(in line with EMIS) Information
shared with stakeholders and ready for use and action
- Improved human management and personal data systems.
- Actual software installed and in
use.
- Training report
- Assessment report
Ministry’s
commitment to
improve data
collection process
and analysis.
1.2 Develop the
capacity of EMIS
personnel
- The capacity of 1750 school directors, supervisors, sub-zoba education heads and zoba
EMIS staff on data collection and analysis improved.
- Data base management capacity of 40 MOE and zoba staff developed.
- The analysis capacity of 40 MOE and zoba staff enhanced through the training of
SPSS.
- The capacity of school resources location of 40 MOE and zoba staff developed
through the training in GIS
- Capacity of 40 MOE and zoba staff in data collection process improved through the
training in CS-Pro software.
Training report
Ministry’s
commitment to
improve data
collection process
and analysis.
1.3 Enhance data
collection and
dissemination capacity
- 150000 Pages of data collection instruments printed and disseminated to schools
annually.
-1500 Basic Education Statistics and 1500 Essential Indicators printed and disseminated
annually and planning and decision making enhanced through information.
-3000 Education Brief printed and disseminated
- 6 zobas and 40 sub-zobas networked/connected with MOE and timely and reliable
data collection improved.
-14 servers and network materials, 71 printers, 74 photocopiers and 40 modems
procured and installed
- 40 solar panels procured and installed in 40 sub-zoba offices
- 1500 schools provided with computers and accessories
- Technical support provided for zoba and sub-zoba EMIS personnel.
- Printed questionnaires
- Educational Abstracts and
Education Brief
- Functional network
- Logistics report
- M&E report
Ministry’s
commitment to
improve data
collection process
and analysis.

105
II. Enhance research-
based planning and
decision making
2. Create an
environment whereby
MOE staff and
teachers engage in
research activities
- Quality of education through research improved by training 775 MOE staff at central
and zoba level on advanced educational research methodology.
- Quality of education through research improved by training 775 MOE staff at central
and zoba level and teachers by training in basic educational research methodology.
Skills of 775 MOE central and zoba staff on educational survey developed.
Training report Ministry’s
commitment to
develop the
research capacity
of its staff.
3. Promote effective
educational
management through
research
3.1 Conduct various
research studies at
national level
- Labour market information system (LMIS) established and working, as evidenced by
number and value of reports produced
- Equipments for TVET schools identified for biding
- Study on Financing of Education conducted and disseminated
- Study on the Role of Private Sector Conducted and disseminated
- Household survey conducted and the findings disseminated
- Study on school management (effective school) in Zoba Maekel conducted, reported
and disseminated.
- Study report
- National Report on education
progress 1991-2012
- Survey report
- Database
- Documents of the policy and
strategy papers
Ministry’s
initiative to
enhance research
practices.
- National Report on the Development of Education in Eritrea prepared and
disseminated
- Five research studies conducted and disseminated.
- Findings disseminated and reports finalized
- Data system for special needs established in schools;
- Weaknesses and strengths of the curriculum/ system are identified and remedial
measures are taken.
- Effective strategies and challenges of LCIP and Co-curricular activities identified.
- Weakness of classroom practice by schools identified
the situation of schools/students learning abilities assessed.
- Students learning achievement assessed through MLA
- Compiled information on children with special educational needs
- Literacy and continuing education practices analyzed and
disseminated
- National literacy rate by age, sex, ethnicity, zoba etc. established and reported, - Adult
education data base developed
- Policy and strategy documents improved and updated

106
4. Enhance school-
based action research
-900 secondary school teachers trained on school-based action research
-18 school-based action research papers produced by teachers and disseminated
- 180 teachers got technical support on action research
- Workshops conducted and the results of teachers research disseminated
- 18 teacher researchers received incentives annually
- Reports of school-based
research
- Monitoring report
- Workshops report
- Report of the incentive awarded
Ministry’s desire
to improve quality
education through
school-based
action research
5. Professional
upgrading of MOE
staff
-Improved administration and management at schools and MOE office
- 130 directors, supervisors and education administrators trained at diploma level
- 260 directors, supervisors and education administrators professionally upgraded
- 500 directors, supervisors and education administrators professionally upgraded
through in-service programs
- 420 teachers, supervisors and education administrators trained through distance
learning at certificate, diploma, Bachelors & Masters Degrees
- 90 uncertified librarians trained at diploma level through summer training
- 90 uncertified laboratory technicians trained at diploma level through summer training
- Capacity of teachers and supervisors enhanced in inclusive teaching practices;
- Capacity of management staff developed
- College reports
- Training report
- Certificates, Diplomas and
Bachelors & Masters Degrees
Collaboration of
higher education
institutes and
colleges
6. Enhance and
develop the
documentation
capacity of MOE
6.1 Consolidate and
expand documentation
capacity of MOE
- The documentation unit equipped with 10 computers and accessories
- Various types of furniture procured
- 1000 books and journals procured
- 30 staff from MOE and zoba trained on documentation
- 6 zoba documentation centers established and equipped with computers and
accessories
- Procurement office reports
- Training report
- Zoba report
The importance
of documentation
for the Ministry’s
overall activities.
7. Enhance
institutional capacity
7.1 Enhance the
management Capacity
of MOE
- 30 PRR printed and disseminated
- Local and International consultants provide technical assistance to expedite the
Ministry’s needs.
- The management capacity of MOE enhanced through the provision of 300 computers,
200 laptops and accessories, 200 photocopiers, 200 printers, … etc.
- The management capacity of MOE enhanced through the provision 150 office tables,
100 cupboards, 100 shelves, 150 chairs and other relevant furniture
- Special schools constructed and furnished with necessary supportive special teaching
- Performance of local Supervisors improved
- Capacity of the national examination system strengthened
- Teachers capacity on LAPG enhanced.
- Enhanced teacher education performance
- Printed CPD documents
- Dissemination report
- Produced guidelines
- Produced courses
- Printed guidelines
- Survey report
- Procurement officer report
- Trainings and
- workshops report
- Engineers’ report
Acknowledgment
of the need to
equip the Ministry
with various legal
procedures and
equipment.

107
8. Study tour to
acquire best practices
- Experience on EMIS gained
- MOE officials conducted educational study tour in selected countries with best teacher
education development, on Open & Distance Learning practices, on curriculum
development, on special needs education, on early childhood education, on multi-grade
teaching, on PTSA, on national examination and assessment systems, on mass literacy
and on TVET experiences shared /gained.
- Institutional linkages developed
- Study tour report;
- Institutional linkage agreement
Selection of
appropriate
countries
9. Building and
Rehabilitation of
offices and other
facilities
9.1 New Buildings and
Renovation of offices
and work shops
- Sufficient store built
- Good working environment created
- Improved and consolidated MOE Office
- New design ready for implementation
- Engineers’ report
- Spot checks to construction sites
- Architects’ reports
Governments’
commitment to
improve working
conditions.
9.2 Rehabilitate
Printing Press and
school materials
production work shop
- Installed new printing offset and metal and wood work machines
- Acquired sufficient raw materials.
- Procurement officer reports Ministry’s
willingness to
enhance the
printing press
9.3. Procurement of
trucks, vehicles and
related supplies
- Acquired smooth transportation facilities for materials and workers.
- Facilitated transportation activities of goods and services. Furnished schools.
- Procurement and logistics
officers report.
- Vehicle delivery notes
- High demand of
the Ministry for
effective delivery
of education
services.
10. Monitoring and
Evaluation
- ECCE services and inclusive learning activities monitored and supported
- Supervisory challenges identified and Performance of supervision evaluated and
strengthened
- Adult education activities regularly monitored and assessed
- Relevant instrument for monitoring and evaluation updated and used
- Timely and accurate data on competencies and learning outcomes collected and
reported
- Progress of adult education programs reported
- Efficiency of assets management enhanced
- Progress and challenges of the education sector Assessed
- Monitoring report
- Supervision report
- M&E report
- Reports on the produced rules,
regulation, directives, guidelines
and manuals
- Data collection instruments
- Evaluation and workshops
report
- The developed test and
examination system
- Assessment report
Monitoring and
evaluation system
in place

108
Annex 5: Current Organizational Structure of the Ministry of Education
The current organizational structure of the MOE is illustrated above. In view of the GOSE’s decision
to transform the whole educational system the MOE has been making a comprehensive review of
the MOE’s organizational structure, the main functions and tasks of its various Departments, as well
as all the positions and job descriptions and will soon be finalized.

109
Moreover, the capacities required to be developed for sector policy, strategy planning, programming
and budgeting; programme implementation, monitoring and evaluation; quality education
monitoring, developing systems and tools have also been identified. In addition, to develop the
capacity of the schools to deliver quality education services and empowering of local communities
for school management, school planning and budgeting has also been envisaged.
Therefore, the human capacities on various professions and competencies at the managerial level
will be strengthened through long-term training both at the under- graduate and post-graduate
levels, through distance learning and face-to-face instruction, or a combination of the two.
Effectively strengthening of the human capacities will be guaranteed to effectively deliver the sector
plan.
Besides, to ensure that the education sector delivers as expected, a whole set of management
systems and tools must be put in place over the long term. However, some of these are more
urgently needed and will affect the success of the plan to a greater extent than others. The most
urgently required management delivery systems that will be consolidated are the establishment of a
comprehensive Educational Management Information System (EMIS).
With regard to financing of education, the Government will increase its expenditures on education in
line with its commitment to EFA and MDG goals and its ability to raise domestic revenues; mobilizing
the community to contribute towards financing educational costs and encouraging the private sector
to invest in the establishment, operation and expansion of school.