

Education, data policy and practice - Kim Schildkamp
30
Education data, policy and practice OECD meeting: Education governance: The role of data Tallinn, 12-13 February Kim Schildkamp, University of Twente, [email protected]
-
Upload
oecd-education -
Category
Education
-
view
428 -
download
1
Transcript of Education, data policy and practice - Kim Schildkamp

Education data, policy and practice
OECD meeting: Education governance: The role of data
Tallinn, 12-13 February
Kim Schildkamp, University of Twente, [email protected]
Content of this presentation
• Data-based decision making
• Definition
• Importance
• Use of data
• Challenges in the use of data at policy level, school level and teacher level
• Support in the use of data
• An example from practice: the datateam® procedure
Data-based decision making (DBDM)
• The use of data, such as assessment results, to improve education (Schildkamp & Kuiper, 2010)
• Systematically
• Analyze and interpret data
• Use this information to improve education
• Quantitative data and qualitative data
• Examples of data: demographic data, classroom observations, student surveys, parent interviews, assessment results
Importance of DBDM
• Gut feeling and instinct not always correct
• Making high quality decisions based on data
• Using data to determine learning needs of students and adapt instruction accordingly
• Check if goals are being reached
• It can lead to increased student achievement (Campbell & Levin, 2009, Carlson, Borman, & Robinson, 2011; McNaughton, Lai, & Hsiao, 2012)
Use of data• Accountability: e.g., document how to school is doing
for the inspectorate, for parents
• School improvement:
• School development: e.g., policy development, teacher development, grouping of students
• Instruction: e.g., set learning goals, differentiate, provide feedback
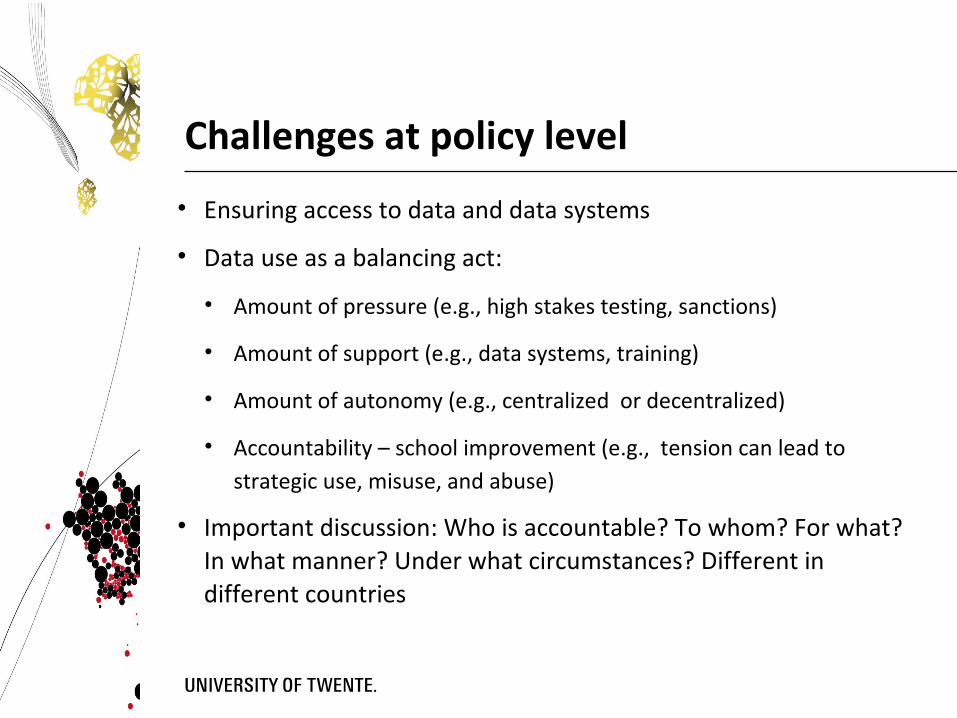
Challenges at policy level
• Ensuring access to data and data systems
• Data use as a balancing act:
• Amount of pressure (e.g., high stakes testing, sanctions)
• Amount of support (e.g., data systems, training)
• Amount of autonomy (e.g., centralized or decentralized)
• Accountability – school improvement (e.g., tension can lead to strategic use, misuse, and abuse)
• Important discussion: Who is accountable? To whom? For what? In what manner? Under what circumstances? Different in different countries
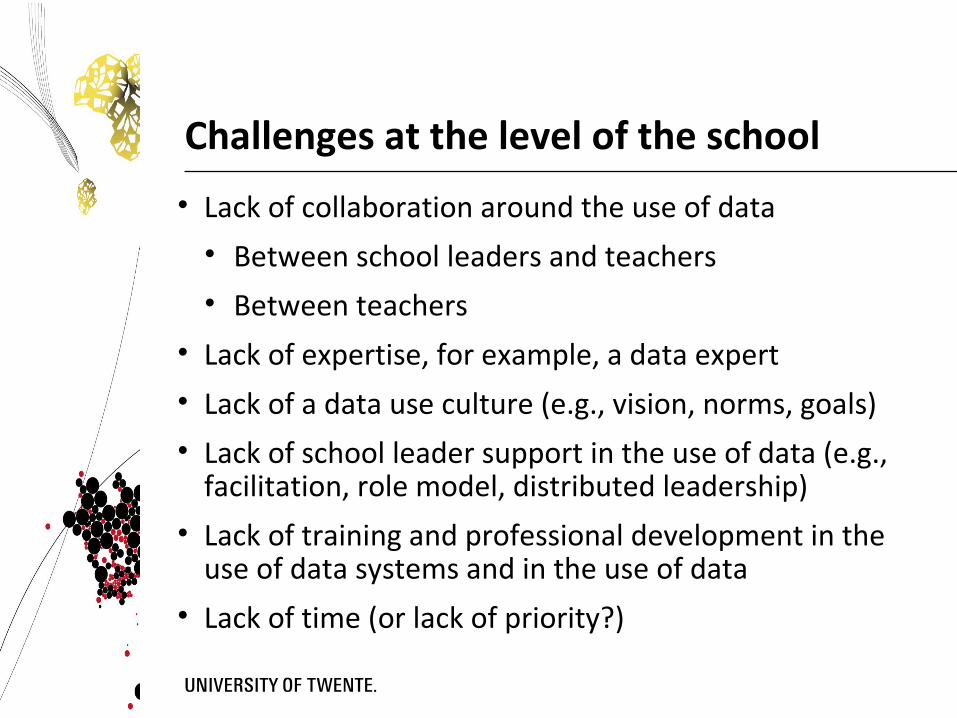
Challenges at the level of the school
• Lack of collaboration around the use of data
• Between school leaders and teachers
• Between teachers
• Lack of expertise, for example, a data expert
• Lack of a data use culture (e.g., vision, norms, goals)
• Lack of school leader support in the use of data (e.g., facilitation, role model, distributed leadership)
• Lack of training and professional development in the use of data systems and in the use of data
• Lack of time (or lack of priority?)
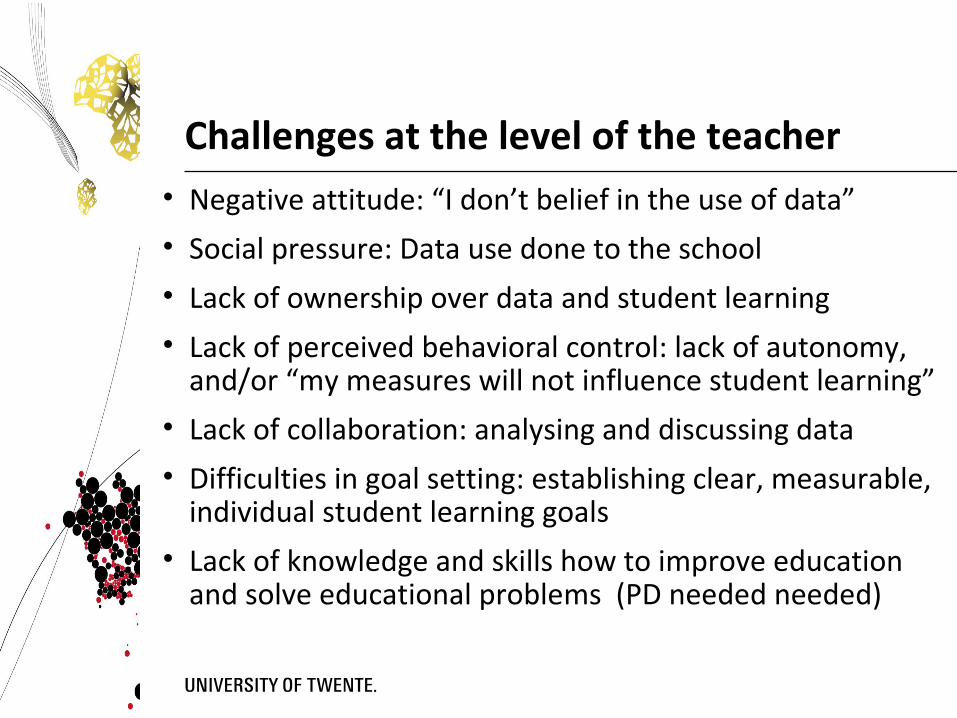
Challenges at the level of the teacher• Negative attitude: “I don’t belief in the use of data”
• Social pressure: Data use done to the school
• Lack of ownership over data and student learning
• Lack of perceived behavioral control: lack of autonomy, and/or “my measures will not influence student learning”
• Lack of collaboration: analysing and discussing data
• Difficulties in goal setting: establishing clear, measurable, individual student learning goals
• Lack of knowledge and skills how to improve education and solve educational problems (PD needed needed)
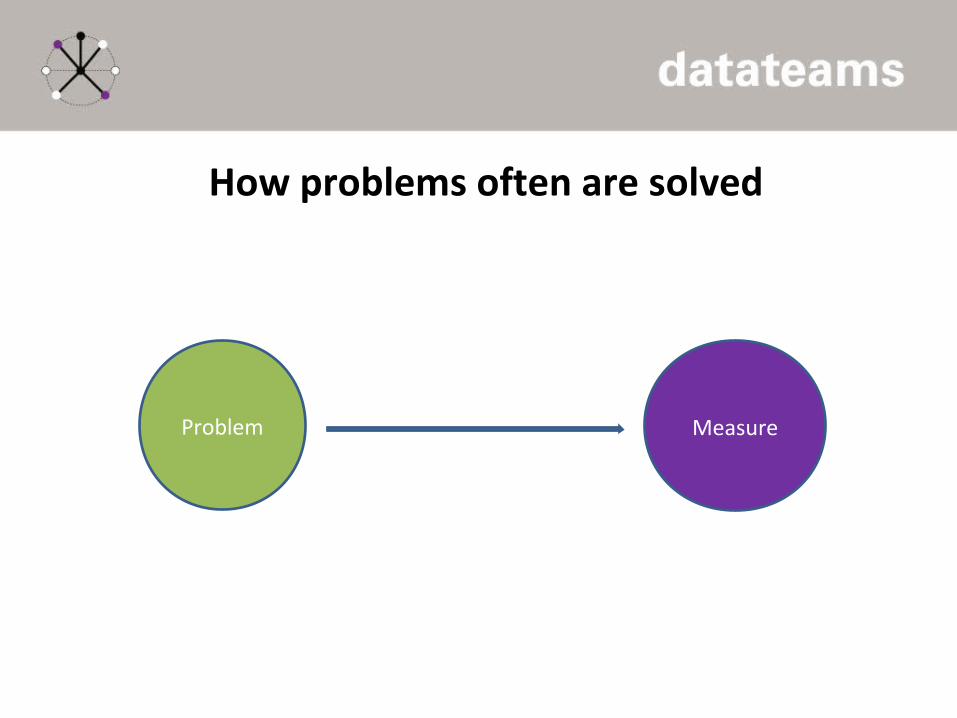
How problems often are solved
Problem Measure
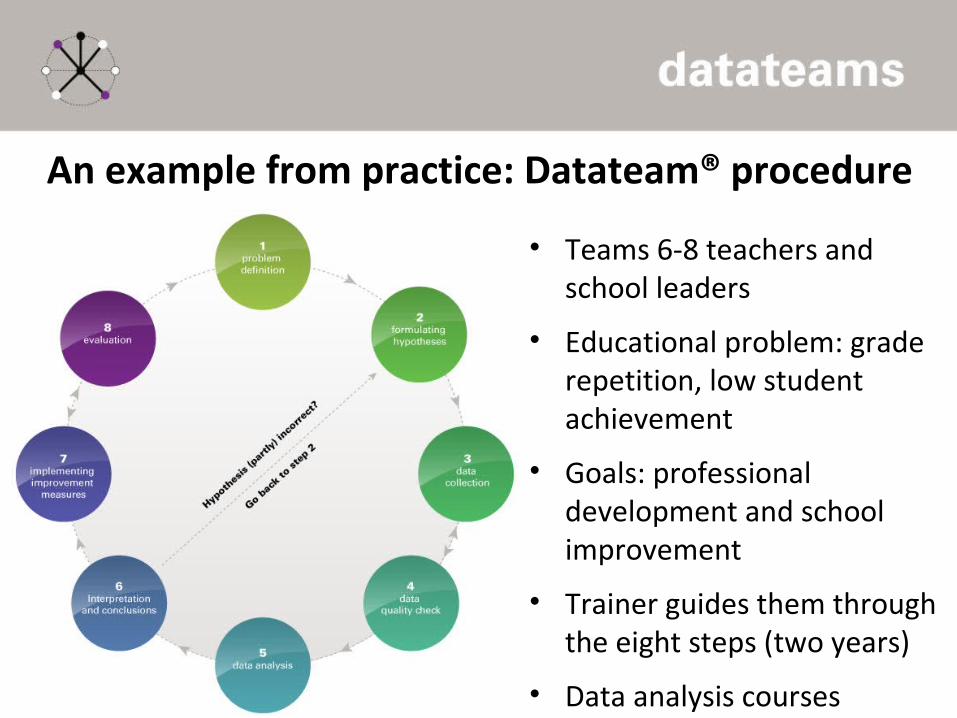
An example from practice: Datateam® procedure
• Teams 6-8 teachers and school leaders
• Educational problem: grade repetition, low student achievement
• Goals: professional development and school improvement
• Trainer guides them through the eight steps (two years)
• Data analysis courses
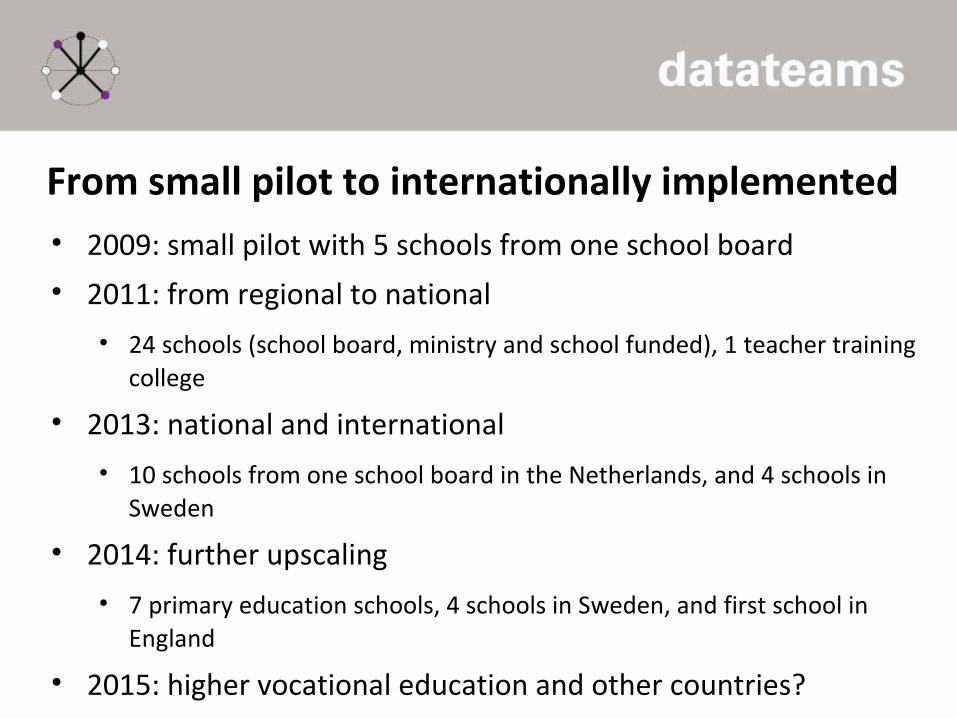
From small pilot to internationally implemented• 2009: small pilot with 5 schools from one school board
• 2011: from regional to national
• 24 schools (school board, ministry and school funded), 1 teacher training college
• 2013: national and international
• 10 schools from one school board in the Netherlands, and 4 schools in Sweden
• 2014: further upscaling
• 7 primary education schools, 4 schools in Sweden, and first school in England
• 2015: higher vocational education and other countries?
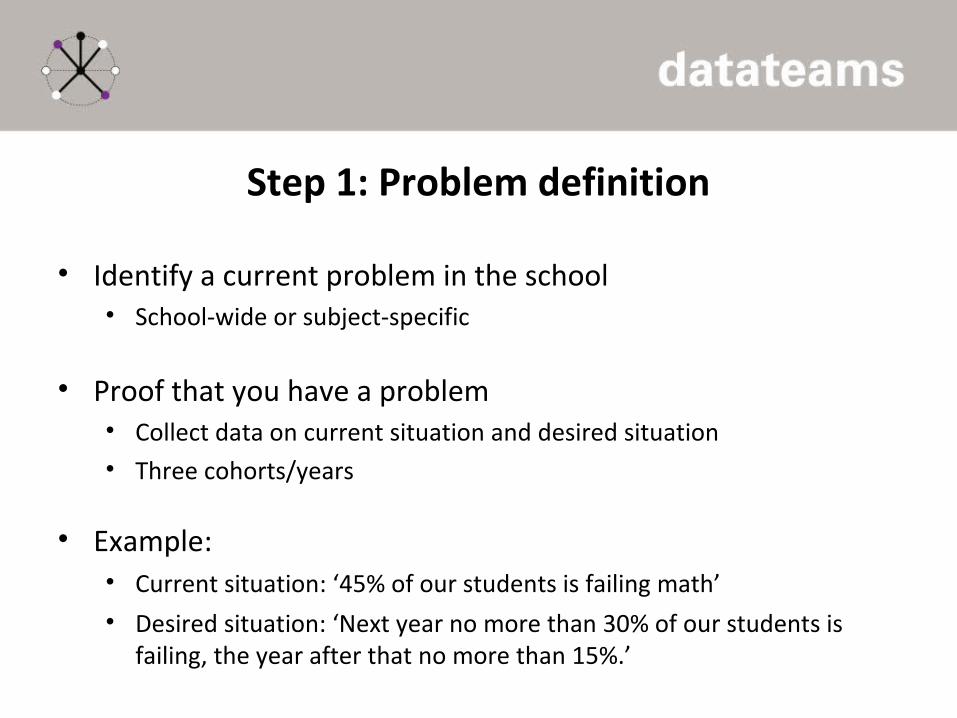
Step 1: Problem definition
• Identify a current problem in the school• School-wide or subject-specific
• Proof that you have a problem• Collect data on current situation and desired situation • Three cohorts/years
• Example:• Current situation: ‘45% of our students is failing math’
• Desired situation: ‘Next year no more than 30% of our students is failing, the year after that no more than 15%.’
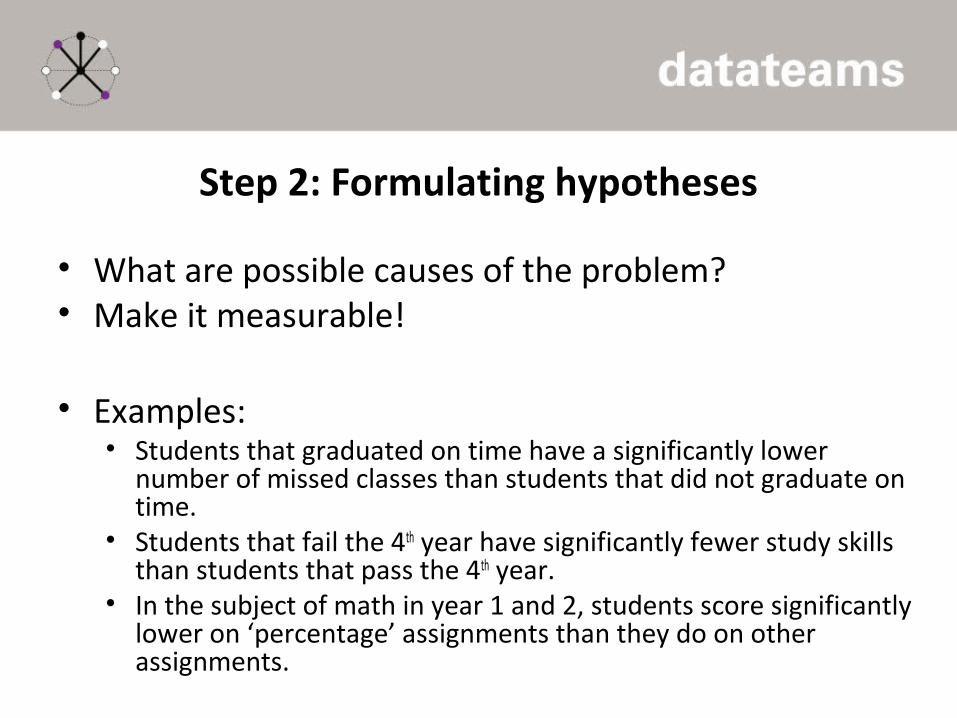
Step 2: Formulating hypotheses
• What are possible causes of the problem?• Make it measurable!
• Examples:• Students that graduated on time have a significantly lower
number of missed classes than students that did not graduate on time.
• Students that fail the 4th year have significantly fewer study skills than students that pass the 4th year.
• In the subject of math in year 1 and 2, students score significantly lower on ‘percentage’ assignments than they do on other assignments.
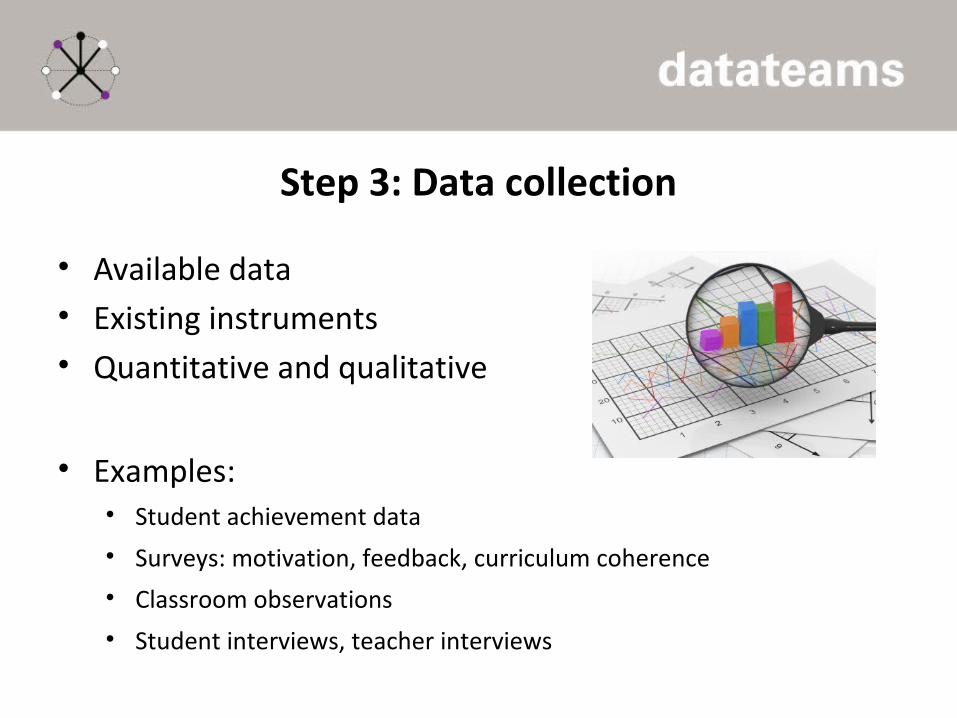
Step 3: Data collection
• Available data• Existing instruments• Quantitative and qualitative
• Examples:• Student achievement data
• Surveys: motivation, feedback, curriculum coherence
• Classroom observations
• Student interviews, teacher interviews
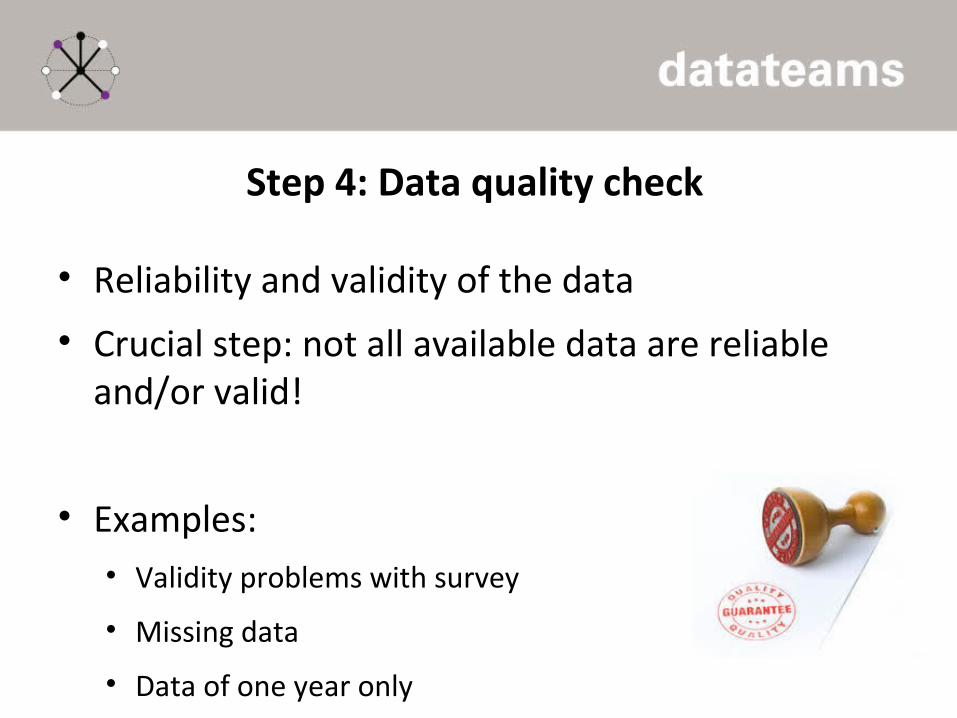
Step 4: Data quality check
• Reliability and validity of the data
• Crucial step: not all available data are reliable and/or valid!
• Examples:• Validity problems with survey
• Missing data
• Data of one year only
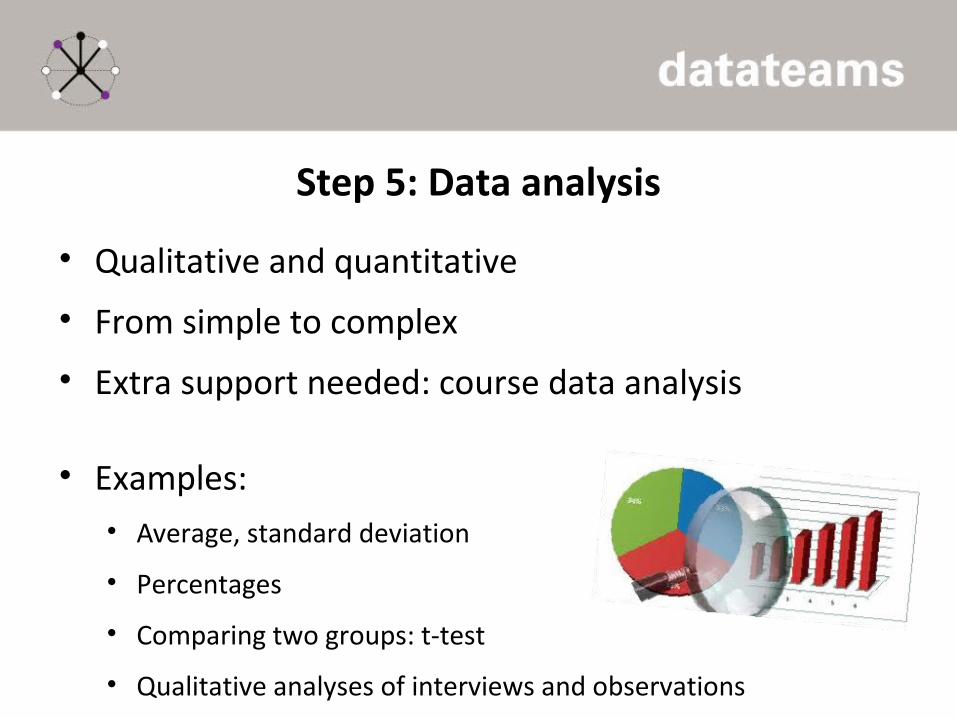
Step 5: Data analysis
• Qualitative and quantitative
• From simple to complex
• Extra support needed: course data analysis
• Examples:• Average, standard deviation
• Percentages
• Comparing two groups: t-test
• Qualitative analyses of interviews and observations
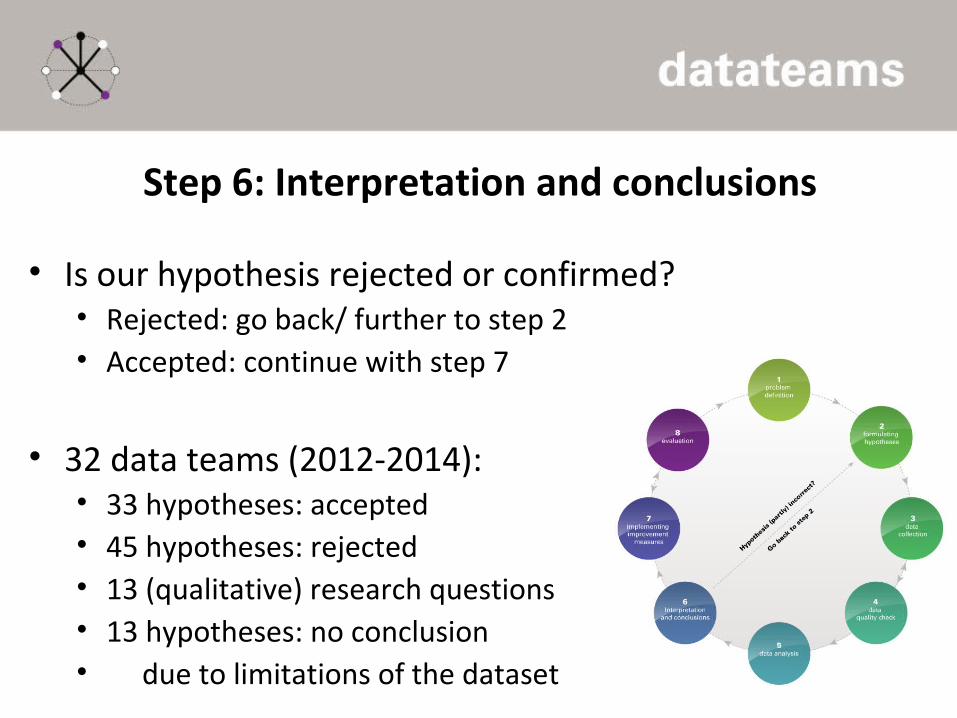
Step 6: Interpretation and conclusions
• Is our hypothesis rejected or confirmed?• Rejected: go back/ further to step 2 • Accepted: continue with step 7
• 32 data teams (2012-2014):• 33 hypotheses: accepted• 45 hypotheses: rejected• 13 (qualitative) research questions• 13 hypotheses: no conclusion • due to limitations of the dataset
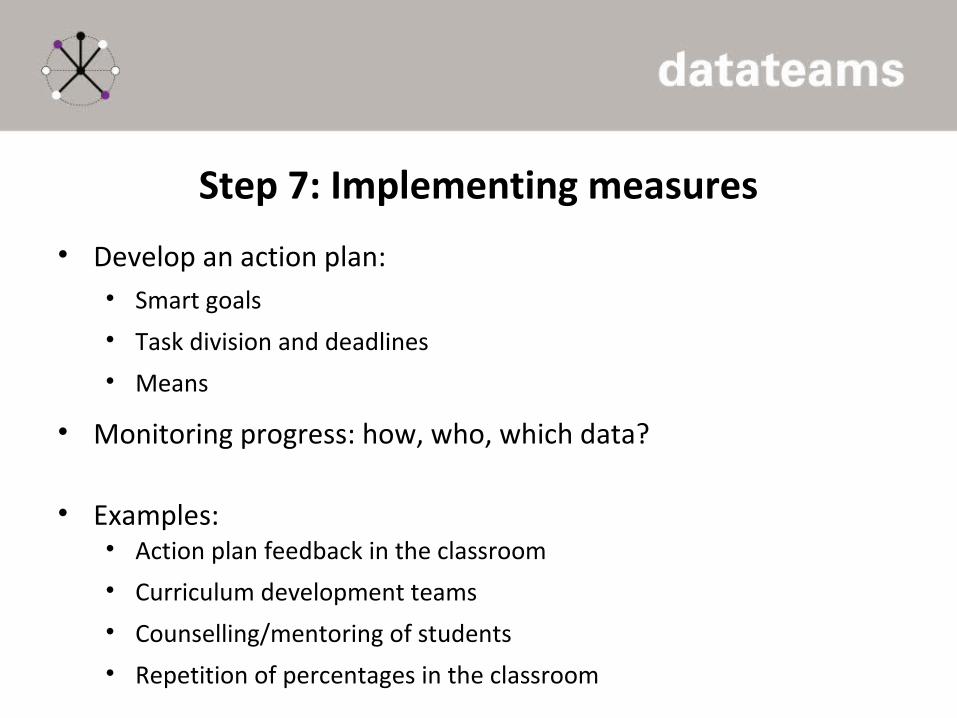
Step 7: Implementing measures
• Develop an action plan:• Smart goals
• Task division and deadlines
• Means
• Monitoring progress: how, who, which data?
• Examples:• Action plan feedback in the classroom
• Curriculum development teams
• Counselling/mentoring of students
• Repetition of percentages in the classroom
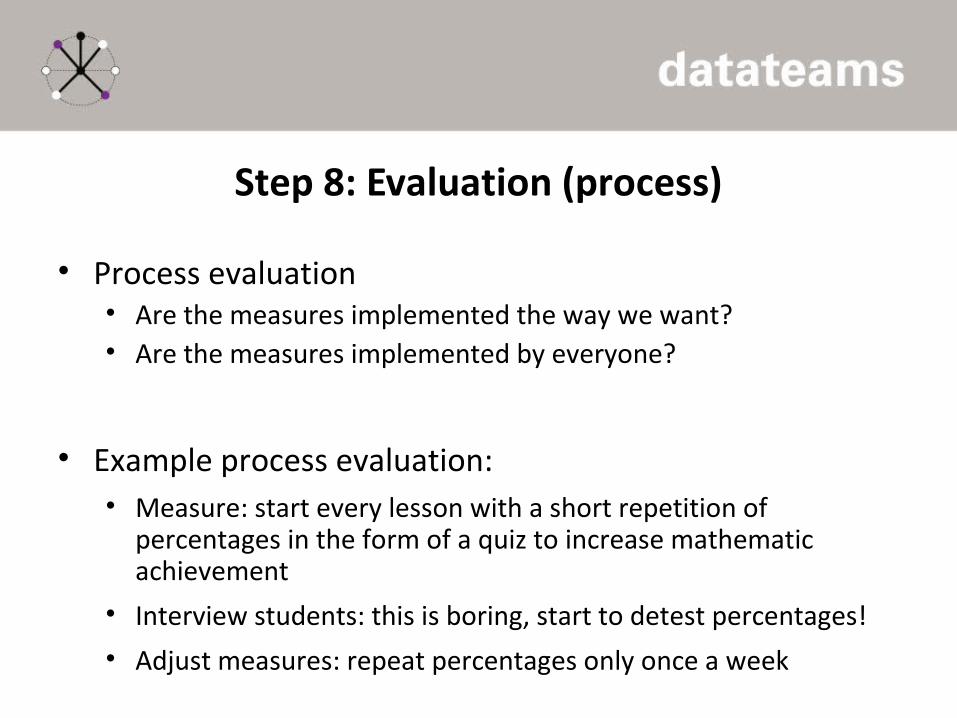
Step 8: Evaluation (process)
• Process evaluation• Are the measures implemented the way we want?• Are the measures implemented by everyone?
• Example process evaluation:• Measure: start every lesson with a short repetition of
percentages in the form of a quiz to increase mathematic achievement
• Interview students: this is boring, start to detest percentages!
• Adjust measures: repeat percentages only once a week
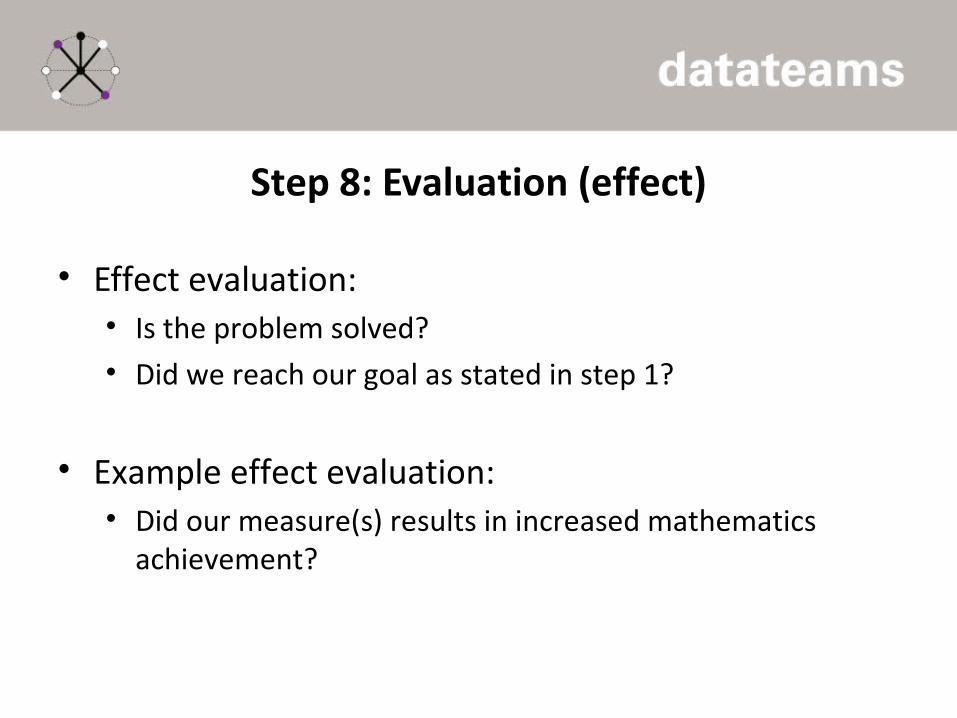
Step 8: Evaluation (effect)
• Effect evaluation:• Is the problem solved?• Did we reach our goal as stated in step 1?
• Example effect evaluation:• Did our measure(s) results in increased mathematics
achievement?
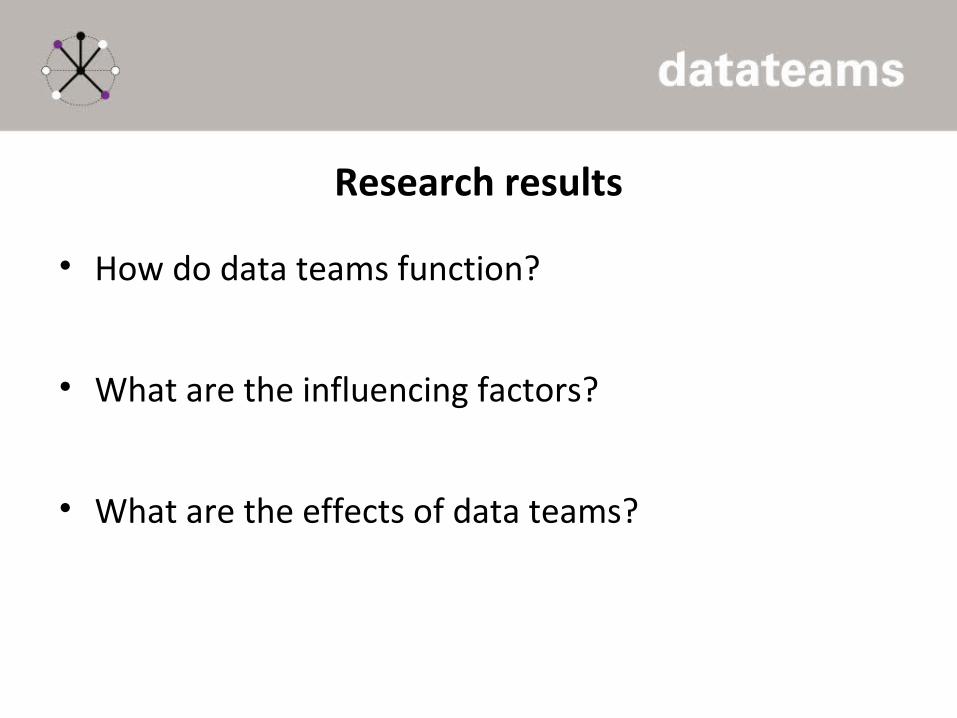
Research results
• How do data teams function?
• What are the influencing factors?
• What are the effects of data teams?
Data team functioning
• Difficult to make a measurable hypothesis
• Several rounds of hypotheses: first hypotheses always wrong
• Often external attribution: problem is caused by primary schools, by policy etc.
• However, this is necessary: need to create trust; practice with the eight step procedure; learning starts when you make mistakes; shows the importance of data
• From external to internal attribution
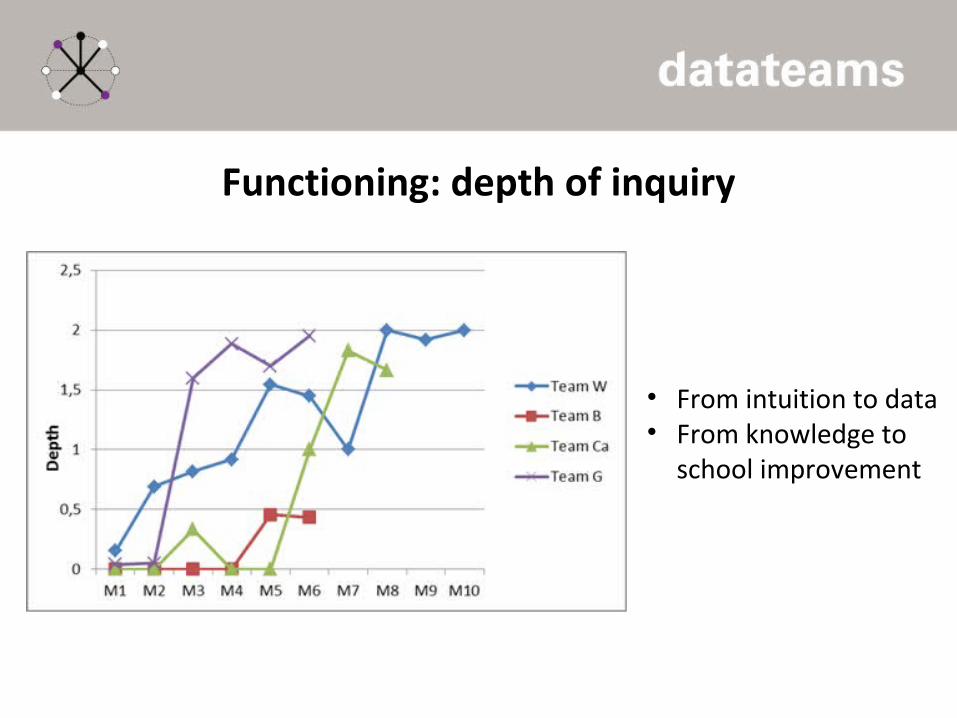
Functioning: depth of inquiry
• From intuition to data• From knowledge to
school improvement
Influencing factors
• Leadership: time, enthusiasm, role model, motivation, new perspective
• Collaboration and trust inside and outside the data team• Voluntary participation• Start with a shared problem and goal(s) (e.g., ownership)• Access to high quality data (systems), availability of multiple
sources of data in your own school• Structured eight step procedure• Support from the university: training and coaching over a
period of two years
Effects: teacher learning results
• Knowledge posttest: data team members scored significantly higher (M = 10.4) than pretest (M = 9.4; d = 0.32).
• Data use questionnaire: gain score for knowledge and skills significantly higher for data team members (M = 0.10) than control group teachers (M = -0.06; d = 0.62)
• Interviews: teachers learnt, for example, how to use data, e.g.,: ’to talk about education with colleagues in the data team, and develop new insights (…) into why we do things.’
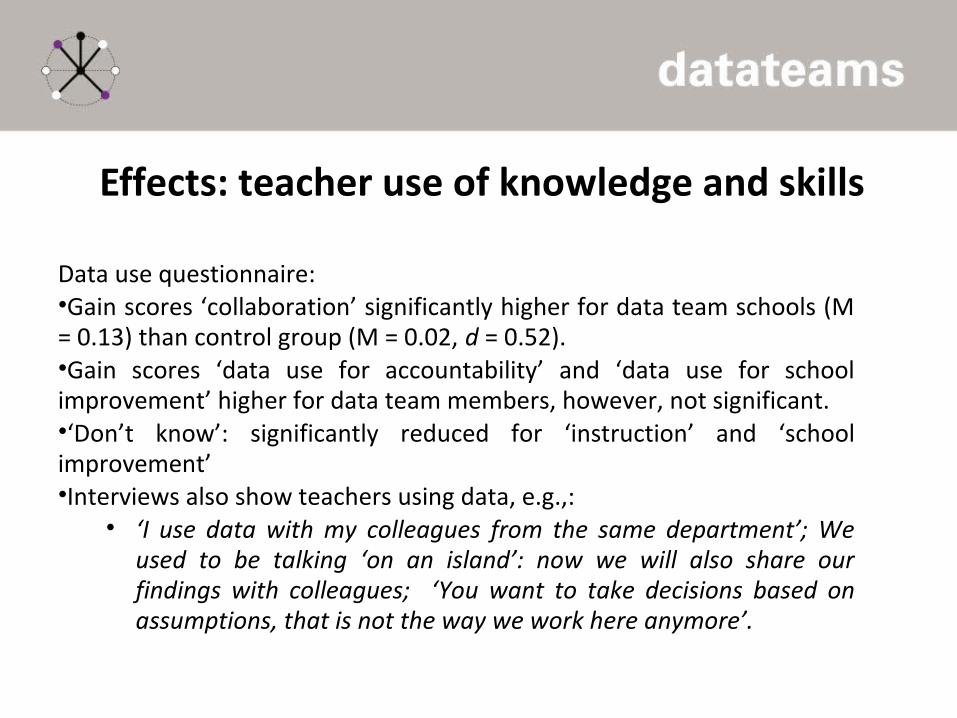
Effects: teacher use of knowledge and skills
Data use questionnaire: •Gain scores ‘collaboration’ significantly higher for data team schools (M = 0.13) than control group (M = 0.02, d = 0.52).•Gain scores ‘data use for accountability’ and ‘data use for school improvement’ higher for data team members, however, not significant.•‘Don’t know’: significantly reduced for ‘instruction’ and ‘school improvement’•Interviews also show teachers using data, e.g.,:
• ‘I use data with my colleagues from the same department’; We used to be talking ‘on an island’: now we will also share our findings with colleagues; ‘You want to take decisions based on assumptions, that is not the way we work here anymore’.
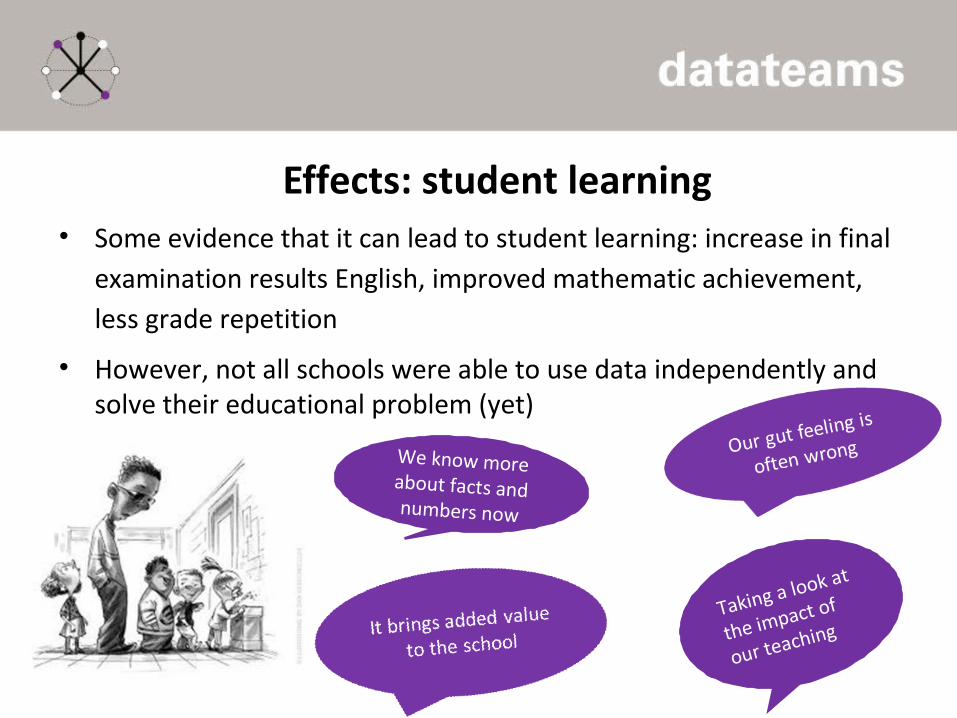
Effects: student learning• Some evidence that it can lead to student learning: increase in final
examination results English, improved mathematic achievement, less grade repetition
• However, not all schools were able to use data independently and solve their educational problem (yet)
Taking a look at
the impact of
our teaching
We know more about facts and numbers now
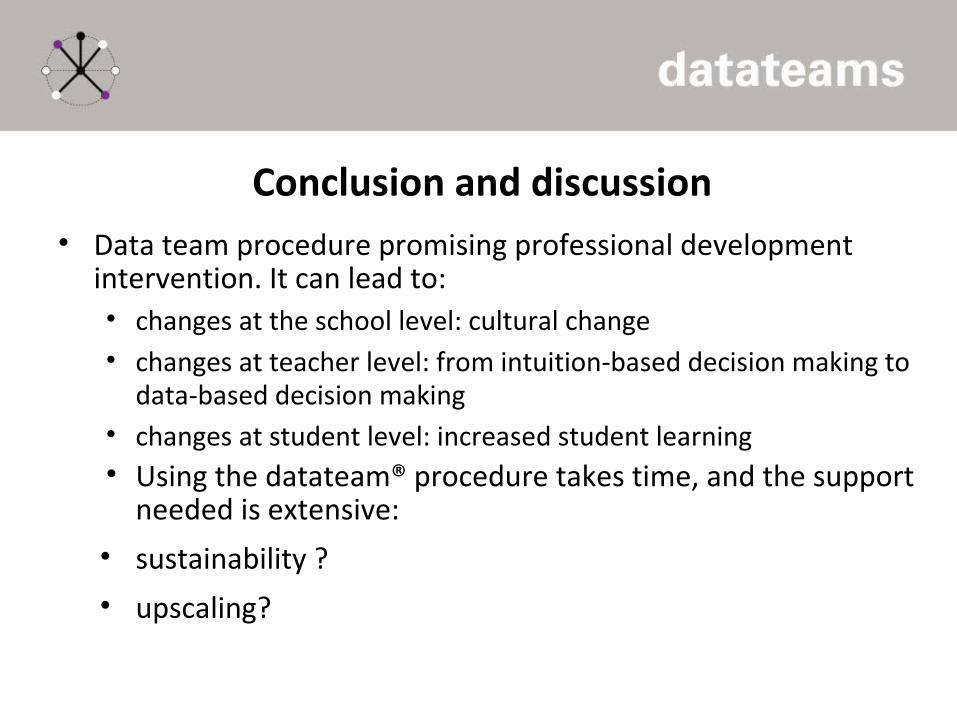
Conclusion and discussion• Data team procedure promising professional development
intervention. It can lead to:• changes at the school level: cultural change• changes at teacher level: from intuition-based decision making to
data-based decision making• changes at student level: increased student learning• Using the datateam® procedure takes time, and the support
needed is extensive:
• sustainability ?
• upscaling?
ReferencesThis presentation was largely based on the following publications:•Schildkamp, K., & Poortman, C.L. (in press). Factors influencing the functioning of data teams. Teachers College Record. •Schildkamp, K. Karbautzki, L., & Vanhoof, J. (2014). Exploring data use practices around Europe: Identifying enablers and barriers. Studies in Educational Evaluation, 42, 15-24. •Vanhoof, J., & Schildkamp, K. (2014). From professional development for data use to ‘data use for professional development. Studies in Educational Evaluation, 42, 1-4.•Schildkamp, K., & Ehren, M., & Lai, M.K. (2012). Editorial paper for the special issue on data-based decision making around the world: From policy to practice to results. School Effectiveness and School Improvement, 23(2), 123-132. • Ebbeler, J., Poortman, C.L., Schildkamp, K., & Handelzalts, A. (2015, January). Effects of the data team procedure on data use. Paper presented at ICSEI, Cincinnati, The USA. •Schildkamp, K., Heitink, M., van der Kleij, F., Hoogland, I., Dijkstra, A., Kippers, W. & Veldkamp, B. (2014). Voorwaarden voor effectieve formatieve toetsing. Een praktische review. Enschede: Universiteit Twente.•Schildkamp, K., Lai, M.K., & Earl (Eds.) (2013). Data-based decision making in education: challenges and opportunities. Dordrecht: Springer.