EDUCATION BEYOND IGH CHOOL ERIES The … I E R C Illinois Education Research Council Bringing...
20
http://ierc.siue.edu I I E R C I E R C Illinois Education Research Council Bringing Research to Policy and Practice POLICY RESEARCH: IERC 2009-3 IERC 2009-3 Part 3 of 5 The Illinois Class of 2002 and Gender: A descriptive summary four years after high school EDUCATION BEYOND HIGH SCHOOL SERIES Kathleen Sullivan Brown, Christopher M. Mullin, and Bradford R. White This longitudinal study focuses on a new generation. Members of the high school class of 2002 were born in the years 1983 and 1984. In order to situate their lives in historical context, it is helpful to think back to some of the major events in the lives of these young Illinois citizens. In 1983, Sally Ride became the first woman in space and became a cultural icon of women crossing new boundaries of achievement. That was also the year that the first Apple Lisa computers appeared, and a company called Microsoft released its word processor, MS Word. Dramatic social and technological changes have been woven through the lives of these students as they made their way through the Illinois educational system over the last two decades. National data show that women began to earn more Bachelor’s degrees than men in the late 1980’s. The longitudinal data on the high school class of 2002 continues to show evidence that during this period the gender gap in education has been eliminated. By 2002-2006, Illinois women had taken a lead in postsecondary participation (80% women to 73% men) and an even stronger edge in completions, 31.6% to 22%. This is comparable to postsecondary enrollment and completion patterns in the United States as well, where women are “having greater success than males in attaining postsecondary education” (NCES, 2004). Some researchers (Kolesnikova, 2009) suggest that one reason for the differences between male and female postsecondary enrollment and completions, with women now in the lead, stems from the greater availability of jobs for males with only a high school diploma and garnering a living wage for middle class workers. Such jobs might be in construction and similar manual trade fields in which males predominate; these jobs require skills other than those honed in a college curriculum. But projections do suggest that in the future, all jobs will require college-level skills for every worker (National Center on Education and the Economy, 2008). This analysis of the cohort of 2002 provides leaders of Illinois institutions of higher education with information about the gendered patterns of enrollment and successful completion at educational institutions of different types. If evidence shows that the gender disparities in education can be addressed, it is possible that other disparities may follow suit and the state can point to a more equitable system for all learners. Since 1998 the National Survey of Student Engagement has been tracking the experiences of undergraduate students in institutions across the United States (NSSE, 2007). Women and men often approach their learning environments in different ways, as the NSSE has documented. Differences that do exist during high school will persist in the college years (NSSE, 2007). Still, women are underrepresented in certain fields, such as science, technology, engineering and mathematics (STEM), despite their lead in enrollment and completion described in the data here. Executive Summary
-
Upload
trinhthien -
Category
Documents
-
view
216 -
download
3
Transcript of EDUCATION BEYOND IGH CHOOL ERIES The … I E R C Illinois Education Research Council Bringing...

http://ierc.siue.edu
IIERC
IERC
Illinois Education Research CouncilBringing Research to Policy and Practice
POLICY RESEARCH: IERC 2009-3
IERC 2009-3Part 3 of 5
The Illinois Class of 2002 and Gender: A descriptive summary four years after high school
EDUCATION BEYOND HIGH SCHOOL SERIES
Kathleen Sullivan Brown, Christopher M. Mullin, and Bradford R. White
This longitudinal study focuses on a new generation. Members of the high school class of 2002 were born in the years 1983 and 1984. In order to situate their lives in historical context, it is helpful to think back to some of the major events in the lives of these young Illinois citizens. In 1983, Sally Ride became the fi rst woman in space and became a cultural icon of women crossing new boundaries of achievement. That was also the year that the fi rst Apple Lisa computers appeared, and a company called Microsoft released its word processor, MS Word. Dramatic social and technological changes have been woven through the lives of these students as they made their way through the Illinois educational system over the last two decades.
National data show that women began to earn more Bachelor’s degrees than men in the late 1980’s. The longitudinal data on the high school class of 2002 continues to show evidence that during this period the gender gap in education has been eliminated.
By 2002-2006, Illinois women had taken a lead in postsecondary participation (80% women to 73% men) and an even stronger edge in completions, 31.6% to 22%. This is comparable to postsecondary enrollment and completion patterns in the United States as well, where women are “having greater success than males in attaining postsecondary education” (NCES, 2004).
Some researchers (Kolesnikova, 2009) suggest that one reason for the differences between male and female postsecondary enrollment and completions, with women now in the lead, stems from the greater availability of jobs for males with only a high school diploma and garnering a living wage for middle class workers. Such jobs might be in construction and similar manual trade fi elds in which males predominate; these jobs require skills other than those honed in a college curriculum. But projections do suggest that in the future, all jobs will require college-level skills for every worker (National Center on Education and the Economy, 2008).
This analysis of the cohort of 2002 provides leaders of Illinois institutions of higher education with information about the gendered patterns of enrollment and successful completion at educational institutions of different types. If evidence shows that the gender disparities in education can be addressed, it is possible that other disparities may follow suit and the state can point to a more equitable system for all learners.
Since 1998 the National Survey of Student Engagement has been tracking the experiences of undergraduate students in institutions across the United States (NSSE, 2007). Women and men often approach their learning environments in different ways, as the NSSE has documented. Differences that do exist during high school will persist in the college years (NSSE, 2007). Still, women are underrepresented in certain fi elds, such as science, technology, engineering and mathematics (STEM), despite their lead in enrollment and completion described in the data here.
Executive Summary

http://ierc.siue.edu2
Education Beyond High School - By Gender
IERC 2009-3Part 3 of 5
Key Findings
Participation
Females of this group enrolled in postsecondary education at a somewhat higher rate than males (80% to 73%).
Of women in the cohort of the Class of 2002, a quarter of them enrolled in public four-year institutions, and approximately 15% enrolled in private four-year institutions in the fi rst fall after high school graduation. Another quarter enrolled in community colleges that fi rst fall semester.
Of men in the cohort of the Class of 2002, a quarter of them enrolled in public four-year institutions, and approximately 12% enrolled in private four-year institutions in the fi rst fall after high school graduation. Another quarter enrolled in community colleges that fi rst fall semester.
Completion
By the Summer of 2006, approximately 26.8% of the High School Graduating Class of 2002 had received a degree or certifi cate. This means that more than 12,000 men and 18,000 women had accomplished this goal at a time when we know that expected time-to-degree completion has been extended out to fi ve and six years on average (NCES, 2004).
Although three out of four Illinois students started postsecondary education careers, some 43,000 men and 40,000 women—83,000 Illinois residents—who had successfully graduated from Illinois public high schools had reached the age of 22 without having earned a postsecondary credential of any kind.
Females earned nearly twice the number of bacca laureate degrees than the i r male counterparts.
A Gained Perspective
The various ways by which members of the Class of 2002 interact with opportunities for postsecondary education frame this study. Presented are results for the cohort as a whole. We display data by fall, spring, and summer semesters to capture the annual rhythms of educational participation.
As we attempt to study educational pursuits beyond high school, it is important to note that the legal parameters guiding education from kindergarten to graduate school shift at that critical juncture that is education beyond high school. The compulsory, lock-step pattern of enrollment
•
•
•
•
•
•
and promotion as seen in K-12 education no longer applies. Postsecondary education represents the various branches sprouting from a tree, not the rigid trunk that gets one there. It is our hope that the descriptive nature of this study, and others forthcoming in the Education Beyond High School Series, provide both the foundation for action and new avenues for exploration into the enrollment and completion puzzle that is postsecondary education for the students from Illinois’ K-12 system.
Research Notes
In reading through this material, it is important to note who exactly is a member of the Class of 2002 cohort in order to understand the fi ndings, implications, and limitations of this cohort.
Who is included in this cohort
The 113,660 individuals who, as public high school students, took the Prairie State Achievement Exam in Spring 2001
Who is not included in this cohort
Private high school graduates
Out-of-state high school graduates that migrated to higher education institutions in Illinois
Non-traditional, older students who entered or returned to postsecondary education
Dual enrolled/dual credit students currently in high school
It is important to note who is included in this study as the resulting recommendations may apply only to one segment of postsecondary education in Illinois. Further, by noting who is not included in this study, several items are important as they impact the fi ndings presented herein:
The fact that September 11th attacks of 2001 occurred during this cohorts’ senior year in high school would likely have an impact on those who chose to enlist in the various branches of the military as opposed to postsecondary education. We have attempted to identify individuals who entered the various branches of the military, but have yet to be successful.
Private high school students and students from out-of-state would greatly enhance our dataset, but they were not included as data sharing agreements were not established with other states and private education entities.
•
•
•
•
•
•
1.
2.

http://ierc.siue.edu 3
Education Beyond High School - By Gender
IERC 2009-3Part 3 of 5
Non-traditional and dual enrollment/dual credit students were not included as they were/would be part of a different graduating cohort.
Considerations in interpreting the data
While the fi ndings presented in this series suggest that postsecondary enrollment and completion are associated with gender, we note that these analyses do not take into account other measures which may help to explain these relationships.
With regard to the attainment of certifi cates and degrees, remember that completion is at least
3.
•
•
partially dependent upon enrollment and that students from different sub-groups enroll at various institution types at quite different rates.
Finally, it is important to note that in order to provide the level of detail required to illustrate our fi ndings, the scales utilized in the charts of this report often vary. Since the graphs do not all have a consistent scale, fi gures that may appear similar at fi rst glance might, in fact, represent substantially different enrollment or completion rates.
•
ABOUT THE AUTHORS
Kathleen Sullivan Brown ([email protected]) is Executive Director of the Illinois Education Research Council and Visiting Associate Professor at Southern Illinois University Edwardsville.
Christopher M. Mullin ([email protected]) is a PostDoctoral Fellow with the Illinois Education Research Council and Assistant Research Professor at Southern Illinois University Edwardsville.
Bradford R. White ([email protected]) is a Senior Researcher with the Illinois Education Research Council.
ACKNOWLEDGEMENTS
We would like to thank Brenda Klostermann, Jennifer Barnhart, and Jacqueline Twitty for their help in preparation of this report.
Reports in this Series:
The Illinois Class of 2002—An Overview: A descriptive summary four years after high school (IERC 2009-1)
The Illinois Class of 2002 and College Readiness: A descriptive summary four years after high school (IERC 2009-2)
The Illinois Class of 2002 and Gender: A descriptive summary four years after high school (IERC 2009-3)
The Illinois Class of 2002 and Parent Income: A descriptive summary four years after high school (IERC 2009-4)
The Illinois Class of 2002 and Race/Ethnicity: A descriptive summary four years after high school (IERC 2009-5)
Previous IERC studies on the Illinois Class of 2002:
The demographics and academics of college readiness in Illinois (IERC 2005-3), by Yuqin Gong and Jennifer B. Presley
The demographics and academics of college going in Illinois (IERC 2006-2), by Yuqin Gong and Jennifer B. Presley
Following the Illinois high school class of 2002: Three years into college (IERC 2006-5), by Yuqin Gong, Jennifer B. Presley and Bradford R. White

http://ierc.siue.edu4
Education Beyond High School - By Gender
IERC 2009-3Part 3 of 5
Table of Contents
Enrollment .................................................................................................... 5Figure 1. Percent of the Class of 2002 that Ever Enrolled in Postsecondary Education, Fall 2002 to Summer 2006 (N=113,660) ...................................................................................................................................... 5
Figure 2. Enrollment Trends for the Class of 2002, By Gender: Fall 2002 to Summer 2006 (N=113,660) .... 6
Figure 3 Public Four-Year Institution Enrollment Trends for the Class of 2002, By Gender: Fall 2002 to Summer 2006 (N=113,660) ........................................................................................................................ 7
Figure 4. Private Four-Year Enrollment Trends for the Class of 2002, By Gender: Fall 2002 to Summer 2006 (N=113,660) ..................................................................................................................................... 7
Figure 5. Public Community College Enrollment Trends for the Class of 2002, By Gender: Fall 2002 to Summer 2006 (N=113,660) ......................................................................................................................... 8
Figure 6. In-State Enrollment Trends for the Class of 2002, By Gender: Fall 2002 to Summer 2006 (N=113,660) .............................................................................................................................................. 9
Figure 7. Out-of-State Enrollment Trends for the Class of 2002, By Gender: Fall 2002 to Summer 2006 (N=113,660) .............................................................................................................................................. 9
Completions ................................................................................................ 10Figure 8. Percent of the Class of 2002 that Ever Completed a Certifi cate or Degree Program: Fall 2002 to Summer 2006 (N=113,660) ................................................................................................................. 10
Figure 9. Completion Trends, By Gender: Fall 2002 to Summer 2006 ....................................................... 11
Figure 10. Completions at Public Institution, By Gender: Fall 2002 to Summer 2006 ............................... 12
Figure 11. Completions at Private Institution, By Gender: Fall 2002 to Summer 2006 .............................. 12
Figure 12. Completions at In-State Institutions, By Gender: Fall 2002 to Summer 2006 ........................... 12
Figure 13. Completions at Out-of-State Institutions, By Gender: Fall 2002 to Summer 2006 .................... 13
Figure 14. Completions at Community Colleges, By Gender: Fall 2002 to Summer 2006 .......................... 14
Table 1. Total Number and Type of Earned Credentials, by Gender: Fall 2002 to Summer 2006 ................ 15
Figure 15. Percent of Completions, by Gender ........................................................................................... 15
Key Findings ............................................................................................... 16
Suggested citation:
Brown, Kathleen S., Mullin, Christopher M., and White, Bradford R. (2009). The Illinois class of 2002 and gender: A descriptive summary four years after high school. Education Beyond High School Series (IERC 2009-3). Edwardsville, IL: Illinois Education Research Council.

http://ierc.siue.edu 5
Education Beyond High School - By Gender
IERC 2009-3Part 3 of 5
Enrollment
How many individuals of the Class of 2002 ever enrolled in postsecondary education in the four years after high school graduation?
The Illinois High School Graduating Class of 2002 included 113,660 students. The cohort consisted of 51.22% females and 48.25% males, with 0.6% of individuals not self-identifying with the options presented (Figure 1). There are multiple ways to deal with this issue. We could assume this group splits evenly into the two categories of male and female, but we would then be attaching the gender tag to a large number of other variables downstream and we cannot assume that they are randomly or normally distributed in these other dimensions. Thus, we chose to show those responses as missing data. Additionally, some individuals may not identify themselves with a specifi c gender.
Within the four years following high school graduation, 3 out of 4 Illinois students enrolled in postsecondary education (76.5%). This is a much higher rate of participation than generally assumed.
Females of this group enrolled in postsecondary education at a higher rate than males or those not identifying themselves by gender (80% to 73% and 70%, respectively). This fi nding is consistent with national patterns seen in the U.S. in recent years (NCES, 2004), with women pursuing higher education at greater levels than men.
Figure 1. Percent of the Class of 2002 that Ever Enrolled in Postsecondary Education, Fall 2002 to Summer 2006 (N=113,660)
Female(N=58,220)
Male(N=54,838)
Not Reported(N=602)
19.9%
80.1%
27.2%
72.8%
30.1%
69.9%
Enrolled Not Enrolled
Female51.22%
0.53%
Male48.25%

http://ierc.siue.edu6
Education Beyond High School - By Gender
IERC 2009-3Part 3 of 5
What was the enrollment trend of the Class of 2002 during the four years after high school graduation?
Figure 2 presents the enrollment trends of females, males, and those who did not report a gender for each semester from Fall 2002 to Summer 2006. Women led men in enrollment in each semester by approximately 5%, or slightly more than they were represented in the total population of the cohort (about 3%).
The trends for both women and men decline for each year of enrollment, suggesting that women and men are retained at similar rates. As we will see in Figure 9, women will complete programs at a much higher rate within the fi rst four years after high school. Non-gendered individuals appear to have a more substantial drop in the spring semesters than their female or male counterparts.
Figure 2. Enrollment Trends for the Class of 2002, By Gender: Fall 2002 to Summer 2006 (N=113,660)
Fall2002
Spring2003
Summer2003
Fall2003
Spring2004
Summer2004
Fall2004
Spring2005
Summer2005
Fall2005
Spring2006
Summer2006
Female(N=58,220)
Male(N=54,838)
Gender Not Reported
(N=602)
0%
10%
20%
30%
40%
50%
60%
70%
Per
cent
age
of S
ub-g
roup
Enr
olle
d

http://ierc.siue.edu 7
Education Beyond High School - By Gender
IERC 2009-3Part 3 of 5
Figure 3 Public Four-Year Institution Enrollment Trends for the Class of 2002, By Gender: Fall 2002 to Summer 2006 (N=113,660)
Fall2002
Spring2003
Summer2003
Fall2003
Spring2004
Summer2004
Fall2004
Spring2005
Summer2005
Fall2005
Spring2006
Summer2006
0%
5%
10%
15%
20%
25%
30%
Female(N=58,220)
Male(N=54,838)
Gender Not Reported
(N=602)
Per
cent
age
of S
ub-g
roup
Enr
olle
d
Figure 4. Private Four-Year Enrollment Trends for the Class of 2002, By Gender: Fall 2002 to Summer 2006 (N=113,660)
Fall2002
Spring2003
Summer2003
Fall2003
Spring2004
Summer2004
Fall2004
Spring2005
Summer2005
Fall2005
Spring2006
Summer2006
0%
2%
4%
6%
8%
10%
12%
14%
16%
18%
Female(N=58,220)
Male(N=54,838)
Gender Not Reported
(N=602)
Per
cent
age
of S
ub-g
roup
Enr
olle
d

http://ierc.siue.edu8
Education Beyond High School - By Gender
IERC 2009-3Part 3 of 5
Figure 5. Public Community College Enrollment Trends for the Class of 2002, By Gender: Fall 2002 to Summer 2006 (N=113,660)
Fall2002
Spring2003
Summer2003
Fall2003
Spring2004
Summer2004
Fall2004
Spring2005
Summer2005
Fall2005
Spring2006
Summer2006
0%
5%
10%
15%
20%
25%
30%
Female(N=58,220)
Male(N=54,838)
Gender Not Reported
(N=602)
Per
cent
age
of S
ub-g
roup
Enr
olle
d
How did enrollment trends differ between gender at public and private institutions for the Class of 2002?
Of women in the cohort of the Class of 2002, a quarter of them enrolled in public four-year institutions (Figure 3), and about 15% enrolled in private four-year schools (Figure 4). Another quarter enrolled in community colleges (Figure 5). Thirty-fi ve percent did not enroll the fi rst fall after high school.
Of men in the cohort of the Class of 2002, approximately 20% enrolled in public four-year institutions, about 12% enrolled in private four-year schools, and about 25% in community colleges (Figures 3, 4, and 5). Forty-three percent did not enroll in the fi rst fall after high school.
After a slight drop in Fall 2003, for both men and women, enrollment in public four-year institutions decreased in Fall 2004, Spring 2005, and Fall 2005 (Figure 3). This pattern addresses questions among higher education leaders in the state about retention efforts and whether Illinois students are transferring to senior institutions to complete Bachelor’s degrees.
Private institutions showed a relatively stable enrollment among both males and females, with a slight dip in the second Fall (2003) and a rise in the third and fourth years. This suggests that private institutions may have benefi ted from junior transfers from Illinois community colleges (Figure 4).
Figure 5 shows that community college enrollment among both males and females fell off precipitously after the fi rst two years, from a high in Fall 2004 of 27% to lows of 12% in Spring 2006 and 6% by Summer 2006. Transfers to four-year institutions and completions may account for some of this decline.
__________
Note: Private community college enrollment was negligible; as such an analysis for this subgroup was not included.

http://ierc.siue.edu 9
Education Beyond High School - By Gender
IERC 2009-3Part 3 of 5
How did enrollment trends differ between gender at in-state and out-of-state institutions for the Class of 2002?
The patterns for in-state and out-of-state enrollment were fairly similar; however, the magnitude was observably different, as approximately 50% attended in-state, while approximately 11% attended out-of-state institutions. In both locations, participation by females outpaced participate by males (Figures 6 and 7).
At in-state institutions, the enrollment trends fall in the third and fourth years (Figure 6). In refl ecting back to Figure 5, the data suggest this drop is due to declining enrollments at the public community colleges due to program completion, stop-out, or transfer.
Enrollment trends at all out-of-state institutions (Figure 7) hold fairly constant, with slight increases in the third and fourth years. Interestingly, the percent of those enrolled out-of-state for individuals who did not choose a gender were greater than for males in the fi rst two years, at which point, these individuals enrolled less.
Figure 7. Out-of-State Enrollment Trends for the Class of 2002, By Gender: Fall 2002 to Summer 2006 (N=113,660)
Fall2002
Spring2003
Summer2003
Fall2003
Spring2004
Summer2004
Fall2004
Spring2005
Summer2005
Fall2005
Spring2006
Summer2006
0%
2%
4%
6%
8%
10%
12%
14%
Female(N=58,220)
Male(N=54,838)
Gender Not Reported
(N=602)
Perc
enta
ge o
f Sub
-gro
up E
nrol
led
Figure 6. In-State Enrollment Trends for the Class of 2002, By Gender: Fall 2002 to Summer 2006 (N=113,660)
Fall2002
Spring2003
Summer2003
Fall2003
Spring2004
Summer2004
Fall2004
Spring2005
Summer2005
Fall2005
Spring2006
Summer2006
0%
10%
20%
30%
40%
50%
60%
Female(N=58,220)
Male(N=54,838)
Gender Not Reported
(N=602)
Per
cent
age
of S
ub-g
roup
Enr
olle
d

http://ierc.siue.edu10
Education Beyond High School - By Gender
IERC 2009-3Part 3 of 5
Figure 8. Percent of the Class of 2002 that Ever Completed a Certifi cate or Degree Program: Fall 2002 to Summer 2006 (N=113,660)
Completions
Female(N=58,220)
Male(N=54,838)
Not Reported(N=602)
68.4%31.6%
78.1%
21.9%
82.2%
17.8%
Completed Not Completed
0.53%
Female51.22%
Male48.25%
By the Summer of 2006, approximately 26.8% of the members of the High School Graduating Class of 2002 had received a degree or certifi cate. This means that more than 12,000 men and 18,000 women had accomplished their goal at a time when we know that time-to-degree completion has been extended out to fi ve and six years on average (NCES, 2004).
However, what this also means is that although 3 out of 4 Illinois students started postsecondary education careers, some 43,000 men and 40,000 women—83,000 Illinois residents—who had successfully graduated from Illinois public high schools had reached the age of 22 without having earned a postsecondary credential of any kind.
Women, who led enrollment at the start, continued the pattern of leading males in degree/certifi cate completion overall and in each of the succeeding semesters, most strikingly in the Spring 2006 graduation.
Although the four-year degree has now become the “fi ve and six year plan” for an increasingly large segment of students, 33,402 reached their goal of earning a degree or certifi cate within four years.
Furthermore, a very small group of the Graduating Class of 2002 had earned a Master’s degree within four years of completing high school. In a future report, we will attempt to look deeper at this group to determine how they might have benefi ted from dual credit or Advance Placement (AP) programs that provided them the opportunity to accelerate their degree completion.

http://ierc.siue.edu 11
Education Beyond High School - By Gender
IERC 2009-3Part 3 of 5
Figure 9. Completion Trends, By Gender: Fall 2002 to Summer 2006
Fall2002
Spring2003
Summer2003
Fall2003
Spring2004
Summer2004
Fall2004
Spring2005
Summer2005
Fall2005
Spring2006
Summer2006
0%
5%
10%
15%
20%
25%
Female(N=58,220)
Male(N=54,838)
GenderNot Reported
(N=602)
Perc
enta
ge o
f Sub
-gro
up C
ompl
etio
ns
How did completion trends differ between gender for the Class of 2002?
Community college enrollment among males and females fell off precipitously after the fi rst two years, from a high in Fall 2004 of 27% to 12% in Spring 2006 and a low of 6% by Summer 2006 (see Figure 5). With the concomitant rise in four-year enrollment from this cohort, this appears to suggest that transfers are taking place from community college institutions to four-year institutions (in-state, out-of-state, and private) and resulting in Baccalaureate degree completions in Spring 2006.
In future reports, we will examine completions in the fi fth and sixth year following high school graduation, when we expect to see additional degree and certifi cate completions.
Across all semesters females exhibited the highest percentage of completion as compared to males and those who do not identify with a gender option provided.
http://ierc.siue.edu12
Education Beyond High School - By Gender
IERC 2009-3Part 3 of 5
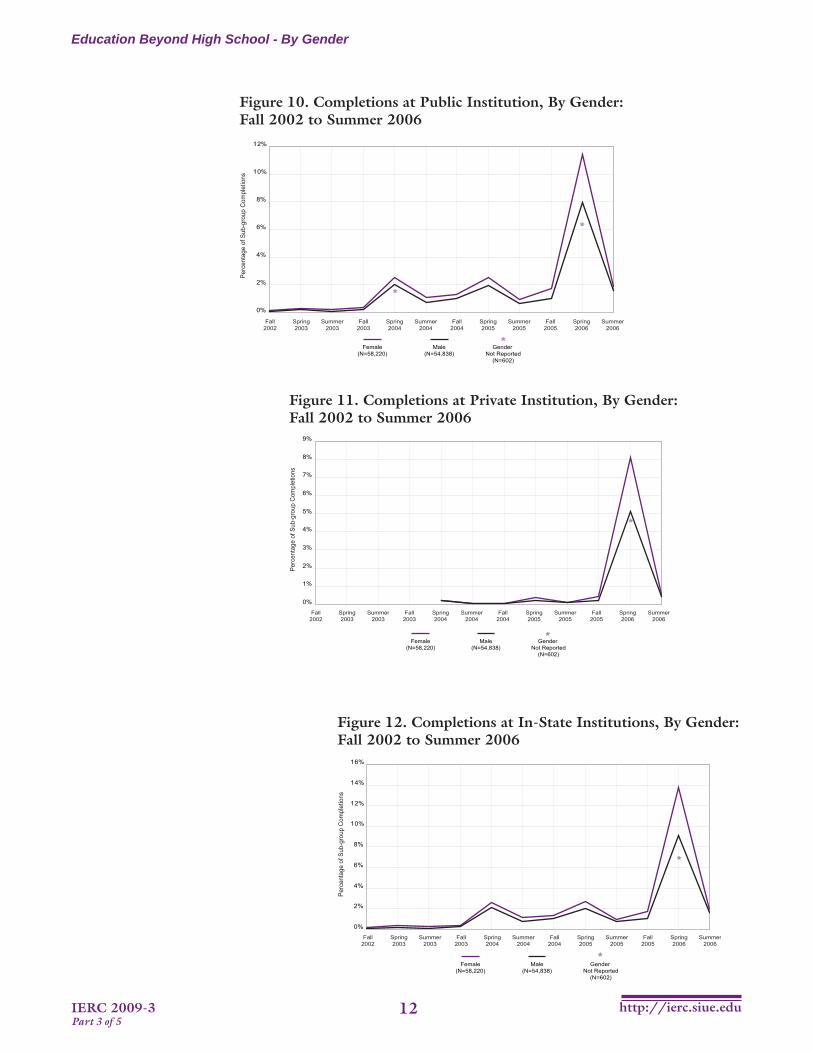
Figure 10. Completions at Public Institution, By Gender: Fall 2002 to Summer 2006
Fall2002
Spring2003
Summer2003
Fall2003
Spring2004
Summer2004
Fall2004
Spring2005
Summer2005
Fall2005
Spring2006
Summer2006
0%
2%
4%
6%
8%
10%
12%
Female(N=58,220)
Male(N=54,838)
Gender Not Reported
(N=602)
Perc
enta
ge o
f Sub
-gro
up C
ompl
etio
ns
*
*
*
Figure 11. Completions at Private Institution, By Gender: Fall 2002 to Summer 2006
Fall2002
Spring2003
Summer2003
Fall2003
Spring2004
Summer2004
Fall2004
Spring2005
Summer2005
Fall2005
Spring2006
Summer2006
0%
1%
2%
3%
4%
5%
6%
7%
8%
9%
Female(N=58,220)
Male(N=54,838)
Gender Not Reported
(N=602)
Perc
enta
ge o
f Sub
-gro
up C
ompl
etio
ns
*
*
Figure 12. Completions at In-State Institutions, By Gender: Fall 2002 to Summer 2006
Fall2002
Spring2003
Summer2003
Fall2003
Spring2004
Summer2004
Fall2004
Spring2005
Summer2005
Fall2005
Spring2006
Summer2006
0%
2%
4%
6%
8%
10%
12%
14%
16%
Female(N=58,220)
Male(N=54,838)
Gender Not Reported
(N=602)
Perc
enta
ge o
f Sub
-gro
up C
ompl
etio
ns
*
*

http://ierc.siue.edu 13
Education Beyond High School - By Gender
IERC 2009-3Part 3 of 5
What were the completion trends at different institution types for the Class of 2002 by gender during the four years after high school graduation?
While the scales on the y-axis vary, Figures 10-13 are remarkably similar and illustrate the lead of women in all four institutional categories.
Figures 10 and 12 refl ect some completion “bumps” in Spring 2004 and 2005, which would be Associate degrees primarily, at public and in-state campuses.
Figures 11 and 13 illustrate the typical pattern of graduation at the end of four years from private and out-of-state schools.
Note the low percentage levels, even at the peaks, for all four of these graphs. This clearly shows that the cohort is not completing the next stage of their educational attainment within the two-year and four-year periods normally expected. Comparing these extremely low completion rates to the high rate of fi rst semester Fall enrollments demonstrates the signifi cant slowdown in degree and certifi cate completions. The next stage of our analysis of fi ve- and six-year completion rates will be extremely important to determine the overall college success of the Class of 2002.
Note: * Individuals who did not report gender did experience degree or certifi cate completions, but these occurred at discrete points that did not result in semester-to-semester trend lines.
Figure 13. Completions at Out-of-State Institutions, By Gender: Fall 2002 to Summer 2006
Fall2002
Spring2003
Summer2003
Fall2003
Spring2004
Summer2004
Fall2004
Spring2005
Summer2005
Fall2005
Spring2006
Summer2006
0%
1%
2%
3%
4%
5%
6%
7%
Female(N=58,220)
Male(N=54,838)
Gender Not Reported
(N=602)
Perc
enta
ge o
f Sub
-gro
up C
ompl
etio
ns
*
*

http://ierc.siue.edu14
Education Beyond High School - By Gender
IERC 2009-3Part 3 of 5
Figure 14. Completions at Community Colleges, By Gender: Fall 2002 to Summer 2006
Fall2002
Spring2003
Summer2003
Fall2003
Spring2004
Summer2004
Fall2004
Spring2005
Summer2005
Fall2005
Spring2006
Summer2006
0.5%
1.0%
1.5%
2.0%
2.5%
3.0%
0.0%
Female(N=58,220)
Male(N=54,838)
Gender Not Reported
(N=602)
Perc
enta
ge o
f Sub
-gro
up C
ompl
etio
ns
How did completion trends differ between gender at Community Colleges for the Class of 2002?
Compared to the lead of women in degree completions at the four-year institutions, Figure 14 shows that men narrowed the gap in completions at the community college level in all twelve semesters. Men and women completed certifi cates and degrees at the highest rates at community colleges in the second, third and fourth spring semesters after high school. But the level of completions is quite low throughout the time span, ranging from 0% to approximately 2.5%. This suggests that the “traditional age” college students in this cohort are not completing the certifi cates and degree programs offered at Illinois community colleges.
Yet it may also be true that community college enrollments are increasing, as indicated by Illinois Community College Board reports (see reference Table 1 and 2 in “overview” study). The data here, combined with annual reports from the Illinois Community College Board, suggest, in effect, that older “non-traditional” students are enrolling in Illinois community colleges far more frequently than those coming out of high school, at least as indicated by data on this cohort of 2002 high school graduates

http://ierc.siue.edu 15
Education Beyond High School - By Gender
IERC 2009-3Part 3 of 5
Table 1. Total Number and Type of Earned Credentials, by Gender: Fall 2002 to Summer 2006
GenderMissing
Information
Unknown Certifi cate/Associate
Type
Transfer Associate/Certifi cate
Terminal Associate/Certifi cate
Baccalaureate Degree
Master’s Degree Total
Female 2,537 1,194 3,237 1,970 11,080 18 20,036Male 1,714 883 2,176 1,372 6,976 24 13,145Gender not reported * * 0 * 55 0 55
Total 4,251 2,077 5,413 3,342 18,111 42 33,236* indicates that more than zero but fewer than 10 completions were observed.
What were the trends in degree level completion by gender for the Class of 2002?
Females earned the largest proportion of credentials (61%) by four years after high school, and females led across all credential types (Table 1). Of note is Baccalaureate degree completion, where females earned nearly twice the number of Baccalaureate degrees than their male counterparts. Those who opted to not state a gender earned a negligible number of credentials when compared to the group who chose to report a gender classifi cation.
As found in the National Survey of Student Engagement (NSSE) studies, these data suggest that males and females perceive different benefi ts and costs from postsecondary engagement, leading them to focus on different certifi cate and degree types.
Wage data, military enlistment data, and other information sources may help explain why the gender gap in Illinois appears to have shifted and is now more negatively impacting males in the educational environment following high school in relation to Baccalaureate degree completion.
Missing0%
Male39%
Female61%
Figure 15. Percent of Completions, by Gender
2002 - 2006(N=33,236)

http://ierc.siue.edu16
Education Beyond High School - By Gender
IERC 2009-3Part 3 of 5
Key Findings
Participation
Females of this cohort enrolled in postsecondary education at a somewhat higher rate than males (80% to 73%).
Of women in the cohort of the Class of 2002, a quarter of them enrolled in public four-year institutions, and approximately 15% enrolled in private four-year institutions in the fi rst fall after high school graduation. Another quarter enrolled in community colleges that fi rst fall semester.
Of men in the cohort of the Class of 2002, a quarter of them enrolled in public four-year institutions, and approximately 12% enrolled in private four-year institutions in the fi rst fall after high school graduation. Another quarter enrolled in community colleges that fi rst fall semester.
Completion
By the Summer of 2006, approximately 26.8% of the High School Graduating Class of 2002 had received a degree or certifi cate. This means that more than 12,000 men and 18,000 women had accomplished this goal at a time when we know that time-to-degree completion has been extended out to fi ve and six years on average (NCES, 2004).
That is the good news. However, what this also means is that although 3 out of 4 Illinois students started postsecondary education careers, some 43,000 men and 40,000 women—83,000 Illinois residents—who had successfully graduated from Illinois public high schools had reached the age of 22 without having earned a postsecondary credential of any kind.
Females earned nearly twice the number of baccalaureate degrees than their male counterparts.
•
•
•
•
•
•

http://ierc.siue.edu 17
Education Beyond High School - By Gender
IERC 2009-3Part 3 of 5
ReferencesGong, Y. & Presley, J. B. (2006). The demographics and academics of college going in Illinois (IERC 2006-
2). Edwardsville, IL: Illinois Education Research Council. Available at http://ierc.siue.edu
Gong, Y. & Presley, J. B. (2005). The demographics and academics of college readiness in Illinois (IERC 2005-3). Edwardsville, IL: Illinois Education Research Council. Available at http://ierc.siue.edu
Gong, Y., Presley, J. B., & White, B. R. (2006). Following the Illinois high school class of 2002: Three years into college (IERC 2006-5). Edwardsville, IL: Illinois Education Research Council. Available at http://ierc.siue.edu
National Center for Education Statistics (2004). Trends in Educational Equity of Girls & Women: 2004. Retrieved from http://nces.ed.gov/.
Kolesnikova, N. (2009). Community Colleges: A route to upward economic mobility. St. Louis Federal Reserve: St. Louis, MO.
National Survey of Student Engagement (NSSE). (2007) Retrieved from http://nsse.iub.edu/nsse_2007/index.cfm
National Center on Education and the Economy. (2008). Tough choices or tough times: The report of the new Commission on the Skills of the American Workforce. San Francisco: Jossey-Bass.

http://ierc.siue.edu 18
Education Beyond High School - By Gender
IERC 2009-3Part 3 of 5

http://ierc.siue.edu 19
Education Beyond High School - By Gender
IERC 2009-3Part 3 of 5
http://ierc.siue.edu20
Education Beyond High School - By Gender
IERC 2009-3Part 3 of 5
About the Illinois Education Research Council
The Illinois Education Research Council was established in 2000 at Southern Illinois University to provide Illinois with education research to support P-20 education policy making and program development. The IERC undertakes independent research and policy analysis, often in collaboration with other researchers, that informs and strengthens Illinois’ commitment to providing a seamless system of educational opportunities for its citizens. Through publications, presentations, participation on committees, and a research symposium, the IERC brings objective and reliable evidence to the work of state policy makers and practitioners.
IIERC
IERC
Contact the IERC toll-free at 1-866-799-IERC (4372) or by email at [email protected].
http://ierc.siue.edu