Education at a GlancE intErim rEport - OECD and will be followed by the publication of 2014 data in...
44
EDUCATION AT A GLANCE INTERIM REPORT: UPDATE OF EMPLOYMENT AND EDUCATIONAL ATTAINMENT INDICATORS
-
Upload
truongdiep -
Category
Documents
-
view
217 -
download
1
Transcript of Education at a GlancE intErim rEport - OECD and will be followed by the publication of 2014 data in...

Education at a GlancE intErim rEport: updatE of EmploymEnt and Educational attainmEnt indicators
Education at a Glance Interim Report:
Update of Employment and Educational
Attainment Indicators
January 2015

Education at a Glance: OECD Indicators is the authoritative source for accurate and relevant information on the state of education around the world. It provides data on the structure, finances, and performance of the education systems in the 34 OECD member countries, as well as a number of G20 and partner countries.
This publication is based on 2013 data collected in the first half of 2014 from the OECD-INES Network on Labour Market, Economic and Social Outcomes of Learning. It is an update of the series published in Education at a Glance 2014: OECD Indicators, released in September 2014, and will be followed by the publication of 2014 data in Education at a Glance 2015: OECD Indicators. This Education at a Glance Interim Report presents updated data on three major topics: educational attainment, labour market outcomes, and the transition from school to work.
Authors: Rodrigo Castañeda Valle, Simon Normandeau and Gara Rojas González.
For more information on Education at a Glance and to access the full set of Indicators, visit http://www.oecd.org/edu/eag.htm.
Questions can be directed to: [email protected]
This work is published under the responsibility of the Secretary-General of the OECD. The opinions expressed and arguments employed herein do not necessarily reflect the official views of OECD member countries.
This document and any map included herein are without prejudice to the status of or sovereignty over any territory, to the delimitation of international frontiers and boundaries and to the name of any territory, city or area.
Note regarding data from Israel
The statistical data for Israel are supplied by and are under the responsibility of the relevant Israeli authorities. The use of such data by the OECD is without prejudice to the status of the Golan Heights, East Jerusalem and Israeli settlements in the West Bank under the terms of international law.
READER’S GUIDE
Education at a Glance Interim Report: Update of Employment and Educational Attainment Indicators © OECD 2015 3
TABLE OF CONTENTS
READER’S GUIDE .................................................................................................................5
CHAPTER 1 TO WHAT LEVEL HAVE ADULTS STUDIED? ............................................... 9
Trends in educational attainment: 2000-2013 ................................................................. 10 Upper secondary attainment and the impact of vocational education and training (VET) ................................................................................................................... 12
CHAPTER 2 HOW DOES EDUCATIONAL ATTAINMENT AFFECT PARTICIPATION IN THE LABOUR MARKET? ............................................................................................... 19
Labour market outcomes, by educational attainment, gender and age group ................ 20 Labour market outcomes among those with low qualifications ...................................... 22 Differences in labour market outcomes by programme orientation at upper secondary level ....................................................................................................... 23 Labour market outcomes among those with tertiary qualifications ................................ 25
CHAPTER 3 TRANSITION FROM SCHOOL TO WORK: WHERE ARE THE 15-29 YEAR-OLDS? .............................................................................................................. 31
Expected years in education.............................................................................................. 31 Young people in education or not, and their labour market status ................................. 32 Young people neither in employment nor in education or training (NEET) ................... 33 Working hours ................................................................................................................. 35
Tables
Table 1.1. Educational attainment of 25-64 year-olds, by gender (2013) ......................... 17 Table 2.1. Employment rates, by educational attainment and gender (2013) ................. 28 Table 2.3. Unemployment rates, by educational attainment and gender (2013) ............ 29 Table 3.1. Expected years in education/not in education from age 15 through 29, by work status and gender (2013) ..................................................................................... 41 Table 3.3. Percentage of 15-29 year-olds in education/not in education, by age group, work status and gender (2013) ........................................................................................ 42
Figures
Chart 1.1. Educational attainment among younger and older adults (2013) ...................... 10 Chart 1.2. Percentage of younger adults with attainment below upper secondary education, by gender (2013) ............................................................................................... 12 Chart 1.3. Percentage of the adult population whose highest level of education is upper secondary or post-secondary non-tertiary, by programme orientation and gender (2013) ...................................................................................................................... 13 Chart 1.4. Percentage of younger adults with tertiary education (2000 and 2013) ........... 14
4 Education at a Glance Interim Report: Update of Employment and Educational Attainment Indicators © OECD 2015
Chart 2.1. Employment rates among adults, by educational attainment (2013) ................20 Chart 2.2. Employment and attainment rates among younger adults with tertiary education, by gender (2013) ............................................................................................... 21 Chart 2.3. Employment rates among younger adults with attainment below upper secondary education, by gender (2013) .............................................................................. 22 Chart 2.4. Employment rates of the adult population whose highest level of education is upper secondary or post-secondary non-tertiary, by programme orientation (2013) .... 24 Chart 2.5. Unemployment rates among younger adults with tertiary education, by gender (2013) ................................................................................................................. 25 Chart 3.1. Distribution of 20-24 year-olds in education/not in education, by work status (2013) ........................................................................................................................ 33 Chart 3.2. Percentage of 20-24 year-olds neither in employment nor in education or training (NEET), by gender (2013) ..................................................................................... 34 Chart 3.3. Number of hours worked in a week, by 15-29 year-olds in education (2013) ... 36 Chart 3.4. Number of hours worked in a week, by 15-29 year-olds not in education (2013) ................................................................................................................. 38

READER’S GUIDE
Education at a Glance Interim Report: Update of Employment and Educational Attainment Indicators © OECD 2015 5
READER’S GUIDE
Coverage of the statistics Although a lack of data still limits the scope of the indicators in many countries, the coverage extends, in principle, to the entire national education system (within the national territory), regardless of who owns or sponsors the institutions concerned and regardless of how education is delivered. With one exception (described below), all types of students and all age groups are included: children (including students with special needs), adults, nationals, foreigners, and students in open-distance learning, in special education programmes or in education programmes organised by ministries other than the Ministry of Education, provided that the main aim of the programme is to broaden or deepen an individual’s knowledge.
Educational activities classified as “adult” or “non-regular” are covered, provided that the activities involve the same or similar content as “regular” education studies, or that the programmes of which they are a part lead to qualifications similar to those awarded in regular educational programmes.
Courses for adults that are primarily for general interest, personal enrichment, leisure or recreation are excluded.
Country coverage This publication features data on education from the 34 OECD member countries, two partner countries that participate in the OECD Indicators of Education Systems programme (INES), namely Brazil and the Russian Federation, and the other partner countries that do not participate in INES (Argentina, China, Colombia, India, Indonesia, Latvia, Saudi Arabia and South Africa). Data sources for these latter eight countries are specified below the tables.
The statistical data for Israel are supplied by and under the responsibility of the relevant Israeli authorities. The use of such data by the OECD is without prejudice to the status of the Golan Heights, East Jerusalem and Israeli settlements in the West Bank under the terms of international law.
Calculation of international means The OECD average is calculated as the unweighted mean of the data values of all OECD countries for which data are available or can be estimated. The OECD average therefore refers to an average of data values at the level of the national systems and can be used to answer the question of how an indicator value for a given country compares with the value for a typical or average country. It does not take into account the absolute size of the education system in each country.
The OECD average can be significantly affected by missing data. Given the relatively small number of countries surveyed, no statistical methods are used to compensate for this. In

READER’S GUIDE
6 Education at a Glance Interim Report: Update of Employment and Educational Attainment Indicators © OECD 2015
cases where a category is not applicable (code “a”) in a country or where the data value is negligible (code “n”) for the corresponding calculation, the value zero is imputed for the purpose of calculating OECD averages. In cases where both the numerator and the denominator of a ratio are not applicable (code “a”) for a certain country, this country is not included in the OECD average.
The EU21 average is calculated as the unweighted mean of the data values of the 21 countries that are members of both the European Union and the OECD for which data are available or can be estimated. These 21 countries are Austria, Belgium, the Czech Republic, Denmark, Estonia, Finland, France, Germany, Greece, Hungary, Ireland, Italy, Luxembourg, the Netherlands, Poland, Portugal, the Slovak Republic, Slovenia, Spain, Sweden and the United Kingdom.
For some indicators, a G20 average is presented. The G20 average is calculated as the unweighted mean of the data values of all G20 countries for which data are available or can be estimated (Argentina, Australia, Brazil, Canada, China, France, Germany, India, Indonesia, Italy, Japan, Korea, Mexico, the Russian Federation, Saudi Arabia, South Africa, Turkey, the United Kingdom and the United States; the European Union is the 20th member of the G20 but is not included in the calculation). The G20 average is not computed if the data for China or India are not available.
Classification of levels of education
The classification of the levels of education is based on the International Standard Classification of Education (ISCED 1997). ISCED 1997 is an instrument for compiling statistics on education internationally; it distinguishes among six levels of education. ISCED 1997 was recently revised, and the new International Standard Classification of Education (ISCED 2011) was formally adopted in November 2011. This new classification will be implemented in Education at a Glance 2015.
Term used in this publication ISCED classification (and subcategories)
Pre-primary education The first stage of organised instruction designed to introduce very young children to the school atmosphere. Minimum entry age of 3.
ISCED 0
Primary education Designed to provide a sound basic education in reading, writing and mathematics and a basic understanding of some other subjects. Entry age: between 5 and 7. Duration: 6 years.
ISCED 1
Lower secondary education Completes provision of basic education, usually in a more subject oriented way with more specialist teachers. Entry follows 6 years of primary education; duration is 3 years. In some countries, the end of this level marks the end of compulsory education.
ISCED 2 (subcategories: 2A prepares students for continuing academic education, leading to 3A; 2B has stronger vocational focus, leading to 3B; 2C offers preparation of entering workforce)
Upper secondary education Stronger subject specialisation than at lower secondary level, with teachers usually more qualified. Students typically expected to have completed 9 years of education or lower secondary schooling before entry and are generally 15 or 16 years old.
ISCED 3 (subcategories: 3A prepares students for university-level education at level 5A; 3B for entry to vocationally oriented tertiary education at level 5B; 3C prepares students for workforce or for post-secondary non-tertiary education at level ISCED 4)

READER’S GUIDE
Education at a Glance Interim Report: Update of Employment and Educational Attainment Indicators © OECD 2015 7
Term used in this publication ISCED classification (and subcategories)
Post-secondary non-tertiary education Internationally, this level straddles the boundary between upper secondary and post-secondary education, even though it might be considered upper secondary or post-secondary in a national context. Programme content may not be significantly more advanced than that in upper secondary, but is not as advanced as that in tertiary programmes. Duration usually the equivalent of between 6 months and 2 years of full-time study. Students tend to be older than those enrolled in upper secondary education.
ISCED 4 (subcategories: 4A may prepare students for entry to tertiary education, both university level and vocationally oriented; 4B typically prepares students to enter the workforce)
Tertiary education ISCED 5 (subcategories: 5A and 5B; see below)
Tertiary-type A education Largely theory-based programmes designed to provide sufficient qualifications for entry to advanced research programmes and professions with high skill requirements, such as medicine, dentistry or architecture. Duration at least 3 years full-time, though usually 4 or more years. These programmes are not exclusively offered at universities; and not all programmes nationally recognised as university programmes fulfil the criteria to be classified as tertiary-type A. Tertiary-type A programmes include second-degree programmes, such as the American master’s degree.
ISCED 5A
Tertiary-type B education Programmes are typically shorter than those of tertiary-type A and focus on practical, technical or occupational skills for direct entry into the labour market, although some theoretical foundations may be covered in the respective programmes. They have a minimum duration of two years full-time equivalent at the tertiary level.
ISCED 5B
Advanced research programmes Programmes that lead directly to the award of an advanced research qualification, e.g. Ph.D. The theoretical duration of these programmes is 3 years, full-time, in most countries (for a cumulative total of at least 7 years full-time equivalent at the tertiary level), although the actual enrolment time is typically longer. Programmes are devoted to advanced study and original research.
ISCED 6
The glossary available at www.oecd.org/edu/eag.htm also describes these levels of education in detail.
Symbols for missing data and abbreviations These symbols and abbreviations are used in the tables and charts:
a Data are not applicable because the category does not apply.
c There are too few observations to provide reliable estimates.
m Data are not available.
n Magnitude is either negligible or zero.
* Values are below a certain reliability threshold and should be interpreted with caution (see the Annex for country-specific definitions).
w Data have been withdrawn at the request of the country concerned.

READER’S GUIDE
8 Education at a Glance Interim Report: Update of Employment and Educational Attainment Indicators © OECD 2015
x Data included in another category or column of the table (e.g. x(2) means that data are included in column 2 of the table).
~ Average is not comparable with other levels of education.
Further resources The website www.oecd.org/edu/eag.htm is a rich source of information on the methods used to calculate the indicators, on the interpretation of the indicators in the respective national contexts, and on the data sources involved. The website also provides access to the data underlying the indicators and to a comprehensive glossary for technical terms used in this publication.
All post-production changes to this publication are listed at www.oecd.org/edu/eag.htm.
Layout of tables In all tables, the numbers in parentheses at the top of the columns are simply used for reference. When a consecutive number does not appear, that column is available on line only.
To what level have adults studied? CHAPTER 1
Education at a Glance Interim Report: Update of Employment and Educational Attainment Indicators © OECD 2015 9
CHAPTER 1 TO WHAT LEVEL HAVE ADULTS
STUDIED?
The level of educational attainment shows the percentage of a population that has reached a certain level of education and holds a qualification at that level. Educational attainment is frequently used as a measure of human capital and the level of an individual’s skills – in other words, a measure of the skills associated with a given level of education and available in the population, and the labour force. In this sense, qualifications certify and offer information on the type of knowledge and skills that graduates have acquired in formal schooling.
Higher levels of educational attainment are associated with several positive individual and social outcomes. Data in previous editions of Education at a Glance have shown that individuals with high educational attainment generally have better health, are more socially engaged, have higher employment rates and have higher relative earnings. Higher proficiency on skills such as literacy and numeracy is also strongly associated with higher levels of formal education.
Individuals thus have strong incentives to pursue more education, and governments have incentives to provide appropriate infrastructure and organisation to support further progress in education of the population. Over the past decades, almost all OECD countries have seen significant increases in the educational attainment of their populations, especially among the younger generations.
Chart 1.1 shows the educational attainment of younger and older adults (25-34 year-olds and 55-64 year-olds) across OECD countries, distributed by three aggregated levels of education: below upper secondary, upper secondary or post-secondary non-tertiary and tertiary education. In most OECD countries more than four out of five younger adults have attained at least an upper secondary education, implying that less than 20% of them have low qualifications (below upper secondary education) (Table 1.4).

CHAPTER 1 To what level have adults studied?
10 Education at a Glance Interim Report: Update of Employment and Educational Attainment Indicators © OECD 2015
Chart 1.1. Educational attainment among younger and older adults (2013)
25-34 year-olds and 55-64 year-olds
Note: Data for Japan are not displayed because disaggregation between below upper secondary education and upper secondary or post-secondary non-tertiary level is not available. 1. Year of reference 2012. 2. Year of reference 2011. Countries are ranked in ascending order of the proportion of 25-34 year-olds with attainment below upper secondary education. Source: OECD. Table 1.4. See Annex for notes (www.oecd.org/edu/eag.htm).
At the other end of the education spectrum, on average across OECD countries, 40% of younger adults have attained a tertiary qualification. National differences are wide around this average: in Canada, Ireland, Japan and Korea, the majority of young adults hold a tertiary qualification, while it is the case for less than 30% in Austria, the Czech Republic, Germany, Italy, Mexico, Portugal and Turkey and the partner countries Brazil and Colombia. It should be noted that Austria, the Czech Republic, Germany and the Slovak Republic have extensive upper secondary vocational systems, resulting in 60% or more of their young adult populations attaining upper secondary education and low proportions with less than an upper secondary education (11%, 6%, 13% and 6% respectively). Therefore, these countries belong to the group with low proportions of young adults with low skills, while Italy, Mexico, Portugal and Turkey have some of the highest proportions of younger adults with low qualifications (Chart 1.1).
Trends in educational attainment: 2000-2013
Between 2000 and 2013, upper secondary (or post-secondary non-tertiary) and tertiary qualifications gained more and more terrain across OECD countries which means that the proportion of the population with only a below upper secondary education is shrinking. On average across the OECD, the proportion of adults aged 25 to 64 who have not attained an upper secondary education decreased by about 11 percentage points between 2000 and 2013. During this period the proportion decreased from more than one third of all adults (34%) in 2000 to less than one fourth (23%) in 2013.

To what level have adults studied? CHAPTER 1
Education at a Glance Interim Report: Update of Employment and Educational Attainment Indicators © OECD 2015 11
As the proportion of the population with only a below upper secondary education decreased between 2000 and 2013, the proportion of the population attaining tertiary education (including advanced research programmes) increased, growing by about 10 percentage points. In 2013, about one in three adults (33%) in OECD countries, on average, held a tertiary qualification (Table 1.4).
The expansion of tertiary education attainment is largely due to younger generations studying longer than older generations. Between 2000 and 2013, the proportion of younger adults (25-34 year-olds) with tertiary qualifications was consistently higher than older adults (55-64 year-olds) with tertiary qualifications. Moreover, on average across OECD countries the younger adults kept increasing their attainment levels throughout this period. In 2000, tertiary qualifications were held by 26% of those aged 25-34 years-old, while only 15% of 55-64 years-old held such qualifications. By 2013, the proportion of older adults with tertiary qualifications increased by about 9 percentage points since 2000 while it increased by 14 percentage points among younger adults, reaching on average 24% for older adults and 40% for younger adults. Among OECD and partner countries with data for all years, the proportion of the younger adults with tertiary qualifications increased from 2000 to 2013 (Table 1.4).
A generational change is also seen among adults with low levels of education: in 2013, on average across OECD countries, only 17% of younger adults (25-34 year-olds) have not attained upper secondary level, compared to 34% of older adults (55-64 year-olds). In 2000, many countries had over half of their older adults with below upper secondary education. By 2013 the gap for those with below upper secondary education between older and younger adults was over 20 percentage points in Australia, Belgium, Finland, France, Greece, Ireland, Italy, Korea, Mexico, the Netherlands, Portugal, Slovenia, Spain and Turkey. While progress has been made across all countries, even now, the five OECD countries (Italy, Mexico, Portugal, Spain and Turkey) with the highest proportion of older adults with low qualifications are also those with the highest share of younger adults with low qualifications. In Portugal and Spain, the proportion of young adults with low qualifications is more than 30%, and in Mexico and Turkey more than half of younger adults have not attained an upper secondary qualification. Among these five OECD countries, only in Italy is the proportion of younger adults without an upper secondary qualification below 30% (Table 1.4).
Overall, the decrease in the proportion of younger adults with low qualifications has been about 8 percentage points on average in OECD countries, from 25% in 2000 to 17% in 2013. Despite this dominant trend, in some OECD and partner countries, namely in Denmark, Estonia, Latvia and Norway, there was an increase in the share of younger adults with low qualifications in the same period (Table 1.4).
In 2013 adult men (25-64 year-olds) in most OECD countries are more likely not to have an upper secondary qualification than females, though the difference is not very large for certain countries. Nevertheless, in some countries the gender difference is above 4 percentage points for men: Brazil, Estonia, Finland, Ireland, Latvia, Portugal and Spain. In 2000, the picture was quite different as only Ireland had a gender difference for men above 4 percentage points, and six countries had a gender difference for women over 10 percentage points: Australia, Austria, the Czech Republic, Iceland, Korea and the United Kingdom (Table 1.4).
Chart 1.2 shows that, on average across countries, 18% of younger men (25-34 year-olds) have not attained an upper secondary education while the percentage among younger women is 15%. In Australia, Brazil, Colombia, Denmark, Estonia, Greece, Iceland, Italy, Latvia and
CHAPTER 1 To what level have adults studied?
12 Education at a Glance Interim Report: Update of Employment and Educational Attainment Indicators © OECD 2015
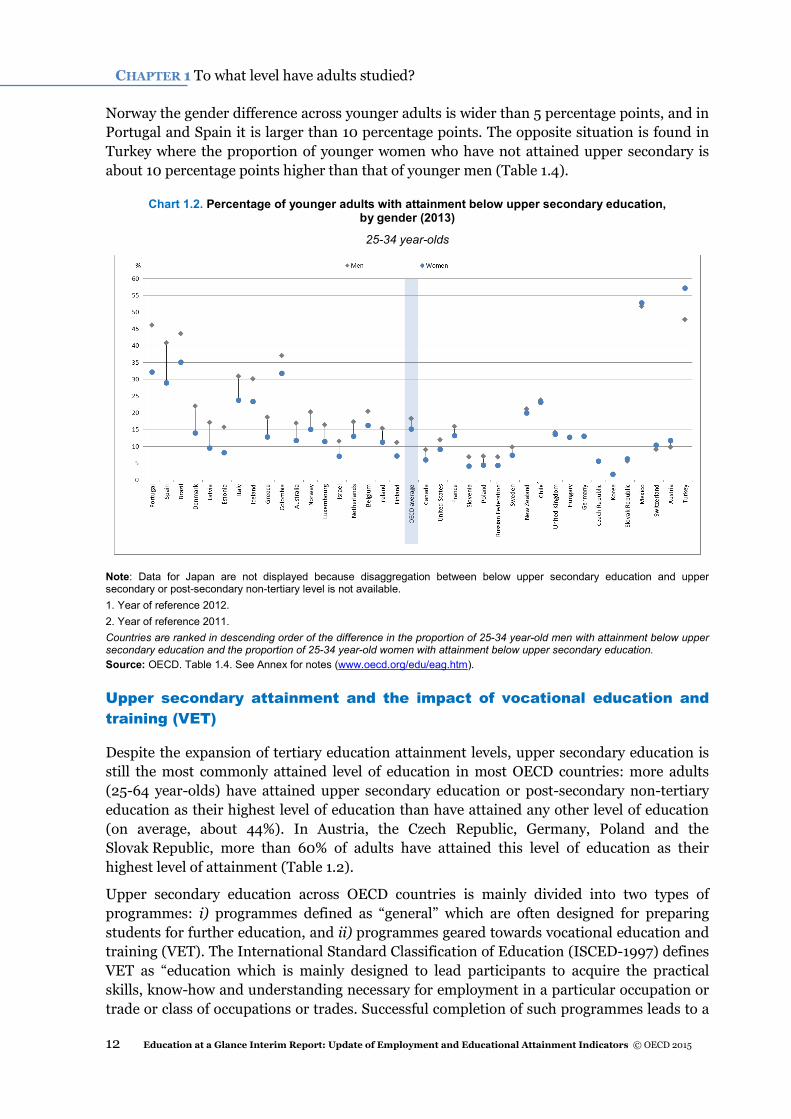
Norway the gender difference across younger adults is wider than 5 percentage points, and in Portugal and Spain it is larger than 10 percentage points. The opposite situation is found in Turkey where the proportion of younger women who have not attained upper secondary is about 10 percentage points higher than that of younger men (Table 1.4).
Chart 1.2. Percentage of younger adults with attainment below upper secondary education, by gender (2013)
25-34 year-olds
Note: Data for Japan are not displayed because disaggregation between below upper secondary education and upper secondary or post-secondary non-tertiary level is not available. 1. Year of reference 2012. 2. Year of reference 2011. Countries are ranked in descending order of the difference in the proportion of 25-34 year-old men with attainment below upper secondary education and the proportion of 25-34 year-old women with attainment below upper secondary education. Source: OECD. Table 1.4. See Annex for notes (www.oecd.org/edu/eag.htm).
Upper secondary attainment and the impact of vocational education and training (VET)
Despite the expansion of tertiary education attainment levels, upper secondary education is still the most commonly attained level of education in most OECD countries: more adults (25-64 year-olds) have attained upper secondary education or post-secondary non-tertiary education as their highest level of education than have attained any other level of education (on average, about 44%). In Austria, the Czech Republic, Germany, Poland and the Slovak Republic, more than 60% of adults have attained this level of education as their highest level of attainment (Table 1.2).
Upper secondary education across OECD countries is mainly divided into two types of programmes: i) programmes defined as “general” which are often designed for preparing students for further education, and ii) programmes geared towards vocational education and training (VET). The International Standard Classification of Education (ISCED-1997) defines VET as “education which is mainly designed to lead participants to acquire the practical skills, know-how and understanding necessary for employment in a particular occupation or trade or class of occupations or trades. Successful completion of such programmes leads to a

To what level have adults studied? CHAPTER 1
Education at a Glance Interim Report: Update of Employment and Educational Attainment Indicators © OECD 2015 13
labour-market relevant vocational qualification recognised by the competent authorities in the country in which it is obtained” (UNESCO, 1997).
There are substantial differences across OECD countries in the attainment of vocational qualifications. Overall, while at least one in two adults in Austria, the Czech Republic, Germany, Hungary, the Slovak Republic and Slovenia, have attained vocational upper secondary or post-secondary non-tertiary qualifications as the highest level of attainment, in Israel, Spain and Turkey, this proportion is less than one in ten (Table 1.2).
Chart 1.3. Percentage of the adult population whose highest level of education is upper secondary or post-secondary non-tertiary, by programme orientation and gender (2013)
25-64 year-olds
Note: Disaggregated information on vocational and general programmes is not available and it is therefore not displayed for the following countries: Argentina, Brazil, Chile, China, Colombia, India, Indonesia, Japan, Korea, Mexico, Norway, Poland, Portugal, Saudi Arabia, South Africa, the United Kingdom and the United States. 1. Year of reference 2012. Countries are ranked in ascending order of the proportion of adult women with upper secondary or post-secondary non-tertiary education as highest level of attainment. Source: OECD. Table 1.2. See Annex for notes (www.oecd.org/edu/eag.htm).
Chart 1.3 shows that vocational qualifications at the upper secondary or post-secondary non-tertiary level are more commonly found among men than among women. On average across OECD countries, about 37% of men and 31% of women hold this type of qualification. It is also more likely that men have an upper secondary or post-secondary non-tertiary qualification (either general or vocational) as their highest level of attainment compared with women: about 47% of men have this type of qualification whereas 42% of women do. In Australia, Estonia, Hungary, Iceland, Slovenia and the Russian Federation, the difference between the genders is much higher than the average – about 10 percentage points or more.

CHAPTER 1 To what level have adults studied?
14 Education at a Glance Interim Report: Update of Employment and Educational Attainment Indicators © OECD 2015
Only in Germany and Switzerland is the tendency different, and more women than men have an upper secondary qualification as their highest level of education attained (Table 1.2).
The percentages of younger adults in Mexico (23%) and Spain (24%) with an upper secondary or post-secondary non-tertiary education are lower than the percentages with below upper secondary or tertiary educations. In Spain, even the percentage of all adults with upper secondary or post-secondary non-tertiary education (22%) is lower than for other attainment levels. In Mexico, the majority of the young adult population (52%) does not reach upper secondary education and therefore their percentages with higher qualifications are lower. In Spain, 41% of younger adults have attained tertiary education, while 35% have not attained an upper secondary qualification. It seems that young Spanish adults who finish upper secondary education are more likely to continue into tertiary education (Table 1.4).
Tertiary attainment As mentioned above, at tertiary level the generational change between younger and older adults is significant. In OECD and partner countries, the share of younger adults with tertiary qualifications is higher than that of older adults with that type of qualification in all countries, with the sole exception of Israel. On average, the difference in attainment at this level is about 15 percentage points, and ranges from about two percentage points in Germany to more than 50 in Korea (Table 1.2).
Chart 1.4. Percentage of younger adults with tertiary education (2000 and 2013)
25-34 year-olds
Note: Data for Brazil, Colombia, Israel and the Russian Federation are not presented in this chart because data were not available for year 2000. Countries are ranked in descending order of the difference in the proportion of tertiary educated 25-34 year-olds in the year 2013 and the proportion of tertiary educated 25-34 year-olds in the year 2000. Source: OECD. Table 1.4. See Annex for notes (www.oecd.org/edu/eag.htm).
In addition, the gender gap in attainment rates is the opposite between the older and the younger generations. On average, a significantly higher proportion of 25-34 year-old women has attained tertiary education than is the case for men of the same age (46% and 35%

To what level have adults studied? CHAPTER 1
Education at a Glance Interim Report: Update of Employment and Educational Attainment Indicators © OECD 2015 15
respectively), while the opposite is true for 55-64 year-old women and men (24% and 26% respectively).
Chart 1.4 shows that from 2000 to 2013, on average, the percentage of younger adults with tertiary education increased by 14 percentage points. The increase was lowest in Finland and Germany (less than five percentage points) and 25 percentage points or more in Korea, Luxembourg and Poland (Table 1.4).
In Australia, Estonia, Ireland, Israel, Latvia, Luxembourg, Norway, Poland, Sweden and the United Kingdom, at least one in two young women (25-34 year-olds) has a tertiary education, and in Canada, Japan, Korea and the Russian Federation more than 60% have a tertiary education. The picture is quite different among young men however: only in Japan and Korea have more than one in two men attained a tertiary education (Table 1.3).
Overall, the data in this section show that higher education opportunities have expanded across OECD education systems in recent years. More and more individuals have completed higher levels of education. The human capital stock in OECD countries has constantly been growing since 2000 and has reached new peaks every year. This growth is mainly driven by higher levels of education among the young cohorts.
Definitions
Age groups: adults refers to 25-64 year-olds; younger adults refers to 25-34 year-olds; older adults refers to 55-64 year-olds.
Levels of education: below upper secondary corresponds to ISCED levels 0, 1, 2 and 3C short programmes; upper secondary or post-secondary non-tertiary corresponds to ISCED levels 3A, 3B, 3C long programmes, and ISCED level 4; and tertiary corresponds to ISCED levels 5A, 5B and 6. See the Reader's Guide for a presentation of all ISCED levels.
Methodology
Data on population and educational attainment for most countries are taken from OECD and Eurostat databases, which are compiled from National Labour Force Surveys by the OECD LSO (Labour Market, Economic and Social Outcomes of Learning) Network. Data on educational attainment for Argentina, China, Colombia, Indonesia, Saudi Arabia and South Africa are taken from the UNESCO Institute of Statistics (UIS) database on educational attainment of the population aged 25 and older.
Attainment profiles are based on the percentage of the population aged 25 to 64 that has successfully completed a specified level of education.
Most OECD countries include people without education (i.e. illiterate adults or people whose educational attainment does not fit national classifications) under the international classification ISCED 0 and therefore averages for ISCED 0/1 (i.e. pre-primary and primary education) are likely to be influenced.
CHAPTER 1 To what level have adults studied?
16 Education at a Glance Interim Report: Update of Employment and Educational Attainment Indicators © OECD 2015
Note regarding data from Israel
The statistical data for Israel are supplied by and are under the responsibility of the relevant Israeli authorities. The use of such data by the OECD is without prejudice to the status of the Golan Heights, East Jerusalem and Israeli settlements in the West Bank under the terms of international law.
References
UNESCO (1997), “International Standard Classification of Education: ISCED 1997”, www.unesco.org/education/information/nfsunesco/doc/isced_1997.htm.
Tables of Chapter 1
Only an extract of Table 1.1 is shown in this chapter. The full set of tables listed below is available at http://www.oecd.org/edu/Chapter1-TablesandCharts-IEAG2015web.xlsx.
Table 1.1 Educational attainment of 25-64 year-olds, by gender (2013)
Table 1.2 Adults with upper secondary education, by programme orientation and gender (2013)
Table 1.3 Percentage of adults who have attained tertiary education, by type of programme, age group and gender (2013)
Table 1.4 Trends in educational attainment, by gender, age group, and average annual growth rate (2000, 2005-13)

To what level have adults studied? CHAPTER 1
Education at a Glance Interim Report: Update of Employment and Educational Attainment Indicators © OECD 2015 17
Table 1.1. Educational attainment of 25-64 year-olds, by gender (2013)
Note: Due to the lack of information for several programmes, OECD and EU21 averages have not been calculated for each column individually. Columns showing data by gender are available for consultation at: http://www.oecd.org/edu/Chapter1-TablesandCharts-IEAG2015web.xlsx. 1. Year of reference 2003. 2. Year of reference 2010. 3. Year of reference 2011. 4. Year of reference 2012. Source: OECD. Argentina, China, Colombia, India, Indonesia, Saudi Arabia, South Africa: UNESCO Institute for Statistics. Latvia: Eurostat. See Annex for notes (www.oecd.org/edu/eag.htm). Please refer to the Reader's Guide for information concerning the symbols replacing missing data.
ISCED 3C (long pro-
gramme)/3B ISCED 3A Type B Type A
Advanced research pro-
grammes
(1) (2) (3) (4) (5) (6) (7) (8) (9)OECDAustralia 6 18 a 15 16 5 11 28 1Austria x(2) 16 1 46 5 11 7 14 x(8)Belgium 11 16 a 10 24 3 16 19 1Canada 3 8 a x(5) 25 11 25 28 x(8)Chile m m m m m m m m mCzech Republic n 7 a 38 35 x(5) x(8) 20 x(8)Denmark 5 19 a 41 1 n x(8) 33 1Estonia 1 9 a 14 31 7 13 24 1Finland 5 9 a a 44 1 13 27 1France 9 16 a 32 11 n 13 19 1Germany 3 10 a 47 3 11 8 17 1Greece 19 11 x(4) 7 27 8 9 18 nHungary 1 16 a 29 29 2 1 21 1Iceland 16 11 1 20 10 6 4 31 1Ireland 9 13 2 x(5) 22 14 15 25 1Israel 10 5 a 7 30 a 14 32 1Italy 9 32 n 8 33 1 n 16 nJapan x(5) x(5) x(5) x(5) 53 a 20 27 x(8)Korea 7 9 a x(5) 41 a 14 30 x(8)Luxembourg 7 8 4 15 21 3 13 26 2Mexico 38 24 a 5 15 a 1 18 x(8)Netherlands 7 17 x(4) 20 21 1 3 30 1New Zealand x(2) 21 8 7 14 16 8 26 1Norw ay n 17 a 27 12 4 2 37 1Poland x(2) 10 a 30 31 3 x(8) 26 x(8)Portugal 39 21 x(5) x(5) 20 1 x(8) 16 3Slovak Republic 1 8 x(4) 33 39 x(5) 1 18 nSlovenia 1 13 a x(5) 58 a 12 13 3Spain 15 29 a 9 13 n 10 23 1Sw eden 3 9 a x(5) 44 7 9 26 1Sw itzerland 3 9 2 38 5 6 12 25 3Turkey 53 12 a 9 10 a x(8) 16 x(8)United Kingdom n 9 12 30 8 a 10 31 1United States 4 7 x(5) x(5) 46 x(5) 11 32 2
OECD averageEU21 average
PartnersArgentina1 44 14 a x(5) 28 a x(8) 14 x(8)Brazil 38 15 x(5) x(5) 33 a x(8) 14 x(8)China2 35 43 a x(5) 14 5 x(8) 4 x(8)Colombia3 44 5 a x(5) 29 a 10 11 x(8)India m m m m m m m m mIndonesia3 56 16 a x(5) 21 a x(8) 8 x(8)Latvia 1 10 x(4) 3 47 8 2 29 nRussian Federation4 1 5 x(4) 19 21 x(4) 26 28 nSaudi Arabia 33 18 a x(5) 23 5 x(8) 21 x(8)South Africa4 26 14 a x(5) 47 7 x(8) 6 x(8)
G20 average m m m
22 48 3023 44 33
Below upper secondaryUpper secondary or post-secondary non-
tertiary Tertiary
Pre-primary and primary education
Lower secondary education
ISCED 3C (short
programme)
Upper secondary education Post-
secondary non-tertiary education
Tertiary education
Total (men + women)


How does educational attainment affect participation in the labour market? CHAPTER 2
Education at a Glance Interim Report: Update of Employment and Educational Attainment Indicators © OECD 2015 19
CHAPTER 2 HOW DOES EDUCATIONAL
ATTAINMENT AFFECT PARTICIPATION IN THE LABOUR
MARKET?
Educational attainment is frequently used as a measure of the skills available in the population and the labour force. The economies of OECD countries depend upon a sufficient supply of high-skilled workers. Due to the technological advances that have been transforming the needs of the global labour market, people with higher or specific skills are in strong demand.
Since 2000 there has been a contraction of the labour markets across most OECD countries. Employment rates have been decreasing among people with all levels of education and dropped on average about two percentage points between 2000 and 2013. Likewise, unemployment rates have been increasing in the same period at all levels of education: on average about two to four percentage points between 2000 and 2013 (Tables 2.2 and 2.4).
Yet in all OECD countries, as shown in Chart 2.1, people with high qualifications have the highest employment rates and in most countries, they also have the lowest risk of being unemployed. At the same time, people with the lowest educational qualifications are at greater risk of being unemployed or out of the labour market. Across OECD countries, employment rates are 83% for those with tertiary education, 73% for individuals with upper secondary or post-secondary non-tertiary education and 55% among people with qualifications below upper secondary education. Unemployment rates are 5.3% for individuals with tertiary education, 8.0% for those with upper secondary or post-secondary non-tertiary education and 13.7% for those with qualifications below upper secondary education (Tables 2.2 and 2.3).
Favourable employment prospects confirm the great value of attaining high levels of education: on average, 13.7% of adults with low qualifications are unemployed, while among those with tertiary qualifications only 5.3% are unemployed. For adults with below upper secondary education, the highest levels of unemployment rates are found in Greece, the Slovak Republic and Spain (above 25%) and for adults with tertiary qualifications, the highest unemployment rates are found in Greece and Spain (15% or more). These findings indicate that people with low educational attainment are at high risk of hampering their labour market prospects and self-sufficiency (Table 2.3).

CHAPTER 2 How does educational attainment affect participation in the labour market?
20 Education at a Glance Interim Report: Update of Employment and Educational Attainment Indicators © OECD 2015
Chart 2.1. Employment rates among adults, by educational attainment (2013)
25-64 year-olds
Note: Data for below upper secondary education are not available for Japan. 1. Year of reference 2012. 2. Year of reference 2011 Countries are ranked in ascending order of the employment rates of 25-64 year-olds with tertiary qualifications. Source: OECD. Table 2.2. See Annex for notes (www.oecd.org/edu/eag.htm).
Labour market outcomes, by educational attainment, gender and age group
Employment rates vary to some extent by age group, but are consistently lower for the older adults group. The proportion of 25-34 year-olds with upper secondary or post-secondary non-tertiary education who are employed is, on average, about 20 percentage points larger than that of 55-64 year-olds who have attained the same level of education (74% and 55%, respectively) (Table 2.2).
On the other hand, unemployment hits younger generations the hardest, and unemployment rates are higher among younger adults (25-34 year-olds) than among older adults (55-64 year-olds), for all levels of education. On average across OECD countries, about 10% of older adults who have not attained upper secondary education are unemployed compared with about 21% of younger adults with the same level of education. Similarly, 11% of younger adults with an upper secondary or post-secondary non-tertiary education are unemployed, compared to 7% of older adults with the same level of education. The gap between the two age groups is the smallest among tertiary-educated adults: about 8% of younger adults in this group are unemployed compared to about 4% of older adults (Table 2.4).
Gender differences are still marked across labour markets Employment outcomes vary according to gender across all OECD countries and education levels. On average, only 66% of women are employed compared with 80% of men. The gender gap in employment rates is the largest among adults with the lowest education levels: the gap

How does educational attainment affect participation in the labour market? CHAPTER 2
Education at a Glance Interim Report: Update of Employment and Educational Attainment Indicators © OECD 2015 21
is around 20 percentage points between men and women with below upper secondary education (65% for men and 45% for women); around 15 percentage points among men and women with an upper secondary or post-secondary non-tertiary education (80% for men and 66% for women); and around 10 percentage points between men and women with a tertiary education (88% for men and 79% for women). The gap between men’s and women’s employment rates narrows as educational attainment increases. Yet, employment rates among tertiary-educated women across OECD countries are still considerably lower than those of men, even though a higher proportion of women hold tertiary education credentials (Tables 1.1 and 2.1).
Chart 2.2. Employment and attainment rates among younger adults with tertiary education, by gender (2013)
25-34 year-olds
1. Year of reference 2012. 2. Year of reference 2011. Countries are ranked in descending order of employment rates of 25-34 year-old women with tertiary qualifications. Source: OECD. Tables 1.3 and 2.2. See Annex for notes (www.oecd.org/edu/eag.htm).
Chart 2.2 shows that in the majority of OECD countries, 25-34 years-old women have consistently higher attainment rates at the tertiary level compared with men of the same age (right panel), while in all countries except for the Netherlands, they have lower employment rates (left panel). For 25-64 year-old adults, employment rates for tertiary educated women can be more than 10 percentage points lower than men with the same level of education in Australia, Colombia, Greece, Hungary, Japan, Korea, Latvia, Mexico, the Slovak Republic, the Russian Federation and the United States, and up to 20 percentage points Turkey (Tables 1.3 and 2.2).
Gender differences in unemployment rates are, on average, less pronounced than they are in employment rates. This shows that gender differences in employment could be a result of more women being outside the labour force, probably due to traditional roles in regards to
CHAPTER 2 How does educational attainment affect participation in the labour market?
22 Education at a Glance Interim Report: Update of Employment and Educational Attainment Indicators © OECD 2015
the family unit (for instance, mothers staying at home, especially in countries with larger gender gaps in relation to wages and with limited offers of childcare facilities). Among adults with below upper secondary education, unemployment rates are very similar for women and men on average across OECD countries (13.7% for women and 14.1% for men). Among adults who have an upper secondary or post-secondary non-tertiary education, unemployment rates are higher among women than among men (9.0% for women and 7.6% for men). This is true, too, among tertiary-educated adults, where the unemployment rate is 4.9% for men and 5.7% for women (Table 2.3).
Labour market outcomes among those with low qualifications
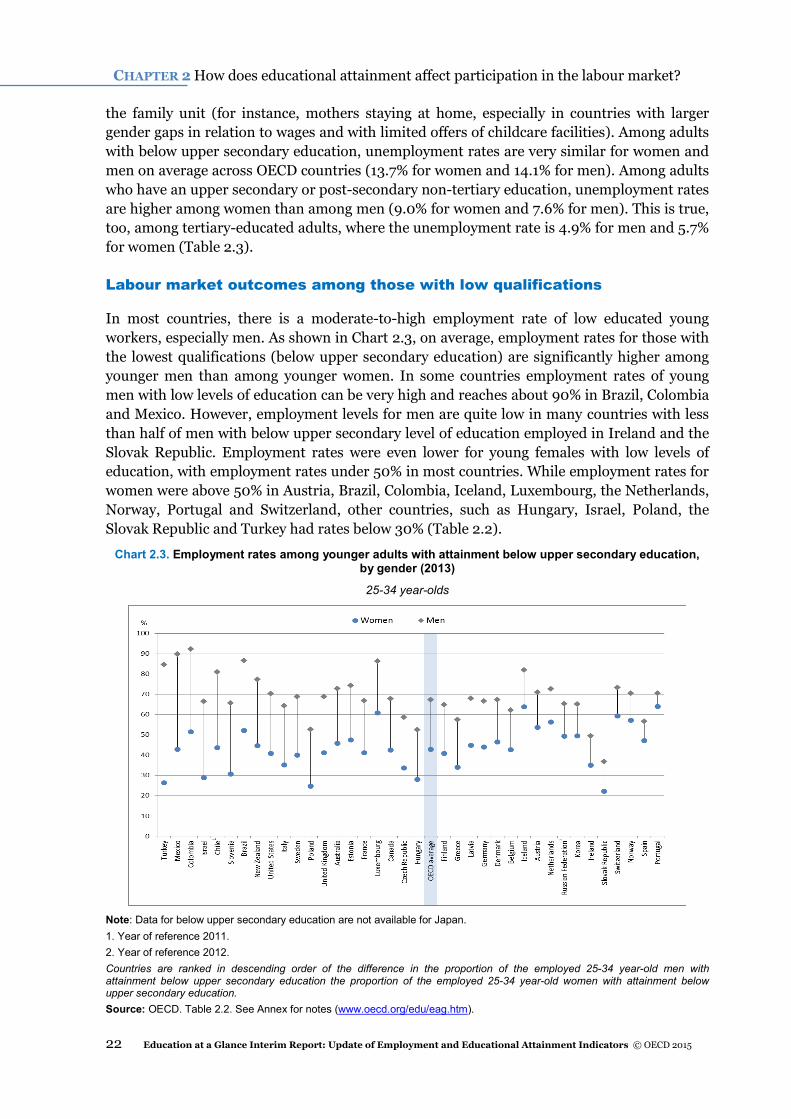
In most countries, there is a moderate-to-high employment rate of low educated young workers, especially men. As shown in Chart 2.3, on average, employment rates for those with the lowest qualifications (below upper secondary education) are significantly higher among younger men than among younger women. In some countries employment rates of young men with low levels of education can be very high and reaches about 90% in Brazil, Colombia and Mexico. However, employment levels for men are quite low in many countries with less than half of men with below upper secondary level of education employed in Ireland and the Slovak Republic. Employment rates were even lower for young females with low levels of education, with employment rates under 50% in most countries. While employment rates for women were above 50% in Austria, Brazil, Colombia, Iceland, Luxembourg, the Netherlands, Norway, Portugal and Switzerland, other countries, such as Hungary, Israel, Poland, the Slovak Republic and Turkey had rates below 30% (Table 2.2).
Chart 2.3. Employment rates among younger adults with attainment below upper secondary education, by gender (2013)
25-34 year-olds
Note: Data for below upper secondary education are not available for Japan. 1. Year of reference 2011. 2. Year of reference 2012. Countries are ranked in descending order of the difference in the proportion of the employed 25-34 year-old men with attainment below upper secondary education the proportion of the employed 25-34 year-old women with attainment below upper secondary education. Source: OECD. Table 2.2. See Annex for notes (www.oecd.org/edu/eag.htm).

How does educational attainment affect participation in the labour market? CHAPTER 2
Education at a Glance Interim Report: Update of Employment and Educational Attainment Indicators © OECD 2015 23
While there are still employment prospects for low qualified workers across OECD labour markets, unemployment among people with low qualifications increased every year between 2000 and 2013 in some of the countries. For example in Greece, Iceland, Ireland, Luxembourg, Mexico, the Netherlands and Portugal, the average annual growth rate (between 2000 and 2013) of unemployment among all adults with low qualifications is more than 7%. With the exceptions of Iceland and Mexico, all these countries have unemployment rates for adults with low qualifications that are at least 8% and well above each national unemployment rate average (Tables 2.3 and 2.4).
The risk to be unemployed is also higher and continues to rise among the youngest. Comparing younger (25-34 year-olds) with older (55-64 year-olds) adults, the highest employment rates for workers with low qualifications are found among the younger group (56% for younger adults and 41% for older adults) and the highest unemployment rates are also found among this age group (20.6% for younger adults and 10.2% for older adults). In the Slovak Republic the unemployment rate among low qualified younger adults is over 50% (Tables 2.2 and 2.4).
However, trend data shows that some countries with high unemployment rates among younger adults are seeing improvements. In Israel and Poland, employment rates for younger adults (25-34 year-olds) with less than an upper secondary education are low and at or below the OECD average for both men and women, but between 2000 and 2013 the unemployment rates among these populations have been decreasing (-2.6% per year and -0.7% per year on average, respectively). Strong decreases in unemployment rates among low qualified workers can be seen also in countries which already have relatively high employment rates like Estonia (-4.8% per year) and Norway (-5.1% per year). Yet, as in Israel and Poland, in all these countries the share of the population with low qualifications has been constantly decreasing (Table 2.4).
Differences in labour market outcomes by programme orientation at upper secondary level
Higher levels of attainment come with a qualitative change in labour market outcomes. People with upper secondary education have lower unemployment rates (8%) and higher employment rates (73%) than people with a lower level of education. However, in some countries highly affected by the economic crisis, like Greece and Spain, unemployment rates among the adult population with only upper secondary education were above 20% (Tables 2.2 and 2.4).
Some of the labour market outcomes of the population with upper secondary education vary according to the type of programme attained. As shown in Chart 2.4, in most countries employment rates are higher among adults with upper secondary vocational qualifications (75% on average) than among those with general qualifications (69% on average). The difference may be explained, at least in part, by the fact that people that study non-vocational tracks generally pursue education at the next education level, while those who study vocational tracks at the upper secondary level generally enter the labour market once they have obtained this qualification. The same caution should be taken when assessing unemployment rates as they are measured among those in the labour force who are actively looking for a job (which excludes most students) and therefore the size of the population with each type of qualification and actively searching for a job can vary to an important extent (Table 2.5).

CHAPTER 2 How does educational attainment affect participation in the labour market?
24 Education at a Glance Interim Report: Update of Employment and Educational Attainment Indicators © OECD 2015
Chart 2.4. Employment rates of the adult population whose highest level of education is upper secondary or post-secondary non-tertiary, by programme orientation (2013)
25-64 year-olds
Note: Disaggregated information on vocational and general programmes is not available and it is therefore not displayed for the following countries: Brazil, Colombia, Japan, Korea, Mexico, Norway, Poland, Portugal, the United Kingdom and the United States. 1. Year of reference 2011. 2. Year of reference 2012. Countries are ranked in ascending order of the proportion of employed adults with an upper secondary education with vocational orientation as highest level of attainment. Source: OECD. Table 2.5. See Annex for notes (www.oecd.org/edu/eag.htm).
In some VET systems, school-based learning is widely combined with workplace learning. Examples of this type of “dual system” can be found in Austria, Germany, Luxembourg, the Netherlands and Switzerland. One of the strengths of this practice is that it forms a series of public-private partnerships, allowing social partners and employers to get involved in the development of VET programmes, often including the definition of curricular frameworks. Combining school-based and workplace learning in an integrated formal education and encouraging the active participation of the interested parties and stakeholders supports the incorporation of VET students into the labour market (OECD, 2013).
Across countries, unemployment rates vary depending on whether the upper secondary qualification is general or vocational. Among people whose highest level of attainment is upper secondary education, 8.6% of those who pursued a vocational programme are unemployed while 9.5% of those who pursued a general programme are unemployed (Table 2.5).
In some countries with more developed upper secondary VET systems the differences in unemployment rates are nonetheless more marked: in Denmark, Luxembourg, Latvia and Slovenia, unemployment rates are higher for people without upper secondary vocational qualifications, by more than three percentage points. Conversely, in Greece and Ireland, the

How does educational attainment affect participation in the labour market? CHAPTER 2
Education at a Glance Interim Report: Update of Employment and Educational Attainment Indicators © OECD 2015 25
opposite can be observed and unemployment rates among people with upper secondary general qualifications are about four percentage points lower.
Labour market outcomes among those with tertiary qualifications
Across the OECD, tertiary educated adults have the best outcomes in the labour market. On average, 83% of all tertiary educated adults were employed and 5.3% were unemployed. Employment rates among tertiary educated adults are also higher than among adults with upper secondary vocational qualifications, in all countries for which information is available; the employment rate across OECD countries is 75% for adults with a vocational upper secondary qualification and 83% for adults with a tertiary qualification. Only in a few countries are the differences in rates between the two types of qualifications small and comparable – employment rates among adults with upper secondary VET qualifications are lower by less than three percentage points in Australia, Canada, Iceland and New Zealand (Tables 2.1, 2.2, 2.3 and 2.5).
Unemployment rates for those with tertiary education are generally lower than for people with lower credentials: the OECD average is 13.7% for adults without upper secondary education and 5.3% for adults with tertiary education. However, unemployment rates can still be quite high among younger adults with a tertiary qualification in some countries such as Greece (33.1%), Italy (16.0%), Portugal (18.4%), Slovenia (10.8%), Spain (20.8%) and Turkey (11.1%). Also, younger adults with tertiary education have higher unemployment rates than older adults with comparable qualifications: the OECD average is 7.7% for 25-34 year-olds and 4.2% for 55-64 year-olds (Table 2.4).
Chart 2.5. Unemployment rates among younger adults with tertiary education, by gender (2013) 25-34 year-olds
1. Year of reference 2011. 2. Year of reference 2012. Countries are ranked in descending order of the difference in the proportion of unemployed 25-34 year-old women with tertiary education and the proportion of unemployed 25-34 year-old men with tertiary education. Source: OECD. Table 2.4. See Annex for notes (www.oecd.org/edu/eag.htm).

CHAPTER 2 How does educational attainment affect participation in the labour market?
26 Education at a Glance Interim Report: Update of Employment and Educational Attainment Indicators © OECD 2015
As shown in Chart 2.5, tertiary educated young women are more likely to be unemployed than men of the same age and with the same qualifications. On average, 8.3% of tertiary educated younger women are unemployed compared to 7.3% of younger men. There are exceptions to this in Canada, Estonia, France, Ireland, Japan, Korea, Luxembourg, Mexico, the Netherlands, Switzerland, the United Kingdom and the United States, where unemployment rates are somewhat lower for tertiary educated younger women than men (Tables 2.2 and 2.4).
In a few countries, unemployment rates are higher among tertiary educated adults than among those with education below upper secondary level. For example, in Mexico unemployment rates increase as education levels increase. The unemployment rate is higher for the tertiary educated compared with those lacking an upper secondary education. This is the case among all adults (5.2% and 3.8%, respectively) as among older (3.7% and 2.7%, respectively) and younger Mexican adults (7.7% and 5.0%, respectively), the latter being the hardest hit by unemployment. In Mexico, the highest unemployment rates across all levels of education are those for the tertiary educated 25-34 year-old men (7.9%) (Table 2.4).
Definitions
Active population (labour force) is the total number of employed and unemployed persons, in accordance with the definition in the Labour Force Survey.
Age groups: adults refers to 25-64 year-olds; younger adults refers to 25-34 year-olds; and older adults refers to 55-64 year-olds. The working-age population is the total population aged 25 to 64.
Employed individuals are those who, during the survey reference week: i) work for pay (employees) or profit (self-employed and unpaid family workers) for at least one hour; or ii) have a job but are temporarily not at work (through injury, illness, holiday, strike or lock-out, educational or training leave, maternity or parental leave, etc.).
The employment rate refers to the number of persons in employment as a percentage of the working-age population (the number of employed people is divided by the number of all working-age people). Employment rates by gender, age, educational attainment, programme orientation and age groups are calculated within each of these categories; for example the employment rate among women is calculated by dividing the number of employed women by the total number of working-age women.
Inactive individuals are those who are, during the survey reference week, neither employed nor unemployed, i.e. individuals who are not looking for a job. The number of inactive individuals is calculated by subtracting the number of active people (labour force) from the number of all working-age people.
The inactive rate refers to inactive persons as a percentage of the population (i.e. the number of inactive people is divided by the number of all working-age people). Inactive rates by gender, age, educational attainment, programme orientation and age groups are calculated within each of these categories; for example, the inactive rate among individuals with a tertiary education degree is calculated by dividing the number of inactive individuals with tertiary education by the total number of working-age people with tertiary education.
Levels of education: Below upper secondary education level corresponds to ISCED levels 0, 1, 2 and 3C short programmes. Upper secondary or post-secondary non-tertiary education level corresponds to ISCED levels 3C long programmes, and levels 3B,

How does educational attainment affect participation in the labour market? CHAPTER 2
Education at a Glance Interim Report: Update of Employment and Educational Attainment Indicators © OECD 2015 27
3A and 4. Tertiary education corresponds to ISCED levels 5B, 5A and 6. See the Reader's Guide for a presentation of all ISCED levels.
The unemployment rate refers to unemployed persons as a percentage of the labour force (i.e. the number of unemployed people is divided by the sum of employed and unemployed people). Unemployment rates by gender, age, educational attainment, programme orientation and age groups are calculated within each of these categories; for example, the unemployment rate among women is calculated by dividing the number of unemployed women by the total number of women who are active in the labour force.
Unemployed individuals are those who are, during the survey reference week, without work (i.e. neither had a job nor were at work for one hour or more in paid employment or self-employment), actively seeking employment (i.e. had taken specific steps during the four weeks prior to the reference week to seek paid employment or self-employment), and currently available to start work (i.e. were available for paid employment or self-employment before the end of the two weeks following the reference week).
Methodology
Data on population, educational attainment and labour-market status for most countries are taken from OECD and Eurostat databases, which are compiled from National Labour Force Surveys by the OECD LSO (Labour Market, Economic and Social Outcomes of Learning) Network.
Note regarding data from Israel
The statistical data for Israel are supplied by and are under the responsibility of the relevant Israeli authorities. The use of such data by the OECD is without prejudice to the status of the Golan Heights, East Jerusalem and Israeli settlements in the West Bank under the terms of international law.
References
OECD (2013), “Does Upper Secondary Vocational Education and Training Improve the Prospects of Young Adults?" Education Indicators in Focus, No. 17, OECD Publishing, Paris, http://dx.doi.org/10.1787/5jzbb2st885l-en.
Tables of Chapter 2
Only extracts of Tables 2.1 and 2.3 are shown in this chapter. The full set of tables listed below is available at http://www.oecd.org/edu/Chapter2-TablesandCharts-IEAG2015web.xlsx.
Table 2.1 Employment rates, by educational attainment and gender (2013)
Table 2.2 Trends in employment rates, by educational attainment, gender and age group (2000, 2005-13)
Table 2.3 Unemployment rates, by educational attainment and gender (2013)
Table 2.4 Trends in unemployment rates, by educational attainment, gender and age group (2000, 2005-13)
Table 2.5 Distribution of adults with upper secondary or post-secondary non-tertiary education, by labour market status and programme orientation (2013)
CHAPTER 2 How does educational attainment affect participation in the labour market?
28 Education at a Glance Interim Report: Update of Employment and Educational Attainment Indicators © OECD 2015
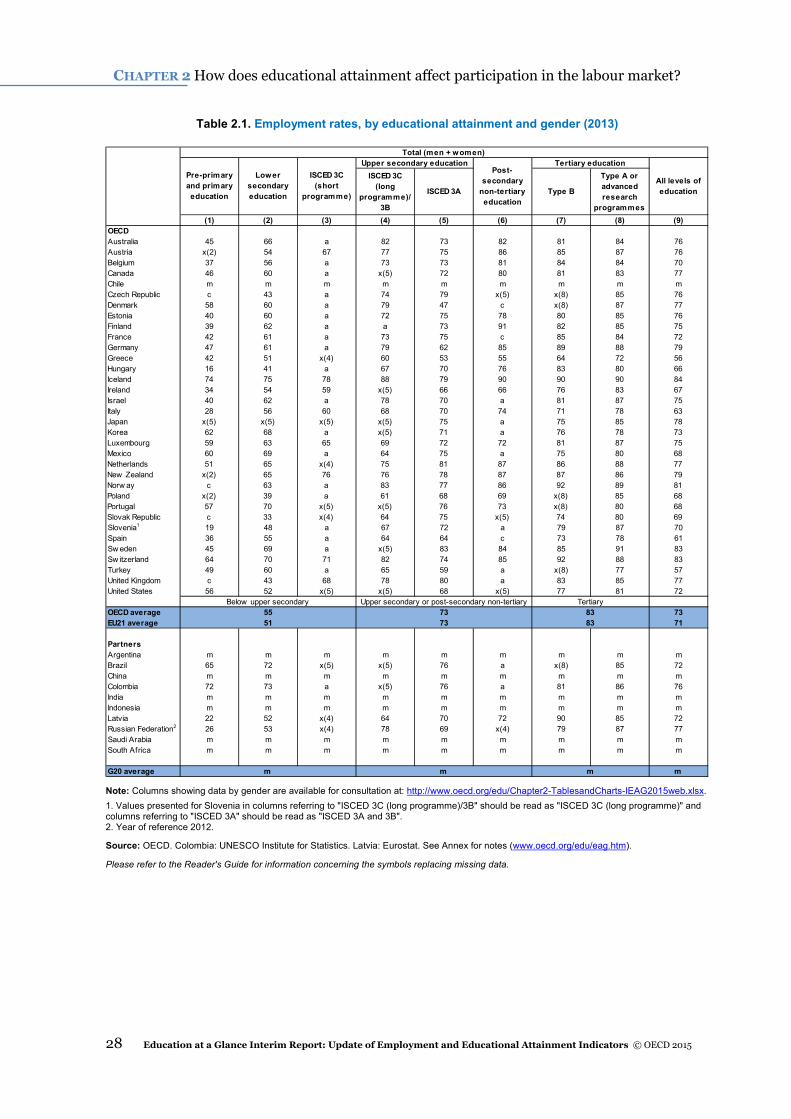
Table 2.1. Employment rates, by educational attainment and gender (2013)
Note: Columns showing data by gender are available for consultation at: http://www.oecd.org/edu/Chapter2-TablesandCharts-IEAG2015web.xlsx. 1. Values presented for Slovenia in columns referring to "ISCED 3C (long programme)/3B" should be read as "ISCED 3C (long programme)" and columns referring to "ISCED 3A" should be read as "ISCED 3A and 3B". 2. Year of reference 2012.
Source: OECD. Colombia: UNESCO Institute for Statistics. Latvia: Eurostat. See Annex for notes (www.oecd.org/edu/eag.htm).
Please refer to the Reader's Guide for information concerning the symbols replacing missing data.
ISCED 3C (long
programme)/3B
ISCED 3A Type B
Type A or advanced research
programmes(1) (2) (3) (4) (5) (6) (7) (8) (9)
OECDAustralia 45 66 a 82 73 82 81 84 76Austria x(2) 54 67 77 75 86 85 87 76Belgium 37 56 a 73 73 81 84 84 70Canada 46 60 a x(5) 72 80 81 83 77Chile m m m m m m m m mCzech Republic c 43 a 74 79 x(5) x(8) 85 76Denmark 58 60 a 79 47 c x(8) 87 77Estonia 40 60 a 72 75 78 80 85 76Finland 39 62 a a 73 91 82 85 75France 42 61 a 73 75 c 85 84 72Germany 47 61 a 79 62 85 89 88 79Greece 42 51 x(4) 60 53 55 64 72 56Hungary 16 41 a 67 70 76 83 80 66Iceland 74 75 78 88 79 90 90 90 84Ireland 34 54 59 x(5) 66 66 76 83 67Israel 40 62 a 78 70 a 81 87 75Italy 28 56 60 68 70 74 71 78 63Japan x(5) x(5) x(5) x(5) 75 a 75 85 78Korea 62 68 a x(5) 71 a 76 78 73Luxembourg 59 63 65 69 72 72 81 87 75Mexico 60 69 a 64 75 a 75 80 68Netherlands 51 65 x(4) 75 81 87 86 88 77New Zealand x(2) 65 76 76 78 87 87 86 79Norw ay c 63 a 83 77 86 92 89 81Poland x(2) 39 a 61 68 69 x(8) 85 68Portugal 57 70 x(5) x(5) 76 73 x(8) 80 68Slovak Republic c 33 x(4) 64 75 x(5) 74 80 69Slovenia1 19 48 a 67 72 a 79 87 70Spain 36 55 a 64 64 c 73 78 61Sw eden 45 69 a x(5) 83 84 85 91 83Sw itzerland 64 70 71 82 74 85 92 88 83Turkey 49 60 a 65 59 a x(8) 77 57United Kingdom c 43 68 78 80 a 83 85 77United States 56 52 x(5) x(5) 68 x(5) 77 81 72
OECD average 73EU21 average 71
PartnersArgentina m m m m m m m m mBrazil 65 72 x(5) x(5) 76 a x(8) 85 72China m m m m m m m m mColombia 72 73 a x(5) 76 a 81 86 76India m m m m m m m m mIndonesia m m m m m m m m mLatvia 22 52 x(4) 64 70 72 90 85 72Russian Federation2 26 53 x(4) 78 69 x(4) 79 87 77Saudi Arabia m m m m m m m m mSouth Africa m m m m m m m m m
G20 average m
Tertiary education
mm m
Tertiary83
Below upper secondary Upper secondary or post-secondary non-tertiary5551 73 83
Pre-primary and primary education
Lower secondary education
ISCED 3C (short
programme)
Upper secondary education
73
Post-secondary
non-tertiary education
All levels of education
Total (men + women)
How does educational attainment affect participation in the labour market? CHAPTER 2
Education at a Glance Interim Report: Update of Employment and Educational Attainment Indicators © OECD 2015 29
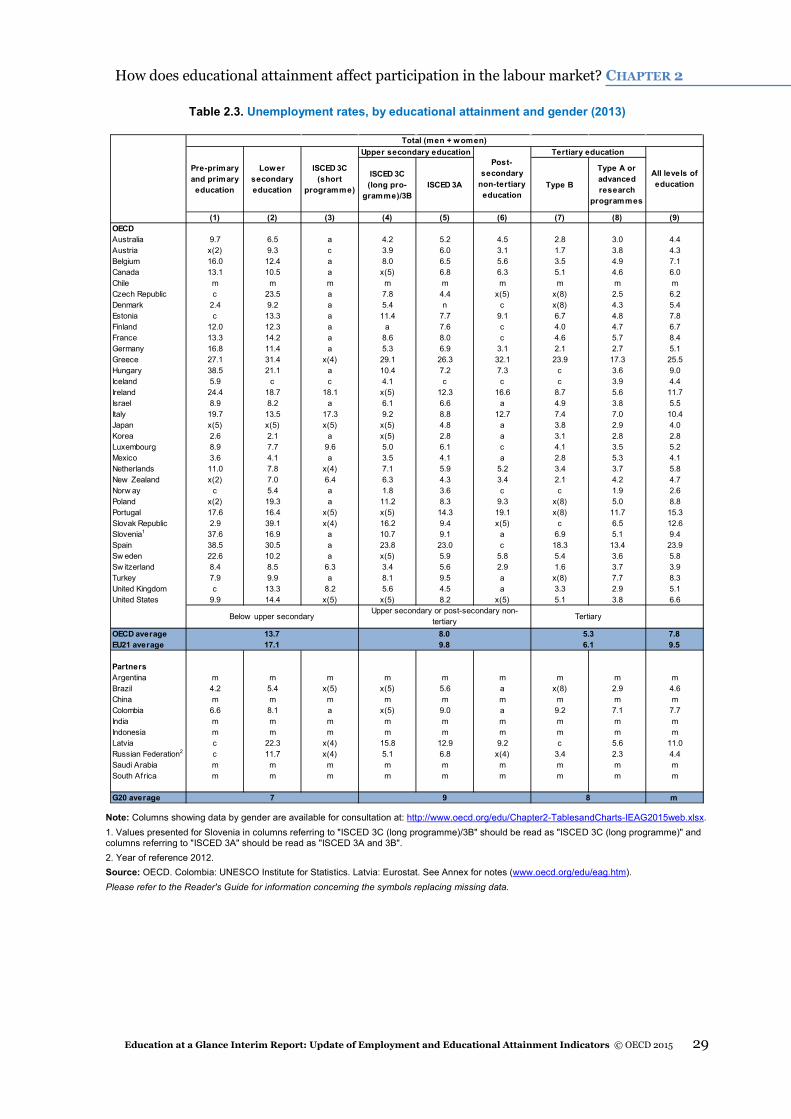
Table 2.3. Unemployment rates, by educational attainment and gender (2013)
Note: Columns showing data by gender are available for consultation at: http://www.oecd.org/edu/Chapter2-TablesandCharts-IEAG2015web.xlsx. 1. Values presented for Slovenia in columns referring to "ISCED 3C (long programme)/3B" should be read as "ISCED 3C (long programme)" and columns referring to "ISCED 3A" should be read as "ISCED 3A and 3B". 2. Year of reference 2012. Source: OECD. Colombia: UNESCO Institute for Statistics. Latvia: Eurostat. See Annex for notes (www.oecd.org/edu/eag.htm). Please refer to the Reader's Guide for information concerning the symbols replacing missing data.
ISCED 3C (long pro-
gramme)/3B ISCED 3A Type B
Type A or advanced research
programmes
(1) (2) (3) (4) (5) (6) (7) (8) (9)OECDAustralia 9.7 6.5 a 4.2 5.2 4.5 2.8 3.0 4.4Austria x(2) 9.3 c 3.9 6.0 3.1 1.7 3.8 4.3Belgium 16.0 12.4 a 8.0 6.5 5.6 3.5 4.9 7.1Canada 13.1 10.5 a x(5) 6.8 6.3 5.1 4.6 6.0Chile m m m m m m m m mCzech Republic c 23.5 a 7.8 4.4 x(5) x(8) 2.5 6.2Denmark 2.4 9.2 a 5.4 n c x(8) 4.3 5.4Estonia c 13.3 a 11.4 7.7 9.1 6.7 4.8 7.8Finland 12.0 12.3 a a 7.6 c 4.0 4.7 6.7France 13.3 14.2 a 8.6 8.0 c 4.6 5.7 8.4Germany 16.8 11.4 a 5.3 6.9 3.1 2.1 2.7 5.1Greece 27.1 31.4 x(4) 29.1 26.3 32.1 23.9 17.3 25.5Hungary 38.5 21.1 a 10.4 7.2 7.3 c 3.6 9.0Iceland 5.9 c c 4.1 c c c 3.9 4.4Ireland 24.4 18.7 18.1 x(5) 12.3 16.6 8.7 5.6 11.7Israel 8.9 8.2 a 6.1 6.6 a 4.9 3.8 5.5Italy 19.7 13.5 17.3 9.2 8.8 12.7 7.4 7.0 10.4Japan x(5) x(5) x(5) x(5) 4.8 a 3.8 2.9 4.0Korea 2.6 2.1 a x(5) 2.8 a 3.1 2.8 2.8Luxembourg 8.9 7.7 9.6 5.0 6.1 c 4.1 3.5 5.2Mexico 3.6 4.1 a 3.5 4.1 a 2.8 5.3 4.1Netherlands 11.0 7.8 x(4) 7.1 5.9 5.2 3.4 3.7 5.8New Zealand x(2) 7.0 6.4 6.3 4.3 3.4 2.1 4.2 4.7Norw ay c 5.4 a 1.8 3.6 c c 1.9 2.6Poland x(2) 19.3 a 11.2 8.3 9.3 x(8) 5.0 8.8Portugal 17.6 16.4 x(5) x(5) 14.3 19.1 x(8) 11.7 15.3Slovak Republic 2.9 39.1 x(4) 16.2 9.4 x(5) c 6.5 12.6Slovenia1 37.6 16.9 a 10.7 9.1 a 6.9 5.1 9.4Spain 38.5 30.5 a 23.8 23.0 c 18.3 13.4 23.9Sw eden 22.6 10.2 a x(5) 5.9 5.8 5.4 3.6 5.8Sw itzerland 8.4 8.5 6.3 3.4 5.6 2.9 1.6 3.7 3.9Turkey 7.9 9.9 a 8.1 9.5 a x(8) 7.7 8.3United Kingdom c 13.3 8.2 5.6 4.5 a 3.3 2.9 5.1United States 9.9 14.4 x(5) x(5) 8.2 x(5) 5.1 3.8 6.6
OECD average 7.8EU21 average 9.5
PartnersArgentina m m m m m m m m mBrazil 4.2 5.4 x(5) x(5) 5.6 a x(8) 2.9 4.6China m m m m m m m m mColombia 6.6 8.1 a x(5) 9.0 a 9.2 7.1 7.7India m m m m m m m m mIndonesia m m m m m m m m mLatvia c 22.3 x(4) 15.8 12.9 9.2 c 5.6 11.0Russian Federation2 c 11.7 x(4) 5.1 6.8 x(4) 3.4 2.3 4.4Saudi Arabia m m m m m m m m mSouth Africa m m m m m m m m m
G20 average m
All levels of education
Total (men + women)
Below upper secondaryUpper secondary or post-secondary non-
tertiary Tertiary
Pre-primary and primary education
Lower secondary education
ISCED 3C (short
programme)
Upper secondary educationPost-
secondary non-tertiary education
Tertiary education
17.1 9.8 6.113.7 8.0 5.3
7 9 8


Transition from school to work: Where are the 15-29 year-olds? CHAPTER 3
Education at a Glance Interim Report: Update of Employment and Educational Attainment Indicators © OECD 2015 31
CHAPTER 3 TRANSITION FROM SCHOOL TO WORK:
WHERE ARE THE 15-29 YEAR-OLDS?
The length and the quality of the schooling that individuals receive have an impact on students’ transition from education to work; as do labour-market conditions, the economic environment and demographics. For example, in some countries, young people traditionally complete schooling before they look for work; in others, education and employment are concurrent. In some countries, there is little difference between how young women and men experience their transitions from school to work, while in other countries, significant proportions of young women raise families full time after leaving the education system and do not enter employment.
The ageing of the population in OECD countries should favour employment among young people, as, theoretically, when older people leave the labour market their jobs are made available to the young. However, during recessionary periods, fewer job vacancies make the transition from school to work substantially more difficult for young people, as those with more work experience are favoured over new entrants into the labour market. When labour-market conditions are unfavourable, young people often tend to stay in education longer, because high unemployment rates drive down the opportunity costs of education. At the same time, most countries are adopting policies that raise the age of retirement. Delaying retirement slows job rotation, which tends to lead to a decrease in job vacancies. This may account for differences in the number of young people (entrants) and older people (leavers) in the labour market.
To improve the transition from school to work, regardless of the economic climate, education systems should aim to ensure that individuals have the skills that are needed in the labour market. During recessions, public investment in education could be a sensible way to counterbalance unemployment and invest in future economic growth by building the needed skills. In addition, public investment could be directed towards potential employers in the form of incentives to hire young people.
Expected years in education
In 2013, a typical 15-year-old in an OECD country could expect to spend about 7 additional years in formal education during the next 15 years. During these seven years in education he/she could expect to hold a job for two years (including work-study programmes) and be unemployed or inactive for 5 years. Almost eight years will therefore be spent not in education, of which he/she could expect to be employed for roughly five and a half years, to be unemployed for just over one year, and to be out of the labour force – that is, neither in

CHAPTER 3 Transition from school to work: Where are the 15-29 year-olds?
32 Education at a Glance Interim Report: Update of Employment and Educational Attainment Indicators © OECD 2015
education nor seeking work – for just over one year. There are large differences among countries: in Colombia, Mexico, Turkey, these young people spend an average of about five years in education, and in Denmark, Iceland, Luxembourg and Slovenia, they spend an average of nine years (Table 3.1).
In most countries, 15-year-old students are about to finish compulsory education and efforts have been made over the past decade to encourage their participation in education beyond this level. As a result, the average number of years of formal education expected after compulsory schooling has increased considerably. On average among OECD countries, since 2000, about one year has been added to the duration of formal education; in the Czech Republic, Luxembourg, the Netherlands, Portugal, Turkey and the Slovak Republic, two years and more have been added (Table 3.2).
In most countries, years spent in education are normally not combined with work; the only exceptions are Denmark, Iceland, the Netherlands and Switzerland, where young people spend an average of four years or more working (including work-study programmes) while studying. On average across OECD countries, students spend nearly two out of seven years in education working while studying (Table 3.1).
There are no large differences between the genders in expected years in education, but in general women are more time in education than men, with the exceptions of Germany, Ireland, Japan, Korea, Mexico, the Netherlands and Turkey. There are larger differences, in some countries, in the employment experience of those who have left education: in Mexico and Turkey, men work over three years more than women (Table 3.1).
Young people in education or not, and their labour market status
Young people tend to make the transition from education to the labour market between the ages of 15 and 29 years. As expected, the older individuals in this age band are less likely to be enrolled in educational institutions than the younger individuals. On average across OECD countries, the percentage of people in education by age group in 2013 was: about 87% of the 15-19 year-olds, 46% of the 20-24 year-olds and 16% of the 25-29 year-olds (Table 3.3).
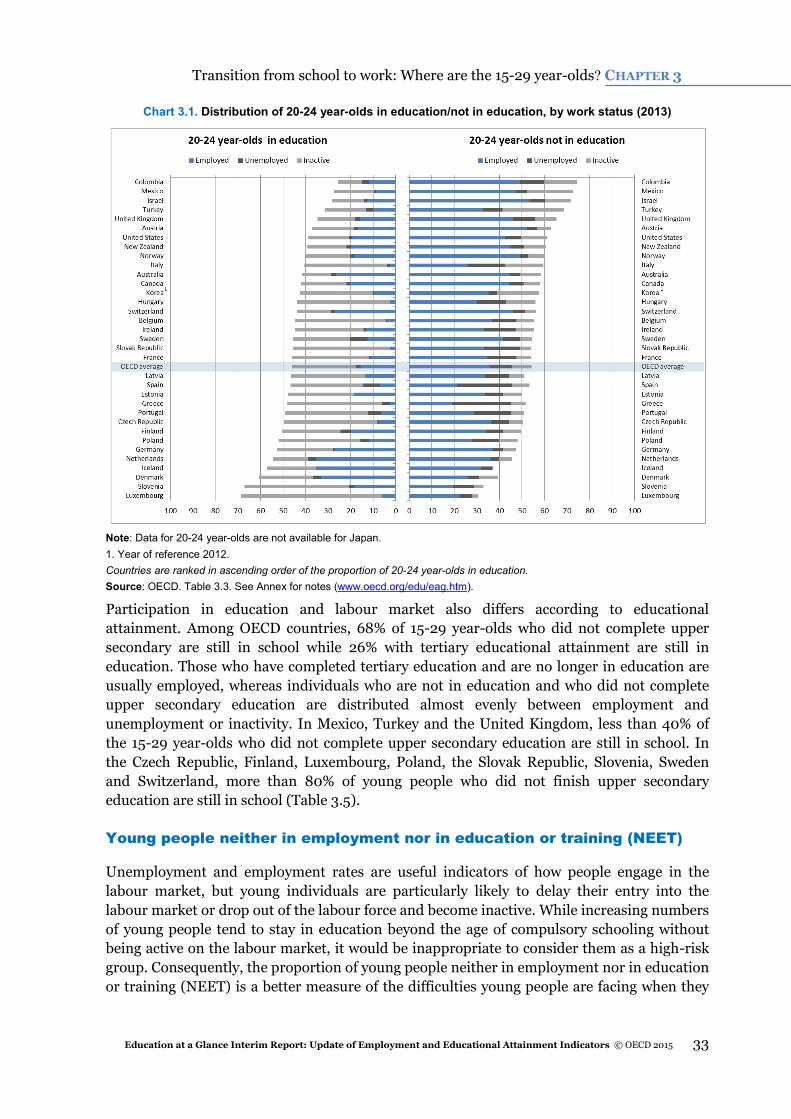
For those who are not in education (i.e. 13% of the 15-19 year-olds, 54% of the 20-24 year-olds and 84% of the 25-29 year-olds), it is important to note their situation in the labour market. Chart 3.1 shows that, on average, among all 20-24 year-olds, 36% are not in education and employed, about 9% are not in education and unemployed, and 9% are not in education and inactive (i.e. not employed and not looking actively for a job). The percentage of 20-24 year-olds not in education ranges from below 35% in Luxembourg and Slovenia to over 65% in Colombia, Israel, Mexico, Turkey and the United Kingdom. For this age group, studying and working at the same time is an option in many countries: over 20% of the 20-24 year-olds are studying and working in Australia, Canada, Denmark, Germany, Iceland, the Netherlands and Switzerland (Table 3.3).
Transition from school to work: Where are the 15-29 year-olds? CHAPTER 3
Education at a Glance Interim Report: Update of Employment and Educational Attainment Indicators © OECD 2015 33
Chart 3.1. Distribution of 20-24 year-olds in education/not in education, by work status (2013)
Note: Data for 20-24 year-olds are not available for Japan. 1. Year of reference 2012. Countries are ranked in ascending order of the proportion of 20-24 year-olds in education. Source: OECD. Table 3.3. See Annex for notes (www.oecd.org/edu/eag.htm). Participation in education and labour market also differs according to educational attainment. Among OECD countries, 68% of 15-29 year-olds who did not complete upper secondary are still in school while 26% with tertiary educational attainment are still in education. Those who have completed tertiary education and are no longer in education are usually employed, whereas individuals who are not in education and who did not complete upper secondary education are distributed almost evenly between employment and unemployment or inactivity. In Mexico, Turkey and the United Kingdom, less than 40% of the 15-29 year-olds who did not complete upper secondary education are still in school. In the Czech Republic, Finland, Luxembourg, Poland, the Slovak Republic, Slovenia, Sweden and Switzerland, more than 80% of young people who did not finish upper secondary education are still in school (Table 3.5).
Young people neither in employment nor in education or training (NEET)
Unemployment and employment rates are useful indicators of how people engage in the labour market, but young individuals are particularly likely to delay their entry into the labour market or drop out of the labour force and become inactive. While increasing numbers of young people tend to stay in education beyond the age of compulsory schooling without being active on the labour market, it would be inappropriate to consider them as a high-risk group. Consequently, the proportion of young people neither in employment nor in education or training (NEET) is a better measure of the difficulties young people are facing when they

CHAPTER 3 Transition from school to work: Where are the 15-29 year-olds?
34 Education at a Glance Interim Report: Update of Employment and Educational Attainment Indicators © OECD 2015
are searching for a job, as it includes not only those who do not manage to find a job (unemployed) but also those who do not actively seek employment (inactive).
The most important ages to look into when analysing the NEET population are 20-to 24 year-olds. At this age, compulsory education will not affect the proportion of inactive or unemployed. However, when analysing the proportion of NEET, it is important to realise that a significant proportion of 20-24 year-olds are still continuing their studies after compulsory education, therefore inflating the NEET denominator and consequently dragging down the proportion of NEET even if compulsory education is not covering this age group.
In 2013, Greece, Italy, Spain and Turkey were the only countries where more than 30% of the 20-24 year-olds were NEET. Turkey has the highest proportion of NEET, but it is also the only country among these 4 to show a decrease between 2005 and 2013, declining from 50% in 2005 to 36% in 2013 (Table 3.4).
Germany had a proportion of the 20-24 year-olds NEET that was above the OECD average in 2005 (19% against 18% for the OECD average), but showed significant progress in increasing the percentage of young people in education and/or employment. By 2013, the proportion of NEET was not only below the OECD average (10% against 18% for the OECD average), but it is also among the lowest levels observed among the OECD countries along with Iceland (9%), Luxembourg (8%), the Netherlands (10%) and Switzerland (10%) (Table 3.4).
Chart 3.2. Percentage of 20-24 year-olds neither in employment nor in education or training (NEET), by gender (2013)
Note: Data for 20-24 year-olds are not available for Japan. 1. Year of reference 2012. 2. Year of reference 2011. Countries are ranked in descending order of the difference in the proportion of NEET between young women and young men of 20-24 years old. Source: OECD. Table 3.3. See Annex for notes (www.oecd.org/edu/eag.htm).
In most countries the NEET situation is similar between men and women. However, when a difference is observed between genders, women generally have higher percentages. For example, there is more than 25 percentage points difference in the proportion of the NEET population between male and female 20-24 year-olds in Mexico and Turkey. The greatest

Transition from school to work: Where are the 15-29 year-olds? CHAPTER 3
Education at a Glance Interim Report: Update of Employment and Educational Attainment Indicators © OECD 2015 35
difference in favour of women is observed in Luxembourg where 5% of women are NEET whereas 12% of men are in the same situation. Chart 3.2 shows that there is no direct association between a country’s overall proportion of NEET and its gender gap. In Italy and Turkey the proportion of NEET for men and women combined is above 30%, however the gender gap is very large in Turkey while it is almost inexistent in Italy (Table 3.3).
Working hours
The extent to which 15-29 year-olds participate in the labour market not only varies in terms of employment, but it also varies in terms of intensity. As the transition between school and work will mostly happen among this age group, work intensity should be analysed separately between students and non-students. The latter mostly represents young people who recently finished their education and are available to work full-time, while students have to divide their time between work and school. The participation levels between these two groups are therefore very different; on one side students are showing lower levels of employment and lower number of hours worked, while on the other side non-students are showing higher employment levels and dedicate a greater number of hours to work.
Working and studying at the same time – finding a good balance The varying levels of employment among students of 15-29 years old can be explained by cultural, economic or social differences across countries. For instance, in some countries, students may wait until they finish their studies before looking for a job, while in other countries, young people may be more inclined to work during their studies to gain some experience on the labour market or to finance their studies (and/or other expenses). In the latter case, as work comes as a concomitant activity with education and learning, attention should be devoted to the intensity of work, making sure students have sufficient time to dedicate to their studies and that work does not become an obstacle to education.
While there is no clear international recommendation for the appropriate number of hours a student should work, studies have shown that the skills and the work experience students are gaining in the labour market can be beneficial for both the academic and the professional spheres. The combination of work and study can provide students the opportunity to try different jobs before fully entering the world of work. Employment can help students to gain financial independence from their parents, develop a sense of responsibility, enhance self-accomplishment and social integration, and develop knowledge and skills that will help them find work after their studies (Dundes and Marx, 2006; Murier, 2006; OECD, 2010).
Dundes and Marx (2006) demonstrated that students who worked between 10 and 19 hours per week had stronger academic performance than other students (working or not), showing that an optimal work-study balance provides structure and discipline that are harder to acquire if working too few or too many hours. Their results indicated that students who worked while attending educational programmes believed that employment forced them to become more efficient.

CHAPTER 3 Transition from school to work: Where are the 15-29 year-olds?
36 Education at a Glance Interim Report: Update of Employment and Educational Attainment Indicators © OECD 2015
Chart 3.3. Number of hours worked in a week, by 15-29 year-olds in education (2013)
Note: Countries for which the proportion of unknown is higher than 10% are not presented in this chart. 1. Hours worked are representing the actual number of hours worked per week, including overtime. When the actual number of hours worked per week could not be provided for a specific country, the usual hours worked were provided instead. The distribution is calculated based on the data presented in table 3.7. For example, in Turkey 7.4% of the 15-29 year-olds are in education and working and 5.7% of the 15-29 year-olds are in education and working 35 hours or more per week. The proportion shown in the graph for 35+ for Turkey is therefore 5.7% divided by 7.4% and multiplied by 100: 77%. 2. Respondents are classified as having worked zero hours if they did not work during the reference week while being in employment. 3. “Unknown” represents the 15-29 year-olds who are working and are in education for which the information on the number of hours worked could not be collected or published. 4. For Australia, the number of actual hours worked in a week was missing. Data on usual number of hours worked in a week were available and displayed here in place of the number of actual hours worked in a week. 5. Number of hours worked per week is provided for 10-35 hours in Denmark instead of 10-34 hours. Countries are ranked in descending order of the proportion of 15-29 year-olds in education who are working 35 hours per week or more. Source: OECD. Table 3.7. See Annex for notes (www.oecd.org/edu/eag.htm).
Chart 3.3 shows that in Latvia, Poland and Turkey, more than 60% of students who were employed worked 35 hours a week or more. Even if the overall proportion of students who worked was lower than the OECD average, there were still a significant number who worked full-time while studying even though these three countries had no work-study programmes (Tables 3.3 and 3.7).

Transition from school to work: Where are the 15-29 year-olds? CHAPTER 3
Education at a Glance Interim Report: Update of Employment and Educational Attainment Indicators © OECD 2015 37
Countries in which a large share of 15-29 year-olds were employed and studied at the same time usually showed low proportions of students working 35 hours or more per week. More than 25% of students were working in Denmark, Iceland and the Netherlands, but less than 20% of them worked 35 or more hours per week. The picture in Austria and Germany was different because of the prevalence of work-study programmes that represent about half of students in employment. In these 2 countries, about 1 in 5 young adults is studying and working at the same time in 2013, and about half of the individuals in this situation were working 35 hours per week or more. Thus, in a number of countries, the large proportion of students working long hours is part of an arrangement between school and future employers (Tables 3.3 and 3.7).
In the Czech Republic, Denmark, the Netherlands and Sweden about half and more of the 15-29 year-olds working during their studies in 2013 worked 9 hours or less per week. In Canada, Iceland and the United States, more than 50% of the employed students worked between 10 to 34 hours per week. Finally, in Greece, Hungary and Italy, the proportion of young people who were in education and in employment was below 5%, with most students working 10 hours or more per week (Table 3.7).
Seeking a full-time job when leaving school Cross national data collected through labour force surveys show that most young people take up a full-time job after finishing their studies, but in some countries such as the Netherlands and Sweden, there is a significant proportion of 15-29 year-olds who are not in education and who work less than 35 hours per week (48% and 44% respectively). Young people who work part-time without being in education can do so for different reasons. Some may decide to work part-time to accommodate family related tasks such as taking care of children or other family members, but others may want to work full-time but are unable to find a position (Table 3.7).
Charts 3.3 and 3.4 show that the proportion of full-time workers among students and non-students was highest in Latvia, Poland and Turkey. Less than a quarter of non-student workers were working 34 hours or less in 2013, indicating that in those countries no matter whether you are a student or not, either you are employed full-time or you are not employed at all (Table 3.7).

CHAPTER 3 Transition from school to work: Where are the 15-29 year-olds?
38 Education at a Glance Interim Report: Update of Employment and Educational Attainment Indicators © OECD 2015
Chart 3.4. Number of hours worked in a week, by 15-29 year-olds not in education (2013)
Note: Countries for which the proportion of unknown is higher than 10% are not presented in this chart. 1. Hours worked are representing the actual number of hours worked per week, including overtime. When the actual number of hours worked per week could not be provided for a specific country, the usual hours worked were provided instead. The distribution is calculated based on the data presented in table 3.7. For example, in Turkey 32.3% of the 15-29 year-olds are not education and working and 28.0% of the 15-29 year-olds are not education and working 35 hours or more per week. The proportion shown in the graph for 35+ for Turkey is therefore 28.0% divided by 32.3% and multiplied by 100: 87%. 2. Respondents are classified as having worked zero hours if they did not work during the reference week while being in employment. 3. “Unknown” represents the 15-29 year-olds who are working and are not in education for which the information on the number of hours worked could not be collected or published. 4. For Australia, the number of actual hours worked in a week was missing. Data on usual number of hours worked in a week were available and displayed here in place of the number of actual hours worked in a week. 5. Number of hours worked per week is provided for 10-35 hours in Denmark instead of 10-34 hours. Countries are ranked in descending order of the proportion of 15-29 year-olds not in education who are working 35 hours per week or more. Source: OECD. Table 3.7. See Annex for notes (www.oecd.org/edu/eag.htm).
Definitions
Employed individuals are those who, during the survey reference week: i) work for pay (employees) or profit (self-employed and unpaid family workers) for at least one hour; or

Transition from school to work: Where are the 15-29 year-olds? CHAPTER 3
Education at a Glance Interim Report: Update of Employment and Educational Attainment Indicators © OECD 2015 39
ii) have a job but are temporarily not at work (through injury, illness, holiday, strike or lock-out, educational or training leave, maternity or parental leave, etc.).
Inactive individuals are those who are, during the survey reference week, neither employed nor unemployed, i.e. individuals who are not looking for a job. The number of inactive individuals is calculated by subtracting the number of active people (labour force) from the number of all working-age people.
Hours worked: Hours worked is the number of hours actually worked, defined as the sum of all periods spent on direct and ancillary activities to produce goods and services. The number of hours actually worked covers all hours including extra hours regardless of whether they were paid or not. The reference period for the actual work would be the week of reference. Data on usual number of hours worked were used in the cases where the number of actual hours worked could not be collected.
Levels of education: below upper secondary corresponds to ISCED levels 0, 1, 2 and 3C short programmes; upper secondary or post-secondary non-tertiary corresponds to ISCED levels 3A, 3B, 3C long programmes, and ISCED level 4; and tertiary corresponds to ISCED levels 5A, 5B and 6. See the Reader's Guide for a presentation of all ISCED levels.
NEET: Neither in employment nor in education or training.
Unemployed individuals are those who are, during the survey reference week, without work (i.e. neither had a job nor were at work for one hour or more in paid employment or self-employment), actively seeking employment (i.e. had taken specific steps during the four weeks prior to the reference week to seek paid employment or self-employment), and currently available to start work (i.e. were available for paid employment or self-employment before the end of the two weeks following the reference week).
Methodology
Data on population, educational attainment and labour-market status for most countries are taken from OECD and Eurostat databases, which are compiled from National Labour Force Surveys by the OECD LSO (Labour Market, Economic and Social Outcomes of Learning) Network, and usually refer to the first quarter, or the average of the first three months of the calendar year. Some discrepancies may exist in the data collected. For example some countries may refer to all jobs instead of main job.
For Israel, the proportion of NEETs in 2013 is not comparable with data from 2011 and previous years. Conscripts in the army are considered to be employed in 2013, as opposed to 2011 and the previous year, when they were counted as not in the labour force.
Note regarding data from Israel
The statistical data for Israel are supplied by and are under the responsibility of the relevant Israeli authorities. The use of such data by the OECD is without prejudice to the status of the Golan Heights, East Jerusalem and Israeli settlements in the West Bank under the terms of international law.
CHAPTER 3 Transition from school to work: Where are the 15-29 year-olds?
40 Education at a Glance Interim Report: Update of Employment and Educational Attainment Indicators © OECD 2015
References
Dundes, L. and J. Marx (2006), “Balancing Work and Academics in College: Why Do Students Working 10 to 19 Hours per Week Excel?”, Journal of College Student Retention: Research, Theory and Practice, Vol. 8, No. 1.
Murier, T. (2006), “L’activité professionnelle des élèves et des étudiants : Une étude basée sur les résultats de l’enquête suisse sur la population active 1996-2005”, Actualité OFS, No. 3, Neuchâtel.
OECD (2010), Off to a Good Start? Jobs for Youth, OECD Publishing, Paris, http://dx.doi.org/10.1787/9789264096127-en.
Tables of Chapter 3
Only extracts of Tables 3.1 and 3.3 are shown in this chapter. The full set of tables listed below is available at http://www.oecd.org/edu/Chapter3-TablesandCharts-IEAG2015web.xlsx.
Table 3.1 Expected years in education/not in education from age 15 through 29, by work status and gender (2013)
Table 3.2 Trends in expected years in education/not in education for 15-29 year-olds, by gender (2000, 2005-2013)
Table 3.3 Percentage of 15-29 year-olds in education/not in education, by age group, work status and gender (2013)
Table 3.4 Trends in the percentage of 15-29 year-olds in education/not in education, employed or not, by age group and gender (2000, 2005-2013)
Table 3.5 Percentage of 15-29 year-olds in education/not in education, by educational attainment, work status and gender (2013)
Table 3.6 Trends in the percentage of 15-29 year-olds in education/not in education, employed or not, by educational attainment and gender (2006-2013)
Table 3.7 Percentage of 15-29 year-olds in education/not in education, by age group and number of hours worked (2013)
Table 3.8 Percentage of 15-29 year-olds in education/not in education, by educational attainment and number of hours worked (2013)

Transition from school to work: Where are the 15-29 year-olds? CHAPTER 3
Education at a Glance Interim Report: Update of Employment and Educational Attainment Indicators © OECD 2015 41
Table 3.1. Expected years in education/not in education from age 15 through 29, by work status and gender (2013)
Note: Columns showing data by gender are available for consultation at: http://www.oecd.org/edu/Chapter3-TablesandCharts-IEAG2015web.xlsx. 1. Students in work-study programmes are considered to be both in education and employed, irrespective of their labour market status according to the ILO definition. 2. Data refer to 15-24 year-olds. 3. Year of reference 2012. 4. OECD average excluding Japan and Korea. Source: OECD. Colombia: UNESCO Institute for Statistics. Latvia: Eurostat. See Annex for notes (www.oecd.org/edu/eag.htm). Please refer to the Reader's Guide for information concerning the symbols replacing missing data.
Unemployed or inactive
Employed (including
work-study programmes)1
Sub-total Employed Unemployed Inactive Sub-total
(1) (2) (3) (4) (5) (6) (7)OECDAustralia 3.1 3.6 6.7 6.3 0.6 1.3 8.3 Austria 4.0 2.8 6.8 6.7 0.6 0.8 8.2 Belgium 6.5 0.5 7.1 5.7 1.1 1.2 7.9 Canada 4.0 2.7 6.7 6.4 0.8 1.1 8.3 Chile m m m m m m m Czech Republic 5.6 1.5 7.0 6.0 0.9 1.1 8.0 Denmark 4.7 4.2 9.0 4.3 0.7 1.1 6.0 Estonia 5.4 1.8 7.2 5.6 0.9 1.3 7.8 Finland 5.8 2.5 8.3 4.9 0.8 1.1 6.7 France 6.0 1.1 7.1 5.5 1.4 1.0 7.9 Germany 4.9 3.0 7.9 5.6 0.6 0.8 7.1 Greece 6.8 0.3 7.1 3.6 3.3 1.0 7.9 Hungary 6.5 0.3 6.8 5.1 1.4 1.7 8.2 Iceland 3.7 5.0 8.7 5.1 0.7 0.5 6.3 Ireland 5.7 1.2 6.9 5.2 1.5 1.4 8.1 Israel 4.5 1.8 6.3 6.4 0.7 1.5 8.7 Italy 6.6 0.3 6.9 4.2 1.8 2.2 8.1 Japan2 m m m m m m m Korea3 6.2 0.8 7.0 5.3 0.4 2.3 8.0 Luxembourg 7.8 0.9 8.7 5.4 0.5 0.4 6.3 Mexico 4.2 1.2 5.4 6.3 0.6 2.8 9.6 Netherlands 3.3 4.8 8.2 5.5 0.5 0.8 6.8 New Zealand 4.3 2.5 6.8 6.1 0.8 1.3 8.2 Norw ay 4.5 2.3 6.8 6.9 0.5 0.9 8.2 Poland 6.2 1.1 7.3 5.1 1.3 1.2 7.7 Portugal 6.8 1.0 7.7 4.7 1.9 0.7 7.3 Slovak Republic 5.9 0.7 6.6 5.5 1.9 1.0 8.4 Slovenia 6.7 1.9 8.6 4.4 1.3 0.7 6.4 Spain 6.3 0.7 6.9 4.0 3.0 1.0 8.1 Sw eden 6.1 1.7 7.9 5.7 0.7 0.7 7.1 Sw itzerland 3.2 3.9 7.1 6.5 0.7 0.7 7.9 Turkey 4.4 1.1 5.5 4.8 1.0 3.7 9.5 United Kingdom 4.2 2.1 6.3 6.4 1.0 1.3 8.7 United States 4.7 2.1 6.8 5.8 0.8 1.6 8.2
OECD average4 5.2 2.0 7.2 5.5 1.1 1.2 7.8 EU21 average 5.8 1.6 7.4 5.2 1.3 1.1 7.6 PartnersArgentina m m m m m m m Brazil m m m m m m m China m m m m m m m Colombia 3.7 1.7 5.4 6.4 1.2 2.1 9.6 India m m m m m m m Indonesia m m m m m m m Latvia 5.6 1.2 6.8 5.8 1.3 1.1 8.2 Russian Federation m m m m m m m Saudi Arabia m m m m m m m South Africa m m m m m m m
G20 average m m m m m m m
Total (young men + young women)
Expected years in education Expected years not in education

CHAPTER 3 Transition from school to work: Where are the 15-29 year-olds?
42 Education at a Glance Interim Report: Update of Employment and Educational Attainment Indicators © OECD 2015
Table 3.3. Percentage of 15-29 year-olds in education/not in education, by age group, work status and gender (2013)
Note: Columns showing data by gender are available for consultation at: http://www.oecd.org/edu/Chapter3-TablesandCharts-IEAG2015web.xlsx. 1. Students in work-study programmes are considered to be both in education and employed, irrespective of their labour market status according to the ILO definition. 2. Young people neither in employment nor in education or training. 3. Year of reference 2012. 4. OECD average excluding Japan and Korea. Source: OECD. Colombia: UNESCO Institute for Statistics. Latvia: Eurostat. See Annex for notes (www.oecd.org/edu/eag.htm). Please refer to Reader's Guide for information concerning the symbols replacing missing data.
Students in work-
study pro-grammes1
Other employed
Un-employed Inactive
(1) (2) (3) (4) (5) (6) (7) (8) (9) (10) (11)OECDAustralia 24.1 3.5 20.6 2.6 18.2 44.8 42.2 13.0 4.0 9.0 55.2Austria 18.8 8.3 10.5 1.3 25.3 45.4 45.0 9.6 4.3 5.4 54.6Belgium 3.6 0.8 2.8 0.4 43.1 47.1 38.0 14.9 7.1 7.8 52.9Canada 17.8 a 17.8 2.7 24.3 44.7 42.8 12.4 5.2 7.3 55.3Chile m m m m m m m m m m mCzech Republic 9.9 5.5 4.4 0.4 36.6 46.9 39.8 13.2 5.8 7.5 53.1Denmark 28.2 a 28.2 3.5 28.0 59.7 28.5 11.7 4.4 7.3 40.3Estonia 11.8 a 11.8 1.4 34.8 47.9 37.3 14.8 6.3 8.5 52.1Finland 16.4 a 16.4 4.2 34.6 55.2 32.4 12.3 5.2 7.1 44.8France 7.0 a 7.0 0.7 39.6 47.3 36.3 16.3 9.6 6.8 52.7Germany 20.0 10.2 9.8 0.8 32.1 52.9 37.5 9.7 4.1 5.6 47.1Greece 1.8 a 1.8 2.2 43.2 47.2 24.3 28.5 21.7 6.7 52.8Hungary 2.0 a 2.0 0.3 43.4 45.6 33.9 20.5 9.2 11.3 54.4Iceland 33.6 a 33.6 2.8 21.6 58.0 34.1 7.9 4.4 3.5 42.0Ireland 8.1 a 8.1 0.8 37.4 46.3 34.4 19.2 9.9 9.3 53.7Israel 12.3 a 12.3 1.3 28.6 42.2 42.8 15.0 4.9 10.0 57.8Italy 2.1 0.2 1.9 1.0 42.8 46.0 27.9 26.1 11.7 14.4 54.0Korea3 5.3 a 5.3 0.4 40.7 46.5 35.0 18.5 2.9 15.6 53.5Luxembourg 5.7 a 5.7 0.7 51.6 57.9 36.0 6.1 3.4 2.6 42.1Mexico 8.0 a 8.0 0.7 27.1 35.8 41.9 22.3 3.8 18.5 64.2Netherlands 32.2 a 32.2 3.9 18.4 54.5 36.6 8.9 3.4 5.5 45.5New Zealand 16.4 a 16.4 3.1 25.6 45.0 40.9 14.1 5.2 9.0 55.0Norw ay 15.5 a 15.5 2.0 27.7 45.2 45.7 9.1 3.0 6.1 54.8Poland 7.5 a 7.5 1.8 39.6 48.9 34.2 17.0 8.7 8.3 51.1Portugal 6.4 a 6.4 4.6 40.6 51.6 31.1 17.3 12.6 4.7 48.4Slovak Republic 4.5 2.8 1.7 0.3 39.4 44.1 36.8 19.1 12.4 6.7 55.9Slovenia 12.7 a 12.7 1.7 42.8 57.2 29.6 13.2 8.8 4.4 42.8Spain 4.6 a 4.6 4.5 37.3 46.3 26.8 26.8 20.2 6.6 53.7Sw eden 11.6 a 11.6 6.8 34.0 52.3 38.3 9.4 5.0 4.4 47.7Sw itzerland 26.3 15.0 11.2 1.2 20.0 47.4 43.5 9.0 4.6 4.5 52.6Turkey 7.4 a 7.4 1.9 27.2 36.5 32.3 31.3 6.3 24.9 63.5United Kingdom 14.0 2.8 11.2 2.8 25.1 41.9 42.5 15.6 6.9 8.7 58.1United States 14.1 a 14.1 1.8 29.3 45.2 38.8 16.0 5.2 10.8 54.8
OECD average4 13.1 11.6 2.0 32.8 48.0 36.8 15.2 7.0 8.2 52.0EU21 average 10.9 9.4 2.1 36.6 49.6 34.6 15.7 8.6 7.1 50.4PartnersArgentina m m m m m m m m m m mBrazil m m m m m m m m m m mChina m m m m m m m m m m mColombia 11.1 m 11.1 2.4 22.5 36.0 42.4 21.6 7.9 13.7 64.0India m m m m m m m m m m mIndonesia m m m m m m m m m m mLatvia 8.2 a 8.2 1.5 35.8 45.5 38.7 15.8 8.6 7.2 54.5Russian Federation m m m m m m m m m m mSaudi Arabia m m m m m m m m m m mSouth Africa m m m m m m m m m m m
G20 average m m m m m m m m m m m
Employed NEET2
NEET2
Sub-total (employed
+ un-employed + inactive)
Total (young men + young women)In education Not in education
Employed
Employed
Un-employed Inactive
Sub-total (employed
+ un-employed + inactive)

Education at a Glance Interim ReportUpdate of Employment and Educational Attainment IndicatorsOECD INDICATORS
Education at a Glance: OECD Indicators is the authoritative source for accurate and relevant information on the state of education around the world. It provides data on the structure, finances, and performance of the education systems in the 34 OECD member countries, as well as a number of G20 and partner countries.
This publication is based on 2013 data collected in the first half of 2014 by the OECD-INES Network on Labour Market, Economic and Social Outcomes of Learning. It is an update of the series published in Education at a Glance 2014: OECD Indicators, released in September 2014, and will be followed by the publication of 2014 data in Education at a Glance 2015: OECD Indicators. This Education at a Glance Interim Report presents updated data on three major topics: educational attainment, labour market outcomes, and the transition from school to work.
The report as well as the tables and charts included in it are freely available via the OECD Education website at www.oecd.org/edu/eag.htm
Contents
Chapter 1. To what level have adults studied?
Chapter 2. How does educational attainment affect participation in the labour market?
Chapter 3. Transition from school to work: Where are the 15-29 year-olds?
Please cite this publication as:
OECD (2015), Education at a Glance Interim Report: Update of Employment and Educational Attainment Indicators, OECD, Paris, www.oecd.org/edu/EAG-Interim-report.pdf.
For further information please visit our websites: www.oecd.org/edu/eag.htm
www.oecd.org/edu/eag-interim-report.htm