“Educating Girls for a Technological Future” Contents Principal's message 4 P&C and/or School...
24
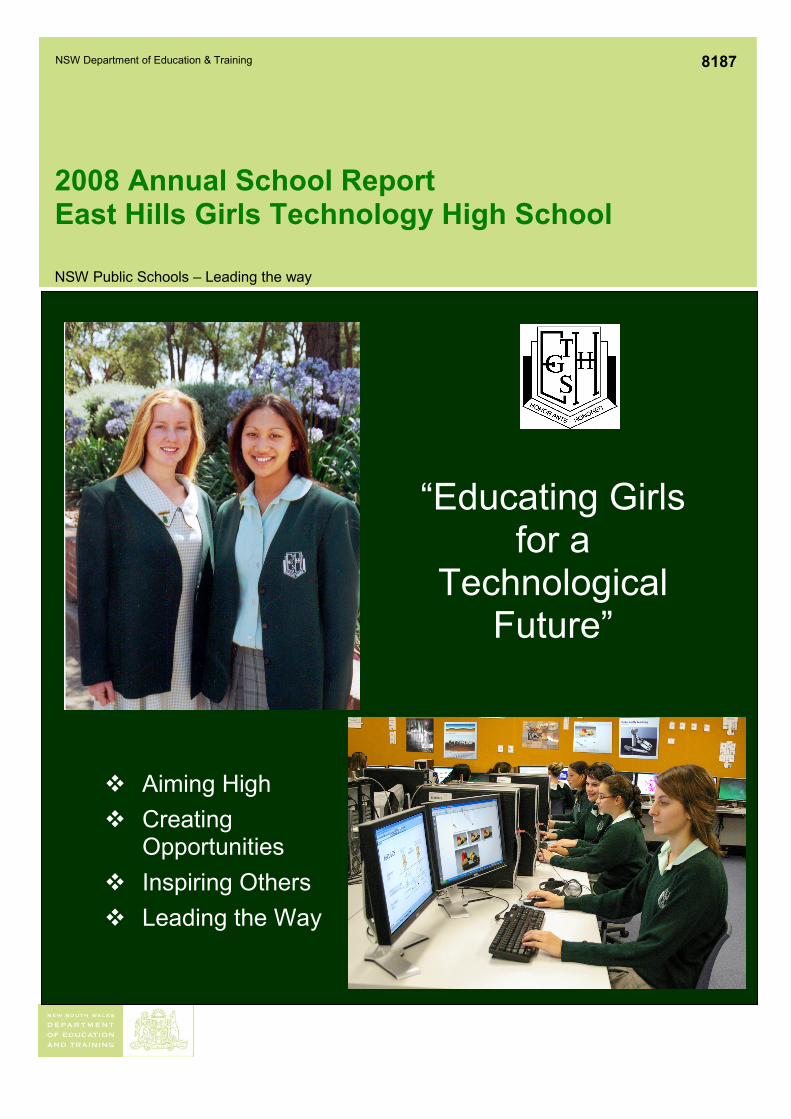
NSW Department of Education & Training 8187 2008 Annual School Report East Hills Girls Technology High School NSW Public Schools – Leading the way Aiming High Creating Opportunities Inspiring Others Leading the Way “Educating Girls for a Technological Future”
Transcript of “Educating Girls for a Technological Future” Contents Principal's message 4 P&C and/or School...
NSW Department of Education & Training
8187
2008 Annual School Report East Hills Girls Technology High School
NSW Public Schools – Leading the way
� Aiming High
� Creating Opportunities
� Inspiring Others
� Leading the Way
“Educating Girls for a
Technological Future”

2

3
Contents
Principal's message................................................. 4
P&C and/or School Council message ..................... 5
Student representative's message ............................ 5
School context ............................................................ 5
Student information ............................................ 5 Student attendance profile................................... 6 Retention to Year 12 ........................................... 6 Post-school destinations...................................... 7
Staff information...................................................... 7 Staff establishment.............................................. 7 Staff retention...................................................... 7 Staff attendance................................................... 7 Teacher qualifications ......................................... 7
Financial summary.................................................. 8
School performance 2008 .......................................... 8
Achievements........................................................... 8 Arts ..................................................................... 8 Sport.................................................................... 9 Other ................................................................... 9 Academic .......................................................... 10 Literacy – NAPLAN Year 7 ............................. 11 Literacy – NAPLAN Year 9 ............................. 12 Numeracy – NAPLAN Year 7 .......................... 13 Numeracy – NAPLAN Year 9 .......................... 14 Minimum standards .......................................... 15
Significant programs and initiatives ..................... 16 Aboriginal Education ........................................ 16 Multicultural education ..................................... 16 Student Support................................................. 16 Other programs ................................................. 17
Progress on 2008 targets ...................................... 17 Target 1 - Raising the literacy standard of all
students in Year 7 to 9....................................... 17 Target 2- Raising the numeracy standards of
students in Years 7 to 9. .................................... 17 Target 3 -........................................................... 17
Key evaluations ..................................................... 17 Educational and management practice.............. 17 School Leadership............................................. 17 Curriculum ........................................................ 18 Mathematics...................................................... 18 Other evaluations .............................................. 18 Educational and Management Practice ............. 18 Parent, student, and teacher satisfaction............ 19 Primary Links.................................................... 19
Professional learning ............................................ 19
School development 2009 – 2011 ............................ 19
Targets for 2009................................................ 20
About this report...................................................... 22
4
Messages
Principal's message
It gives me great pleasure to present our school’s 2008 Annual Report to our community. Our school has a long and outstanding commitment to providing quality education for girls. Words that spring to mind whenever I think about our school are “excellence”, “high student achievement”, “dedicated staff”, “technology”, “leadership” and “partnerships with parents and community”.
Students’ success depends on the active 3 way partnership of parents, students and staff who are linked in solidarity around our shared vision and purpose of “Educating Girls for a Technological Future”. The strength of this 3 way partnership extends into teaching and learning, student support, professional development, the curriculum and every aspect of school life.
Throughout 2008, there were many workshops and consultations involving students, parents and staff in identifying our school’s Priority Areas for our 3 year Strategic Plan, 2009-2011. These areas are Literacy, Numeracy, Connected Learning and Student Engagement and Retention. We have had many successes in these areas, however the sound planning framework will increase the spotlight on these 4 areas and ensure that we continue to excel in the provision of high quality education for our students.
The success of our school’s continuing focus on quality teaching is seen in the excellent results achieved by our students in the Higher School Certificate, School Certificate, NAPLAN, ESSA and the many awards received by the students. The 2008 HSC results are outstanding. Over 70% of the students had round one university offers in a wide range of courses. Of the courses examined at the HSC, results in 24 (73%) courses are at or above the state average. The majority of students achieved the high bands with 27 students achieving 49 band 6 results Our students also achieved 167 band 5s. The highest UAI of 99.8% was achieved by Tiffany Tung who is studying Veterinary Science at Sydney University.
Similarly in the School Certificate for English-Literacy, Science, Australian History, Australian Geography and Computing Skills the results are above state average. There are 46 band 6s awarded across different courses and 246 Band 5s. NAPLAN results for year 7 and 9 indicate that well over 94% of our students are achieving at and above the national minimum level. In ESSA, the Science test, the school average was 58.4% and 91% performed at Band 3 or above. Results for bands 4 and 5 are also well above state averages.
I congratulate the hard working, motivated students who have pursued excellence and I thank the staff who have dedicated many hours to helping our students achieve their best and also to the parents for their support.
During the year our students participated in many competitions, performances, sporting events and co-curricular activities, acquitting themselves at high levels. Students have shown remarkable leadership and team skills which are very evident in their fundraising activities, special programs to help their fellow students and their enthusiastic willingness to be involved in school activities.
Our school was one of the first schools to receive the equipment for the Connected Classroom Project. Students and staff have used this sophisticated technology to link with other schools and talk with authors by seeing and discussing with them in conference mode. The Connected Classroom Project has raised learning to a new high. It will be an exciting and challenging teaching strategy.
Our School Council and P&C Association continue to be great supporters of our school with their advice, help with programs and our annual Garden Fair. Our local community has been very generous in its support of our school with donations for school fundraising activities, work placement and work experience. The East Hills Girls Technology Alumni continue to promote our school and encourage former students to maintain contact with our school.
We are looking forward to another productive year. It will be a very exciting year for our school as it will have new facilities as a result of the $8.5 million dollar upgrade starting next year.
To all members of our school community- the 3 way partnership of students, parents and staff,- I express my deepest appreciation. Thank you for all your work and commitment to our school. You are enabling our school to continue providing education of the highest quality.
I certify that the information in this report is the result of a rigorous school self-evaluation process and is a balanced and genuine account of the school's achievements and areas for development.
Veronica Necyporuk
5
P&C and/or School Council message
The P&C Association, established in 1953, and the School Council, established in 1992, offer strong community support and participate in school-based decision making. This strong partnership between parents, students and staff is a vital part of our students’ and school’s successes.
All parents are encouraged to become members of the P&C, be representatives on school committees and stand for election for the School Council. Parental support has been given for the very successful annual Garden Fair, second hand uniform sales and payment of the family contribution as well as the Raffle. Funds raised this way are used to support awards for Presentation Day, sponsorships for outstanding students who represent the school and school programs. The School Council has provided sound advice on the uniform policy and the school budget and has supported applications for funding.
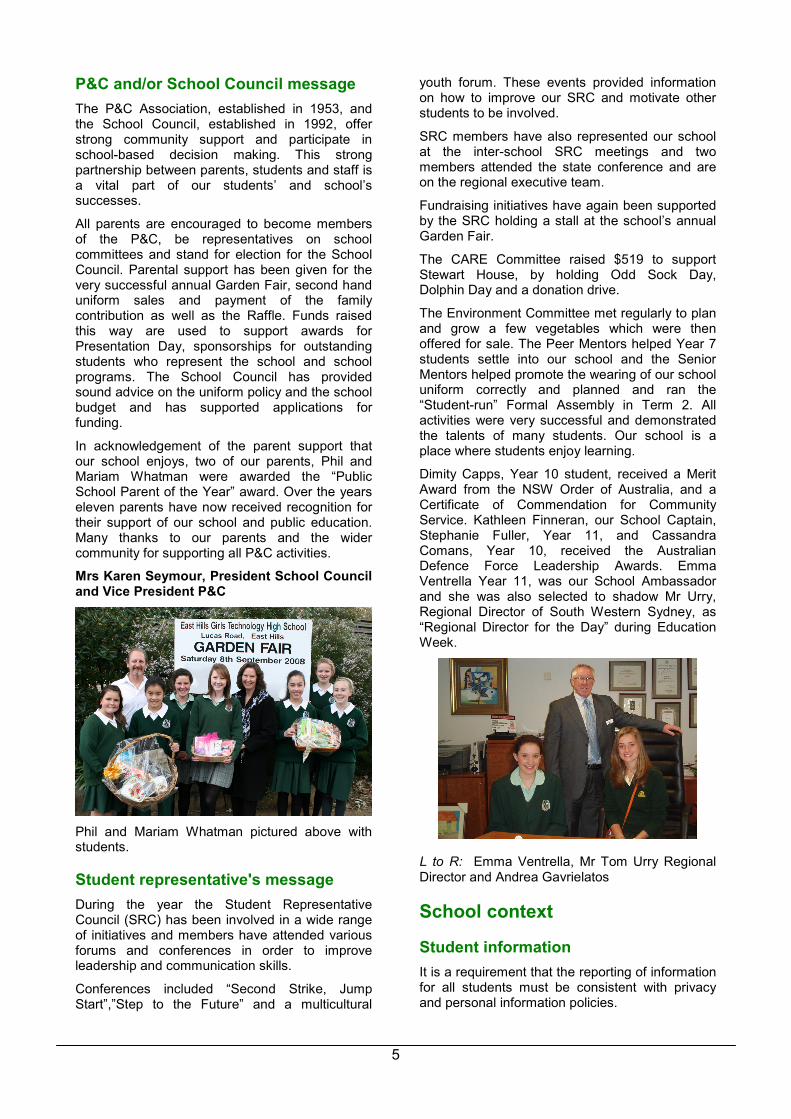
In acknowledgement of the parent support that our school enjoys, two of our parents, Phil and Mariam Whatman were awarded the “Public School Parent of the Year” award. Over the years eleven parents have now received recognition for their support of our school and public education. Many thanks to our parents and the wider community for supporting all P&C activities.
Mrs Karen Seymour, President School Council and Vice President P&C
Phil and Mariam Whatman pictured above with students.
Student representative's message
During the year the Student Representative Council (SRC) has been involved in a wide range of initiatives and members have attended various forums and conferences in order to improve leadership and communication skills.
Conferences included “Second Strike, Jump Start”,”Step to the Future” and a multicultural
youth forum. These events provided information on how to improve our SRC and motivate other students to be involved.
SRC members have also represented our school at the inter-school SRC meetings and two members attended the state conference and are on the regional executive team.
Fundraising initiatives have again been supported by the SRC holding a stall at the school’s annual Garden Fair.
The CARE Committee raised $519 to support Stewart House, by holding Odd Sock Day, Dolphin Day and a donation drive.
The Environment Committee met regularly to plan and grow a few vegetables which were then offered for sale. The Peer Mentors helped Year 7 students settle into our school and the Senior Mentors helped promote the wearing of our school uniform correctly and planned and ran the “Student-run” Formal Assembly in Term 2. All activities were very successful and demonstrated the talents of many students. Our school is a place where students enjoy learning.
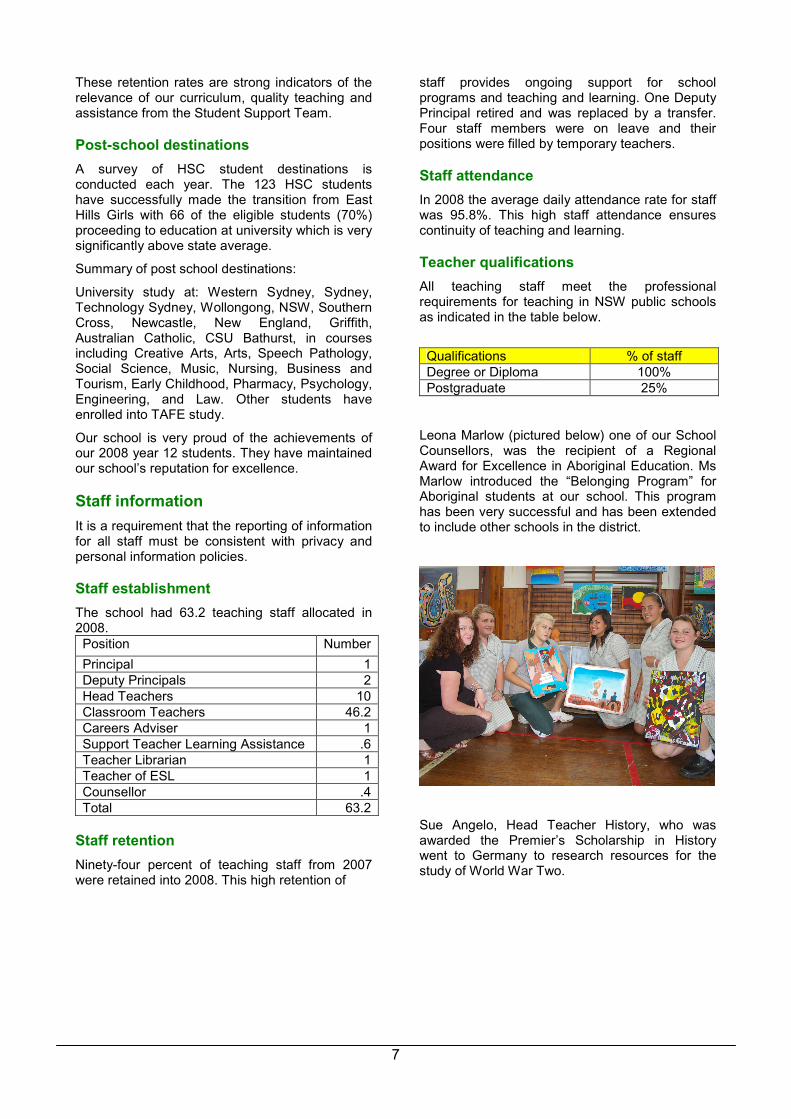
Dimity Capps, Year 10 student, received a Merit Award from the NSW Order of Australia, and a Certificate of Commendation for Community Service. Kathleen Finneran, our School Captain, Stephanie Fuller, Year 11, and Cassandra Comans, Year 10, received the Australian Defence Force Leadership Awards. Emma Ventrella Year 11, was our School Ambassador and she was also selected to shadow Mr Urry, Regional Director of South Western Sydney, as “Regional Director for the Day” during Education Week.
L to R: Emma Ventrella, Mr Tom Urry Regional Director and Andrea Gavrielatos
School context
Student information
It is a requirement that the reporting of information for all students must be consistent with privacy and personal information policies.

6
Student enrolment profile
School Enrolments
0100
200300
400500
600700
800900
10001100
2004 2005 2006 2007 2008
Stu
de
nts
Female Male
There were 941 students enrolled in 2008. Of these there were 14 indigenous students, 42% of students were from Language Backgrounds other than English (LBOTE) and 18 International students. The school has a vast drawing area with students coming from many public schools as well as private ones. There is a strong demand for enrolment at our school.
Student attendance profile
Years 7 to 10 Attendance Rates
88
89
90
91
92
93
94
2005 2006 2007 2008
School Region State
Years 11 and 12 Attendance Rates
87
88
89
90
91
92
93
94
2005 2006 2007 2008
School Region State
Student attendance in the junior and senior school continues to be significantly above the Region and State. This reflects the success of attendance
monitoring by the Year Co-ordinators and the SMS messages sent to parents. Referrals to the Home School Liaison Officer are used when required to support and encourage students who are poor attenders.
Structure of classes
Our school’s curriculum structure is evolving, engaging and enhancing in terms of meeting the learning needs of our students. The school is committed to preparing students to be informed and caring citizens. Our staff are specialised in their disciplines and teach at differentiated levels.
There is a wide range of courses for study which include specialisation, a more general education or combinations of both. Students in the junior school study 10 core courses and have 20 other courses for selection for their School Certificate (SC). In the senior school, students have a choice of 43 courses for selection for the Higher School Certificate (HSC). There are many co-curricular activities to extend students’ learning and to develop their talents. Year 7 classes are of mixed ability. In Years 8, 9 and 10, in the core classes, there are two high achieving classes, a support class and the remainder are mixed ability. The elective classes are also mixed ability. Mathematics classes in Year 8 are reorganised into 2 bands of 3 classes. There is a top class in each band, one support class across the year and the remainder are mixed ability. In the senior school classes are based on students’ selection of courses for study.
Lessons are of 50 minutes’ duration with 6 lessons per day. There is a two week timetable.
Retention to Year 12
Our school has a history of high retention rates. After completing the School Certificate (SC) the majority of our students continue into Year 11 and 12 to complete their Higher School Certificate (HSC). Our retention rate continues to be above the state and School Education Group (SEG).
Proportion Staying On (SC to HSC)
0
10
20
30
40
50
60
70
80
90
SC02 -
HSC04
SC03-
HSC05
SC04 -
HSC06
SC05 -
HSC07
SC06 -
HSC08
School SEG State
7
These retention rates are strong indicators of the relevance of our curriculum, quality teaching and assistance from the Student Support Team.
Post-school destinations
A survey of HSC student destinations is conducted each year. The 123 HSC students have successfully made the transition from East Hills Girls with 66 of the eligible students (70%) proceeding to education at university which is very significantly above state average.
Summary of post school destinations:
University study at: Western Sydney, Sydney, Technology Sydney, Wollongong, NSW, Southern Cross, Newcastle, New England, Griffith, Australian Catholic, CSU Bathurst, in courses including Creative Arts, Arts, Speech Pathology, Social Science, Music, Nursing, Business and Tourism, Early Childhood, Pharmacy, Psychology, Engineering, and Law. Other students have enrolled into TAFE study.
Our school is very proud of the achievements of our 2008 year 12 students. They have maintained our school’s reputation for excellence.
Staff information
It is a requirement that the reporting of information for all staff must be consistent with privacy and personal information policies.
Staff establishment
The school had 63.2 teaching staff allocated in 2008. Position Number
Principal 1 Deputy Principals 2 Head Teachers 10 Classroom Teachers 46.2 Careers Adviser 1 Support Teacher Learning Assistance .6 Teacher Librarian 1 Teacher of ESL 1 Counsellor .4 Total 63.2
Staff retention
Ninety-four percent of teaching staff from 2007 were retained into 2008. This high retention of
staff provides ongoing support for school programs and teaching and learning. One Deputy Principal retired and was replaced by a transfer. Four staff members were on leave and their positions were filled by temporary teachers.
Staff attendance
In 2008 the average daily attendance rate for staff was 95.8%. This high staff attendance ensures continuity of teaching and learning.
Teacher qualifications
All teaching staff meet the professional requirements for teaching in NSW public schools as indicated in the table below.
Qualifications % of staff Degree or Diploma 100% Postgraduate 25%
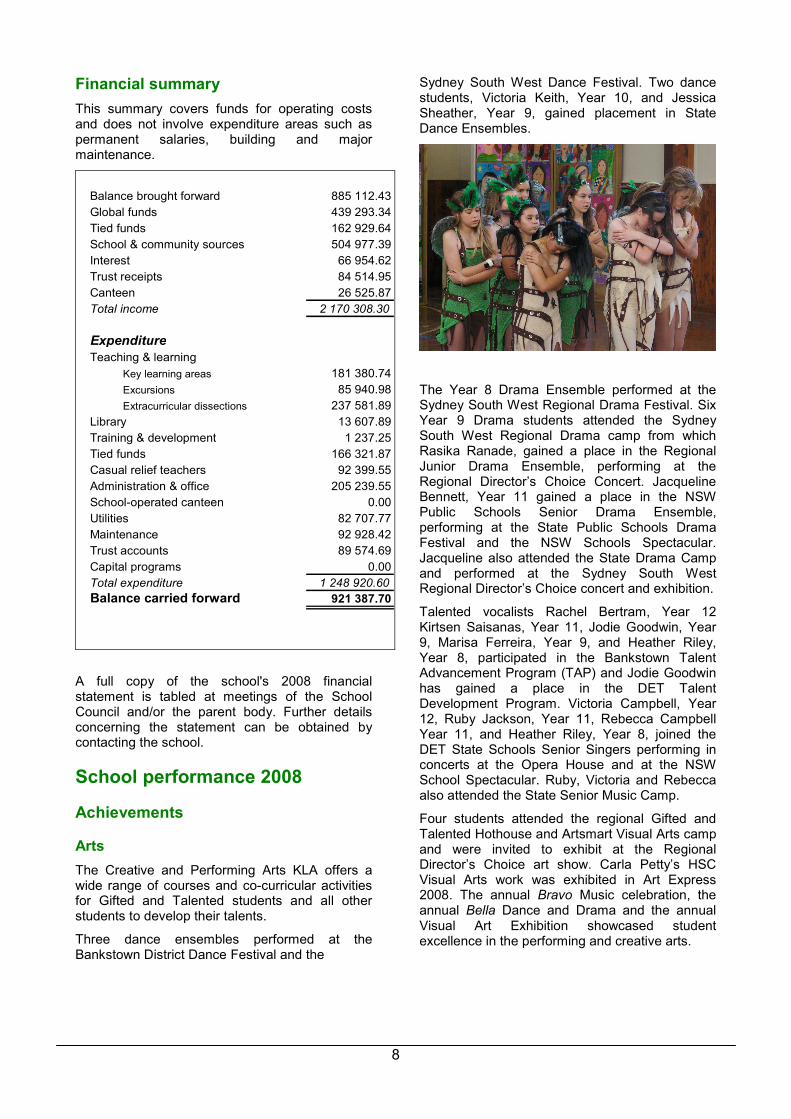
Leona Marlow (pictured below) one of our School Counsellors, was the recipient of a Regional Award for Excellence in Aboriginal Education. Ms Marlow introduced the “Belonging Program” for Aboriginal students at our school. This program has been very successful and has been extended to include other schools in the district.
Sue Angelo, Head Teacher History, who was awarded the Premier’s Scholarship in History went to Germany to research resources for the study of World War Two.
8
Financial summary
This summary covers funds for operating costs and does not involve expenditure areas such as permanent salaries, building and major maintenance.
Balance brought forward 885 112.43
Global funds 439 293.34
Tied funds 162 929.64
School & community sources 504 977.39
Interest 66 954.62
Trust receipts 84 514.95
Canteen 26 525.87
Total income 2 170 308.30
Expenditure
Teaching & learning
Key learning areas 181 380.74
Excursions 85 940.98
Extracurricular dissections 237 581.89
Library 13 607.89
Training & development 1 237.25
Tied funds 166 321.87
Casual relief teachers 92 399.55
Administration & office 205 239.55
School-operated canteen 0.00
Utilities 82 707.77
Maintenance 92 928.42
Trust accounts 89 574.69
Capital programs 0.00
Total expenditure 1 248 920.60
Balance carried forward 921 387.70
A full copy of the school's 2008 financial statement is tabled at meetings of the School Council and/or the parent body. Further details concerning the statement can be obtained by contacting the school.
School performance 2008
Achievements
Arts
The Creative and Performing Arts KLA offers a wide range of courses and co-curricular activities for Gifted and Talented students and all other students to develop their talents.
Three dance ensembles performed at the Bankstown District Dance Festival and the
Sydney South West Dance Festival. Two dance students, Victoria Keith, Year 10, and Jessica Sheather, Year 9, gained placement in State Dance Ensembles.
The Year 8 Drama Ensemble performed at the Sydney South West Regional Drama Festival. Six Year 9 Drama students attended the Sydney South West Regional Drama camp from which Rasika Ranade, gained a place in the Regional Junior Drama Ensemble, performing at the Regional Director’s Choice Concert. Jacqueline Bennett, Year 11 gained a place in the NSW Public Schools Senior Drama Ensemble, performing at the State Public Schools Drama Festival and the NSW Schools Spectacular. Jacqueline also attended the State Drama Camp and performed at the Sydney South West Regional Director’s Choice concert and exhibition.
Talented vocalists Rachel Bertram, Year 12 Kirtsen Saisanas, Year 11, Jodie Goodwin, Year 9, Marisa Ferreira, Year 9, and Heather Riley, Year 8, participated in the Bankstown Talent Advancement Program (TAP) and Jodie Goodwin has gained a place in the DET Talent Development Program. Victoria Campbell, Year 12, Ruby Jackson, Year 11, Rebecca Campbell Year 11, and Heather Riley, Year 8, joined the DET State Schools Senior Singers performing in concerts at the Opera House and at the NSW School Spectacular. Ruby, Victoria and Rebecca also attended the State Senior Music Camp.
Four students attended the regional Gifted and Talented Hothouse and Artsmart Visual Arts camp and were invited to exhibit at the Regional Director’s Choice art show. Carla Petty’s HSC Visual Arts work was exhibited in Art Express 2008. The annual Bravo Music celebration, the annual Bella Dance and Drama and the annual Visual Art Exhibition showcased student excellence in the performing and creative arts.
9
Carla Petty’s Art work (above) was featured on the catalogue for Wollongong Regional Gallery Art Express exhibition.
Sport
Our students have continued to exhibit outstanding skills in all sports in 2008. Emma Wheatley, Year 11, received the very prestigious Pierre de Coubertin Award for Outstanding Sportsmanship. Emma is the seventh student in our school to receive this award. For the past six years, a student from our school has been awarded the Pierre de Coubertin Award.
Teneale Houghton, Year 11, pictured below was a representative at the All Schools Swimming Championships as well as the Pacific School Games. She received the Sydney South West President’s Cup for 2008 for the outstanding female sportsperson in the region. Teneale was also placed first at the State Cross Country and went on to compete at national level.
Janina Strauts, Year 11, represented the school at National level in High Jump. She competed in the NSW All Schools Championship, receiving a
bronze medal. Janina qualified for the Pacific School Games representing NSW.
Nicole Morley represented the school in softball at both the Sydney South West and the NSW All Schools Championships where her team was placed first in Australia.
Gemma Summerhayes represented the school in trampolining. Stephanie Baxter and Tarlee Moss made the state Cross Country Team. Vanessa Noble made the state team in Athletics achieving fifth in the 5000m run.
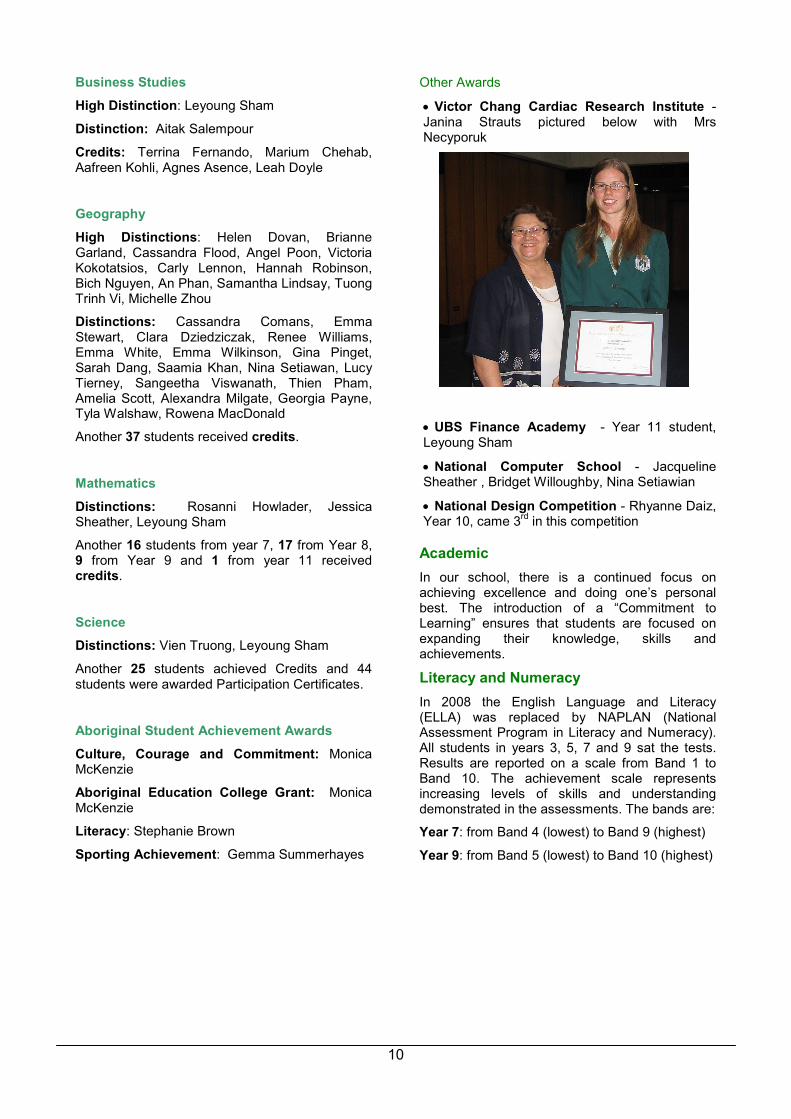
Our School entered 10 Knockout teams and had individual representatives in the areas of athletics, cross country, swimming, trampolining, rhythmic gymnastics, cricket, soccer, netball, tennis, volleyball, softball, touch football, basketball, water polo and hockey. Our cricket team, pictured below, came 3
rd in the state and the soccer team came
8th. In all we had 86 students represent Sydney
South West Region, many achieving their personal best.
Other
Students are encouraged to enter competitions to challenge themselves and to extend their learning. Many students achieve High Distinctions, Distinctions and Credits. Students were successful in the following competitions:
Year 10 History Competition
High Distinction: Thi Hong Bich Nguyen
Distinctions: Gina Pinget, Vanessa Noble, Jaspreet Boparoy, Lilla Zsigoszki
Credits: Dimity Capps, Sarah Dang, Helen Dovan, Brianne Garland, Victoria Kokotatsios, Jaime Lomax, Hannah Robinson, Emma Stewart, Saamia Khan, Sarah McKenna, Victoria Keith, Tyla Walshaw
Economics
Distinction: Terrina Fernando, Pavlina Zdraveski
Credits: Bettina Tan, Leyoung Sham, Jessica Ko, Suzanne Taha, Jessica Fu, Rebecca Pearsall, Sonakshi Prasad, Caitlin Naidoo
10
Business Studies
High Distinction: Leyoung Sham
Distinction: Aitak Salempour
Credits: Terrina Fernando, Marium Chehab, Aafreen Kohli, Agnes Asence, Leah Doyle
Geography
High Distinctions: Helen Dovan, Brianne Garland, Cassandra Flood, Angel Poon, Victoria Kokotatsios, Carly Lennon, Hannah Robinson, Bich Nguyen, An Phan, Samantha Lindsay, Tuong Trinh Vi, Michelle Zhou
Distinctions: Cassandra Comans, Emma Stewart, Clara Dziedziczak, Renee Williams, Emma White, Emma Wilkinson, Gina Pinget, Sarah Dang, Saamia Khan, Nina Setiawan, Lucy Tierney, Sangeetha Viswanath, Thien Pham, Amelia Scott, Alexandra Milgate, Georgia Payne, Tyla Walshaw, Rowena MacDonald
Another 37 students received credits.
Mathematics
Distinctions: Rosanni Howlader, Jessica Sheather, Leyoung Sham
Another 16 students from year 7, 17 from Year 8, 9 from Year 9 and 1 from year 11 received credits.
Science
Distinctions: Vien Truong, Leyoung Sham
Another 25 students achieved Credits and 44 students were awarded Participation Certificates.
Aboriginal Student Achievement Awards
Culture, Courage and Commitment: Monica McKenzie
Aboriginal Education College Grant: Monica McKenzie
Literacy: Stephanie Brown
Sporting Achievement: Gemma Summerhayes
Other Awards
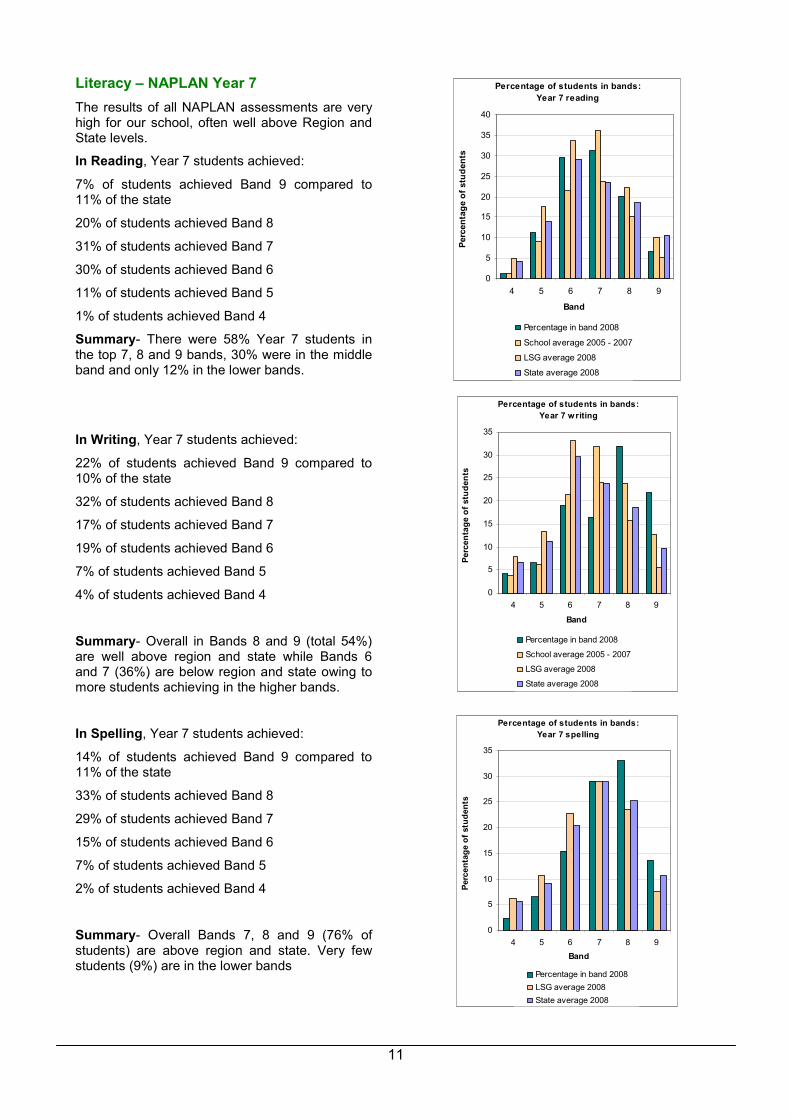
• Victor Chang Cardiac Research Institute - Janina Strauts pictured below with Mrs Necyporuk
• UBS Finance Academy - Year 11 student, Leyoung Sham
• National Computer School - Jacqueline Sheather , Bridget Willoughby, Nina Setiawian
• National Design Competition - Rhyanne Daiz, Year 10, came 3
rd in this competition
Academic
In our school, there is a continued focus on achieving excellence and doing one’s personal best. The introduction of a “Commitment to Learning” ensures that students are focused on expanding their knowledge, skills and achievements.
Literacy and Numeracy
In 2008 the English Language and Literacy (ELLA) was replaced by NAPLAN (National Assessment Program in Literacy and Numeracy). All students in years 3, 5, 7 and 9 sat the tests. Results are reported on a scale from Band 1 to Band 10. The achievement scale represents increasing levels of skills and understanding demonstrated in the assessments. The bands are:
Year 7: from Band 4 (lowest) to Band 9 (highest)
Year 9: from Band 5 (lowest) to Band 10 (highest)
11
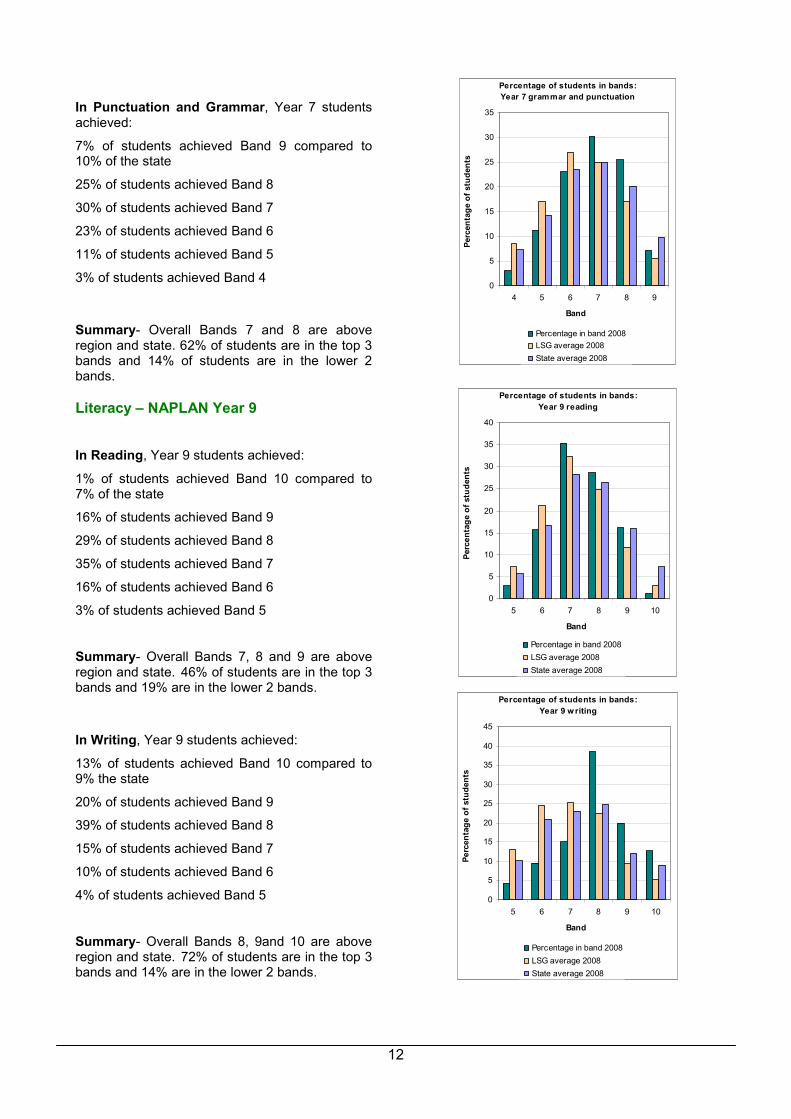
Literacy – NAPLAN Year 7
The results of all NAPLAN assessments are very high for our school, often well above Region and State levels.
In Reading, Year 7 students achieved:
7% of students achieved Band 9 compared to 11% of the state
20% of students achieved Band 8
31% of students achieved Band 7
30% of students achieved Band 6
11% of students achieved Band 5
1% of students achieved Band 4
Summary- There were 58% Year 7 students in the top 7, 8 and 9 bands, 30% were in the middle band and only 12% in the lower bands.
In Writing, Year 7 students achieved:
22% of students achieved Band 9 compared to 10% of the state
32% of students achieved Band 8
17% of students achieved Band 7
19% of students achieved Band 6
7% of students achieved Band 5
4% of students achieved Band 4
Summary- Overall in Bands 8 and 9 (total 54%) are well above region and state while Bands 6 and 7 (36%) are below region and state owing to more students achieving in the higher bands.
In Spelling, Year 7 students achieved:
14% of students achieved Band 9 compared to 11% of the state
33% of students achieved Band 8
29% of students achieved Band 7
15% of students achieved Band 6
7% of students achieved Band 5
2% of students achieved Band 4
Summary- Overall Bands 7, 8 and 9 (76% of students) are above region and state. Very few students (9%) are in the lower bands
Percentage of students in bands:
Year 7 reading
0
5
10
15
20
25
30
35
40
4 5 6 7 8 9
Band
Pe
rce
nta
ge
of
stu
de
nts
Percentage in band 2008
School average 2005 - 2007
LSG average 2008
State average 2008
Percentage of students in bands:
Year 7 w riting
0
5
10
15
20
25
30
35
4 5 6 7 8 9
Band
Pe
rce
nta
ge
of
stu
de
nts
Percentage in band 2008
School average 2005 - 2007
LSG average 2008
State average 2008
Percentage of students in bands:
Year 7 spelling
0
5
10
15
20
25
30
35
4 5 6 7 8 9
Band
Pe
rce
nta
ge
of
stu
de
nts
Percentage in band 2008
LSG average 2008
State average 2008
12
In Punctuation and Grammar, Year 7 students achieved:
7% of students achieved Band 9 compared to 10% of the state
25% of students achieved Band 8
30% of students achieved Band 7
23% of students achieved Band 6
11% of students achieved Band 5
3% of students achieved Band 4
Summary- Overall Bands 7 and 8 are above region and state. 62% of students are in the top 3 bands and 14% of students are in the lower 2 bands.
Literacy – NAPLAN Year 9
In Reading, Year 9 students achieved:
1% of students achieved Band 10 compared to 7% of the state
16% of students achieved Band 9
29% of students achieved Band 8
35% of students achieved Band 7
16% of students achieved Band 6
3% of students achieved Band 5
Summary- Overall Bands 7, 8 and 9 are above region and state. 46% of students are in the top 3 bands and 19% are in the lower 2 bands.
In Writing, Year 9 students achieved:
13% of students achieved Band 10 compared to 9% the state
20% of students achieved Band 9
39% of students achieved Band 8
15% of students achieved Band 7
10% of students achieved Band 6
4% of students achieved Band 5
Summary- Overall Bands 8, 9and 10 are above region and state. 72% of students are in the top 3 bands and 14% are in the lower 2 bands.
Percentage of students in bands:
Year 7 grammar and punctuation
0
5
10
15
20
25
30
35
4 5 6 7 8 9
Band
Pe
rce
nta
ge
of
stu
de
nts
Percentage in band 2008
LSG average 2008
State average 2008
Percentage of students in bands:
Year 9 reading
0
5
10
15
20
25
30
35
40
5 6 7 8 9 10
Band
Pe
rce
nta
ge
of
stu
de
nts
Percentage in band 2008
LSG average 2008
State average 2008
Percentage of students in bands:
Year 9 w riting
0
5
10
15
20
25
30
35
40
45
5 6 7 8 9 10
Band
Pe
rce
nta
ge
of
stu
de
nts
Percentage in band 2008
LSG average 2008
State average 2008
13
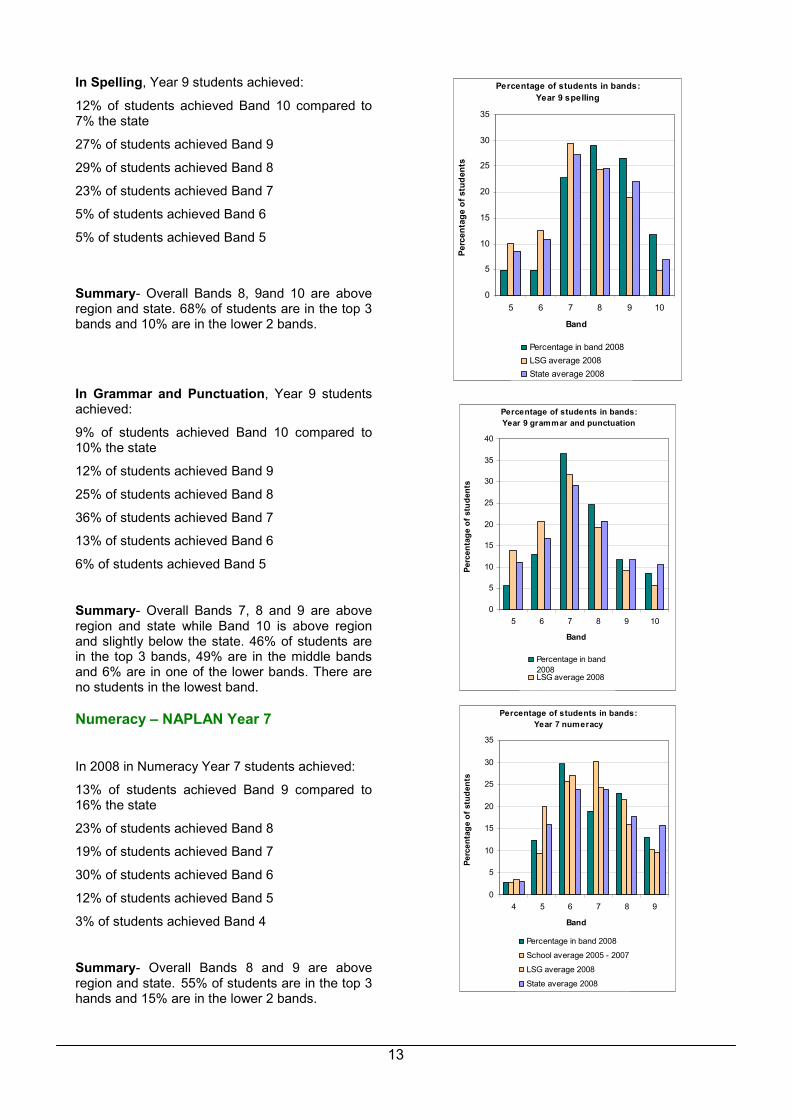
In Spelling, Year 9 students achieved:
12% of students achieved Band 10 compared to 7% the state
27% of students achieved Band 9
29% of students achieved Band 8
23% of students achieved Band 7
5% of students achieved Band 6
5% of students achieved Band 5
Summary- Overall Bands 8, 9and 10 are above region and state. 68% of students are in the top 3 bands and 10% are in the lower 2 bands.
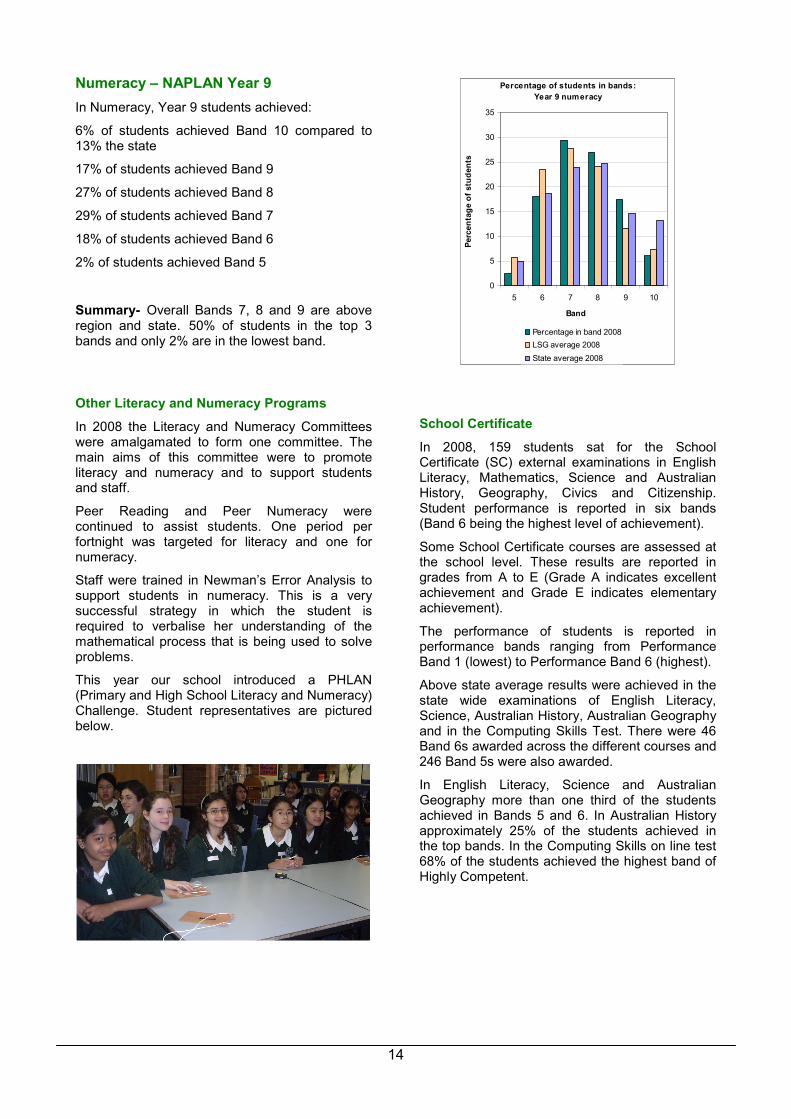
In Grammar and Punctuation, Year 9 students achieved:
9% of students achieved Band 10 compared to 10% the state
12% of students achieved Band 9
25% of students achieved Band 8
36% of students achieved Band 7
13% of students achieved Band 6
6% of students achieved Band 5
Summary- Overall Bands 7, 8 and 9 are above region and state while Band 10 is above region and slightly below the state. 46% of students are in the top 3 bands, 49% are in the middle bands and 6% are in one of the lower bands. There are no students in the lowest band.
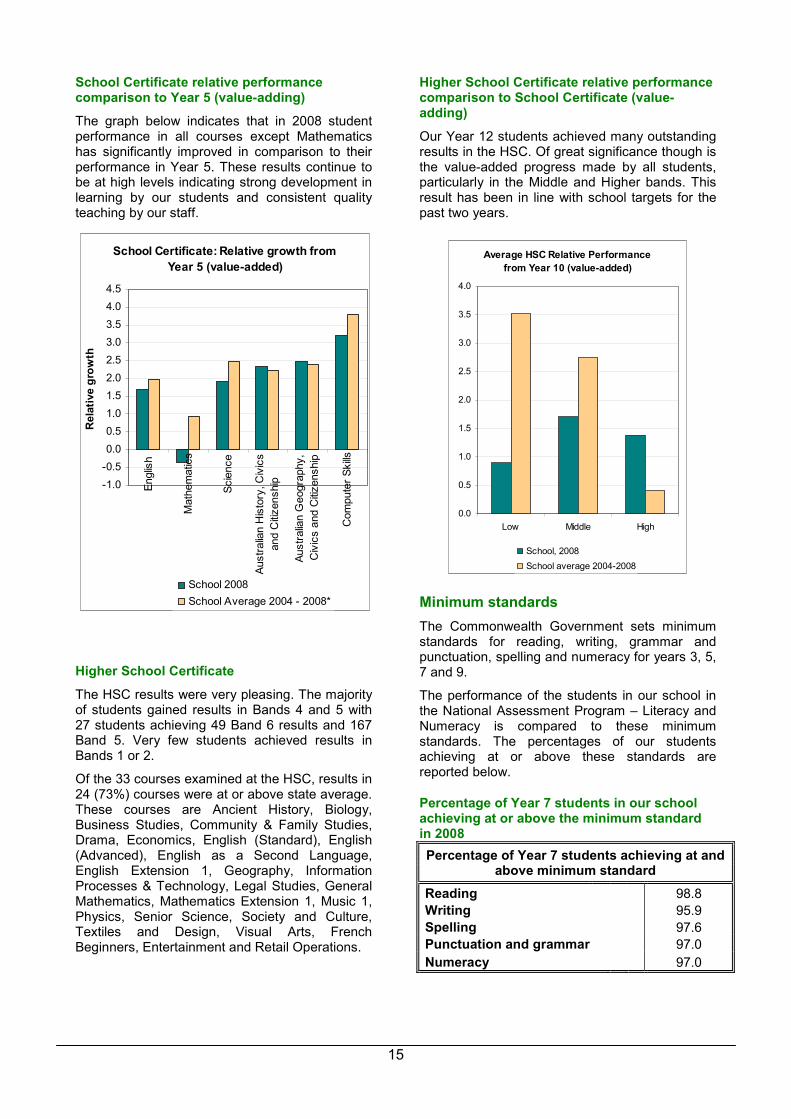
Numeracy – NAPLAN Year 7
In 2008 in Numeracy Year 7 students achieved:
13% of students achieved Band 9 compared to 16% the state
23% of students achieved Band 8
19% of students achieved Band 7
30% of students achieved Band 6
12% of students achieved Band 5
3% of students achieved Band 4
Summary- Overall Bands 8 and 9 are above region and state. 55% of students are in the top 3 hands and 15% are in the lower 2 bands.
Percentage of students in bands:
Year 9 spelling
0
5
10
15
20
25
30
35
5 6 7 8 9 10
Band
Pe
rce
nta
ge
of
stu
de
nts
Percentage in band 2008
LSG average 2008
State average 2008
Percentage of students in bands:
Year 9 grammar and punctuation
0
5
10
15
20
25
30
35
40
5 6 7 8 9 10
Band
Pe
rce
nta
ge
of
stu
de
nts
Percentage in band
2008LSG average 2008
Percentage of students in bands:
Year 7 numeracy
0
5
10
15
20
25
30
35
4 5 6 7 8 9
Band
Pe
rce
nta
ge
of
stu
de
nts
Percentage in band 2008
School average 2005 - 2007
LSG average 2008
State average 2008
14
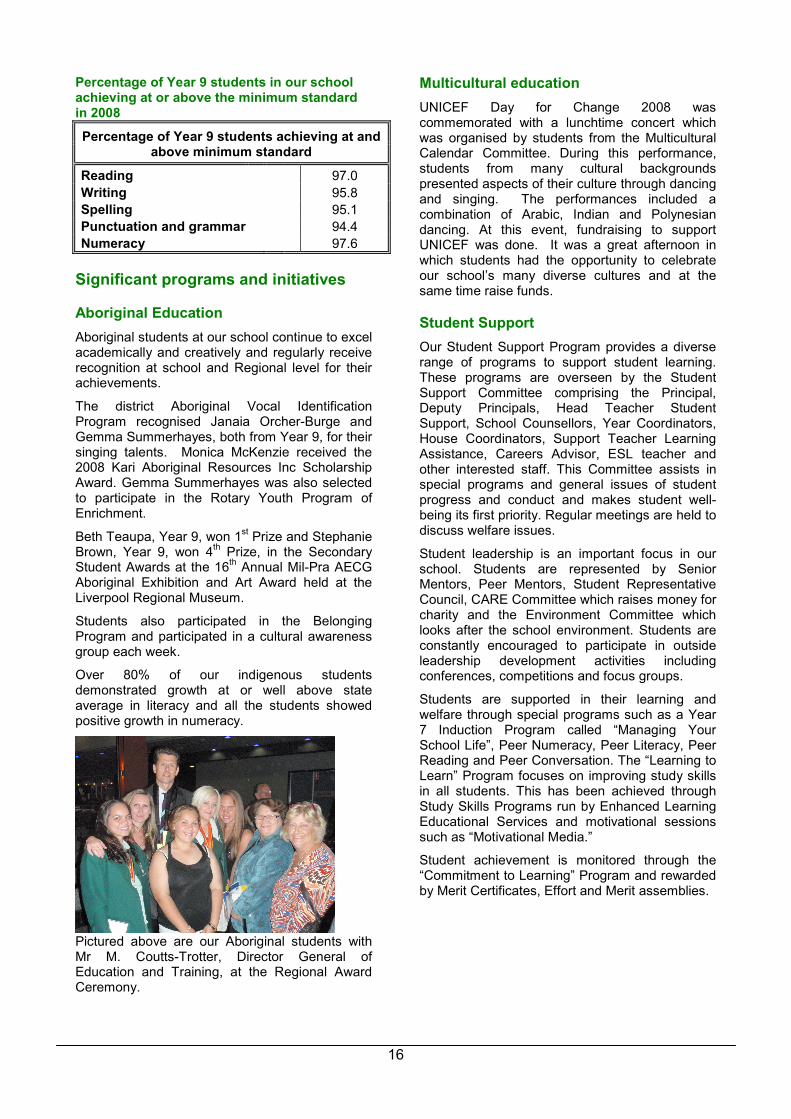
Numeracy – NAPLAN Year 9
In Numeracy, Year 9 students achieved:
6% of students achieved Band 10 compared to 13% the state
17% of students achieved Band 9
27% of students achieved Band 8
29% of students achieved Band 7
18% of students achieved Band 6
2% of students achieved Band 5
Summary- Overall Bands 7, 8 and 9 are above region and state. 50% of students in the top 3 bands and only 2% are in the lowest band.
Other Literacy and Numeracy Programs
In 2008 the Literacy and Numeracy Committees were amalgamated to form one committee. The main aims of this committee were to promote literacy and numeracy and to support students and staff.
Peer Reading and Peer Numeracy were continued to assist students. One period per fortnight was targeted for literacy and one for numeracy.
Staff were trained in Newman’s Error Analysis to support students in numeracy. This is a very successful strategy in which the student is required to verbalise her understanding of the mathematical process that is being used to solve problems.
This year our school introduced a PHLAN (Primary and High School Literacy and Numeracy) Challenge. Student representatives are pictured below.
Percentage of students in bands:
Year 9 numeracy
0
5
10
15
20
25
30
35
5 6 7 8 9 10
Band
Pe
rce
nta
ge
of
stu
de
nts
Percentage in band 2008
LSG average 2008
State average 2008
School Certificate
In 2008, 159 students sat for the School Certificate (SC) external examinations in English Literacy, Mathematics, Science and Australian History, Geography, Civics and Citizenship. Student performance is reported in six bands (Band 6 being the highest level of achievement).
Some School Certificate courses are assessed at the school level. These results are reported in grades from A to E (Grade A indicates excellent achievement and Grade E indicates elementary achievement).
The performance of students is reported in performance bands ranging from Performance Band 1 (lowest) to Performance Band 6 (highest).
Above state average results were achieved in the state wide examinations of English Literacy, Science, Australian History, Australian Geography and in the Computing Skills Test. There were 46 Band 6s awarded across the different courses and 246 Band 5s were also awarded.
In English Literacy, Science and Australian Geography more than one third of the students achieved in Bands 5 and 6. In Australian History approximately 25% of the students achieved in the top bands. In the Computing Skills on line test 68% of the students achieved the highest band of Highly Competent.
15
School Certificate relative performance comparison to Year 5 (value-adding)
The graph below indicates that in 2008 student performance in all courses except Mathematics has significantly improved in comparison to their performance in Year 5. These results continue to be at high levels indicating strong development in learning by our students and consistent quality teaching by our staff.
School Certificate: Relative growth from
Year 5 (value-added)
-1.0
-0.5
0.0
0.5
1.0
1.5
2.0
2.5
3.0
3.5
4.0
4.5
English
Mathematics
Science
Australian History, Civics
and Citizenship
Australian Geography,
Civics and Citizenship
Computer Skills
Re
lati
ve
gro
wth
School 2008
School Average 2004 - 2008*
Higher School Certificate
The HSC results were very pleasing. The majority of students gained results in Bands 4 and 5 with 27 students achieving 49 Band 6 results and 167 Band 5. Very few students achieved results in Bands 1 or 2.
Of the 33 courses examined at the HSC, results in 24 (73%) courses were at or above state average. These courses are Ancient History, Biology, Business Studies, Community & Family Studies, Drama, Economics, English (Standard), English (Advanced), English as a Second Language, English Extension 1, Geography, Information Processes & Technology, Legal Studies, General Mathematics, Mathematics Extension 1, Music 1, Physics, Senior Science, Society and Culture, Textiles and Design, Visual Arts, French Beginners, Entertainment and Retail Operations.
Higher School Certificate relative performance comparison to School Certificate (value-adding)
Our Year 12 students achieved many outstanding results in the HSC. Of great significance though is the value-added progress made by all students, particularly in the Middle and Higher bands. This result has been in line with school targets for the past two years.
Average HSC Relative Performance
from Year 10 (value-added)
0.0
0.5
1.0
1.5
2.0
2.5
3.0
3.5
4.0
Low Middle High
School, 2008
School average 2004-2008
Minimum standards
The Commonwealth Government sets minimum standards for reading, writing, grammar and punctuation, spelling and numeracy for years 3, 5, 7 and 9.
The performance of the students in our school in the National Assessment Program – Literacy and Numeracy is compared to these minimum standards. The percentages of our students achieving at or above these standards are reported below.
Percentage of Year 7 students in our school achieving at or above the minimum standard in 2008
Percentage of Year 7 students achieving at and above minimum standard
Reading 98.8
Writing 95.9
Spelling 97.6
Punctuation and grammar 97.0
Numeracy 97.0
16
Percentage of Year 9 students in our school achieving at or above the minimum standard in 2008
Percentage of Year 9 students achieving at and above minimum standard
Reading 97.0
Writing 95.8
Spelling 95.1
Punctuation and grammar 94.4
Numeracy 97.6
Significant programs and initiatives
Aboriginal Education
Aboriginal students at our school continue to excel academically and creatively and regularly receive recognition at school and Regional level for their achievements.
The district Aboriginal Vocal Identification Program recognised Janaia Orcher-Burge and Gemma Summerhayes, both from Year 9, for their singing talents. Monica McKenzie received the 2008 Kari Aboriginal Resources Inc Scholarship Award. Gemma Summerhayes was also selected to participate in the Rotary Youth Program of Enrichment.
Beth Teaupa, Year 9, won 1st Prize and Stephanie
Brown, Year 9, won 4th Prize, in the Secondary
Student Awards at the 16th Annual Mil-Pra AECG
Aboriginal Exhibition and Art Award held at the Liverpool Regional Museum.
Students also participated in the Belonging Program and participated in a cultural awareness group each week.
Over 80% of our indigenous students demonstrated growth at or well above state average in literacy and all the students showed positive growth in numeracy.
Pictured above are our Aboriginal students with Mr M. Coutts-Trotter, Director General of Education and Training, at the Regional Award Ceremony.
Multicultural education
UNICEF Day for Change 2008 was commemorated with a lunchtime concert which was organised by students from the Multicultural Calendar Committee. During this performance, students from many cultural backgrounds presented aspects of their culture through dancing and singing. The performances included a combination of Arabic, Indian and Polynesian dancing. At this event, fundraising to support UNICEF was done. It was a great afternoon in which students had the opportunity to celebrate our school’s many diverse cultures and at the same time raise funds.
Student Support
Our Student Support Program provides a diverse range of programs to support student learning. These programs are overseen by the Student Support Committee comprising the Principal, Deputy Principals, Head Teacher Student Support, School Counsellors, Year Coordinators, House Coordinators, Support Teacher Learning Assistance, Careers Advisor, ESL teacher and other interested staff. This Committee assists in special programs and general issues of student progress and conduct and makes student well-being its first priority. Regular meetings are held to discuss welfare issues.
Student leadership is an important focus in our school. Students are represented by Senior Mentors, Peer Mentors, Student Representative Council, CARE Committee which raises money for charity and the Environment Committee which looks after the school environment. Students are constantly encouraged to participate in outside leadership development activities including conferences, competitions and focus groups.
Students are supported in their learning and welfare through special programs such as a Year 7 Induction Program called “Managing Your School Life”, Peer Numeracy, Peer Literacy, Peer Reading and Peer Conversation. The “Learning to Learn” Program focuses on improving study skills in all students. This has been achieved through Study Skills Programs run by Enhanced Learning Educational Services and motivational sessions such as “Motivational Media.”
Student achievement is monitored through the “Commitment to Learning” Program and rewarded by Merit Certificates, Effort and Merit assemblies.
17
Other programs
Progress on 2008 targets
Target 1 - Raising the literacy standard of all students in Year 7 to 9.
Ninety-five percent of students will achieve Proficient standard and above state average in Literacy in 2008. All students will achieve the minimum standard or above.
Our achievements include:
• we have been very successful in meeting this target.
• students in Year 7 and year 9 sat for the National Assessment Program Literacy and Numeracy (NAPLAN) test and 98% of students achieved at or above the national minimum standard. Three students in Year 7 and four in Year 9 did not reach the national minimum standard. These students were either first phase ESL learners and/or have a disability or both which impedes their progress. These students will continue to receive teacher and STLA support.
Target 2- Raising the numeracy standards of students in Years 7 to 9.
Seventy three percent of students will achieve Proficient standard in Numeracy in 2008. Ninety seven percent of all students will achieve minimum standard or above.
Our achievements include:
• we have been successful in meeting this target. The results from NAPLAN indicate that 73% of Year 7 students achieved in the top Bands 6, 7 and 8 and 73% of year 9 students achieved in Bands 7, 8 and 9
• The results from NAPLAN indicate that 97% of Year 7 students achieved at or above National Minimum standard and 98% of year 9 students achieved at or above National Minimum standard, and
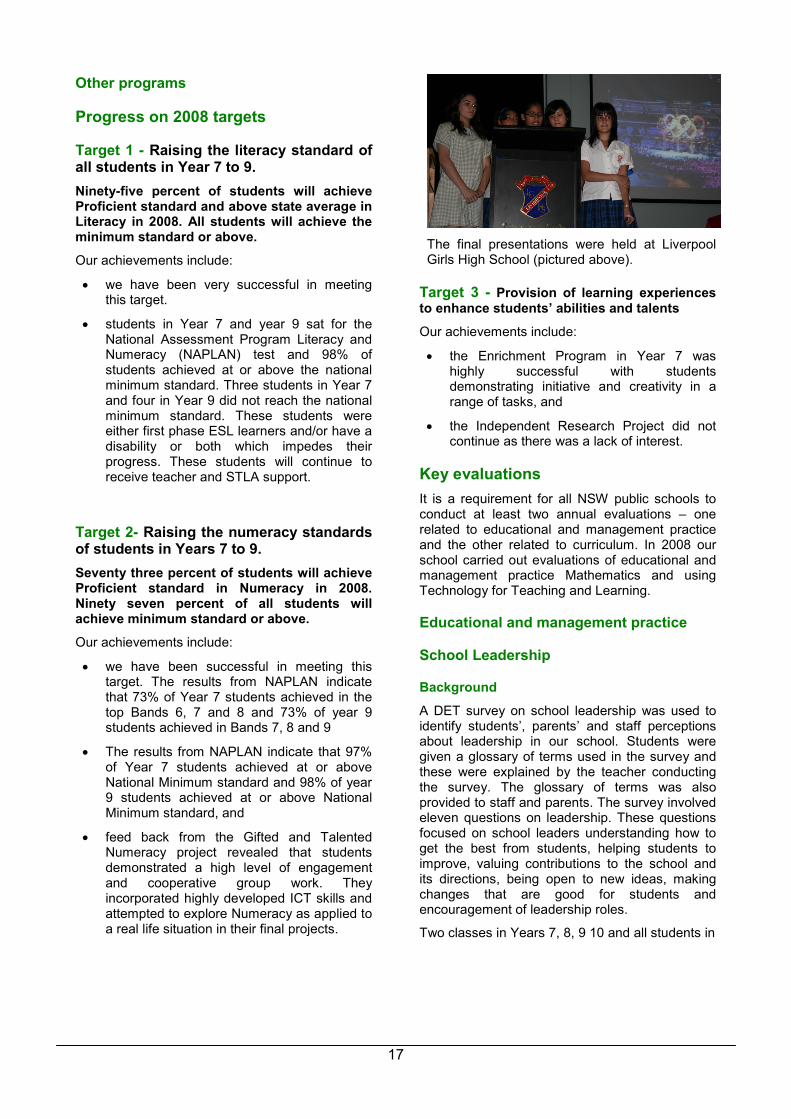
• feed back from the Gifted and Talented Numeracy project revealed that students demonstrated a high level of engagement and cooperative group work. They incorporated highly developed ICT skills and attempted to explore Numeracy as applied to a real life situation in their final projects.
The final presentations were held at Liverpool Girls High School (pictured above).
Target 3 - Provision of learning experiences to enhance students’ abilities and talents
Our achievements include:
• the Enrichment Program in Year 7 was highly successful with students demonstrating initiative and creativity in a range of tasks, and
• the Independent Research Project did not continue as there was a lack of interest.
Key evaluations
It is a requirement for all NSW public schools to conduct at least two annual evaluations – one related to educational and management practice and the other related to curriculum. In 2008 our school carried out evaluations of educational and management practice Mathematics and using Technology for Teaching and Learning.
Educational and management practice
School Leadership
Background
A DET survey on school leadership was used to identify students’, parents’ and staff perceptions about leadership in our school. Students were given a glossary of terms used in the survey and these were explained by the teacher conducting the survey. The glossary of terms was also provided to staff and parents. The survey involved eleven questions on leadership. These questions focused on school leaders understanding how to get the best from students, helping students to improve, valuing contributions to the school and its directions, being open to new ideas, making changes that are good for students and encouragement of leadership roles.
Two classes in Years 7, 8, 9 10 and all students in
18
Years 11and 12 were selected for the survey. All staff and a random sample of parents were also asked to complete the survey. There was a high response to the survey. In the junior school (Years 7 and 8) there was a 79% response; in the middle years (9 and 10) an 84% response, in the senior school (Years 11 and 12) a 94% response. The teaching staff response was 84%, 100% from the School Administrative and Support Staff (SASS) and 18.4% from parents.
Findings and conclusions
Overall the results were complimentary about the leadership in our school. Very high to high results were indicated by all groups on school leadership understanding how to get the best from students, valuing contributions, treating everyone fairly, looking at ways to improve and involving the school community.
Students rated lower the areas of leadership relating to talking to students about how to improve, inspiring and motivating learners and making changes that are good for students.
Staff ratings were slightly lower in the areas of motivating and inspiring students and making changes that are good for students. Parent responses indicated similar results. Follow up discussions were held with smaller groups of students in the junior and middle years to clarify the lower ratings and it was interesting to hear the explanations.
It appears that when the students were unsure about the leadership statement they rated it lower. However, students said that they did not know who were the leaders, especially student leaders, in our school. Also they were unaware when changes were made or they had not seen the outcomes of the changes. Junior students were unsure if teachers talked to other students about their work and therefore they could not respond highly to this question. Some students felt that their effort was not always recognised and their achievements were not consistently praised. These students stated that teachers did motivate and inspire learners but student leaders did not appear to do so or as much.
Future directions
There is a need to raise student awareness of leadership in our school, especially student leadership. There are already many leadership initiatives and programs but increased promotion of these is needed. The Student-Run Formal assembly, introduced last year, will add to the profile of student leaders in our school. Staff need to be reminded to acknowledge student effort and achievement with merit awards. The ‘E’ Assembly and Merit Assembly at the end of the school year as well as the Academic Presentation Assembly
are acknowledgement of student effort and achievement but there may be a need for other avenues throughout the year.
Similarly if changes are to be made, students need more explanation as to why the changes are being done and the benefits of the changes.
Curriculum
Mathematics
Background
In November 2005 the Mathematics Faculty under- took a review of their teaching practices. Findings from this review recommended that partial grading of the Mathematics classes should be trialled to further improve results across all years and levels. Staff and students were surveyed to find out if this approach has been effective.
Findings and conclusions
Students’ and teachers’ responses were extremely positive about Mathematics classes, curriculum and organisation. Surveys indicated that 79% of students felt that Mathematics was taught in a way that suited their learning styles, including the lesson content and speed of delivery of concepts. An overwhelming 88% of students liked being in a Mathematics class with students of the same ability. A large majority of students indicated they were comfortable in asking questions and seeking help in classes that had been restructured as opposed to those that had not.
All the Mathematics teachers agreed that the NSW Mathematics Syllabus supports the grading of classes and 88% felt that they could better differentiate the curriculum in the restructured classes.
Future directions
As a result of these findings the Mathematics Faculty are going to continue to structure Mathematics classes in such a way that students of a similar ability are grouped together.
Other evaluations
Educational and Management Practice
Using Technology for Teaching and Learning
Background
Four staff participated in the Team Leadership Program for School Leadership conducted by the Professional Learning and Leadership Development Directorate. Their project focus
19
linked directly to specifically investigating the use of a broad range of Information Technologies by the teaching and non-teaching staff of the school. Sixty nine staff members completed a comprehensive ethnographic research survey asking for levels of knowledge and skill in a range of technologies and software programs. Staff indicated skill levels ranging from elementary to proficient.
Findings and Conclusions After collecting and tabulating the survey data, patterns and trends were observed. A significant majority of staff are competent or proficient using ICT software and hardware to access the network and utilise Microsoft Word, Microsoft Excel, Power Point, ISchool, the Internet, Groupwise, DET Portal Email, Motorised Markbook, and Data Projectors (not including setting up a Data Projector). A significant minority of staff are competent or proficient in using new technology such as E-Beam technology, Video Conferencing technology, Pod Casting and Vod Casting, and Interactive Whiteboard set-up and use. The majority of staff identified several specific software packages and functions that they were unfamiliar with or not competent in using including Moodle, Active Studio, Sentral, Photo Shop, Microsoft Excel and Access, Audacity, Sony Acid Express, Inspiration, Movie Maker, Smart package, Web 2, Blogs, and Wikis. The majority of staff is not competent in setting up the school audio systems and data projection technology. Future Directions
Staff indicated strong interest in gaining further skills and in sharing skills and knowledge with students and staff. Opportunities to enrich teacher experience of technology in teaching and learning were programmed into the staff Professional Learning program. This program will be implemented in 2009. All KLAs are encouraged to continue using and introducing new technologies into teaching and learning for staff and students.
Parent, student, and teacher satisfaction
In 2008 the school sought the opinions of parents, students and teachers about the transition program that has been running in our school.
Their responses are presented below.
Primary Links
Background
A Primary Links Program has been implemented since 1994 by our school. The program involves students from a number of our feeder Primary Schools experiencing a regular school day.
Students are placed into classes and are taught by specialist teachers in a range of subject areas. It was decided to evaluate this program by conducting a series of questionnaires with the Primary Schools, parents and students who were involved in the program.
Findings and conclusions
Parents overwhelmingly supported the program and found it a valuable way to assist their children in transition into high school. The Primary Schools also found it valuable and supported the program’s continuation. Students who attended the program expressed a confident understanding about high school procedures. They also commented on their new abilities including reading timetables and making new friends.
Future directions
The Primary Links Program will continue in the same format and extra places will be offered in terms 1 and 2. Stronger curriculum links will be forged including the sharing of data such as NAPLAN results with the primary schools which will enable a smoother academic transition for students entering Year 7.
Professional learning
All teachers and 85% of school administrative staff participated in professional learning activities in 2008, which includes School Development Days in terms one, two and three.
The Professional Learning Management Team sets the directions for school professional learning based on feedback from the school’s management teams and the school’s self evaluation process. Focus items and training took place for all staff in a range of areas, including new Connected Classroom technology, interactive whiteboard technology, student assessment and reporting, student academic achievement data for NAPLAN (SMART data), literacy, numeracy, Gifted and Talented Education, Vocational Education and Training (VET) and for the new Stage 6 English syllabus prescriptions. Student Support team members attended workshops for new Year Coordinators and student mentoring.
The New Scheme Teachers (NST) program ensured ongoing professional support for our three beginning teachers. All three teachers involved in developing their portfolios for the Institute of Teachers have been successful in meeting the accreditation requirements.
School development 2009 – 2011
The 4 priority Focus Areas, as identified in our school’s Strategic Plan for the next 3 years, will
20
form the basis for the targets that our school will be aiming to achieve.
Targets for 2009
Target 1
Increase student achievement in literacy as measured by:
• number of Year 9 students increased to 90%, including Aboriginal and Torres Strait Islanders, achieving at or above the national minimum standard of band 7 in NAPLAN Literacy.
• number of Year 9 students increased by 4% (an increase from current 21% to 25%) achieving at or above at the higher Bands 9 and 10 in NAPLAN Literacy, and
• 80% of students achieving stage outcomes in English
Strategies to achieve this target include:
• analysis of NAPLAN data to identify areas for improvement
• development of focused strategies for the explicit teaching of literacy by faculties,
• building of teacher expertise in the teaching of literacy through professional learning activities,
• review of DEAR (Drop Everything and Read) for possible inclusion of peer reading and comprehension skills
• identification of areas of focus in English for review and development of teaching and learning programs
• implementation of extension programs for Gifted and Talented students, and
• increased use of technology e.g. laptops by Year 9 teachers and students to enhance learning in literacy
Our success will be measured by:
• NAPLAN results in literacy 2009
• school based assessments and student work samples
• increased teacher confidence in improving student learning outcomes in literacy as indicated by the additional professional learning activities
• development of differentiated teaching and learning strategies in English programs
• evidence of the use of laptops and other technologies in Year 9 to enhance literacy learning outcomes
Target 2
Increase student achievement in numeracy as measured by:
• number of Year 9 students, including Aboriginal and Torres Strait Islanders, increased by 3% (an increase from current 80% TO 83%) achieving at or above the national minimum standard of band 7 in NAPLAN Numeracy.
• number of Year 9 students increased by 4% (an increase from current 23% to 27%) achieving in the higher Bands of 9 and 10 in NAPLAN Numeracy, and
• number of students increased by 15% (an increase from current 45% to 60%) achieving minimum growth from Year 7 to Year 9 in NAPLAN Numeracy.
Strategies to achieve this target include:
• analysis of NAPLAN data to identify areas for improvement
• development of focused strategies for the explicit teaching of numeracy by faculties
• building teacher expertise in the teaching of numeracy through professional learning activities
• identifying areas of focus for students in the lower bands as indicated by the 2008 NAPLAN Year 7 results for demonstrated growth in Year 7 and Year 9
• implementation of extension activities / programs for gifted and talented students, and
• increased use of technology e.g. laptops by Year 9 teachers and students to enhance students’ learning in numeracy
Our success will be measured by:
• NAPLAN results in Numeracy 2009
• school based assessments and student work samples
• increased teacher confidence in improving student learning outcomes in numeracy as indicated by the additional professional learning activities
• monitoring of students’ progress from Year 7 to Year 9 in numeracy
21
• Evidence of the use of laptops and other technologies in Year 9 to enhance numeracy learning outcomes
Target 3
Increase teacher use of Connected Classroom and other technologies to enhance student learning and improve efficiency of information access and storage:
Strategies to achieve this target include:
• survey of staff in terms of expertise in using a range of technologies for teaching and learning and administration
• building teacher expertise and confidence in the use of Connected Classroom technology and laptops through professional learning activities and by support personnel
• identification of the use of appropriate technologies within faculties
• improved access to appropriate technologies across classrooms
• integration of at least 1 unit/module of connected learning into each course
• evaluation of current data management systems for improved administration, and
• establishment of Technology in Teaching and Learning Team to assist staff with the use of Connected Classroom technology and laptops
Our success will be measured by:
• increased staff expertise and confidence in the use of connected Classroom and other technologies as indicated by staff survey and professional learning activities
• introduction of new management systems using technologies to provide increased access to classrooms and a more integrated administration system
• evidence of increased use of Connected Classroom and other technologies as indicated by number of lessons and integration into teaching and learning programs
• report from Technology in Teaching and Learning Team (TTL) on work done to support teachers in the use of laptops in Year 9 lessons
Target 4
Increase students’ understanding of the significance of their learning at school by encouraging participation in programs of enrichment and increased engagement in learning.
Strategies to achieve this target include:
• Evaluation of unit of work in a stage 5 program to embed strategies which enhance the level of significance as indicated in the Quality Teaching (Q.T.) framework
• Collection of data to identify programs of enrichment available to students
• Survey of students to identify level of awareness of current enrichment programs and interest in these and other possible programs
• Build up library resources covering a broad range of interests
• Explore ways to expand co-curriculum activities and other specialist learning opportunities
• Enhance the physical classroom environment
Our success will be measured by:
• Explicit teaching of significance as indicated in the QT framework
• Enhancement of co-curricular activities
• Increased provision of specialist learning opportunities
• Number and range of enrichment programs to meet students’ interests and/or talents
• Classrooms that are more attractive and conducive to learning
22
About this report
In preparing this report, the self-evaluation committee has gathered information from evaluations conducted during the year and analysed other information about the school's practices and student learning outcomes. The self-evaluation committee and school planning committee have determined targets for the school's future development.
Cassandra Comans Student
Lucy Tierney Student
Mr Steve Ventrella Parent
Ms Leanne Masson Parent
Mrs Karen Seymour President School Council/ P&C Vice President
Ms Kaye Jeffers School Administration Manager
Mr Leigh Rowney Head Teacher
Mrs Annette Brunt Deputy Principal
Mrs Veronica Necyporuk Principal
School contact information
East Hills Girls Technology High School
Lucas Road, Panania
Ph: 9773 9160
Fax: 9792 3853
Email: [email protected]
Web: www.easthillsg-h.schools.nsw.edu.au/
School Code: 8187
Parents can find out more information about Annual School Reports, how to interpret information in the reports and have the opportunity to provide feedback about these reports at:
http://www.schools.nsw.edu.au/asr

23
24
Primary Links
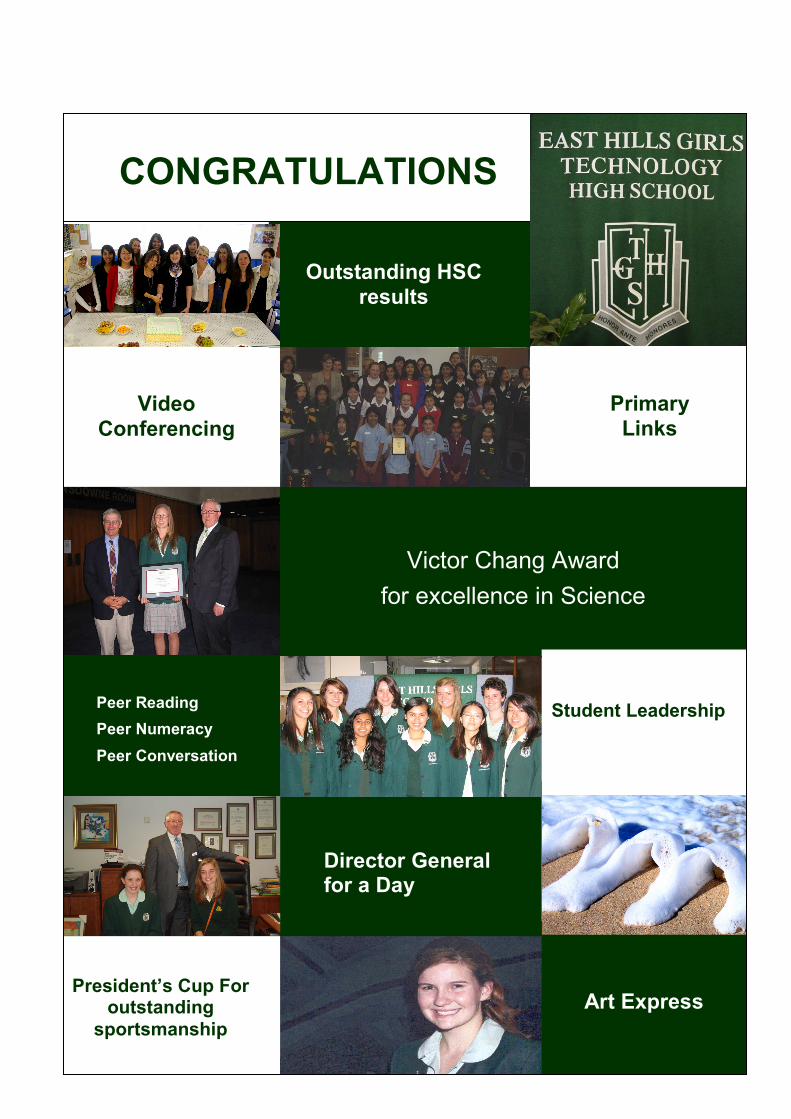
CONGRATULATIONS
Video
Conferencing
Victor Chang Award
for excellence in Science
President’s Cup For outstanding
sportsmanship
Peer Reading
Peer Numeracy
Peer Conversation
Outstanding HSC
results
Director General for a Day
Primary
Links
Student Leadership
Art Express