Heritage Middle School Sixth Grade Orientation. OUR MISSION EDUCATE…EMPOWER…ENRICH…
Upload
leona-allenCategory
view
213download
0
Educate and empower students in Grade 3 to understand diabetes and how to prevent it.Working Draft of a potential excerpt from a lesson plan that meets specific MB Provincial Outcomes for Grade 3 Math. Note that this lesson plan gives students the opportunity to deploy critical thinking skills. (Estimated total collateral health cost of Diabetes in Manitoba is around $500 million annually)
Interdisciplinary/cross-curricular lesson plans that meet the provincial education guidelines while being sensitive to Aboriginal culture and traditions.
Note each slide would have notes to the teacher with suggestions
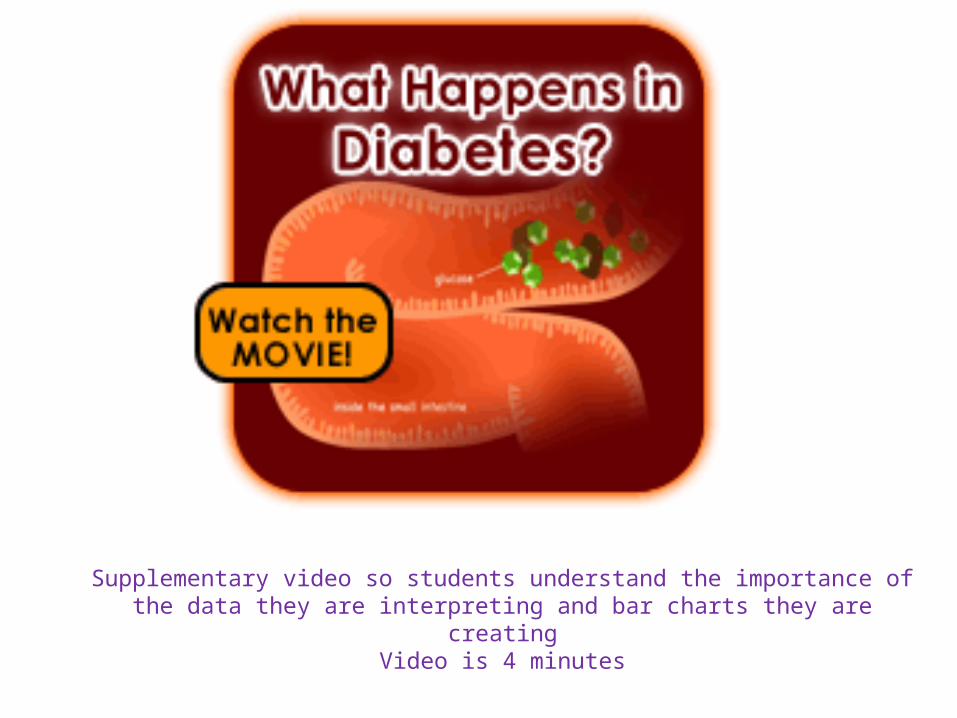
Supplementary video so students understand the importance of the data they are interpreting and bar charts they are creating
Video is 4 minutes

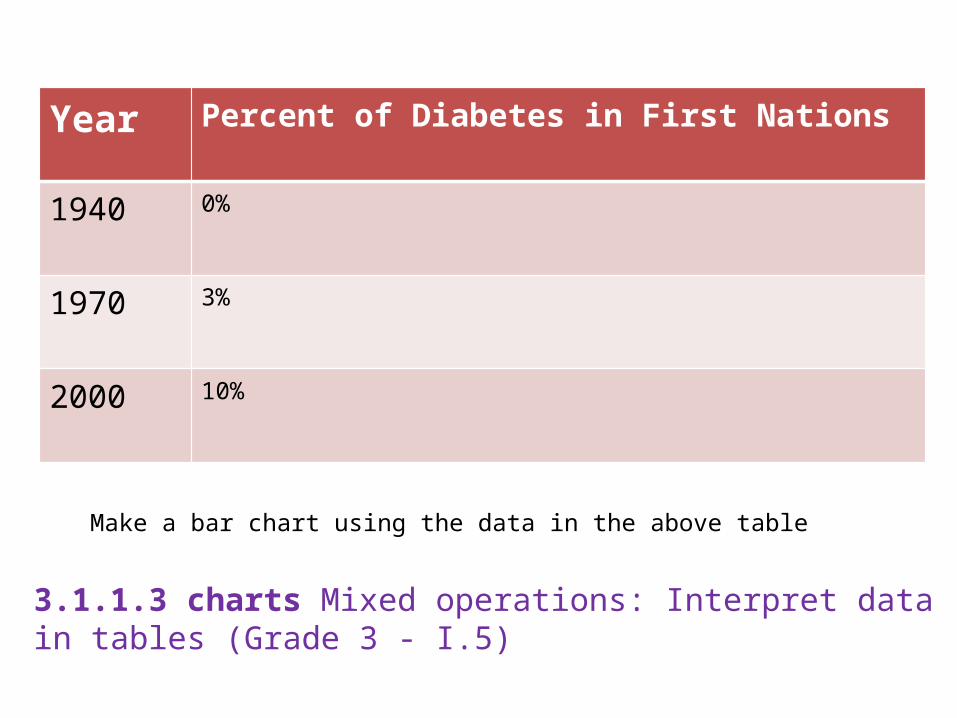
Diabetes in First NationsMake a table from the data below
• Year 1940 -0 % of the population have Diabetes Type 2 • Year 1970- 3% of the population have Diabetes Type 2• Year 2000-10% of the population have Diabetes Type 2
3.1.1.3 charts Mixed operations: Interpret data in tables (Grade 3 - I.5)
Year Percent of Diabetes in First Nations
1940 0%
1970 3%
2000 10%
3.1.1.3 charts Mixed operations: Interpret data in tables (Grade 3 - I.5)
Make a bar chart using the data in the above table

1940 1970 20000
2
4
6
8
10
12
Diabetes
YearPerc
ent o
f Dia
bete
s in
Firs
t Nati
on P
opul
ation
Graphs: Create bar graphs (Grade 3 - P.5)

1940 1970 20000
2
4
6
8
10
12
Diabetes
3.1.2 Construct, label and interpret bar graphs to solve problems. Graphs: Interpret bar graphs (Grade 3 - P.4)
Interpreting the data develops critical thinking skills enabling the students to explore what factors could be responsible for the increase in diabetes in general and epidemic proportion in the First Nations Population.

Traditional Diets –Read and discuss legend of Three Sisters (See the brochure for overview of Three Sisters Legend

The Tortoise and the HareSlow and steady wins the race
• The glycemic load measures the speed at which a food breaks down in the digestive system to form glucose, which in turn enters the blood stream to feed every cell in your body.
• It is better to eat foods that break down slowly and does not quickly increase your blood sugar
Click the hare to watch video on internet -8 minutes

Lots of sugar entering bloodstream quickly
Foods that break down slowly and does not quickly increase your blood sugar

Glycemic Load Per Serving
• Graph Foods according to glycemic loads
3.1.1.2 line plots Graphs: Interpret line plots (Grade 3 - P.6) Graphs: Create line plots (Grade 3 - P.7)
0 1 2 3 4 5 6 7 8 9 10 11 12 13 14 15 16 17 18 19 20 21 22 24 25 26 27 28……43
Chic
kpea
s ,
Pean
uts
Wat
erm
elon
, Pea
r, Ap
ple
, Gra
pefr
uit,
Cash
ews,
Gre
en P
eas
Frui
t Rol
l-Ups
®
The complete list of the glycemic index and glycemic load for more than 1,000 foods can be found in the article "International tables of glycemic index and glycemic load values: 2008" by Fiona S. Atkinson, Kaye Foster-Powell, and Jennie C. Brand-Miller in the December 2008 issue of Diabetes Care, Vol. 31, number 12, pages 2281-2283.
Mac
aron
i & C
hees
e, R
aisi
ns
Bana
na, r
ipe,
Inst
ant M
ashe
d Po
tato
es, P
uffed
Whe
at
Soy
Whi
te R
ice
Raw
Car
rots
COO
KED
Car
rots

Look at the line plots and answer the following questions1. What fruits have the lowest glycemic loads?2. What food has the highest glycemic load?3. What is a good snack food to eat?4. What foods were you surprised to learn had a high load?5. Does cooking food increase the glycemic load?
3.1.1.2 line plots Graphs: Interpret line plots (Grade 3 - P.6) Graphs: Create line plots (Grade 3 - P.7)

• Raw foods take longer to digest, so that it slows the digestion of food
• Foods that are cooked will be more rapidly digested and therefore have a higher glycemic load.
• That is why cooked food (cooked carrots) have a higher glycemic load.
• Do you think raw foods are better for you?

Mush or Raw