Editor: Kevin Cheng Tel: (852) 2277 6626 Email...
16
-
Upload
nguyenkhue -
Category
Documents
-
view
214 -
download
0
Transcript of Editor: Kevin Cheng Tel: (852) 2277 6626 Email...

denniswu
Typewriter
denniswu
Typewriter

MCI (P) 194/11/2012 Ref No: RM2013_0151 1 of 14
Regional Market Focus
Phillip Securities Research Pte Ltd
7 August 2013
Singapore
Wilmar International Ltd - 2Q13 results; down QoQ, but up YoY Recommendation: Accumulate Closing price: S$3.15 Fair value: S$3.61
2Q13 core profit of US$245mn (+42% YoY, -22% QoQ) Lower raw material prices to benefit downstream business Maintain Accumulate with new TP of S$3.61
Genting Singapore – Results (Ken Ang) Recommendation: Neutral Previous close: S$1.34 Fair value: S$1.37
2Q13 NPAT S$140.2 million, EBITDA S$322.5 million Clarity on combined impact of various potential catalysts required before adjustments to forecast are made Maintain “Neutral”, based on 13X EV/EBITDA, with new TP of S$1.37, due to a lack of clear rerating catalyst.
StarHub - Steady growth on Mobile Recommendation: Accumulate Previous close: S$4.27 Fair value: S$4.37
Revenue declined -0.7% y-y on lower revenue from Pay TV Net Income increased 15.9% y-y to $100.6m ($191.8m for half-year), mainly due to higher adoption grant and lower operating expenses. Dividend yield of 4.7% continues to be attractive. Maintain “Accumulate” with revised TP of S$4.37 Source: Phillip Securities Research Pte Ltd

MCI (P) 194/11/2012 Ref No: RM2013_0151 2 of 14
US
Iconix Brand Group – No. 2 Global Licensor After Disney (Wong Yong Kai) Recommendation: Trading Buy Previous Close: USD 34.09 Fair Value: USD 43.19
Despite $13 billion global annual sales and “No. 2 Global Licensor” recognition, Iconix is still a fairly unknown name at $2.5 billion fully diluted market cap, and trades at a low 12.0x adjusted 2013F free cash flow.
High Customer Demand: Licensing enables retailers to brand merchandise, yet earn high private-label like margins. Recurring High Margin Revenues: $600+ million of contractually guaranteed minimum royalty payments, and high 61% EBITDA margins
on negligible capex. Disciplined Capital Allocation: Management weighs every acquisition against share buybacks. Iconix has spent $1.9 billion on
acquisitions in total, while repurchasing 11.9 million shares (18% outstanding shares) this year. Established Acquisition Criteria: Aims for 65% of purchase price in guaranteed minimums, and 5.0x average acquisition multiple (ie.
licensing fees). Notably, intangible assets are amortized over 15 years for tax purposes, but no corresponding GAAP expense due to indefinite useful life.
Multi-Pronged Growth Strategy: After acquisition, Iconix might make over the brand, extend the product line, and/or improve retail store penetration to grow revenues. International revenue contribution has increased from 6% in 2009 to a forecasted 33% by end 2013, partly driven by 50-50 joint ventures with Silas Chou & family (behind Tommy Hilfiger, Michael Kors), Falic Group (largest duty free store operator in Americas with over 150 stores and distributor of luxury brands), and Reliance Industries, among others.
Hong Kong
China’s Auto Sector Interim Report 2013 Closing price: N/A Target price: N/A
The market demand finally started to recovery gradually in 1H2013 from the end of 2012 after China’s auto market experienced sharp decrease since 2011, which maintained the increase month by month in terms of the y-y growth rate of industrial sales volumes, in line with our expectation in the previous sector report.
In 1H2013, the sales of vehicles in China increased by 12% y-y to 10.782 million units, up 9.4ppts largely compared with the growth ratio during the same period of 2012, representing the obvious recovery of demand. The sales scale and growth rate of China’s auto market continued to lead the industry worldwide, and ranked No.1 consistently in the last four years.
Especially, the growth of PVs increased significantly, the accumulated sales increased by 13.8% y-y to 8.665 million units, up 6.7ppts. The y-y growth rate of CVs was slower than that of PVs, up 6.7% y-y to 2.117 million units, but the growth range was much higher than
that of PVs, which increased largely by 17ppts compared with that of 2012H. According to the types of vehicles, the consumption boom of SUV in PVs still persisted, the accumulated sales increased by 41.6% y-y
to 1.33 million units in 1H2013. MPV recorded the better performance according to the changes of statistical standards (Including Shanghai GM’s Wuling Hongguang), the growth rate was much higher than the industry average, up 128.2% y-y to 0.57 million units. Saloon car increased stably with the year-on-year growth rate of 11.7% to 5.84 million units.
The proportion of the sales of SUV to PVs continued to increase by 3ppts from 12.3% in 1H2012 to 15.3%. We believe the trend of the boom in SUV market is difficult to be changed in the short term, and this segment market will maintain the higher growth compared with the industry average as the expansion of production capacity and the increase of types of vehicles.
According to the nationality, the pressure of self-owned bands of PVs was larger, the sales increased by 13.2% in 1H2013, and the market share decreased by 0.23ppts y-y, the sales growth declined month by month. Japanese brands of passenger cars stated to rebound, but the growth rate was still lower than the industry averages, and therefore the market shares maintained on the low level, decreased largely by 4.2ppts y-y to 14.8%.
Other joint venture brands kept higher growth, the market shares of PVs of Germany, American, Korean and French series recorded 19.4%, 12.1%, 9.1% and 3.2% respectively. Especially Germany and Korean series increased obviously by 1.5 and 1.3ppts y-y, and the market shares of American and French series were expanded 0.9 and 0.5ppts y-y respectively.
Although the comprehensive competitiveness of China’s self-owned brands has improved largely in recent years, there is still a gap between the foreign and self-owned bands to some extent, and the pressure of competition will be stronger as the slow-down of the market and the shocks from foreign brands.

Regional Market Focus
7 August 2013
3 of 14
Morning Commentary
STI: -0.52% to 3224.9 KLCI: -0.03% to 1784.6 JCI: +0.36% to 4640.8 SET: +0.36% to 1429.4 HSI: -1.34% to 21923 HSCEI: -0.78% to 9650.4 Nikkei: +1.00% to 14401 ASX200: -0.11% to 5105.6 Nifty: -2.52% to 5542.25 S&P500: -0.57% to 1697.4 MARKET OUTLOOK: For the latest outlook on trading the markets, please see our webinar slides at www.uniphillip.com > education programs > Phillip Securities Research Webinar. We also feature Ezion (Accumulate) in our webinar, take profit on Garmin, as well as continue to be bullish on Genworth. For our longer term outlook please see the latest Global Macro Asset Strategy report below. (PhillipCFDs and ETFs for trading the market outlook can be found in the webinar slides above or the Global Macro report below. PhillipUT Wrap Account offers tactical asset allocation of unit trusts without front loading sales charge.)
Thailand
Berli Jucker - Trade Flash Recommendation: BUY Previous close: Bt43 Fair value: Bt68
We expect BJC to report 2QCY13 net profit of Bt723.40mn, up 8.8% q-q and 40.7% y-y thanks to full-quarter consolidation of Thai An (Vietnam) and recent investments which start bearing fruits.
BJC has continued its investments in line with its long-term investment plan. Management has guided for CY13 investment budget of around Bt8bn.
We maintain our forecast that BJC will deliver CY13 net profit growth of 13% y-y to Bt2,741mn. We rate BJC shares a ‘BUY’ with a DCF-based target price of Bt68/share.
Major Cineplex Group - Trade Flash Recommendation: BUY Previous close: Bt21.30 Fair value: Bt25
We expect MAJOR to report stellar earnings growth of 63.85% y-y in 2QCY13 thanks to a strong lineup of several blockbuster movies released during the period.
Our forecast suggests MAJOR will pay an interim dividend of Bt0.50/share for 1HCY13 operations.
MAJOR is currently making a tender offer for all remaining shares in MPIC and M Channel is also keen to bid for digital TV licenses for variety channels.
Due to the likely absence of impairment charges, 2HCY13 earnings are expected to be better than 2HCY12.
We raise our CY13 net profit outlook for MAJOR to Bt1,108mn. We also upgrade MAJOR shares to ‘BUY’ with an upwardly revised target price of Bt25/share.
Strategy
SECTOR/STRATEGY REPORTS:
- Sector Reports: Banking, 8 Jul / Telecommunications, 5 June / Commodities, 29 May / Offshore & Marine, 27 May - Country Strategy: China & HK 5 July / S’pore, 18 Jun / Thai, 17 Jun - Global Macro, Asset Strategy: 8 Jul, Update
http://internetfileserver.phillip.com.sg/POEMS/Stocks/Research/ResearchCoverage/TH/MAJOR20130807.pdf
http://internetfileserver.phillip.com.sg/POEMS/Stocks/Research/EconomicPulse/SG/strategy20130705.pdf

Regional Market Focus
7 August 2013
4 of 14
Singapore The benchmark STI closed lower at 3,224.89 (-0.52%). The 2.0bn shares traded
were worth S$1.1bn in value. We expect the STI to consolidate at current levels, with key near term support at
3,200 levels. Top picks for the year are Pan United (Buy, TP: S$1.21), SGX (Buy, TP: S$8.30)
& Keppel Cord (Accumulate, TP: S$12.25).
Close +/- % +/-FSSTI 3224.89 -16.90 -0.52P/E (x) 13.28P/Bv (x) 1.42
3.19Dividend Yield
STRAITS TIMES INDEX
2500
2700
2900
3100
3300
3500
3700
8/6 11/6 2/6 5/6 8/6
Source: Bloomberg
Thailand Thai stocks took a roller coaster ride on Wed with intraday swings of up to 30
points on political rumors before the SET index finished the session up a mere 5.08 points at 1,429.39 points.
The market remained clouded by domestic political pressure as controversial amnesty-related bills are tabled for debate in parliament today amid protests against the bills. Overnight losses on Wall Street amid QE exit fears after comments from Fed officials that the Fed could begin trimming the size of the stimulus program as soon as Sep but much depends on economic data.
Wild intraday swings are likely to continue in the Thai stock market, reflecting the fragility of the market amid light trading volume. Foreign fund flows remained mixed amid alternate bouts of buying and selling while the baht extended its slide to 30.43 to the US dollar this morning (0800 hrs Thailand time)
The SET index is likely to continue its downside bias in a trading range of 1400-1440 today. Cut loss if the main index closes below 1400.
Today we peg resistance for the SET index at 1440-1460 and support at 1420-1400.
Close +/- % +/-SET INDEX 1429.39 5.08 0.36P/E (x) 16.07P/Bv (x) 2.26
3.03Dividend Yield
STOCK EXCH OF THAI INDEX
900
1000
1100
1200
1300
1400
1500
1600
1700
8/7 11/7 2/7 5/7
Source: Bloomberg
Indonesia
Exchange is closed.
Close +/- % +/-JCI Index 4640.78 16.45 0.36P/E (x) 18.70P/Bv (x) 2.84
2.11Dividend Yield
JAKARTA COMPOSITE INDEX
3400
3900
4400
4900
5400
8/7 11/7 2/7 5/7
Source: Bloomberg

Regional Market Focus
7 August 2013
5 of 14
Sri Lanka The Market recovered to some extent from its bear run as the indices reversed
the gear, to conclude within the green terrain; this was having lost 42 points during the previous trading day. The benchmark ASPI gathered 7.27 points or 0.12% to conclude at 6,121.45. The S&P SL20 too closed positive gaining 5.57 points or 0.16% to settle the day at 3,477.04. As at the day’s close, the total market capitalization stood at LKR 2.36Tn, charting a year to date gain of 8.68%. The market PER & PBV stood at 16.20 and 2.18 respectively. The day witnessed an aggregate turnover of 531.86Mn, indicating a rise of 84.40% against its previously recorded; nearly 55% of this was accounted by the top three contributors for the day. Under the sectorial review, Diversified Holdings (DIV) dominated the list, providing LKR 188.89Mn. Bank Finance & Insurance (BFI) sector too provided a notable LKR 110.71Mn; further, BFI managed to capture the highest investor interest during the day noting 1,654 trades which resulted in a total quantity of 8.65Mn shares changing hands. During the day, a total of 23.21Mn shares changed hands, indicating an increase of 43.24% against the previous trading day. Price losers outstripped the price gainers by 105:67. Foreign participants were bullish during the day, where foreign buying of LKR 363.86Mn overtook foreign selling which amounted to LKR 213.50Mn; this added LKR 150.36Mn to the year to date net foreign inflow of LKR 16.10Bn. The local FOREX market for the day closed with, the USD selling at LKR 133.21/- and buying LKR 130.01/-.
Close +/- % +/-CSEALL Index 6121.45 7.27 0.12P/E (x) 12.30P/Bv (x) 1.68
2.57
Dividend Yield
SRI LANKA COLOMBO ALL SH
4500
5000
5500
6000
6500
7000
8/7 11/7 2/7 5/7
Source: Bloomberg
Australia The Australian share market on Tuesday closed lower with the Reserve Bank of
Australia's rate cut failing to lift the Australian share market into positive territory from its morning falls. The benchmark S&P/ASX200 index was down 5.7 points, or 0.11 per cent to 5,105.6 points.
Today (07/08/13), the Australian market looks set to open lower following falls on Wall Street overnight amid warnings of weaker company profits.
In economic news on Wednesday, the Australian Bureau of Statistics releases housing finance data for June and the Australian Industry Group/Housing Industry Association performance of construction index (PCI) for month just ended is also due out. Meanwhile, Reserve Bank of Australia assistant governor (Financial Markets) Guy Debelle, is scheduled to take part in a panel discussion at the Funding Australia's Future Forum hosted by the Australian Centre For Financial Studies.
In equities news, BHP chief executive Andrew Mackenzie is slated to speak at a Asia Society Australia lunch, in Melbourne, and 21st Century Fox (formerly News Corp) posts full year results in the US.
Close +/- % +/-S&P/ASX 200 INDEX 5105.63 -5.62 -0.11P/E (x) 20.77P/Bv (x) 2.01
5.71
STANDARD & POORS/ ASX 200 INDEX
Dividend Yield
3800
4000
4200
4400
4600
4800
5000
5200
5400
8/7 11/7 2/7 5/7
Source: Bloomberg
Hong Kong
HSI and CEI dropped 298 points or 1.34% to 21,923 and 75 points or 0.78% to 9,650 respectively. Trading volume rebounded little bit to HKD49.015 billion.
Following HSBC (5.HK)’s interim results, which trailed analysts’ estimates, HSI dropped 413 points to day low of 21,808 in the morning, close to the key support line of 250-MA. But led by A-share market, HSI rebounded in the afternoon.
Lee & Man Paper (2314.HK) released interim results with net profit climbed 44.1% yoy to HKD971 million but management is prudent on 2H2013 situation and expected no paper price raising, the stock price dropped 9.9% to HKD4.98. ND Paper (2689.HK) also lost 7.2%.
Technically, HSI dropped below 10-MA at 21,995, we expect next support will be at 21,804. Resistance will be at 22,194. Close +/- % +/-
HSI INDEX 21923.70 -298.31 -1.34P/E (x) 10.18P/Bv (x) 1.40
3.43Dividend Yield
HANG SENG INDEX
17000
18000
19000
20000
21000
22000
23000
24000
25000
8/7 11/7 2/7 5/7
Source: Bloomberg

Regional Market Focus
7 August 2013
6 of 14
Market News
US Federal Reserve Bank of Chicago President Charles Evans, who has been among the most vocal proponents of record monetary
accommodation, said there has been “good improvement” in the labor market and indicated that a tapering of the central bank’s bond-buying program in September is possible. Evans, speaking to reporters today, said the Fed probably will have bought at least $1.2 trill ion of bonds from January 2013 until the time he sees the current quantitative easing program ending in mid-2014. “We’ve seen good improvement in the labor market, there’s no question in my mind about that,” Evans said in Chicago. “I’m still wanting to see greater evidence that it’s a sustainable improvement” and “I would clearly not rule” out a decision to begin dialing back the purchases in September. U.S. central bankers are scrutinizing incoming economic reports to determine if the labor market has substantially improved since last September, when they renewed an expansion of their balance sheet that’s now at $3.57 trillion. The economy added the fewest jobs in four months in July, even as the unemployment rate fell to 7.4 percent, Labor Department figures showed Aug. 2. (Source: Bloomberg)
Singapore In the battle for data revenue, all three telcos are striking back hard. SingTel has become the first local operator to team up with the
industry's thorn in the side - over-the-top (OTT) enfant terrible WhatsApp. Rival StarHub will do the same with an unnamed social messaging service, and M1 has thrown its lot in with the industry's answer to OTT players - Rich Communications Services (RCS). Yesterday, SingTel launched the country's first exclusive WhatsApp partnership, targeting prepaid users who have thus far been constrained in their usage of the messaging service by pay-as-you-go pricing or small data packages on offer. The WhatsApp plan costs 50 cents for a day, $3 for seven days and $6 for 30 days. These are capped at 1 gigabyte (GB) a day, beyond which, data usage is taken out of any existing data plans that a user might have, or charged on a 10-kilobyte (KB) basis. This move carries a particular urgency. Last year, telcos lost US$23 billion in SMS revenue to social messaging services, according to estimates by Ovum. (Source: Business Times)
Thailand Kasikorn Bank said mortgage loan rejections jumped to 30%-35% from 25%-30% while rejections for personal loans and revolving credits
rose to 49% from 46% along with rising household debt but the bank believed it is unlikely to affect its retail loan growth target of 10%-13% for this year. (Source: Post Today)
Thailand’s consumer confidence index slipped in Jul, marking the fourth straight month of declines in light of dimmer economic and political outlook. The University of Thai Chamber of Commerce’s survey showed the confidence index fell from 81.6 points in Jun to 80.03 in Jul. (Source: Bangkok Post)
The UN's human rights office is urging Thailand to oppose a proposed amnesty law that could allow some serious human rights offenders to go unpunished. Cecile Pouilly, spokeswoman for the Office of the UN High Commissioner for Human Rights, says the Thai bill being taken up this week could pardon people involved in abuses during the military crackdown on anti-government protesters in 2010. (Source: Bangkok Post)
The cabinet on Tue gave the nod to four new stimulus packages: private consumption, private investment, public spending and exports to spur the economy with the aim of boosting growth by one percentage point. (Source: Bangkok Post)
Hong Kong Two of China’s richest men are intensifying their rivalry over the world’s biggest Internet market. Jack Ma’s Alibaba Group Holding Ltd.,
the country's largest e-commerce company, on Aug. 1 said it blocked Tencent Holdings Ltd. (700)’s WeChat to sellers. Four days later, billionaire Pony Ma’s Tencent introduced online payment features to mainland China users of its WhatsApp-like chat software. Alibaba is headed for what may be the biggest initial share sale since Facebook Inc., while Tencent is China’s biggest Internet company, with more than 300 million users for WeChat, which started in 2011. Both have made purchases and encroached on each other’s established markets in the battle for dominance of the country’s online spending. McKinsey & Co. estimates China's Internet retail will triple to $395 billion from 2011 to 2015. “Tencent is still in the land-grabbing phase,” said Billy Leung, an analyst at RHB Research Institute Sdn. in Hong Kong. “They’re still trying to improve their market share for the e-commerce space. On the other hand, Alibaba is trying to defend its territory.” Tencent has surged 51 percent this year, the most on Hong Kong’s benchmark Hang Seng Index and pushing its ma rket value to almost $90 billion. Alibaba’s valuation may be about $105 billion should it push forward with an IPO , Goldman Sachs Group Inc. (GS) estimated in a July 22 report. (Source: Bloomberg)

Regional Market Focus
7 August 2013
7 of 14
Sri Lanka Sri Lanka's12-month Treasuries yield edged up 05 basis points to 10.57 percent at Wednesday's auction. There were no offers or sales
of three and six month bills. The debt office offered 12.0 billion rupees in bills for rollover and sold 17.6 billion rupees in bills. (lankabusinessonline.com)
Sri Lanka's budget deficit will narrow and debt will slow with falling domestic interest rates and public private partnerships in infrastructure. In 2014 the budget deficit is likely to be about 5.2 percent of gross domestic product. Private investments in infrastructure would also increase. The Colombo port has already seen an investment by a port company. Public Private Partnerships will also increase in the future, especially in roads. (lankabusinessonline.com)
Sri Lanka domestic and foreign currency issues will expand three fold over the next five years. The excitement in the bond market is a step in the right direction for Sri Lanka to become a financial hub for South Asia. Sri Lanka saw a surge in listed bond issues as they were made tax free. Banks were among the top buyers of debt issues by some highly rated corporates as small investors were kept out with a 10,000 dollar minimum threshold. (lankabusinessonline.com)
Australia Activity in Australia's construction sector has fallen for the 38th consecutive month, but the pace of decline is slowing. The Australian
Industry Group-Housing Industry Association Australian Performance of Construction Index (PCI) rose 4.6 points to 44.1 in July. An index reading below 50 indicates activity in the sector is falling and the lower the reading, the greater the speed of the decline. Ai Group director of public policy Peter Burn said the fading mining-related construction activity was not being offset by the other construction sub-sectors. "While the house building sub-sector approached an expansion in activity, apartment-building slowed at a steeper pace and commercial construction was also slower in July," he said. "The industry continues to face a tough and uncertain environment characterised by tight credit conditions, a lack of public sector building activity and subdued investor sentiment. (Source: The Australian)
Westpac has hit back at rivals eating into the bank's market share, slashing borrowing rates by more than the Reserve Bank as the mortgage war among lenders intensifies amid a resurgent property market. On day two of an election campaign dominated by the economy, the RBA yesterday cut the official cash rate to 2.5 per cent -- the lowest level on record -- in a fresh attempt to spur activity in the non-resources economy and revive chronically low business confidence. (Source: The Australian)
The head of investment at the World Gold Council says Australia's $12 billion industry is better positioned than any other to capitalise on an imminent price boost due to its proximity to China and the wealth of its reserves of the precious metal Marcus Grubb told The Australian in the goldmining centre of Kalgoorlie yesterday that despite the gloom pervading the gold sector, he forecast that global demand would again outstrip supply by the end of the year, pushing up a gold price that has plunged more than 30 per cent this year. (Source: The Australian)

Regional Market Focus
7 August 2013
8 of 14
81.64 +0.04% 281.37 -0.64%
108.40 -0.72% 2.638 -0.00%
1,283.17 -0.57% 15,518.74 -0.60%
516.17 -0.95% MSCI SEA 860.35 -0.43%
2,790.78 -0.65% 54.1
Source: Bloomberg
MSCI Asia x-Japan
JPM Global Composite PMI SA
ThomReuters/JefferiesCRB
DJI
Crude oil, Brent (US$/bbl) US Treasury 10yr Yield
Euro Stoxx 50
Dollar Index
Gold (US$/Oz)
1.201.401.601.802.002.202.402.602.803.00
Aug-12
Sep-12
Oct-1
2
Nov-12
Dec-12
Jan-1
3
Feb
-13
Mar-1
3
Apr-1
3
May-1
3
Jun-1
3
Jul-1
3
Aug-13
700
750
800
850
900
950
1,000
Aug-12
Sep-12
Oct-1
2
Nov-12
Dec-12
Jan-1
3
Feb
-13
Mar-1
3
Apr-1
3
May-1
3
Jun-1
3
Jul-1
3
11,000
12,000
13,000
14,000
15,000
16,000
Aug-12
Sep-12
Oct-1
2
Nov-12
Dec-12
Jan-1
3
Feb
-13
Mar-1
3
Apr-1
3
May-1
3
Jun-1
3
Jul-1
3
2,0002,1002,2002,3002,4002,5002,6002,7002,800
Aug-12
Sep-12
Oct-1
2
Nov-12
Dec-12
Jan-1
3
Feb
-13
Mar-1
3
Apr-1
3
May-1
3
Jun-1
3
Jul-1
3
48
49
50
51
52
53
54
55
56
Aug-12
Sep-12
Oct-1
2
Nov-12
Dec-12
Jan-1
3
Feb
-13
Mar-1
3
Apr-1
3
May-1
3
Jun-1
3
Jul-1
3
1,100
1,200
1,300
1,400
1,500
1,600
1,700
1,800
Aug-12
Sep-12
Oct-1
2
Nov-12
Dec-12
Jan-1
3
Feb
-13
Mar-1
3
Apr-1
3
May-1
3
Jun-1
3
Jul-1
3
Aug-13
78
80
82
84
Aug-1
2
Sep-1
2
Oct-1
2
Nov-1
2
Dec-1
2
Jan-1
3
Feb
-13
Ma
r-13
Apr-1
3
Ma
y-13
Jun-1
3
Jul-1
3
Aug-1
3
260
280
300
320
340
Aug-1
2
Sep-1
2
Oct-1
2
Nov-1
2
Dec-1
2
Jan-1
3
Feb
-13
Ma
r-13
Apr-1
3
Ma
y-13
Jun-1
3
Jul-1
3
90
100
110
120
130
Aug
-12
Sep
-12
Oct-1
2
Nov-1
2
Dec-1
2
Jan-1
3
Feb-1
3
Mar-1
3
Apr-1
3
May-1
3
Jun-1
3
Jul-1
3
440
460
480
500
520
540
560
580
Aug-12
Sep-12
Oct-1
2
Nov-12
Dec-12
Jan-1
3
Feb
-13
Mar-1
3
Apr-1
3
May-1
3
Jun-1
3
Jul-1
3

Regional Market Focus
7 August 2013
9 of 14
Valuations of Major Regional Markets
14.7 1.42
13.6 2.26
10.5 1.40
15.3 2.84
14.5 1.99
Source: Bloomberg
Hang Seng Index, P/B (X)
S&P/ASX 200 Index, Forward P/E (X) S&P/ASX 200 Index, P/B (X)
Jakarta Stock Exchange Composite Index, P/B (X)
Straits Times Index, Forward P/E (X)
Hang Seng Index, Forward P/E (X)
Straits Times Index, P/B (X)
Stock Exchange of Thailand, Forward P/E (X) Stock Exchange of Thailand, P/B (X)
Jakarta Stock Exchange Composite Index,
10
12
14
16
18
Dec-0
9
Ma
r-10
Ju
n-1
0
Se
p-1
0
Dec-1
0
Ma
r-11
Ju
n-1
1
Se
p-1
1
Dec-1
1
Ma
r-12
Ju
n-1
2
Se
p-1
2
Dec-1
2
Ma
r-13
Ju
n-1
3
1.0
1.2
1.4
1.6
1.8
2.0
Dec-0
9
Ma
r-10
Ju
n-1
0
Se
p-1
0
Dec-1
0
Ma
r-11
Ju
n-1
1
Se
p-1
1
Dec-1
1
Ma
r-12
Ju
n-1
2
Se
p-1
2
Dec-1
2
Ma
r-13
Ju
n-1
3
1.0
1.5
2.0
2.5
3.0
Dec-0
9
Ma
r-10
Ju
n-1
0
Se
p-1
0
Dec-1
0
Ma
r-11
Ju
n-1
1
Se
p-1
1
Dec-1
1
Ma
r-12
Ju
n-1
2
Se
p-1
2
Dec-1
2
Ma
r-13
Ju
n-1
3
8
10
12
14
16
Dec-0
9
Ma
r-10
Ju
n-1
0
Se
p-1
0
Dec-1
0
Ma
r-11
Ju
n-1
1
Se
p-1
1
Dec-1
1
Ma
r-12
Ju
n-1
2
Se
p-1
2
Dec-1
2
Ma
r-13
Ju
n-1
3
1.01.21.41.61.82.02.2
Dec-0
9
Ma
r-10
Ju
n-1
0
Se
p-1
0
Dec-1
0
Ma
r-11
Ju
n-1
1
Se
p-1
1
Dec-1
1
Ma
r-12
Ju
n-1
2
Se
p-1
2
Dec-1
2
Ma
r-13
Ju
n-1
3
8
10
12
14
16
Dec-0
9
Ma
r-10
Ju
n-1
0
Se
p-1
0
Dec-1
0
Ma
r-11
Ju
n-1
1
Se
p-1
1
Dec-1
1
Ma
r-12
Ju
n-1
2
Se
p-1
2
Dec-1
2
Ma
r-13
Ju
n-1
3
2.22.42.62.83.03.23.43.6
Dec-0
9
Ma
r-10
Ju
n-1
0
Se
p-1
0
Dec-1
0
Ma
r-11
Ju
n-1
1
Se
p-1
1
Dec-1
1
Ma
r-12
Ju
n-1
2
Se
p-1
2
Dec-1
2
Ma
r-13
Ju
n-1
3
10
12
14
16
18
20
Dec-0
9
Ma
r-10
Ju
n-1
0
Se
p-1
0
Dec-1
0
Ma
r-11
Ju
n-1
1
Se
p-1
1
Dec-1
1
Ma
r-12
Ju
n-1
2
Se
p-1
2
Dec-1
2
Ma
r-13
Ju
n-1
3
1.4
1.6
1.8
2.0
2.2
Dec-0
9
Ma
r-10
Ju
n-1
0
Se
p-1
0
Dec-1
0
Ma
r-11
Ju
n-1
1
Se
p-1
1
Dec-1
1
Ma
r-12
Ju
n-1
2
Se
p-1
2
Dec-1
2
Ma
r-13
Ju
n-1
3
8
10
12
14
16
18
Dec-0
9
Ma
r-10
Ju
n-1
0
Se
p-1
0
Dec-1
0
Ma
r-11
Ju
n-1
1
Se
p-1
1
Dec-1
1
Ma
r-12
Ju
n-1
2
Se
p-1
2
Dec-1
2
Ma
r-13
Ju
n-1
3

Regional Market Focus
7 August 2013
10 of 14
Source: Bloomberg
World Index
JCI 0.36% 4,640.78
HSI -1.34% 21,923.70
KLCI -0.03% 1,784.64
NIKKEI -2.28% 14,072.10
KOSPI -0.68% 1,893.69
SET 0.36% 1,429.39
SHCOMP 0.49% 2,060.50
SENSEX -2.34% 18,733.04
ASX -0.11% 5,105.63
FTSE 100 -0.23% 6,604.21
DOW -0.60% 15,518.74
S&P 500 -0.57% 1,697.37
NASDAQ -0.74% 3,665.77 COLOMBO 0.12% 6,121.45
STI -0.52% 3,224.89

Regional Market Focus
7 August 2013
11 of 14
Date Statistic For Survey Prior Date Statistic For Survey Prior
8/7/2013 MBA Mortgage Applications 2-Aug -- -3.70% 8/7/2013 Automobile COE Open Bid Cat A 41493 -- 7398900.00%
8/7/2013
Bloomberg Aug. United States
Economic Survey 8/7/2013 Automobile COE Open Bid Cat B 41493 -- 7638900.00%
8/8/2013 Consumer Credit Jun $15.000B $19.615B 8/7/2013 Automobile COE Open Bid Cat E 7-Aug -- 76802
8/8/2013 Initial Jobless Claims 3-Aug 335K 326K 8/7/2013 Foreign Reserves Jul -- $259.82B
8/8/2013 Continuing Claims 27-Jul 2950K 2951K 09-16 AUG GDP SAAR QoQ 2Q F -- 0.152
8/8/2013 Bloomberg Consumer Comfort 4-Aug -- -27 09-16 AUG GDP YoY 2Q F -- 0.037
08-09 AUG Mortgage Delinquencies 2Q -- 7.25% 8/15/2013 Retail Sales Ex Auto YoY Jun -- 3.10%
08-09 AUG MBA Mortgage Foreclosures 2Q -- 3.55% 8/15/2013 Retail Sales YoY Jun -- 3.20%
8/9/2013 Wholesale Inventories MoM Jun 0.40% -0.50% 8/15/2013 Retail Sales SA MoM Jun -- 2.10%
8/9/2013 Wholesale Trade Sales MoM Jun 0.70% 1.60% 8/16/2013 Electronic Exports YoY Jul -- -12.40%
8/13/2013 Monthly Budget Statement Jul -$90.0B -- 8/16/2013 Non-oil Domestic Exports YoY Jul -- -8.80%
8/13/2013 NFIB Small Business Optimism Jul -- 93.5 8/16/2013 Non-oil Domestic Exports SA MoM Jul -- 3.20%
8/13/2013 Import Price Index MoM Jul 0.80% -0.20% 8/21/2013 Automobile COE Open Bid Cat A 21-Aug -- --
8/13/2013 Retail Sales Advance MoM Jul 0.40% 0.40% 8/21/2013 Automobile COE Open Bid Cat B 21-Aug -- --
8/13/2013 Retail Sales Ex Auto MoM Jul 0.40% 0.00% 8/21/2013 Automobile COE Open Bid Cat E 21-Aug -- --
Date Statistic For Survey Prior Date Statistic For Survey Prior
8/9/2013 Foreign Reserves 2-Aug -- $172.9B 8/7/2013 Foreign Reserves Jul -- $303.5B
8/9/2013 Forw ard Contracts 2-Aug -- $23.0B 8/16/2013 GDP SA QoQ 2Q -- 0.002
8/16/2013 Foreign Reserves 9-Aug -- -- 8/16/2013 GDP YoY 2Q -- 2.80%
8/16/2013 Forw ard Contracts 9-Aug -- -- 8/19/2013 Unemployment Rate SA Jul -- 3.30%
16-12 AUG Car Sales Jul -- 106018 8/19/2013 Composite Interest Rate Jul -- 0.32%
8/19/2013 GDP SA QoQ 2Q -- -2.20% 8/20/2013 CPI Composite YoY Jul -- 4.10%
8/19/2013 GDP YoY 2Q -- 5.30% 8/27/2013 Exports YoY Jul -- -0.20%
8/21/2013 BoT Benchmark Interest Rate 21-Aug -- 2.50% 8/27/2013 Imports YoY Jul -- 1.40%
8/23/2013 Foreign Reserves 16-Aug -- -- 8/27/2013 Trade Balance Jul -- -49.7B
8/23/2013 Forw ard Contracts 16-Aug -- -- 8/30/2013 Budget Balance HKD Jul -- -16.7B
24-28 AUG Customs Exports YoY Jul -- -3.38% 8/30/2013 Money Supply M1 HKD YoY Jul -- 0.181
24-28 AUG Customs Imports YoY Jul -- 3.01% 8/30/2013 Money Supply M2 HKD YoY Jul -- 9.60%
24-28 AUG Customs Trade Balance Jul -- -$1915M 8/30/2013 Money Supply M3 HKD YoY Jul -- 9.70%
8/28/2013
Mfg Production Index ISIC NSA
YoY Jul -- -3.5 9/2/2013 Retail Sales Value YoY Jul -- 14.70%
8/28/2013 Mfg Production Index ISIC SA Jul -- 175.7 9/2/2013 Retail Sales Volume YoY Jul -- 0.134
US Singapore
Economic Announcement
Thailand Hong Kong
Source: Bloomberg
Source: BloombergSource: Bloomberg
Source: Bloomberg
Regional Market Focus
7 August 2013
12 of 14
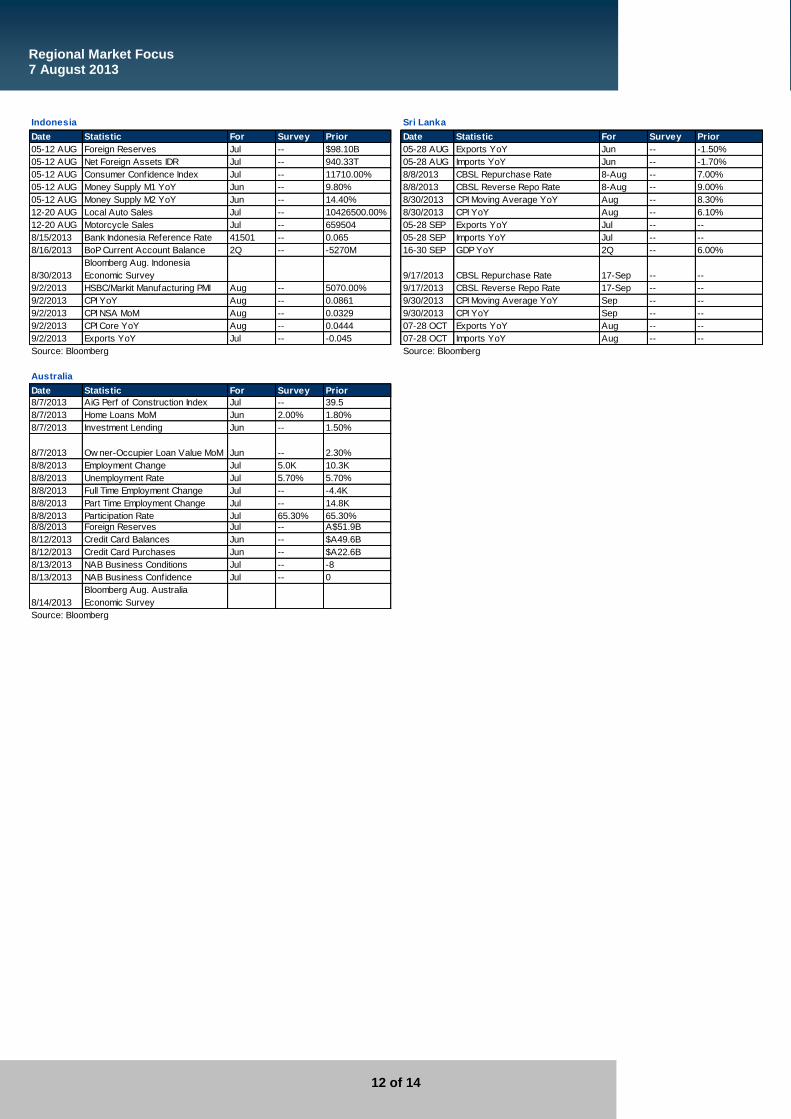
Date Statistic For Survey Prior Date Statistic For Survey Prior
05-12 AUG Foreign Reserves Jul -- $98.10B 05-28 AUG Exports YoY Jun -- -1.50%
05-12 AUG Net Foreign Assets IDR Jul -- 940.33T 05-28 AUG Imports YoY Jun -- -1.70%
05-12 AUG Consumer Confidence Index Jul -- 11710.00% 8/8/2013 CBSL Repurchase Rate 8-Aug -- 7.00%
05-12 AUG Money Supply M1 YoY Jun -- 9.80% 8/8/2013 CBSL Reverse Repo Rate 8-Aug -- 9.00%
05-12 AUG Money Supply M2 YoY Jun -- 14.40% 8/30/2013 CPI Moving Average YoY Aug -- 8.30%
12-20 AUG Local Auto Sales Jul -- 10426500.00% 8/30/2013 CPI YoY Aug -- 6.10%
12-20 AUG Motorcycle Sales Jul -- 659504 05-28 SEP Exports YoY Jul -- --
8/15/2013 Bank Indonesia Reference Rate 41501 -- 0.065 05-28 SEP Imports YoY Jul -- --
8/16/2013 BoP Current Account Balance 2Q -- -5270M 16-30 SEP GDP YoY 2Q -- 6.00%
8/30/2013
Bloomberg Aug. Indonesia
Economic Survey 9/17/2013 CBSL Repurchase Rate 17-Sep -- --
9/2/2013 HSBC/Markit Manufacturing PMI Aug -- 5070.00% 9/17/2013 CBSL Reverse Repo Rate 17-Sep -- --
9/2/2013 CPI YoY Aug -- 0.0861 9/30/2013 CPI Moving Average YoY Sep -- --
9/2/2013 CPI NSA MoM Aug -- 0.0329 9/30/2013 CPI YoY Sep -- --
9/2/2013 CPI Core YoY Aug -- 0.0444 07-28 OCT Exports YoY Aug -- --
9/2/2013 Exports YoY Jul -- -0.045 07-28 OCT Imports YoY Aug -- --
Date Statistic For Survey Prior
8/7/2013 AiG Perf of Construction Index Jul -- 39.5
8/7/2013 Home Loans MoM Jun 2.00% 1.80%
8/7/2013 Investment Lending Jun -- 1.50%
8/7/2013 Ow ner-Occupier Loan Value MoM Jun -- 2.30%
8/8/2013 Employment Change Jul 5.0K 10.3K
8/8/2013 Unemployment Rate Jul 5.70% 5.70%
8/8/2013 Full Time Employment Change Jul -- -4.4K
8/8/2013 Part Time Employment Change Jul -- 14.8K
8/8/2013 Participation Rate Jul 65.30% 65.30%
8/8/2013 Foreign Reserves Jul -- A$51.9B
8/12/2013 Credit Card Balances Jun -- $A49.6B
8/12/2013 Credit Card Purchases Jun -- $A22.6B
8/13/2013 NAB Business Conditions Jul -- -8
8/13/2013 NAB Business Confidence Jul -- 0
8/14/2013
Bloomberg Aug. Australia
Economic Survey
Source: Bloomberg
Indonesia
Australia
Sri Lanka
Source: BloombergSource: Bloomberg
denniswu
Typewriter
denniswu
Typewriter
denniswu
Typewriter
Dennis Wu
denniswu
Typewriter
Local Property

PHILLIP RESEARCH STOPHILLIP RESEARCH STOPHILLIP RESEARCH STOPHILLIP RESEARCH STOCK SELECTION SYSTEMSCK SELECTION SYSTEMSCK SELECTION SYSTEMSCK SELECTION SYSTEMS
We do not base our recommendations entirely on the above quantitative return bands. We consider qualitative factors like (but not limited to) a stock's risk reward profile, market sentiment, recent rate of share price appreciation, presence or absence of stock price catalysts, and speculative undertones surrounding the stock, before making our final recommendation
GENERAL DISCLAIMERGENERAL DISCLAIMERGENERAL DISCLAIMERGENERAL DISCLAIMER
This publication is prepared by Phillip Securities (Hong Kong) Ltd (“Phillip Securities”). By receiving or reading this publication, you agree to be bound
by the terms and limitations set out below.
This publication shall not be reproduced in whole or in part, distributed or published by you for any purpose. Phillip Securities shall not be liable for any
direct or consequential loss arising from any use of material contained in this publication.
The information contained in this publication has been obtained from public sources which Phillip Securities has no reason to believe are unreliable
and any analysis, forecasts, projections, expectations and opinions (collectively the “Research”) contained in this publication are based on such
information and are expressions of belief only. Phillip Securities has not verified this information and no representation or warranty, express or implied,
is made that such information or Research is accurate, complete or verified or should be relied upon as such. Any such information or Research
contained in this publication is subject to change, and Phillip Securities shall not have any responsibility to maintain the information or Research made
available or to supply any corrections, updates or releases in connection therewith. In no event will Phillip Securities be liable for any special, indirect,
incidental or consequential damages which may be incurred from the use of the information or Research made available, even if it has been advised of
the possibility of such damages.
Any opinions, forecasts, assumptions, estimates, valuations and prices contained in this material are as of the date indicated and are subject to
change at any time without prior notice.
This material is intended for general circulation only and does not take into account the specific investment objectives, financial situation or particular
needs of any particular person. The products mentioned in this material may not be suitable for all investors and a person receiving or reading this
material should seek advice from a financial adviser regarding the suitability of such products, taking into account the specific investment objectives,
financial situation or particular needs of that person, before making a commitment to invest in any of such products.
This publication should not be relied upon as authoritative without further being subject to the recipient’s own independent verification and exercise of
judgment. The fact that this publication has been made available constitutes neither a recommendation to enter into a particular transaction nor a
representation that any product described in this material is suitable or appropriate for the recipient. Recipients should be aware that many of the
products which may be described in this publication involve significant risks and may not be suitable for all investors, and that any decision to enter
into transactions involving such products should not be made unless all such risks are understood and an independent determination has been made
that such transactions would be appropriate. Any discussion of the risks contained herein with respect to any product should not be considered to be a
disclosure of all risks or a complete discussion of such risks.
Nothing in this report shall be construed to be an offer or solicitation for the purchase or sale of a security. Any decision to purchase securities
mentioned in this research should take into account existing public information, including any registered prospectus in respect of such security.
Disclosure of InterestDisclosure of InterestDisclosure of InterestDisclosure of Interest Analyst Disclosure: Neither the analyst(s) preparing this report nor his associate has any financial interest in or serves as an officer of the listed
corporation covered in this report.
Firm’s Disclosure: Phillip Securities does not have any investment banking relationship with the listed corporation covered in this report nor any
financial interest of 1% or more of the market capitalization in the listed corporation. In addition, no executive staff of Phillip Securities serves as an
officer of the listed corporation.
AvailabilityAvailabilityAvailabilityAvailability The information, tools and material presented herein are not directed, intended for distribution to or use by, any person or entity in any jurisdiction or
country where such distribution, publication, availability or use would be contrary to the applicable law or regulation or which would subject Phillip
Securities to any registration or licensing or other requirement, or penalty for contravention of such requirements within such jurisdiction.
Information contained herein is based on sources that Phillip Securities (Hong Kong) Limited (“PSHK”) believed to be accurate. PSHK does not bear
responsibility for any loss occasioned by reliance placed upon the contents hereof. PSHK (or its affiliates or employees) may have positions in
relevant investment products. For details of different product's risks, please visit the Risk Disclosures Statement on http://www.phillip.com.hk.
© 2013 Phillip Securities (Hong Kong) Limited
Total ReturnTotal ReturnTotal ReturnTotal Return RecommendationRecommendationRecommendationRecommendation RatingRatingRatingRating RemarksRemarksRemarksRemarks >+20%>+20%>+20%>+20% BuyBuyBuyBuy 1111 >20% upside from the current price>20% upside from the current price>20% upside from the current price>20% upside from the current price
+5% to +20%+5% to +20%+5% to +20%+5% to +20% AccumulateAccumulateAccumulateAccumulate 2222 +5% to +20%upside from the curren+5% to +20%upside from the curren+5% to +20%upside from the curren+5% to +20%upside from the current pricet pricet pricet price ----5% to +5%5% to +5%5% to +5%5% to +5% NeutralNeutralNeutralNeutral 3333 Trade within ± 5% from the current priceTrade within ± 5% from the current priceTrade within ± 5% from the current priceTrade within ± 5% from the current price ----5% to 5% to 5% to 5% to ----20%20%20%20% ReduceReduceReduceReduce 4444 ----5% to 5% to 5% to 5% to ----20% downside from the current price20% downside from the current price20% downside from the current price20% downside from the current price
<<<<----20%20%20%20% SellSellSellSell 5555 >20%downside from the current price>20%downside from the current price>20%downside from the current price>20%downside from the current price

Contact Information (Regional Member Companies)
SINGAPORE
Phillip Securities Pte Ltd
Raffles City Tower
250, North Bridge Road #06-00
Singapore 179101
Tel : (65) 6533 6001
Fax : (65) 6535 6631
Website: www.poems.com.sg
MALAYSIA
Phillip Capital Management Sdn Bhd
B-3-6 Block B Level 3 Megan Avenue II,
No. 12, Jalan Yap Kwan Seng, 50450
Kuala Lumpur
Tel (603) 21628841
Fax (603) 21665099
Website: www.poems.com.my
HONG KONG
Phillip Securities (HK) Ltd
Exchange Participant of the Stock Exchange of Hong Kong
11/F United Centre 95 Queensway
Hong Kong
Tel (852) 22776600
Fax (852) 28685307 Websites: www.phillip.com.hk
JAPAN
PhillipCapital Japan K.K.
Nagata-cho Bldg.,
8F, 2-4-3 Nagata-cho,
Chiyoda-ku, Tokyo 100-0014
Tel (81-3) 35953631
Fax (81-3) 35953630
Website:www.phillip.co.jp
INDONESIA
PT Phillip Securities Indonesia
ANZ Tower Level 23B,
Jl Jend Sudirman Kav 33A
Jakarta 10220 – Indonesia
Tel (62-21) 57900800
Fax (62-21) 57900809
Website: www.phillip.co.id
CHINA
Phillip Financial Advisory (Shanghai) Co. Ltd
No 550 Yan An East Road,
Ocean Tower Unit 2318,
Postal code 200001
Tel (86-21) 51699200
Fax (86-21) 63512940 Website: www.phillip.com.cn
THAILAND
Phillip Securities (Thailand) Public Co. Ltd
15th Floor, Vorawat Building,
849 Silom Road, Silom, Bangrak,
Bangkok 10500 Thailand
Tel (66-2) 6351700 / 22680999
Fax (66-2) 22680921 Website www.phillip.co.th
FRANCE
King & Shaxson Capital Limited
3rd Floor, 35 Rue de la Bienfaisance 75008
Paris France
Tel (33-1) 45633100
Fax (33-1) 45636017
Website: www.kingandshaxson.com
UNITED KINGDOM
King & Shaxson Capital Limited
6th Floor, Candlewick House, 120 Cannon Street, London, EC4N 6AS Tel (44-20) 7426 5950 Fax (44-20) 7626 1757
Website: www.kingandshaxson.com
UNITED STATES
Phillip Futures Inc
141 W Jackson Blvd Ste 3050 The Chicago Board of Trade Building
Chicago, IL 60604 USA Tel +1.312.356.9000 Fax +1.312.356.9005
AUSTRALIA
PhillipCapital Australia
Level 37, 530 Collins Street, Melbourne, Victoria 3000, Australia
Tel (613) 96298380 Fax (613) 96148309
Website: www.phillipcapital.com.au