Edinburgh Research Explorer - University of Edinburgh Langea, , Shaun Devaneyb, Asif Usmanib a SP...
17
Edinburgh Research Explorer An application of the PEER PBEE framework to structures in fire Citation for published version: Lange, D, Devaney, S & Usmani, A 2014, 'An application of the PEER PBEE framework to structures in fire' Engineering Structures, vol 66, pp. 100-115. DOI: 10.1016/j.engstruct.2014.01.052 Digital Object Identifier (DOI): 10.1016/j.engstruct.2014.01.052 Link: Link to publication record in Edinburgh Research Explorer Document Version: Peer reviewed version Published In: Engineering Structures General rights Copyright for the publications made accessible via the Edinburgh Research Explorer is retained by the author(s) and / or other copyright owners and it is a condition of accessing these publications that users recognise and abide by the legal requirements associated with these rights. Take down policy The University of Edinburgh has made every reasonable effort to ensure that Edinburgh Research Explorer content complies with UK legislation. If you believe that the public display of this file breaches copyright please contact [email protected] providing details, and we will remove access to the work immediately and investigate your claim. Download date: 28. Jun. 2018
Transcript of Edinburgh Research Explorer - University of Edinburgh Langea, , Shaun Devaneyb, Asif Usmanib a SP...
Edinburgh Research Explorer
An application of the PEER PBEE framework to structures in fire
Citation for published version:Lange, D, Devaney, S & Usmani, A 2014, 'An application of the PEER PBEE framework to structures in fire'Engineering Structures, vol 66, pp. 100-115. DOI: 10.1016/j.engstruct.2014.01.052
Digital Object Identifier (DOI):10.1016/j.engstruct.2014.01.052
Link:Link to publication record in Edinburgh Research Explorer
Document Version:Peer reviewed version
Published In:Engineering Structures
General rightsCopyright for the publications made accessible via the Edinburgh Research Explorer is retained by the author(s)and / or other copyright owners and it is a condition of accessing these publications that users recognise andabide by the legal requirements associated with these rights.
Take down policyThe University of Edinburgh has made every reasonable effort to ensure that Edinburgh Research Explorercontent complies with UK legislation. If you believe that the public display of this file breaches copyright pleasecontact [email protected] providing details, and we will remove access to the work immediately andinvestigate your claim.
Download date: 28. Jun. 2018

An application of the PEER performance based earthquake engineeringframework to structures in fire
David Lange a,⇑, Shaun Devaney b, Asif Usmani b
a SP Fire Research, Box 857, 501 15 Borås, Swedenb BRE Centre for Fire Safety Engineering, Institute for Infrastructure and the Environment, School of Engineering, The King’s Buildings, Mayfield Road, Edinburgh EH9 3JL, UK
a r t i c l e i n f o
Article history:Received 3 May 2012Revised 30 January 2014Accepted 31 January 2014
Keywords:Structures in firePerformance based designPEERFire engineeringProbabilistic analysis
a b s t r a c t
The Pacific Earthquake Engineering Research (PEER) Center’s Performance Based Earthquake Engineering(PBEE) framework is well documented. The framework is a linear methodology which is based uponobtaining in turn output from each of the following analyses: hazard analysis; structural analysis; lossanalysis, and finally decision making based on variables of interest, such as downtime or cost to repair.The strength of the framework is in its linearity, its clear flexibility and in the consideration of uncertaintyat every stage of the analysis. The framework has potential applications to other forms of extreme load-ing; however in order for this to be achieved the ‘mapping’ of the framework to the analysis of structuresfor other loading situations must be successful.
This paper illustrates one such ‘mapping’ of the framework for Performance Based Fire Engineering(PBFE) of structures. Using a combination of simple analytical techniques and codified methods as wellas random sampling techniques to develop a range of response records, the PEER framework is followedto illustrate its application to structural fire engineering. The end result is a successful application of theearthquake framework to fire which highlights both the assumptions which are inherent in the perfor-mance based design framework as well as subjects of future research which will allow more confidencein the design of structures for fire using performance based techniques.
This article describes the PEER framework applied to structural earthquake design then follows theframework from start to completion applying suitable alternative tools to perform each stage of the anal-ysis for structures in fire.
� 2014 Elsevier Ltd. All rights reserved.
1. Introduction
Building structures are designed to offer a desired level of resis-tance to fire in order to satisfy the fire safety requirements of‘‘insulation, integrity and stability’’. Insulation and integrity are re-quired for vertical as well as horizontal separation which may beprovided by the floor slab or other non-load bearing elementsand stability which is provided by the structure as a whole, wherethe primary objective is safe evacuation of occupants and second-ary objectives may include property protection. The allowability ofalternative solutions to prescriptive fire safety design by many na-tional standards and approvals bodies means that objectives for lifesafety may be met in a number of ways. This offers a far widerspectrum of possible design solutions than is available under pre-scriptive regulation [1]. Secondary criteria such as expected losses,downtime and the social impact of a fire are not necessarily fully
addressed by these alternative solutions however these shouldbe of interest to all stakeholders in a project since alternative solu-tions will have varying degrees of impact on the consequences of afire post-evacuation. Further, significant cost savings with refer-ence to property damage may be achieved by employing alterna-tive solutions, however the full assessment of the effect of thisrequires the consideration of multiple design solutions and not asingle alternative solution as is commonly investigated in industry.Since fire is such a low probability, high consequence event withconsiderable costs associated with protection the use of perfor-mance based design frameworks accounting for multiple solutionsis particularly attractive, accounting for not only the primaryobjectives but also any secondary objectives.
The basic elements of a performance based design frameworkare therefore defined in such a way as to allow the user freedomto compose any solution to the problem, allowing also the freedomto employ new techniques and technologies as they become avail-able. The objectives must be clearly stated at the outset of the pro-ject, and any design solution which fulfils these objectives whilst
http://dx.doi.org/10.1016/j.engstruct.2014.01.0520141-0296/� 2014 Elsevier Ltd. All rights reserved.
⇑ Corresponding author. Tel.: +46 10 516 5000.E-mail address: [email protected] (D. Lange).
Engineering Structures 66 (2014) 100–115
Contents lists available at ScienceDirect
Engineering Structures
journal homepage: www.elsevier .com/locate /engstruct

still adhering to the performance targets of the design frameworkshould be permitted. It should be noted that although the targets interms of life, property and business protection may remain similarto those prescribed in prescriptive design codes, these targetsshould remain independent of their prescriptive counterparts. Insummary, performance based design is based upon three main cri-teria [2]:
� Definition of the objectives of the design process.� Investigation of the alternative designs available to meet the
objectives.� Reliability and risk assessment of alternatives to select the most
efficient solution.
The concept of performance based engineering therefore allowsa broad spectrum of design solutions to be developed for differentproblems and evaluated based upon their individual merits byallowing a quantification of the impact – either in terms of qualita-tive or quantitative ‘risk’ – of an event. An example of performancebased design applied to structural fire engineering is provided in[3].
In order to fully realise performance based design, it is neces-sary to account for uncertainty and probabilistic response in theanalysis of structures. Research on the estimation of probabilisticresponse of structures to fire includes the use of analytical or firstorder reliability models [4,5] as described in the Eurocode basis ofstructural design [6]; as well as Monte Carlo techniques [7]. Someexamples use a risk assessment method, such as that defined in [8]using fault tree analysis, for determining suitable fire scenarios foruse in the study but do not consider the variation in the structure[9], while others vary the structure and the mechanical loading[10]. Random sampling can be both computationally expensiveand time consuming since the number of calculations required in-creases with the number of variables in the system. To reduce thelarge number of analyses required for Monte-Carlo analysis, otherwork on the reliability of life safety and suppression systems in fireproposes the use of response surface modelling and linear regres-sion techniques to identify critical variables for reliability estima-tion and then employ iterative algorithms to reduce the numberof calculations required [11,12]. These techniques lead to less com-putationally expensive analyses than traditional Monte Carlo tech-niques. Stern-Gottfried and Rein developed a methodology fortravelling fires which lends itself strongly to probabilistic methods[13,14]. In their method a family of fires is developed based on fueldistribution and burning rate within a compartment. Each of thesefires is equally possible within their method and the sensitivity of astructure to the different fires should be determined when evaluat-ing the safety of the structure.
In the majority of cases, however, performance based structuralfire engineering will stop short at a risk assessment – where thesupposed consequences of the fire on the structure are often pre-sented as a subjective likelihood of, e.g. structural failure. Whilethis allows a comparative assessment of the response of a designto a standard solution; in order to achieve a fully performancebased approach, including considerations of sustainability and de-sign optimisation, the expression of performance goals in fullyquantifiable economic terms – for example an expected dollar loss– is necessary. These definitions are vital to the acceptance of per-formance based structural engineering for extreme loading as any-thing other than an occasional ad hoc alternative to prescriptiveguidance. Numerous examples exist of frameworks applying theseconcepts to earthquake engineering and this field appears to bemore mature in this respect than structural fire engineering. Thispaper uses one example of a framework which was originally de-vised for the design of earthquake resistant structures and appliesit to structures in fire.
2. The PEER framework
2.1. Introduction
The PEER PBEE (Pacific Earthquake Engineering Research CenterPerformance Based Earthquake Engineering) framework provides aclearly defined process which outputs quantitative measures to as-sess the performance of a building system subject to ground exci-tation during an earthquake [15]. The framework is based acrossthree calculation ‘domains’: the Hazard Domain; the StructuralSystem Domain; and the Loss Domain. These domains are linkedby so-called ‘pinch variables’. The calculation follows a linear pro-cess of calculation of variables representing the severity of anevent (Intensity Measure (IM)), the structural response to theevent (Engineering Demand Parameters (EDPs)), and estimationof damage and resulting losses incurred (Damage Measures(DMs) and Decision Variables (DVs)) in the loss domain. The frame-work is expressed as a triple integral, Eq. (1).
gDV ¼ZZZ
P½DV jDM�P½DMjEDP�|fflfflfflfflfflfflfflfflfflfflfflfflfflfflfflfflfflffl{zfflfflfflfflfflfflfflfflfflfflfflfflfflfflfflfflfflffl}Loss Domain
P½EDPjIM�zfflfflfflfflfflfflffl}|fflfflfflfflfflfflffl{Structural System Domain
dDMdEDP dgM|ffl{zffl}Hazard Domain
ð1Þ
where g denotes the annual rate of an event, and P denotes the com-plementary cumulative distribution function of an event, withP[X|Y] denoting the conditional probability of X � x given Y = yoccurs.
Implicit in the form of the equation is the assumption that eachof the variables in the analysis is conditionally independent. That isto say that the probability distribution of, e.g. the EDP, is indepen-dent of the probability distribution of the IM and the engineeringresponse is dependent solely upon the one variable chosen to rep-resent the intensity measure. For example, given an event whichmay be characterised by a number of intensity measures such aspeak ground acceleration or displacement – where one parameteris chosen to represent the intensity measure the distribution of theEDP is therefore assumed to be independent of the choice of IMvariable. This is clearly an erroneous assumption. In structures infire the form of the structure and the features of the compartmentor room of origin directly influence the definition of the fire sce-nario (unless only the most simple nominal fire models are usedsuch as the ASTM or ISO fire curve). This means that the expressionof an EDP variable against alternative single IM’s may result in dif-ferent distributions. However, by careful selection of the intensitymeasure which is chosen to represent the hazard the effect of thismay be limited. This is the subject of on-going work by the authorsof this paper. The general process of the PEER framework is shownin Fig. 1. This follows the linear progression of Hazard Analysis,Structural Analysis, Damage Analysis and Loss Analysis, with eachstage linked by the pinch variables. The intention of the frameworkis to return metrics of annual expected losses for a given structurebased on the likely recurrence and magnitudes of the hazard ofinterest.
Fig. 2 shows the framework presented schematically. Fig. 2aillustrates the relationship between the performance of the systemand the intensity measure based on the damage analysis and theengineering demand parameter. In this instance the illustrationshows a case where only the hazard analysis is non-deterministicand all other variables are deterministic, the engineering systemdomain is also a simple function of the hazard domain with noadditional influences from alternative possible intensity measures,similarly the loss domain is a function of the engineering system,i.e. EDP = f(IM) and DM = f(EDP). This is almost a trivial case sincethe unknown in the solution arises solely from the hazard domain.Fig. 2b shows the impact that introducing uncertainty and
D. Lange et al. / Engineering Structures 66 (2014) 100–115 101

additional variables in the subsequent modules has on the result.In this case, the intensity measure which may lead to some targetperformance has a wide range, and the frequency of occurrence ofthis intensity measure is also relatively unknown. Fig. 2c shows theresults of the integration of each of the analyses which leads to theexpression of the frequency of exceeding either a minimum engi-neering demand parameter, or a damage state leading to a loss.
The framework is comprehensively reported in a number of ref-erences, for example Porter [16] provides a simple and easily fol-lowed description of the framework and its components.Additional information and background reading may be found onthe PEER website. The individual modules of the PEER frameworkare outlined in the following sections although for a more detaileddescription other references should be consulted.
Examples of the PEER framework adapted to and applied toother extreme loading cases exist, for example applied to windengineering as a performance based wind engineering framework[17], to blast engineering [18], and to hurricane engineering [19].Deierlein and Hamilton [20] also propose an application of thePEER framework to fire engineering. This is a straightforward map-ping of the PBEE framework to fire however there is no example ofapplication provided.
2.2. Hazard domain
The hazard analysis results in the output of the intensity mea-sure. The intensity measure is defined as a single or vector param-eter that defines the event intensity and which quantifies the rateor probability of exceeding an intensity per year. In PEER PBEE thecalculation of the intensity measure follows broadly the methodol-ogy employed in probabilistic seismic hazard analysis (PSHA),
although where PSHA results in a rate or a probability of exceedingan intensity measure, the calculation required for the PEER frame-work results in a mean annual probability of exceedance.
In the resulting hazard curves used in examples of the PEERframework the variable chosen to represent the intensity of theevent seems to be typically the peak ground acceleration, howeveralternative variables may be used to measure the magnitude of anevent including ground displacement, ground motion frequency,duration of the ground motion, etc. A sensitivity analysis shouldtypically be carried out to investigate the sufficiency of IM’s foralternative EDP’s [21].
The intensity measure is illustrated by the hazard curve, whichis defined by the frequency of exceeding an intensity measure. Thisis equal to the probability of exceeding a given value of intensitymeasure given that an earthquake of a given magnitude has oc-curred, multiplied by the statistical rate of occurrence of an earth-quake of the given magnitude. For a single magnitude event theintensity measure hazard curve is given by the following equation.
gIM ¼ rnPðIMÞ ð2Þ
where rn is the rate of occurrence of the event.For intensity measure hazard curves comprised of either multi-
ple fault lines or multiple magnitude events, the total hazard curveis comprised of the maximum of all the likelihoods of exceedingthe intensity measure for each of the scenarios. This analysis islocationally dependent. That is to say that for each location theremay be a number of fault lines at varying distances and the inten-sity of an event will vary with the distance to the fault line. Thehazard analysis therefore needs to be carried out for the locationof interest.
Fig. 1. PEER analysis methodology (adapted from Porter [3]).
102 D. Lange et al. / Engineering Structures 66 (2014) 100–115

(a)
(b)
(c)
Fig. 2. Schematic of the PEER framework: (a) where the structural analysis, damage analysis and the loss analysis are deterministic the relationship between the hazard andthe consequences is easily traced; (b) where there is some uncertainty associated with any of the modules which follow the hazard analysis then the range of intensitymeasures, and event frequencies, which give rise to some target performance in terms of loss may be quite considerable; and (c) in this instance the structural system and theloss domains must be integrated in accordance with the triple integral of Eq. (1) to give the frequency of exceeding the target performance.
D. Lange et al. / Engineering Structures 66 (2014) 100–115 103

2.3. Structural system domain
The structural analysis uses the records of perturbation from adatabase of earthquake records to determine the response of thestructure for each of the records. This may be the same set of re-cords that was used to perform the hazard analysis, however itdoes not have to be so long as the resulting EDP can be expressedas a function of the IM which is used to define the severity of theevent. The output from the structural analysis is a probabilisticmeasure of the response of the structure which will be related tothe damage analysis which follows in subsequent stages of theframework. For example, for typical examples of the frameworkapplied to earthquakes the engineering demand parameter studiedis the inter-storey drift. The structural analysis should reflect theresponse of the structure across the whole vector of the IntensityMeasure.
The engineering demand parameter is expressed as a hazardcurve, similar to the intensity measure, defined as a vector param-eter which again permits the quantification as a Poisson process ofthe rate of exceedance given the intensity measure hazard curve.
gEDP ¼Z
PðEDPjIMÞdgIM ð3Þ
Uncertainty in the response of the structure to a seismic eventmeans that the structural response to a given intensity measurehas some probabilistic distribution associated with it and thismay be included in the structural analysis to ensure that it is in-cluded in the demand parameter hazard curve.
As stated, in examples of the PEER PBEE framework, the struc-tural analysis often relies on a catalogue of earthquake records todetermine the likely response given a peak ground acceleration(or other intensity measure) [22]. However the calculation of thestructural response is based on the contents of entire records ofearthquakes and not just the variable which is chosen to reflectthe intensity measure. By representing the intensity of the earth-quake as a function of a single variable it is assumed in the proba-bilistic calculation which follows that the distribution of theresponse of the structure is independent of any variation in theother variables which may be chosen to reflect the intensity andwhich may also affect the structure. This is a drawback of theframework. In future applications of the framework the sensitivityof the engineering demand parameter to the intensity measure isan important consideration when choosing the variable to repre-sent the IM.
The structural analyses carried out to determine the probabilis-tic distribution of demand parameters for given intensity measuresdo not need to be deterministic and should normally include prob-abilistic aspects to describe uncertainty in the model such asuncertainty in material properties or other factors which may af-fect structural response.
2.4. Loss domain
Following the structural analysis, fragility functions for prede-termined damage measures should be specified or derived basedon the range of structural responses arising from the hazard. Inthe case of, for example, earthquake analysis using the PEER frame-work; a common example of damage measure is damage associ-ated with cracking of the separating walls in a building followingan earthquake. Occurrence of small cracks which can be repairedare damage measure 1, larger cracks in the gypsum board are dam-age measure 2. Damage measure 3, in this example, may refer todamage to the framing of the stud wall in addition to damage tothe plasterboard, requiring replacement of the entire separatingwall assembly. Each of these damage measures has a fragility func-tion associated with it which reflects the probability of this degree
of damage occurring given a value of the engineering demandparameter. Other examples of damage measures may include con-crete cracking in a reinforced concrete frame; evolution of plastichinges in frames, or any other damage which may occur in a build-ing subject to some kind of perturbation. The fragility function foran individual damage measure reflects the probability of a damagemeasure given the magnitude of the engineering demand parame-ter, i.e. P(DM|EDP).
Loss analysis is based on the damage measure which occurs.Each damage measure is associated with a cost to repair whichagain has some probabilistic distribution given the extent of thedamage. The loss analysis therefore relies on the results of thedamage analysis to derive consequence curves based on whetheror not a damage state exists given the EDP hazard curve. The lossbeing considered may include, for example, down time or cost torepair. In PBEE consequence curves are used to provide an estimateof the annual impact of an earthquake for, e.g. budgetary reasons inorder to allow developers to better assess the impact of perfor-mance based structural engineering decisions on their own project.
3. The PEER framework adapted to structural fire engineering
For earthquake engineering as opposed to fire engineering, arelative wealth of independent records of earthquake events existswith libraries and databases of earthquakes in different regionsbeing available. This is facilitated by the independence of theearthquake and the corresponding ground motion from the struc-ture – the variables which are of interest in determining theground motion intensity from the libraries of available data maybe limited to only the distance from the fault line of the facilityand the soil/ground conditions at the site. Conversely, the evolu-tion of a fire in a structure is almost always dependent upon theform of the structure as well as its features. It may therefore benecessary to develop a suitable catalogue of fires bespoke to eachstructure, to determine the intensity measure and the engineeringdemand parameters.
3.1. Hazard domain
In examples of the PEER framework there are a number of dif-ferent factors which may be taken as measures of the intensity,although as said typically peak ground acceleration seems to beused. In fire, several parameters have been historically consideredto be measures of fires ‘intensity’; duration, for example, as a mea-sure of fire resistance implies that the duration of burning is a mea-sure of the intensity. However when considered in the context ofreal fires, the duration alone is insufficient and the fire severitymay also be described in terms of parameters such as, for example:rate of increase in the temperature in a compartment, duration ofthe steady burning phase, or peak temperature, heat flux, etc.
At this stage, peak compartment temperature is taken as theintensity measure in this article, this was chosen based on adhoc analysis done during the writing of this paper and there isno suggestion that this is a fully adequate indicator of fire intensityand ongoing work includes studies to determine the most appro-priate intensity measure for engineering demand parameters ofinterest. The variation in response of the structure to the catalogueof fires is dealt with within the calculation of the engineering de-mand parameter.
In order to derive the intensity measure curve a procedure forprobabilistic fire hazard analysis is mapped to the procedure forprobabilistic seismic hazard analysis, as described below.
104 D. Lange et al. / Engineering Structures 66 (2014) 100–115
3.1.1. Probabilistic definition of fire modelsAs mentioned, applications of the PEER framework may rely on
a catalogue of representative earthquakes such as those describedin [22] which are used to develop a set of characteristic responsesto the loading. Work by Koo [23] details a methodology for devel-oping a set of possible fire curves for a given compartment geom-etry based on a set of random input variables. Although applicationof Koo’s method provides a realistic set of compartment tempera-ture–time curves of suitable number for stochastic purposes it iscomputationally intensive. Nevertheless, the approach of randomsampling to derive a number of fire scenarios based on physicallimitations of the compartment of fire origin has been shown tobe a suitable means of deriving a large bespoke catalogue of fires.
For this example, a Eurocode parametric fire curve is used forthe determination of the temperature within the compartment.This fire curve is a nominal temperature–time curve representativeof a compartment fire which is commonly used in industry. Theequation allows the variation of the fuel load, opening factor andthe thermal inertia of the compartment linings when determiningthe compartment temperature. As well as being commonly used inindustry the fire curve is also straightforward and is not resourceintensive to construct. As well as the small degree of variabilityof the inputs, the output is also simple and includes both a heatingphase of non-predetermined duration and peak temperature and alinear cooling phase. Local variations in temperature within thecompartment are not considered within the model. The calculationrequired is deterministic within the Eurocodes and therefore atleast one of the parameters needs to be varied in order to providethe necessary group of fire records for further analysis.
Of the parameters which may be varied, the fuel load and theactual opening factor as opposed to the available opening factorhave considerable uncertainty associated with them. Variabilityin the thermal inertia of the wall linings, once the constructionof these have been determined, is arguably less uncertain and willbe ignored here.
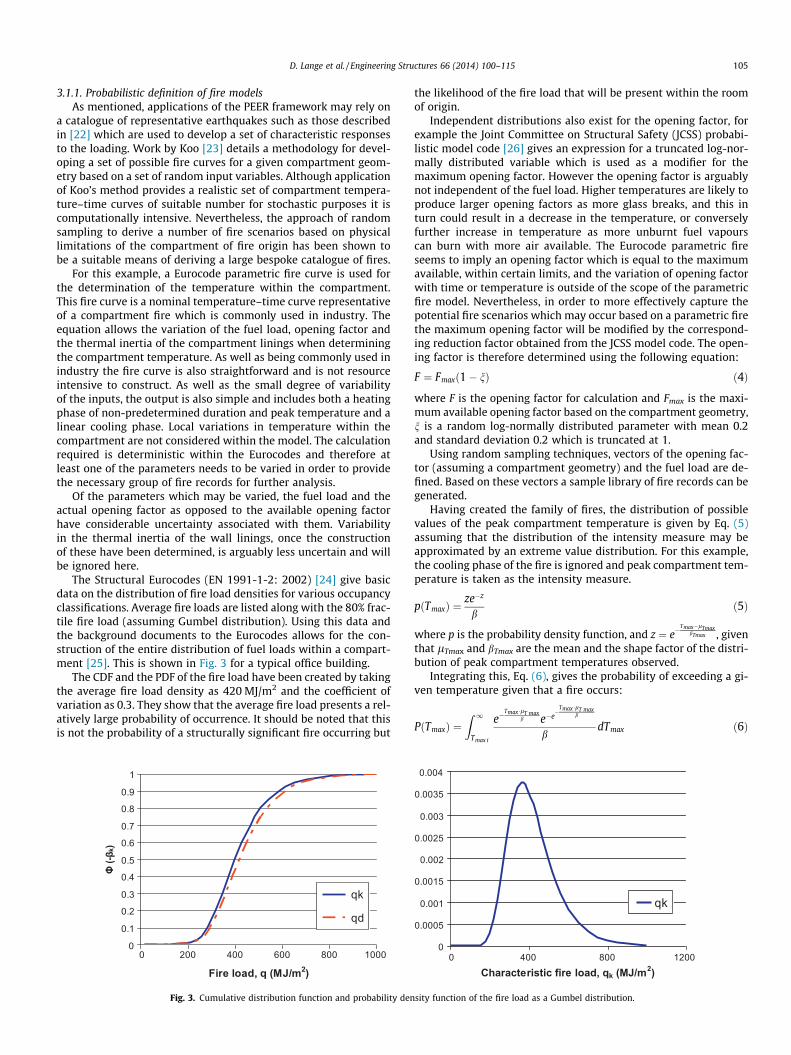
The Structural Eurocodes (EN 1991-1-2: 2002) [24] give basicdata on the distribution of fire load densities for various occupancyclassifications. Average fire loads are listed along with the 80% frac-tile fire load (assuming Gumbel distribution). Using this data andthe background documents to the Eurocodes allows for the con-struction of the entire distribution of fuel loads within a compart-ment [25]. This is shown in Fig. 3 for a typical office building.
The CDF and the PDF of the fire load have been created by takingthe average fire load density as 420 MJ/m2 and the coefficient ofvariation as 0.3. They show that the average fire load presents a rel-atively large probability of occurrence. It should be noted that thisis not the probability of a structurally significant fire occurring but
the likelihood of the fire load that will be present within the roomof origin.
Independent distributions also exist for the opening factor, forexample the Joint Committee on Structural Safety (JCSS) probabi-listic model code [26] gives an expression for a truncated log-nor-mally distributed variable which is used as a modifier for themaximum opening factor. However the opening factor is arguablynot independent of the fuel load. Higher temperatures are likely toproduce larger opening factors as more glass breaks, and this inturn could result in a decrease in the temperature, or converselyfurther increase in temperature as more unburnt fuel vapourscan burn with more air available. The Eurocode parametric fireseems to imply an opening factor which is equal to the maximumavailable, within certain limits, and the variation of opening factorwith time or temperature is outside of the scope of the parametricfire model. Nevertheless, in order to more effectively capture thepotential fire scenarios which may occur based on a parametric firethe maximum opening factor will be modified by the correspond-ing reduction factor obtained from the JCSS model code. The open-ing factor is therefore determined using the following equation:
F ¼ Fmaxð1� nÞ ð4Þ
where F is the opening factor for calculation and Fmax is the maxi-mum available opening factor based on the compartment geometry,n is a random log-normally distributed parameter with mean 0.2and standard deviation 0.2 which is truncated at 1.
Using random sampling techniques, vectors of the opening fac-tor (assuming a compartment geometry) and the fuel load are de-fined. Based on these vectors a sample library of fire records can begenerated.
Having created the family of fires, the distribution of possiblevalues of the peak compartment temperature is given by Eq. (5)assuming that the distribution of the intensity measure may beapproximated by an extreme value distribution. For this example,the cooling phase of the fire is ignored and peak compartment tem-perature is taken as the intensity measure.
pðTmaxÞ ¼ze�z
bð5Þ
where p is the probability density function, and z ¼ e�Tmax�lTmax
bTmax , giventhat lTmax and bTmax are the mean and the shape factor of the distri-bution of peak compartment temperatures observed.
Integrating this, Eq. (6), gives the probability of exceeding a gi-ven temperature given that a fire occurs:
PðTmaxÞ ¼Z 1
Tmax i
e�Tmax �lT max
b e�e�
Tmax �lT maxb
bdTmax ð6Þ
0
0.1
0.2
0.3
0.4
0.5
0.6
0.7
0.8
0.9
1
0 200 400 600 800 1000
Fire load, q (MJ/m2)
qk
qd
0
0.0005
0.001
0.0015
0.002
0.0025
0.003
0.0035
0.004
0 400 800 1200Characteristic fire load, qk (MJ/m2)
qk
Fig. 3. Cumulative distribution function and probability density function of the fire load as a Gumbel distribution.
D. Lange et al. / Engineering Structures 66 (2014) 100–115 105

In order to obtain the annual rate of exceedance of the temper-ature, this probability must be multiplied by the annual rate ofoccurrence of a fire in the building.
The natural fire safety concept [27] proposes the frequency ofstructurally significant fires to be:
rfi ¼ Afi � p1 � p2 � p3 � p4 ð7Þ
where rfi is the rate of a structurally significant fire occurring, p1 isthe probability of severe fire affecting the occupants and the stan-dard public fire brigade per m2 floor area per year; p2 is the proba-bility of the fire brigade failing to extinguish the fire, p3 is areduction factor which allows for notification by means of auto-matic fire detection system, p4 is the probability of sprinklers extin-guishing the fire, and Afi is the area of the fire compartment.
� For a typical office building, p1 is quoted as being in the range of2–4e�7/m2/year.� p2 is dependent upon the type of firemen and upon the response
time. For example if a response from professional fire fighterscan be expected between 10 and 20 min after activation ofthe alarm then p2 is quoted as being 0.1.� p3 is dependent upon the type of alarm installed. For example
the use of smoke alarms gives a p3 of 0.0625, whereas heatalarms give a reduction factor of 0.25. Automatic transmissionof the alarm to the fire brigade will result in a further reductionfactor of 0.25 being applied.� p4 is dependent upon the type and quality of sprinkler installed.
A normal sprinkler system will give a reduction factor of 0.02.
The annual rate of exceeding the intensity measure is given bythe product of the annual rate of occurrence of a fire and P(IM), gi-ven by Eq. (6), where Tmax is chosen to represent the intensitymeasure.
3.1.2. Example of the intensity measure calculationThe structure to be used in the example is based on a sub-
assembly from the SCI document ‘Comparative Structure Cost ofModern Commercial buildings (Second Edition) [28]. The floor planof the building indicating the compartment where the sub-assem-bly is located is shown in Fig. 4.
The compartment is 15 m by 15 m and comprises 4 bays of thestructure. Although the layout of the building as proposed in theSCI document is open plan, the compartment size is limited in thisanalysis for simplicity.
Based on the compartment boundary as outlined above, the to-tal area of the compartment boundaries is assumed to be 612 m2.The following assumptions with regards to available openings arealso made: the height of the window openings is assumed to be1.2 m and the total area of openings is estimated to be 46.6 m2.The opening factor is varied according to the JCSS probabilisticmodel code. Using a medium fire growth rate corresponding withthe fire growth rate of office buildings and the fuel load distribu-tion as discussed above, a catalogue of parametric fires was devel-oped based on 3000 random samples of fuel load and openingfactor. The resulting catalogue of fires is shown in Fig. 5. The twoextremes of fire scenario are also indicated in Fig. 5 – a long-coolfire and a short-hot fire [29].
Using the figures above the probability of a structurally signifi-cant fire occurring in the compartment may be estimated. Ignoringthe possible effect of sprinklers since these are not included in thedesign according to the SCI guide and assuming remote monitoringof the smoke detection system is in place the annual recurrence ofa fire in the compartment, pfi, is rfi = 2.4e�7 � 0.0625 � 0.25 �225 = 1.05e�6.
It should be noted that this ignores any statistical relationshipbetween the likelihood of fires occurring and the geographical
location. For comparison, if we consider the likelihood of a firestarting anywhere within the building, which is 18,000 m2 floorarea the frequency is 8.4e�5 fires per year. These figures comparefavourably with the frequency for occurrence of fires in officebuildings quoted in the JCSS probabilistic model code of 1e�6per year.
Recalling the assumption that the distribution of maximumcompartment temperature can be described by an extreme valuedistribution the maximum compartment temperature, Tmax(�C),as intensity measure is plotted in Fig. 6 below as well as the corre-sponding hazard curve.
3.2. Structural system domain
3.2.1. Fire–structure interactionThe temperature distribution through the depth of a section
may be described as a thermal gradient, T,z, and a uniform temper-ature increase, DT, using an idealised temperature distributionthrough the sections depth [30], as shown in Fig. 7.
The effect of these two heating parameters on a structure maybe described as a thermal force and a thermal moment [31]. Theseare both defined for composite sections in Eqs. (8) and (9) below:
NT ¼ EAaDT ð8Þ
MT ¼ Ed3
12aT ;z ð9Þ
where E is Young’s modulus of elasticity, A is the area of the section,d is the depth of the section and a is the coefficient of thermalexpansion. The value of both of these parameters is dependent uponthe heat transfer through the section as well as upon the materialproperties of the section. The fire–structure interaction model isbased on an analysis of the section to determine the equivalenttemperature increase and the equivalent through depth thermalgradient.
The stress distribution throughout the composite member isdependent on the structural form of the member, the temperaturedistribution through the member and the mechanical loading. Theanalysis procedure is simplified by dividing the cross section intohorizontal slices. The stress and strain values can then be calcu-lated at the boundaries of these slices.
Heat transfer analysis is carried out using standard techniques.Where the steel is unprotected the temperature may be calculatedusing a stepwise function as outlined in Eurocode 3 [32], Eq. (10):
DTs ¼ kshHp=Acsqs
_hnetDt ð10Þ
where DTs is the change in temperature of the steel, using a lumpedcapacitance approximation, over time interval Dt; ksh is a correctionfactor for the shadow effect; Hp/A is the ratio of the heated perim-eter to the cross-sectional area of the section; cs is the specific heatcapacity of the section and qs is the density of the section; _hnet is thedesign value of heat flux per unit area of the section.
Where the steel is protected, codified methods also exist to al-low the temperature of steel to be calculated [32], Eq. (11).
ki=di
csqs
Hp
As
Tg � Ts
1þ h=3Dt � ðexpð/=10Þ � 1ÞDTg ¼ DTs ð11Þ
where / ¼ ciqicsqs
diHp
As
The heat transfer through concrete is a marginally more compli-cated matter. For the standard fire, Eurocode 2 [33] contains pre-scribed isotherms which may be used for the determination oftemperature distribution through a concrete section. However forthe parametric fire curve chosen a 1-d heat transfer analysis maybe used. This is achieved through the use of the procedure de-
106 D. Lange et al. / Engineering Structures 66 (2014) 100–115

scribed by Drysdale [34]. Although this ignores the latent heat ofevaporation of the water within the concrete it is deemed to besuitable for use in this case due to its simplicity.
Lamont et al. describe the response of a structure to a long-cooland a short-hot fire [29] (both of the extremes shown in Fig. 5),Fig. 8. The short-hot fire results in a higher peak temperatureand, due to the short duration of the heating phase of the fire, a lar-ger thermal gradient within the structure. This causes large ther-mal moments which induce bowing within a structure and atensile force within, for example, a composite section. Correspond-ingly, a long-cool fire will have a much more uniform temperaturedistribution through a section. This will cause large compressive
forces to develop within an element exposed to fire which mustbe accommodated by the surrounding structure. It should be notedthat the tensile or compressive forces in these cases will only formwhere there is some restraint to lateral translation at the ends ofthe beam. The different thermal response of composite structuresto a long-cool and a short-hot fire are illustrated in Fig. 9. This fig-ure shows the more uniform temperature throughout the depth ofthe composite section during a long-cool fire as opposed to thesteeper gradient of temperature through the depth of the short-hot fire.
3.2.2. Structural system modelThe response of the floor system to fire is based on the assump-
tion that the floor system acts in a tensile membrane mechanism.
Compartment
Fig. 4. The floor area and the location of the compartment used in the analysis.
Long -cool
Short - hot
Fig. 5. Individual records of compartment temperature.
Fig. 6. Equivalent peak compartment temperature as intensity measure and thecorresponding hazard curve.
D. Lange et al. / Engineering Structures 66 (2014) 100–115 107

The derivation of this is outlined in more detail in other articles[35,36] however for this instance a 2-dimensional variant is usedas briefly discussed in [31]. In summary, the method is based onthe steel within the floor system providing a catenary support tothe applied loading, assuming that the ends are fully restrainedagainst translation but not rotation and ignoring any capabilityof the concrete within the floor to provide any load resistance. Thismethodology has three stages:
1. Calculation of the temperature distribution through thedepth of the member
2. Calculation of the deflected shape of the member, basedupon the gross cross-sectional area, and the stresses andstrains in the reinforcing bars associated with this deflectedshape and steel temperature
3. Calculation of the load carrying deflection and the internaland external work done to move from the thermal deflectionto the required deflection, the internal work done is based onthe steel reinforcement only and ignores any contributionfrom the concrete.
Applying the thermal loading to the section results in a thermaldeflection, wT. For a 1-way spanning slab of length L, this deflection
can be calculated by solving the following cubic equation, Eq. (12),for wT:
w3T þ
4Icomp
Acomp� 4NT L2
p2Eref Acomp
!wT þ
16MT L2
p3Eref Acompð12Þ
where Icomp is the second moment of area and Acomp is the area ofthe composite section, Eref is a reference modulus used to determinethe section properties of the section, NT is the thermal force and MT
is the thermal moment – all calculated per unit width of the section.The strains in the bars at the thermal deflection consist of two
components, the thermal strain as a result of the increase in tem-perature of the steel and the strain induced in the steel as a resultof the deflected shape of the concrete in which it is embedded. Thetotal strain is the sum of the thermal strain and the mechanicalstrain, Eq. (13):
etot ¼ emech þ eT ð13Þ
The total strain in the steel at the deflection wT is the strain inthe steel required to follow the deflected shape of the floor systemand is given by:
etot ¼w2
Tp2
4L2 ð14Þ
The mechanical strains are therefore obtained by substitutingEq. (14) into Eq. (13) and subtracting the thermal strain in the steel,aTs, from the total strain:
emech ¼w2
Tp2
4L2 � aTs ð15Þ
where L is the length of the floor system, a is the coefficient of ther-mal expansion of the steel and Ts is the temperature of the steel(assuming lumped capacitance for the steel in this analysis). Themembrane stress in the steel is based upon the mechanical strain,and is given by:
r ¼ w2Tp2Es
4L2 � EsaTs ð16Þ
where Es is the modulus of elasticity, which is temperature depen-dant, and Ts the temperature of the steel.
These equations describe the mechanical state of the steel whileunder thermal loading only. To determine the state of the steel un-der the mechanical loading, a virtual work equation is applied andthe internal and external work are compared while the total deflec-tion is increased stepwise.
Based on the deflected shape, the external work done by a oneway spanning slab moving a load p through a deflection is givenby:
Pext ¼ pZ L
0Dw
4LBp2 ð17Þ
Fig. 7. Temperature distribution idealised as a uniform temperature increase and a through-depth thermal gradient.
Fig. 8. Short-hot and long-cool fire.
Fig. 9. Thermal response of sections to a short-hot and a long-cool fire.
108 D. Lange et al. / Engineering Structures 66 (2014) 100–115

The internal work done at each step in the calculation is deter-mined by evaluating the integral of the stress–strain diagram ofthe steel for the volume of steel in the floor system:
Pint ¼X8st
Z V
DrstDestdV ð18Þ
In order to calculate the deflection required to carry the load,wp, the deflection should be increased incrementally and the totaldeflection should be substituted for wT in Eqs. (17) and (18). Theinternal and the external work should then be compared to deter-mine p, the load carried at the current deflection. If the calculated pis less than the applied load then the deflection should beincreased.
3.2.3. Engineering demand parameter exampleUsing the methodology described above for the structural anal-
ysis it is proposed to declare the total deflection required to carrythe load as the engineering demand parameter. This is analogousto an engineering demand parameter commonly used for PEERPBEE, which is inter-storey drift.
Details of the structure are as follows: the sub-assembly is acomposite steel concrete section comprising a primary beam, sec-tion 305 � 165 � UB40, underneath a ribbed concrete deck withminimum thickness 70 mm at the troughs and maximum thick-ness at the ribs of 130 mm; reinforcing steel in the analysis is as-sumed to comprise of only the A193 anti-cracking mesh withinthe floor.
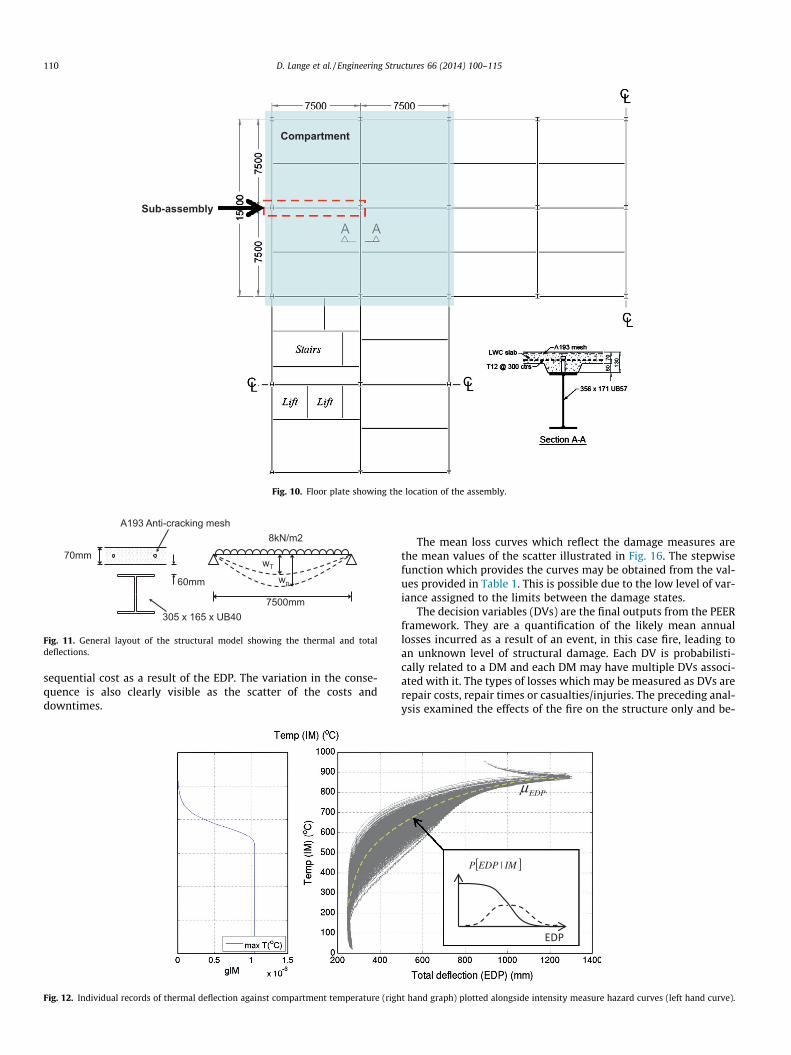
The floor assembly is located in the corner compartment of thebuilding and is restrained at one end by the floor plate and struc-ture in the adjacent bays and at the other end by a perimeter beamand column assembly. The location of the assembly in the floorplate of the building is shown in Fig. 10.
The general arrangement of the structural model, including theboundary conditions is shown in Fig. 11. The anti-cracking mesh isassumed to be located at mid – height of the floor and, for the pur-poses of the 1-dimensional analysis, the width of the concrete por-tion of the section is assumed to be given by 1=4 of the effectivelength, in accordance with Eurocode 4 [37].
In order to evaluate the engineering demand parameter and toderive the corresponding hazard curve, the cumulative distribu-tions of the engineering demand parameter need to be integratedwith respect to the probability of exceedance of the intensity mea-sure, as defined earlier in Eq. (3).
Fig. 12 shows the individual records of the Engineering DemandParameters for the sample of fires. In this instance, the sample isthe same set of fires which were used to derive the intensity mea-sure curve in the previous section. The left hand plot is the inten-sity measure plotted against the annual probabilities ofexceedance, and the right hand plot is the intensity measure plot-ted against the engineering demand parameter – the right handplot shows all of the records of the engineering demand parameter.Fig. 12 also shows schematically an example of a discrete distribu-tion of P(EDP|IM).
In order to determine the hazard curve for the engineering de-mand parameter, the integral in Eq. (3) is evaluated numerically.For the range of intensity measures, the density function p(EDP)is estimated assuming that it is an extreme value distributionand the P(EDP|IM) is determined. This is then integrated with re-spect to g(IM). Fig. 13 shows the resulting hazard curve of the totaldeflection.
3.3. Loss domain
Although the damage measures (DMs) provide a means toquantify the damage done to the structure they may also be used
to quantify the damage to services, internal finishes and contentsof the compartment. These aspects are not included in the analysisas it is anticipated that the smoke/heat damage to these from anyfully developed fire would be complete requiring replacementregardless of the repairability of the structure.
A fragility function was assumed based on the EDP to categorisethe level of damage done to the composite beam caused by a givenvalue of an EDP. In each case there are three levels of damage, DM0,DM1 and DM2. The element is in DM0 when the level of the EDP isinsufficient to cause any damage to the structure. The element en-ters DM1 when the EDP rises to a level where damage is caused tothe element, but it is not beyond repair. DM2 applies when the EDPis such that the element is subject to damage which may require itsreplacement or there is local collapse. In the future, when moreinformation becomes available regarding potential losses resultingfrom structural damage and the damage states are more rigorouslydefined, additional damage states and real (as opposed to as-sumed) fragility functions may be included to give a more realisticand complete estimate of the losses.
For the definition of the damage states associated with thermaldeflection of the floor, the residual deflection of the floor followingfires is considered. It is observable in the reports of the Cardingtontests [38] as well as other reported tests on pre-stressed and com-posite floor slabs in fire [39] that following heating up to 1=4 of thetotal deflection observed at the end of heating was recovered. Sincecooling is not explicitly included within the analysis, the final ther-mal deflection at the end of the heating phase of the fire is taken asbeing the final deformation for determination of the damage mea-sure later.
Since the recovery of the deflection during cooling would intu-itively lead to a relaxation of the tensile forces observed in the steelreinforcement and in any steel beams present this is therefore seenas a conservative assumption at this stage.
The deflection limit for DM1 is assumed to be 30 mm, and thedeflection limit for DM2 is assumed to be 130 mm. These are as-sumed values and are arbitrarily chosen. It is assumed that adeflection of up to 30 mm may be addressed without the require-ment for considerable structural repair work since it is less than 1/3 of the total depth of the concrete section including the ribs and isgiven as the recommended deflection limit in Eurocode 2. Anythingover 130 mm, which is equal to the total thickness of the concretefloor plate, is assumed to be irreparable and will require replace-ment. Standard deviations of both of these damage states are as-sumed to be 0.0001 mm.
Fig. 14 illustrates the conditional probabilities of the DMexceeding the damage state given a state of EDP, i.e. PðDM EDPÞj .
The initial build cost for this part of the structure was calculatedfrom the SCI document [28] and was then used to normalise the re-pair costs. The repair times have been estimated based on the re-pair work which is required. The repair times are normalisedagainst the initial build time of the member, which is given as5 days. Both the repair costs and the repair times have been as-signed a lognormal distribution, the distributions of costs, repairtimes and damage states for reinforcement strain are summarisedin Table 1 (for the lognormal distributions the mean values are gi-ven as a function of l and r, mean = exp (l + r2/2)).
Fig. 15 below shows the cost consequence functions and repairtime consequence functions associated with damage states of thereinforcement strain.
To illustrate the consequence functions a vector of EDP valuesmay be taken and a random sample of costs may be taken for eachof the EDPs to show the variation of the associated costs or down-times. One such illustration of the consequence as a result of totaldeflection is shown in Fig. 16. The transition from one damagestate to another, from DM0 to DM1 and subsequently from DM1to DM2 is clearly visible in the figure for both downtime and con-
D. Lange et al. / Engineering Structures 66 (2014) 100–115 109
sequential cost as a result of the EDP. The variation in the conse-quence is also clearly visible as the scatter of the costs anddowntimes.
The mean loss curves which reflect the damage measures arethe mean values of the scatter illustrated in Fig. 16. The stepwisefunction which provides the curves may be obtained from the val-ues provided in Table 1. This is possible due to the low level of var-iance assigned to the limits between the damage states.
The decision variables (DVs) are the final outputs from the PEERframework. They are a quantification of the likely mean annuallosses incurred as a result of an event, in this case fire, leading toan unknown level of structural damage. Each DV is probabilisti-cally related to a DM and each DM may have multiple DVs associ-ated with it. The types of losses which may be measured as DVs arerepair costs, repair times or casualties/injuries. The preceding anal-ysis examined the effects of the fire on the structure only and be-
Compartment
Sub-assembly
Fig. 10. Floor plate showing the location of the assembly.
wT
wp
8kN/m2
7500mm
70mm
60mm
305 x 165 x UB40
A193 Anti-cracking mesh
Fig. 11. General layout of the structural model showing the thermal and totaldeflections.
[
EDPμ
Fig. 12. Individual records of thermal deflection against compartment temperature (right hand graph) plotted alongside intensity measure hazard curves (left hand curve).
110 D. Lange et al. / Engineering Structures 66 (2014) 100–115

cause of this the repair costs and repair times have been calculatedsolely for the structure of the building.
By integrating the Decision Variable and the Damage Measureresulting from an EDP with respect to the probability of the EDPoccurring, as shown in Section 3.2, the frequency of exceeding a va-lue of loss, or a period of downtime per year can be estimated. Theintegral to be evaluated is:
gDV ¼Z
PðDV jEDPÞdgEDP ð19Þ
Eq. (19) defines the annual occurrence of a decision variable mea-sure, gDV as the conditional probability of exceeding a decision var-iable given that a damage measure has occurred, which is in turngiven the occurrence of an engineering demand parameter. This isintegrated over the annual occurrence of the demand parameter,gEDP. In order to evaluate Eq. (19) numerically, the probability ofexceeding a given decision variable, P(DV|EDP) must be determined.Recognising that DM1 is exclusive of DM2 but DM2 is not exclusiveof DM1, for the stepwise damage measure described above, this isgiven by:
PðDV jEDPÞ ¼ PðDV jDM1ÞPðDM1jDM2; EDPÞþ PðDV jDM2ÞPðDM2jEDPÞ ð20Þ
where PðDM1jDM2Þ denotes the probability of damage measure 1occurring given that damage measure 2 has not occurred. Eq. (19)may therefore be evaluated numerically to obtain the annual costsand downtimes associated with the engineering demand parameterdiscussed.
Fig. 17 shows the cost and downtime curves associated with thetotal deflection.
The annual frequency of incurring any loss is consistently set toaround 1 � 10�6. This is the annual frequency of any of the eventsshown throughout the analysis for each of the stages of the frame-work and is the result of the initial probabilistic calculation of thelikelihood of a structurally significant fire starting.
3.4. Protected steel example
In order to better understand the implications of the frame-work, a similar example is carried out assuming the steel frameis to be protected. In this instance, the structural model is revisedslightly to account for the increased rigidity of the floor assembly,i.e. the deflection is calculated assuming flexure is the dominantload transfer mechanism, as opposed to catenary action.
The method used for determining the structural response forthe EDP based on the protected structure is as follows. Firstly, cal-culate the horizontal end reaction forces and then the associateddisplacements. The total displacement should be based on a com-bination of: the bending displacement taking account of thermo-mechanical loading as well as the mechanical loading; the P–ddeflection arising from the restraint forces and the bending dis-placement; and the post-buckling deflection where appropriate.The modulus of elasticity in this method is temperature depen-dent, consistent with Section 3.2.2. The floor system and boundaryconditions are the same as shown in Fig. 11. The thermo-mechan-ical loading is based on the same sectional analysis as forSection 3.2.
The horizontal restraint force, at the ends of the floor should bebased on the thermal expansion of the section, i.e.
Ph ¼ EAðeT � e/Þ ð21Þ
where e/ is a notional contraction strain [40] given by:
e/ ¼ 1� sin L/=2L/=2
;where / ¼ aT ;z ð22Þ
The total vertical deflections from the thermo-mechanical loadsand the mechanical loads may then be determined by:
wmech ¼L2
ffiffiffiffiffiffiffiffi1
6e/
s�
ffiffiffiffiffiffiffiffiffiffiffiffiffiffiffiffiffi1
6e/ � 1
sþ 5qL4
384EIð23Þ
The combination of the deflection as a result of thermo-mechanical loads and the mechanical loads as well as the horizon-tal restraint reactions induces additional P–d moments and deflec-tions at the mid-span of the floor system. Based on the combined
Fig. 13. Total deflection hazard curve.
Fig. 14. Fragility function of the deflection of the composite assembly.
Table 1Summary of assumed damage states, assumed repair times and assumed repair costs.4 Decision variables (DVs) are given, 2 each describing the repair time and repair costassociated with the two damage measures.
l r Distribution type
DM1 30 0.0001 NormalDM2 130 0.0001 NormalRepair time (DM1) 1.120 0.3 LognormalRepair time (DM2) 2.403 0.3 LognormalRepair cost (DM1) �1.311 0.3 LognormalRepair cost (DM2) 0.519 0.3 Lognormal
D. Lange et al. / Engineering Structures 66 (2014) 100–115 111

Fig. 15. Cost consequence functions and downtime consequence functions associated with damage states of total deflection.
Fig. 16. Loss consequence and downtime consequence samples for total deflection as EDP.
Fig. 17. Probabilistic annual repair cost and downtime associated with total deflection.
112 D. Lange et al. / Engineering Structures 66 (2014) 100–115

deflections and the bending moment and the assumption that thedeflected shape may be approximated as a sine curve, Fig. 18, theP–d deflection may be derived as follows:
MEIðxÞ ¼ 1
EIPhðwmech þwPdÞ sin
pxL
ð24Þ
Integrating this between L/2 and L gives the area of the M/EIdiagram:Z L
L=2
MEI
dx ¼ LpEI
Phðwmech þwPdÞ ð25Þ
By the moment area method, the moment of the M/EI diagramabout the right hand end produces the deviation from the elasticcurve. The centroid of the right half of the deflected shape is deter-mined to be 0.3183L, and therefore:
wPd ¼L
pEIPhðwmech þwPdÞ0:3183L ð26Þ
Eq. (26) can be simplified to:
wPd ¼Cwmech
1� Cð27Þ
where C ¼ 0:3183L2Ph
pEI
It should be noted that this is based on small deflection theory,and that the expression becomes invalid as Ph approaches anempirical limit of 10 times the Euler buckling load for a pin-endedmember.
Finally, if appropriate the post-buckling deflection should be ta-ken into account. The critical horizontal reaction may be calculatedfrom:
Phcrit ¼ EAap2.
ak2 ð28Þ
Here k is the slenderness ratio of the composite section. If Ph > Phcrit,then the post-buckling deflection must be taken into account.
The post-buckling deflection is given by:
wsin ep ¼2Lp
ffiffiffiffiffiffiffiffiffiffiffiffiffiffiffiffiffiffiffiffiffiffiffiffiffiffiffieT � e/ �
p2
k2
sð29Þ
From which the total deflection may be calculated:
wTotal ¼ wmech þwPd þwsin ep ð30Þ
For comparison with the previous analysis, the intensity mea-sure is as described above. The resulting records of total deflection,as well as the corresponding EDP hazard curve are shown inFig. 19. The variance in the total deflection is considerably largerwith the protected beam than with the unprotected beam. How-ever the overall values of deflection are typically lower than withthe unprotected beam, as would be expected. The derivation ofthe hazard curve is exactly the same as in the previous example.The only difference is in the means of calculating the engineeringdemand parameter.
Fig. 20 shows the resulting normalised cost and downtimecurves for this example. Also plotted on Fig. 20 are the costs anddowntimes for the unprotected beam examples for comparison.
3.5. Comparison
It is clear that the likely losses as a result of a fire with a pro-tected structural assembly are considerably lower than if the struc-tural assembly was unprotected. The likelihood of a loss greaterthan the initial build of the assembly is, for example around0.9 � 10�6 for the unprotected assembly and 0.01 � 10�6 for theprotected assembly. This is a considerably less likely event, as isthe event of significant downtime for the adjacent structure. Leav-
Ph Ph
L
wmech
wPδ
q
0.3183L
M
( )δπ Pmechh wwPEI
L +
Fig. 18. Calculation of P–d deflection.
Fig. 19. Total deflection records and corresponding hazard curve for the example with steel protected.
D. Lange et al. / Engineering Structures 66 (2014) 100–115 113

ing structural steel unprotected in this instance therefore, as wouldintuitively be expected, increases the risk to the structure.
However, when the overall cost of the element of structure isconsidered then the economic benefits of protection become ques-tionable. In the SCI publication, the cost for the structure is quotedas between £83 and £108/m2 and the cost for protection between£12.70 and £32/m2. Based on the frequency of costs to repairexceeding the initial build costs, the owner may budget a tinyper cent per annum of the build costs to repair the structurewhereas protection could add as much as 38% to the cost of thestructure. This obviously ignores the cost of room fittings, servicesand furnishings – however in the event of a structurally significantfire these are very likely to require repair or replacement regard-less of the provision of structural protection.
This type of information may be used to influence decisions asto whether or not the structure should be protected, under the con-dition that it may be shown to sustain the applied load in fire forthe duration of an analysis.
4. Discussion and conclusions
This paper has demonstrated an application of the PEER frame-work to structures in fire. The output of the analysis is a set of an-nual cost and downtime curves associated with one possibleengineering demand parameter.
In keeping with the PEER framework, the triple integral of thePEER framework expression has been used in an unmodified stateand therefore independence of the pinch variables has been as-sumed in the probabilistic calculations. However, the structural re-sponse is not independent from the fire model used and thepotential fires which may occur and, the entire family of fire re-cords which was developed for the IM calculation has been usedto again determine the EDP distribution. This has led, in this exam-ple, to the requirement to employ simple hand calculation meth-ods to obtain the 3000 large set of results which was deemed toprovide a repeatable basis for the analysis.
A number of assumptions have been made in the paper, and thesupport for these will require considerable future research, in par-ticular with reference to the repairability of fire damaged compos-ite structures and the costs associated with this. There is littleinformation in the literature and the majority of this is focussedon steel or concrete structures rather than composite construction.The material is also several years old and does not give any
indication of the costs of repair. These are based in this paper uponthe initial construction costs. Further information on damagestates, the costs associated with the repair of fire damaged struc-tures, as well as downtime associated with repair and the identifi-cation of alternative damage measures will most likely require adialogue on this subject with industry.
An apparent disconnect between fire engineering and structuralfire engineering provides reasonable justification at this time forthe use of the parametric fire, however the impact of different firemodels on the results of the framework should be considered in fu-ture research. The computational resources required to run numer-ous FE analyses to illustrate the application of the framework toStructural Fire Engineering have driven the authors to employ sim-pler analytical models in this paper although future iterations willconsider different structural models which will allow the explora-tion of alternative EDPs and DMs.
The example presented has demonstrated the application of thePEER framework to structures in fire and the annual costs resultingfrom it may be used to better inform decisions on performancebased structural fire engineering of buildings in the future as con-fidence in the framework increases.
References
[1] Tubbs B. ICC performance code for buildings and facilities – structural fireprotection provisions. Structures 2001:1–9. http://dx.doi.org/10.1061/40558(2001)80.
[2] Anon. In: Proceedings of the Tianjin workshop on structural engineering forfire resistance, Part 2 performance based design. In: Tianjin workshop onstructural engineering for fire resistance; 2002.
[3] Rini D, Lamont S. Performance based structural fire engineering for modernbuilding design. Structures Congress, San Francisco; 2008. p. 1–12.
[4] Usmani A, Lange D, Webb A, Manohar CS, Sundar VS. Reliability of structuralmembers subjected to fire. In: Fifth international ASRANet conference(ASRANet 2010), Edinburgh; 2010.
[5] Albrecht C, Hosser D. A risk informed framework for performance basedstructural fire protection according to the eurocode fire parts. In: 12thInternational fire science and engineering conference (Interflam 2010),Nottingham; 2010.
[6] EN 1990:2002 Eurocode – basis of structural design; 2002.[7] Lange D, Usmani A, Torero J. A risk based framework for performance based
fire safety design of steel and composite structures. In: Fifth internationalconference on advances in steel structures (Icass ’07), Singapore; 2007.
[8] Frantzich H. Risk analysis and fire safety engineering. Fire Saf J1998;31:313–29.
[9] Nilsson M, Ödén M. Metod för dimensionering av bärförmåga vid brand medriskanalys. Masters thesis, Lund University of Technology; 2007.
[10] Fahleson C, Johansson B, Lagerqvist O. Probabilistic design of steel structures infire. Pro Development Sverige AB; 2009.
Steel unprotected
Steel protected
Steel unprotected
Steel protected
Fig. 20. Probabilistic annual repair cost and downtime associated with total deflection (protected beam example including unprotected beam).
114 D. Lange et al. / Engineering Structures 66 (2014) 100–115

[11] Albrecht C, Hosser D. A response surface methodology for probabilistic lifesafety analysis using advanced fire engineering tools. In: 10th Internationalsymposium on fire safety science (IAFSS10), Karlsruhe; 2011.
[12] Hasofer A, Qu J. Response surface modelling of monte carlo fire data. Fire Saf J2002;37:772–84.
[13] Stern-Gottfried J, Rein G. Travelling fires for structural design – Part I:literature review. Fire Saf J 2012;54:74–85.
[14] Stern-Gottfried J, Rein G. Travelling fires for structural design – Part II: designmethodology. Fire Saf J 2012;54:96–112.
[15] PEER: Pacific Earthquake Engineering Research Center. <http://peer.berkeley.edu/>; 2011 [accessed 03.10.11].
[16] Porter KA. An overview of PEER’s performance-based earthquake engineeringmethodology Keith A. Porter. In: Ninth international conference onapplications of statistics and probability in civil engineering (ICASP9), SanFrancisco; 2003.
[17] Petrini F, Ciampoli M, Augusti G, Università S. A probabilistic framework forperformance-based wind engineering. In: 5th European & African conferenceon wind engineering (EACWE 5), Florence; 2009.
[18] Hamburger RO, Whittaker AS. Considerations in performance-based blastresistant design of steel structures. In: Proceedings of AISC-SINY symposiumon resisting blast and progressive collapse, New York, USA, December 4–5;2003.
[19] Barbato M, Petrini F, Unnikrishnan VU, Ciampoli M. Performance-basedhurricane engineering (PBHE) framework. Struct Saf 2013;45:24–35.
[20] Deierlein GG, Hamilton S. Framework for structural fire engineering anddesign methods; 2003.
[21] Baker JW, Cornell CA. PACIFIC EARTHQUAKE ENGINEERING vector-valuedground motion intensity measures for probabilistic seismic demand analysisvector-valued ground motion intensity measures for probabilistic seismicdemand, analysis; 2006.
[22] Deierlein GG, Krawinkler H, Cornell CA. A framework for performance-basedearthquake engineering. In: 2003 Pacific conference on earthquakeengineering, New Zealand Society for Earthquake Engineering; 2003. p. 1–8.
[23] Koo SH. Forecasting fire development with sensor-linked simulation. PhDthesis, The University of Edinburgh; 2010.
[24] BS EN 1991-1-2:2002. Eurocode 1: Actions on structures - Part 1–2: Generalactions-actions on structures exposed to fire, (2002).
[25] IMPLEMENTATION OF EUROCODES – Handbook 5 – design of buildings for thefire situation, Leonardo da Vinci Pilot Project CZ/02/B/F/PP-134007; 2005.
[26] Lungu D, Rackwitz R. Joint Committee on Structural Safety – Probabilisticmodel code, Part 2: load models; 2001. <http://www.jcss.byg.dtu.dk/Publications/Probabilistic_Model_Code.aspx>.
[27] Schleich JB. Valorisation project: natural fire safety concept; 2001.[28] Hicks SJ, Lawson RM, Rackham JW, Fordham P. Comparative structure cost of
modern commercial buildings. 2nd ed. Ascot, Berkshire: The SteelConstruction Institute; 2004.
[29] Lamont S, Usmani AS, Gillie M. Behaviour of a small composite steel framestructure in a ‘‘long-cool’’ and a ‘‘short-hot’’ fire. Fire Saf J 2004;39:327–57.
[30] Usmani AS. Understanding the response of composite structures to fire. In:North American steel construction conference, Baltimore; 2003.
[31] Cameron NJK. The behaviour and design of composite floor systems in fire. TheUniversity of Edinburgh; 2003.
[32] EN 1993-1-2:2005 Eurocode 3: design of steel structures Part 1.2 General rules– structural fire design; 2005.
[33] EN 1992-1-2: 2004 Eurocode 2: design of concrete structures – Part 1–2:general rules – structural fire design, 3; 2004.
[34] Drysdale D. An introduction to fire dynamics. 2nd ed. John Wiley & Sons, Ltd.;1998.
[35] Cameron NJK, Usmani AS. New design method to determine the membranecapacity of laterally restrained composite floor slabs in fire Part 1: theory andmethod. Struct Eng 2005:28–33.
[36] Cameron NJK, Usmani AS. A new design method to determine the membranecapacity of laterally restrained composite floor slabs in fire Part 2: validation.Struct Eng 2005:34–9.
[37] BS EN 1994-1-1:2004. Eurocode 4: design of composite steel and concretestructures – Part 1-1: general rules and rules for buildings, 122; 2004.
[38] Martin D, Moore D. The behaviour of multi-storey steel framed buildings infire. British Steel plc.; 1999. ISBN 0 900206 50 0.
[39] Ashton L. Fire research note no. 54 – prestressed concrete during and afterfires, comparative tests on concrete floors in prestressed and reinforcedconcrete; 1953.
[40] Usmani A, Rotter J, Lamont S, Sanad A, Gillie M. Fundamental principles ofstructural behaviour under thermal effects. Fire Saf J 2001;36:721–44.
D. Lange et al. / Engineering Structures 66 (2014) 100–115 115