Early Case Assessment Pilot Program U.S. Department of the Interior.
EdData II
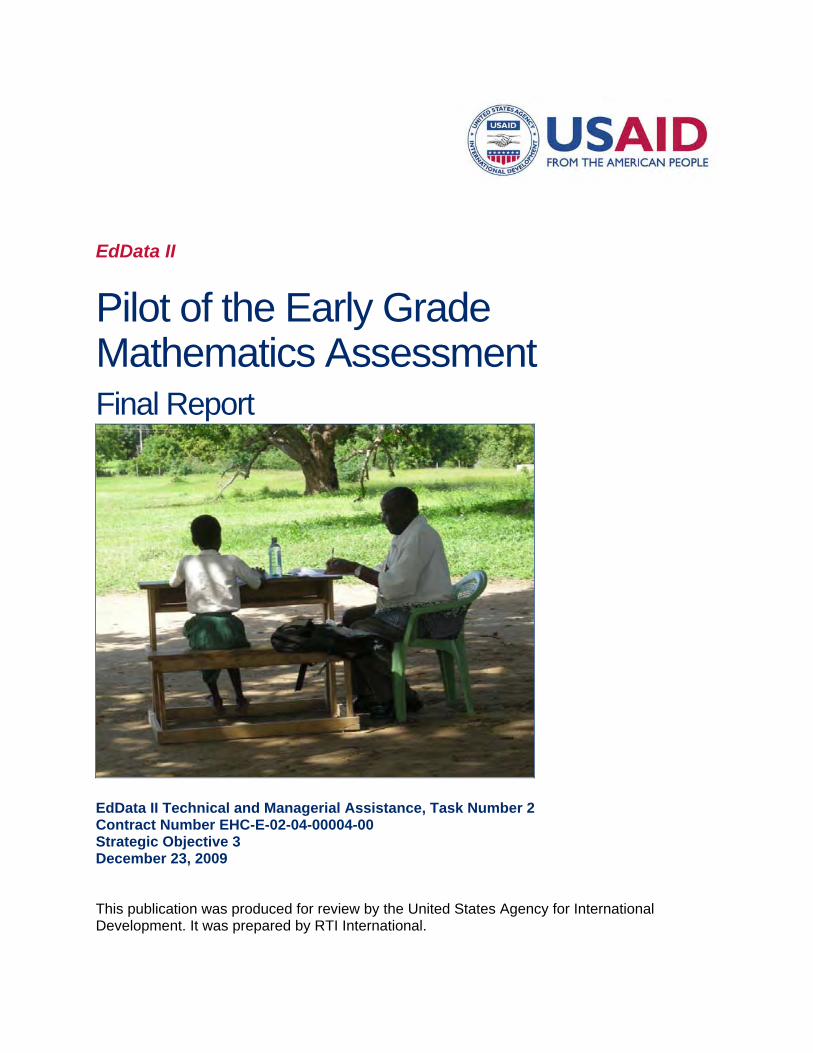
Pilot of the Early Grade Mathematics Assessment Final Report
EdData II Technical and Managerial Assistance, Task Number 2 Contract Number EHC-E-02-04-00004-00 Strategic Objective 3 December 23, 2009 This publication was produced for review by the United States Agency for International Development. It was prepared by RTI International.
Pilot of the Early Grade Mathematics Assessment Final Report December 23, 2009 Prepared for Bureau for Economic Growth, Agriculture and Trade (EGAT/ED) United States Agency for International Development Prepared by Andrea Reubens and Tracy Kline RTI International 3040 Cornwallis Road Post Office Box 12194 Research Triangle Park, NC 27709-2194 RTI International is a trade name of Research Triangle Institute.
The authors’ views expressed in this publication do not necessarily reflect the views of the United States Agency for International Development or the United States Government.
EGMA: Pilot of the Early Grade Mathematics Assessment iii
Table of Contents Page Attachments ................................................................................................................................. iv Exhibits ......................................................................................................................................... v Abbreviations .............................................................................................................................. vii 1. INTRODUCTION ...................................................................................................................1
1.1 Background and Purpose............................................................................................1 1.2 Kenya Adaptation Workshop.......................................................................................4
2. BRIEF REVIEW OF SOME MODIFICATIONS TO THE ORIGINAL INSTRUMENT.............4 2.1 Number Identification ..................................................................................................4 2.2 Addition/Subtraction ....................................................................................................5
3. TRAINING OF ASSESSORS ................................................................................................5 4. CLASSROOM OBSERVATIONS ..........................................................................................7
4.1 Language ....................................................................................................................7 4.2 Counting Strategies.....................................................................................................8 4.3 Teachers .....................................................................................................................9 4.4 Random Sampling of Schools ...................................................................................11
5. BRIEF REVIEW OF TEACHER SURVEY...........................................................................11 6. CHILD ASSESSMENT BACKGROUND QUESTIONS .......................................................16
6.1 Preschool Question ...................................................................................................16 6.2 Textbook Question ....................................................................................................17
7. DATA ANALYSIS ................................................................................................................18 7.1 Introduction................................................................................................................18 7.2 Overview by Tasks and Standard .............................................................................19
7.2.1 Timing and Stop Rules, by Task....................................................................20 7.2.2 Rasch Model..................................................................................................21
7.1 Task 1: Number Identification....................................................................................23 7.2 Task 2: Quantity Discrimination.................................................................................26 7.3 Task 3: Missing Number............................................................................................31 7.4 Task 4: Word Problems.............................................................................................35 7.5 Task 5: Addition/Subtraction .....................................................................................37
7.5.1 Addition..........................................................................................................39 7.5.2 Subtraction ....................................................................................................41
7.6 Task 6: Shape Recognition .......................................................................................44 7.7 Task 7: Pattern Extension .........................................................................................46
8. Assessment Time ................................................................................................................50 9. SUMMARY ..........................................................................................................................53 REFERENCES ...........................................................................................................................55
iv EGMA: Pilot of the Early Grade Mathematics Assessment
Attachments Attachment A. Agenda for EGMA Workshop ..............................................................................59 Attachment B. List of Participants Who Participated for the Entire Week at the
Adaptation Workshop ..........................................................................................................61 Attachment C. Outcomes/Adaptation of Instrument....................................................................62 Attachment D. Addition and Subtraction Problems – Level of Difficulty......................................63 Attachment E. EGMA Child Assessment Training Agenda.........................................................64 Attachment F. EGMA Assessors ................................................................................................68 Attachment G. Assessor Certification Form................................................................................69 Attachment H. School Sample ....................................................................................................70 Attachment I. Pearson Correlations for Selected Number Operation Tasks...............................71 Attachment J. Task 1: Number Identification Wright Plot............................................................72 Attachment K. Task 1: Number Identification by Standard .........................................................73 Attachment L. Task 2: Quantity Discrimination Wright Plot (Reliability = 0.68)...........................74 Attachment M. Task 2: Quantity Discrimination by Standard......................................................75 Attachment N. Task 3: Missing Number Wright Plot ...................................................................76 Attachment O. Task 3: Missing Number by Standard.................................................................77 Attachment P. Task 4: Word Problems Wright Plot ....................................................................78 Attachment Q. Task 4: Word Problems by Standard ..................................................................79 Attachment R. Examples of Methods Used in Student Addition/Subtraction Tasks ...................80 Attachment S. Task 5: Addition Wright Plot ................................................................................83 Attachment T. Task 5: Addition by Standard ..............................................................................84 Attachment U. Addition and Subtraction Recommendations ......................................................85 Attachment V. Task 5: Subtraction Wright Plot ...........................................................................86 Attachment W. Task 5: Subtraction by Standard ........................................................................87 Attachment X. Task 6: Shape Recognition Wright Plot...............................................................88 Attachment Y. Task 6: Shape Recognition by Standard.............................................................89 Attachment Z. Task 6: Shape Recognition Descriptive Statistics ...............................................90 Attachment AA. Task 6: Shape Recognition Practice Item.........................................................91 Attachment AB. Task 7: Pattern Extension Wright Plot ..............................................................92 Attachment AC. Task 7: Pattern Extension by Standard ............................................................93 Attachment AD. Examples of New Pattern Extension Items.......................................................94
EGMA: Pilot of the Early Grade Mathematics Assessment v
Exhibits Page Exhibit 1: Teachers’ reported highest professional qualification ..............................................12 Exhibit 2: Teachers’ reports on what they found most helpful with mathematics
trainings....................................................................................................................13 Exhibit 3: Teachers’ reports on difficulties in preparing lesson plans ......................................13 Exhibit 4: Teachers’ reports on time-related difficulties ...........................................................14 Exhibit 5: Summary of teachers’ reports on challenges in teaching mathematics, by
Standard...................................................................................................................14 Exhibit 6: Five-day snapshot of mathematics activities taking place, by Standard ..................15 Exhibit 7: Teachers’ follow-up comments on goals..................................................................15 Exhibit 8: Teachers’ reports on students beginning Standard 1 ..............................................17 Exhibit 9: Teachers’ reports on mathematics textbooks ..........................................................18 Exhibit 10: Average percentage of items correct, by task and Standard ...................................19 Exhibit 11: Average number of items correct, by task and Standard .........................................20 Exhibit 12: Stop rules for tasks, Kenya pilot...............................................................................21 Exhibit 13: Wright plot—Example Illustration for Explanatory Purposes....................................22 Exhibit 14: Numbers used in number identification task ............................................................23 Exhibit 15: Number identification task—Descriptive statistics....................................................24 Exhibit 16: Number Identification—Distribution by grade...........................................................25 Exhibit 17: Recommended change in order of numbers used in number identification
task...........................................................................................................................25 Exhibit 18: Stop and timing rules for number identification task ................................................26 Exhibit 19: Numbers used in quantity discrimination task..........................................................27 Exhibit 20: Quantity discrimination task—Descriptive statistics .................................................28 Exhibit 21: Quantity discrimination task—Distribution by grade.................................................29 Exhibit 22: Quantity discrimination items for Grade/Standard 1 ................................................29 Exhibit 23: Quantity discrimination Items for Grades/Standards 2 and 3...................................30 Exhibit 24: Stop and timing rules for quantity discrimination task ..............................................31 Exhibit 25: Numbers used in missing number task ....................................................................31 Exhibit 26: Missing number task—Descriptive statistics ............................................................33 Exhibit 27: Missing number task—Distribution by grade............................................................33 Exhibit 28: Recommended numbers to use in missing number task .........................................34 Exhibit 29: Stop and timing rules for missing number task ........................................................34 Exhibit 30: Problems used in word problem task .......................................................................35 Exhibit 31: Word problems task—Descriptive statistics .............................................................36 Exhibit 32: Word problems distribution by grade .......................................................................37 Exhibit 33: Stop and timing rules for word problems..................................................................37 Exhibit 34: Addition task—Descriptive statistics ........................................................................40 Exhibit 35: Addition task—Distribution by grade ........................................................................40
vi EGMA: Pilot of the Early Grade Mathematics Assessment
Exhibit 36: Stop and timing rules for addition problems.............................................................41 Exhibit 37: Subtraction task—Descriptive statistics ...................................................................42 Exhibit 38: Subtraction—Distribution by grade ..........................................................................43 Exhibit 39: Stop and timing rules for subtraction problems........................................................43 Exhibit 40: Shape sheets for shape recognition task .................................................................44 Exhibit 41: Shape recognition—Mean scores, by Standard.......................................................45 Exhibit 42: Stop and timing rules for shape recognition.............................................................46 Exhibit 43: Example pattern for pattern extension task..............................................................47 Exhibit 44: Pattern extension task: Percentage of items correct, by Standard and
individual item ..........................................................................................................48 Exhibit 45: Pattern extension task: Actual number of items marked incorrect ...........................48 Exhibit 46: Pattern extension task: Non-response for items 4 and 5 due to the stop rule .........49 Exhibit 47: Pattern extension task—Descriptive statistics .........................................................49 Exhibit 48: Pattern extension—Distribution by grade.................................................................50 Exhibit 49: Stop and timing rules for pattern extension..............................................................50 Exhibit 50: Descriptive statistics for sample assessment time, across all Standards ................52 Exhibit 51: Time to complete the EGMA, by Standard...............................................................53
EGMA: Pilot of the Early Grade Mathematics Assessment vii
Abbreviations AKF Aga Khan Foundation DQAS Directorate of Quality Assurance and Standards [Kenya MOE] EADEC East Africa Development Consultants EGAT USAID Bureau for Economic Growth, Agriculture, and Trade EGMA Early Grade Mathematics Assessment EGRA Early Grade Reading Assessment EMACK Education for Marginalized Children in Kenya [project] EMIS Education Management Information Systems IRT Item Response Theory KIE Kenya Institute of Education MOE Ministry of Education PIRLS Progress in International Reading Literacy Study TIMSS Trends in International Mathematics and Science Study TTC Teacher Training College USAID U.S. Agency for International Development

EGMA: Pilot of the Early Grade Mathematics Assessment 1
1. INTRODUCTION
1.1 Background and Purpose RTI International was contracted by the U.S. Agency for International Development (USAID) in 2008 to design and pilot an Early Grade Mathematics Assessment (EGMA), based on the international education community’s positive reception of the Early Grade Reading Assessment (EGRA, similarly funded by USAID),1 and the increased focus on mathematics. In September 2008 the development of the EGMA began with a purpose to measure the extent to which schoolchildren in the early primary grades are learning mathematics and, more specifically, number and operations, and geometry skills. The instrument was to be a simple one that teachers and/or local officials could apply to determine a child's understanding of essential foundational math skills. As the development of the instrument finished, a meeting of math assessment experts was convened (mid-January 2009) in Washington, DC, to review EGMA, to share information on various mathematics assessment instruments and protocols being applied to assess students in the early grades, and to obtain feedback and suggestions. The meeting found positive consensus regarding the aim, components, and protocols of the EGMA. The next step in the process was to pilot the EGMA. This would ensure the EGMA as a reliable and valid instrument in telling us how children in these early years were doing in mathematics. A pilot application took place in Kenya in June 2009. This document reports on the pilot that took place in Kenya, with a brief look at the adaptation of the instrument, the training of assessors to implement the instrument, and the analysis on the data that were collected.
As mentioned, the need for students to learn mathematics has come to the attention of many countries, both developed and developing. This is due in part to the influence of international assessments such as the Trends in International Mathematics and Science Study (TIMSS), with its international ratings of the performance of countries around the world. Mathematics is widely recognized as an important mechanism for individuals to further their education and enter the job market. Societies as a whole recognize the benefits and returns from the problem-solving skills and the flexibility that develop through mathematics education.
The following bullets are examples of some of the fourth grade benchmarks in the TIMSS 2007 international mathematics report (Mullis, Martin, & Foy, 2008) that follow the curricula and objectives we review in this report, for both the United States, as a convenient case in point, and for developing countries. Using these benchmarks, students should
1 Both EGMA and EGRA activities are carried out by RTI through task orders under USAID’s Education Data for Decision Making (EdData II) project.
2 EGMA: Pilot of the Early Grade Mathematics Assessment
• demonstrate a level of understanding of whole numbers (e.g., ordering, adding, subtracting).
• demonstrate an understanding of patterns, such as pattern extension in numerical and/or geometric sequences.
• recognize both two- and three-dimensional shapes. • be able solve multistep word problems.
In the United States, concern about student mathematics achievement is increasing. To ensure students are learning what they need in mathematics, the U.S. Department of Education formed a panel of mathematics experts in April 2006 to investigate the most recent research and findings. The panel’s recommendations can be considered fairly representative of the best international thinking on mathematics learning, and do not necessarily pertain only to the United States. The panel issued its recommendations in a document entitled Foundations for success: The final report of the National Mathematics Advisory Panel. According to these recommendations, prepared for the U.S. Department of Education, students need to be proficient in computational procedures and be able to demonstrate this proficiency (Fennell et al., 2008; U.S. Department of Education, 2008). The panel also reported that the understanding of key concepts and the achievement of automaticity where appropriate are essential for the progression of mathematics learning in grades beyond the initial ones. As indicated by the panel,2
Use should be made of what is clearly known from rigorous research about how children learn, especially by recognizing: a) the advantages for children in having a strong start; b) the mutually reinforcing benefits of conceptual understanding, procedural fluency, and automatic (i.e., quick and effortless) recall of facts; and c) that effort, not just inherent talent, counts in mathematical achievement. (p. 11)
Procedural fluency and automatic recall are important for future learning, and as indicated in the more recent TIMSS advanced 2008 assessment framework (Garden et al., 2006), by the fourth grade, children should show familiarity with mathematical concepts and able to
• recall information such as number property and mathematical conventions. • recognize different representations, such as those of the same function or relation. • compute information such as solving simple equations. • retrieve information from graphs and other sources (Garden et al., 2006).
The tasks that make up the EGMA build on one another in the development of mathematics understanding. To ensure the tasks that were selected would tell us how students are doing in mathematics, RTI initiated an extensive literature review to develop
2 To learn more about the mathematics panel experts and the findings of their final report, go to http://www.ed.gov/about/bdscomm/list/mathpanel/report/final-report.pdf
EGMA: Pilot of the Early Grade Mathematics Assessment 3
the measures needed to evaluate students’ early foundational mathematics skills. The skills assessed in the EGMA represent the mathematics foundation that students need to accomplish further tasks, such as retrieving information from graphs and other measurement tasks. Through assessments of children earlier than third or fourth grade, the EGMA can ascertain if children in the first, second, and third grades are obtaining the skills and understanding they need for later success.
To ensure that the EGMA was indeed measuring the skills that should be assessed during these early years, RTI conducted a workshop on January 15–16, 2009, with a panel of U.S. mathematics experts. This panel reviewed the initial proposed instrument consisting of mathematics tasks to assess children’s early mathematics knowledge, and to ascertain if these tasks and instrument as a whole are measuring those foundational skills so important during these early years. The panel reported that the instrument has both a computational and conceptual emphasis that, at the system level, would (1) provide results needed to inform the system on how children are doing in mathematics, and (2) give feedback as to where improvements need to be made. Results from the instrument would also be informative at the teacher level for needs such as in-service training for the implementation of curriculum in the classroom.
Our understanding of how to enhance the teaching of early grade mathematics has recently improved—but this understanding does not always reach the classroom. For instance, research on mathematics teaching in the United States, Japan, and Germany has demonstrated that even when expert and experienced teachers are mathematically competent, they sometimes lack knowledge and understanding of what mathematics skills children should be learning (lack of specification of goals)3 and do not know enough about the teaching and learning of these skills4 in the elementary years. An assessment such as the EGMA is one step in informing communities, schools, and teachers of the skills children need to succeed in mathematics. The EGMA can also serve not only to assess, but also to send messages about goals in a way that is easy for teachers and communities to operationalize and understand.
As briefly mentioned earlier in this section, the following sections of this final report will provide information on the pilot of the EGMA that took place in Malindi, Kenya. This report also provides and elaborates on some of the information from a previous report that covered the piloting of the EGMA instrument and an accompanying teacher survey in Malindi, Kenya.5 Finally, this report reviews the analyzed data for each of the tasks
3 In a study of teachers’ understanding and goals for children in the elementary years, with teachers from the U.S. and China, Ma (1999) observed the lack of teaching for conceptual understanding and level of knowledge that children are expected to demonstrate. Further demonstrated is an understanding as to how this knowledge will benefit the next level of math knowledge to be learned by children as they move from one grade to the next, learning new concepts with new objectives to be met in mathematics. 4 Cai (2005) further demonstrated differences in approaches to the teaching and learning of math skills in the U.S. and China. Baker and LeTendre (2005) examined the teaching methods and approaches used in mathematics in three countries, the U.S., Japan, and Germany. Differences in approach were seen in the conceptual challenges teachers presented to children so the children could actively develop mathematic abilities and skills. 5 For a copy of the Malindi, Kenya, trip report, e-mail: [email protected]
4 EGMA: Pilot of the Early Grade Mathematics Assessment
that children completed during the pilot assessment, and makes recommendations and modifications to the standard EGMA to ensure that the skill levels (e.g., low ability, medium ability) of all students are accurately captured at the system level.
1.2 Kenya Adaptation Workshop The EGMA team’s fieldwork in Kenya began with an adaptation workshop the week of June 21, 2009. The purpose of the Early Grade Mathematics Workshop was to seek and gather expert Kenyan opinion for the development of a draft Early Grade Mathematics Assessment tool for grades 1–3 (see agenda, Attachment A), to be developed for international application but to be piloted in English and Kiswahili in Kenya. The workshop attendees accomplished the following:
• Worked collaboratively with stakeholders, including representatives of the Ministry of Education (MOE), Kenya Institute of Education (KIE), Malindi Education Office, Teacher Training Colleges (TTCs), Aga Khan Foundation (AKF—Education for Marginalized Children in Kenya [EMACK II] project), East Africa Development Consultants (EADEC), and local mathematics consultants (see Attachment B).
• Field-tested the mathematics assessment tool and teacher survey with the assistance of the adaptation workshop participants. Each participant assessed three students (from Standards 1, 2, or 36) in a school located in Malindi.
• Developed a final instrument to be piloted in Malindi with a total of 480 pupils in Standards 1 through 3 in 20 schools.
The remainder of this report summarizes the modifications to the EGMA that took place during the adaptation workshop (see also Attachment C), and briefly reviews procedures for training of assessors, the data collection and sampling, and the final analysis. It also offers recommendations and changes toward the goal of an instrument that is both reliable and valid for international implementation.
2. BRIEF REVIEW OF SOME MODIFICATIONS TO THE ORIGINAL INSTRUMENT
2.1 Number Identification Based on the feedback received during the adaptation workshop in Kenya, the level of difficulty of the EGMA was increased for the number identification task. The original version included numbers 1 through 99. Per the MOE’s syllabus, children in Standard 1
6 Kenya’s public education system consists of Day Care for children 3 years old or younger; compulsory kindergarten, called Pre-Primary 1 (4-year-olds) and Pre-Primary 2 (5-year-olds); 8 years of primary education, Standard 1 through Standard 8; and 4 years of secondary education, Form 1 through Form 4. Thus, Standards 1–3 are equivalent to U.S. grades 1–3, for example. Class and grade are used interchangeably with Standard.
EGMA: Pilot of the Early Grade Mathematics Assessment 5
should demonstrate number knowledge for numbers 0 through 99. Children in Standard 2 should demonstrate number knowledge for numbers 100 through 999 (KIE, 2002). Unit 10 of the pupils’ edition of Primary mathematics 1 (Jomo Kenyatta Foundation, 2003a) for Standard 1 suggests learning of numbers 0 through 99. Unit 6 of Primary mathematics 2 (Jomo Kenyatta Foundation, 2003b) suggests learning of numbers 100 through 999.
2.2 Addition/Subtraction Based on the feedback received during the first 3 days of the adaptation workshop, a decision was made to change the addition/subtraction task so that it included a fluency aspect, simply by adding a time limit. With the assistance of the mathematics expert, David Chard, 30 items were created for this task. When the workshop participants tested it, however, they found these items too easy for the children. It was recommended to increase the level of difficulty. Both the mathematics expert and the RTI mathematics assessment developer expressed concern that the school where the instrument was field-tested in Malindi may have been more advanced in the skills than other schools further away. However, the degree of difficulty was increased in deference to the workshop participants’ opinions.
Also, per feedback from the workshop participants, the addition problems were randomly placed rather than ordered from easier to harder (see Attachment D), as follows:
• The lower-level addition problems are based on numbers between 1 and 9 with totals of less than 10. This represents the items used in Unit 5 of the Standard 1 textbook, Primary mathematics pupils’ book, which was reported as being used by the majority of teachers across the schools in which we collected data (Jomo Kenyatta Foundation, 2003a).
• The next level of addition problems represents numbers less than or equal to 10 with sums equal to or less than 15. This represents the items used in Unit 6 of the Standard 1 textbook, Primary mathematics pupils’ book, and Unit 2 of the Standard 2 textbook, Primary mathematics pupils’ book.
• The highest-level addition problems have sums between 16 and 20. These represent the items used in Unit 10 of the Standard 1 textbook, Primary mathematics pupils’ book, and Unit 2 of the Standard 2 textbook, Primary mathematics pupils’ book.
3. TRAINING OF ASSESSORS An assessor training on the EGMA took place during the week of June 29–July 3, 2009 (see agenda, Attachment E). Twelve assessors attended this training (see Attachment F). A few of the assessors had previously been trained on the EGRA. This was advantageous to our training as there are some similarities between the EGMA and EGRA (e.g., use of
6 EGMA: Pilot of the Early Grade Mathematics Assessment
stopwatches, the one-on-one approach, the randomization of learners). The overall training provided
• instruction on working with young children. • recording of responses such as “don’t know,” “no response,” or refusal. • hands-on practice with the materials that are used during the assessment. • procedures to follow when arriving at a school (e.g., meeting head
teacher/principal, setting up for an assessment). • procedures to follow when leaving a school (e.g., make sure to collect teacher
surveys, thank the head teacher/principal). • procedures for checking assessments for completeness and turning them in to
EADEC, the organization that was subcontracted for logistics and data entry.
On the third day of training, a reliability measure was implemented with the assessors. The following steps were taken to measure reliability across the 12 assessors:
1) The trainer prepared responses (correct and incorrect) for each of the tasks that make up the EGMA.
2) A document was prepared for the assessors to record the responses.
3) The trainer played the role of the assessor and one additional person played the role of a child using the prepared responses.
4) As the “child” read the prepared responses, the assessors entered the responses and scored the tasks (including making sure to apply stop rules where needed).
5) As soon as the trainer had finished working through each of the tasks, the assessors exchanged papers and the correct answers by tasks were read out loud while the assessors scored the tasks. Papers were returned to the original assessors and they reviewed their papers.
6) Papers were gathered and scores were entered into an Excel spreadsheet.
The reliability of the EGMA at this point in the training was at 89%. On the fourth day of the workshop, the assessors had an opportunity to implement the EGMA with children from two schools. In the school settings, assessors were given an opportunity to sample the children whom they would assess, and complete five assessments. When the assessments were complete, the data were entered and reviewed.
One pending item from the adaptation workshop was that the instrument took too much time. At the adaptation workshop that took place during the first week, we decided to see whether the instrument—after we removed a few of the tasks (counting, one-to-one correspondence, and shape attributes)—was taking less time to complete. The assessors’ practice during the second week with schoolchildren indicated that it was still taking too long. Children also did not understand the concept of the number line, and assessors were taking time from the assessment to teach the children this task. After this task was
EGMA: Pilot of the Early Grade Mathematics Assessment 7
removed from the assessment, assessors were able to conduct a majority of the assessments within the range of 15–20 minutes.
Next, also on the fourth day of training, assessors were given the opportunity to become certified on the EGMA (see certification form, Attachment G). This introduced an innovation that the EGRA has not used, but is worthy of consideration. Certification is a process whereby the assessor needs to demonstrate his/her ability to correctly implement the assessment, and enter responses as trained. The certification steps are as follows:
• The trainer plays the role of the child, using a copy of the assessment that has been prepared with responses. An assessor works through the assessment, reading items verbatim, comfortably using materials (e.g., counters, stopwatch) when needed, entering responses correctly, and following stop rules.
• While the assessor is working through the assessment, the trainer makes notes about any discrepancies or mistakes that may take place during the assessment.
• When the assessor has finished, the trainer takes the assessor’s booklet and reviews the entered responses, comparing these responses to the responses in the prepared booklet. Feedback is then provided.
• Based on the number and type of discrepancies, assessors can be asked to practice and return to be certified.
Three of the 12 assessors were asked to practice and then return for certification. The certification process was completed midmorning the last day of training. That afternoon, a second inter-rater reliability test of the whole group was completed with a final score of 95%.
4. CLASSROOM OBSERVATIONS Data collection took place during the week of July 6–10, 2009, in Standards 1, 2, and 3, in 20 schools (see Attachment H). Some observations made in the classrooms during the week are described in this section.
4.1 Language With the assistance of the subcontractor, the English pilot instrument was modified for use in Kenya. Also, Kiswahili instructions and items to be used with the students were added to the instrument. Students were asked in English and Kiswahili which language they preferred. Most seemed to be far more comfortable with the assessor’s reading the task description and items in Kiswahili. This was evident the first week when the adaptation workshop participants administered the assessment, the second week when the assessors administered the instrument during training, and the third week during data collection. In classroom observations, we noted that children were primarily instructed in Kiswahili in Standards 1 and 2. Kenyan officials often seemed unwilling to recognize this
8 EGMA: Pilot of the Early Grade Mathematics Assessment
reality and there tended to be an insistence, which we considered possibly ill-informed, that we use only English.
One Standard 2 teacher conducted an English session during an observation, through talk, sounds, and some reading out of a textbook that was available to all children in the class. It was clear that children did not have enough understanding of English for effective mathematics instruction in the early grades.
For each of the tasks in the EGMA, a check-box was provided on the assessment form, asking the assessor if the child used a language different from what was in the assessment. This box was updated before data collection to ask in more detail how much Kiswahili was used by the child. The data collected for language use on the EGMA pilot show that the dominant language used for 383 assessments (79.8%) was Kiswahili. English was reported as the dominant language for 97 assessments (20.2%). The following bullets provide more detail of language use:
• The use of Kiswahili instructions was reported by assessors on 478 assessments (99.6%).
• Across the 480 completed assessments, assessors reported the use of − Kiswahili most of the time for 251 assessments (52.3%). − Kiswahili all of the time for 162 assessments (33.8%).
• At the beginning of the assessment, children were asked what language they mostly spoke at home. The following is a breakdown of what the children reported: − Kiswahili: 122 children (25.4%) − Giriami: 331 children (69.0%) − English: 4 children (0.8%) − Other languages: 23 children (4.8%)
We recommend that a language expert in Kiswahili help adapt the instrument for future implementation. Also, as noted above, Giriami is another language that may be considered for future adaptation of the EGMA. A couple of the assessors had difficulty assessing some children who spoke only Giriami. Also, when teachers were asked about any challenges they have in teaching mathematics, 17 of them (29.3%) listed the language barrier as one of the challenges that they experience in their classrooms.
4.2 Counting Strategies The counting and addition strategies used by children were also observed during the addition and subtraction tasks. These tasks originally consisted of five addition and five subtraction problems to learn whether children could perform single-digit, double-digit, and one-double-digit-with-carryover tasks; and to see what strategies children were using to solve the problems. This task was modified by the adaptation workshop participants
EGMA: Pilot of the Early Grade Mathematics Assessment 9
into 30 addition problems, timed for 1 minute; and 30 subtraction problems, also timed for 1 minute. The original section where assessors could note whether the child used any strategies during this time was removed. This modification is discussed in greater detail later in this report in the discussion of the counting-strategies task.
The use of counters was also removed from this task. Counters were objects offered to the children to use in solving some of the problems (e.g., addition problems, subtraction problems, word problems).
Despite the removal from the pilot instrument of written observations on strategies children used for addition and subtraction, it was nonetheless possible to observe them using early or basic strategies to add, such as counting their fingers and even toes. Also observed was a child who stood up, reached over to the assessor, and took the counters to assist with solving both the addition and subtraction problems. Other assessors reported children walking around them to get the counters to use in solving these counting tasks. As a result and based on the classroom observations and child assessment data collected in Malindi, as of the preparation of this report, the original section for noting strategies children use was put back into the standard EGMA instrument for this task. Observing and recording this type information will not cause a time burden. Assessors are trained to record if children used their fingers or the counters for any of the addition or subtraction items. Studies have shown that even with forced-retrieval tasks such as solving addition or subtraction problems within, for instance, 3 seconds (e.g., Baroody, 1999; Siegler & Stern, 1998), children use varying strategies to get to the answer rapidly. The observation and analysis of strategies used cannot be discounted, especially if we are to learn where children may be struggling in their calculations for these types of problems. By capturing strategies that are being used, teachers can learn from the errors or the children’s level of efficiency in solving addition and subtraction problems.
4.3 Teachers At the schools in or close to town, mostly female teachers were teaching in Standards 1 and 2. At schools farther from town, male teachers predominated. We also observed differences in teaching styles. The following bullets give some examples of what we observed in two classrooms located in Malindi and then in two classrooms outside Malindi.
In Malindi, • Positive interactions took place between the teacher and students, including eye
contact and polite listening and responding. • Sharing was encouraged as children shared books and materials (e.g., book,
pencil, eraser). • One of these classes had the desks set up for group work and group interaction.
The teacher reported the importance of students sharing and working together in groups.
10 EGMA: Pilot of the Early Grade Mathematics Assessment
• Some specific observations in these two classrooms included: − One classroom had multiplication representations (for beginning
multiplication) hanging on the wall. − Both classrooms had visual aids of shapes and shape names. − A food program was available at one of the schools. − One classroom was practicing adding and subtracting shillings by using
pictures of items for purchase. Each student had an amount of money to make purchases and figured out if they were able to purchase different items based on pictures of the items with the amount for the items written on the board. The teacher showed the students’ work in their notebooks. Many students brought their notebooks to the teacher’s desk to show their work.
• The teacher-child ratio for the Standard 1 classroom was 46:1. • The teacher-child ratio for the Standard 2 classroom was 28:1.
Approximately 60 kilometers outside Malindi, • Teachers seldom interacted directly with students. • Students attempted to get the teachers’ attention whether or not they knew the
answer to a problem. • One teacher in a Standard 1 classroom gained control of the class with a stick he
used to hit against one of the student’s desks and shouted at them. Students became very quiet.
• There were no materials on the walls. • The teacher-student ratio for the Standard 1 classroom was 48:1. • The teacher-student ratio for the Standard 2 classroom was 31:1. • Classes were on a shift schedule due to lack of classrooms. • Children did not work in groups. • A food program was available at both schools. • At one school (observed from 11 a.m. to 3 p.m.), students from the morning shift
stayed to have lunch while students from the afternoon shift were arriving. Most students from the morning shift did not leave. Some students who arrived in the afternoon did not go to class. The classes did not seem very structured. The government education officer who traveled with the EGMA team collected some of the materials used in the classrooms (e.g., textbooks, learning materials) to review what the students and teachers were doing.
Overall, the male teachers were somewhat hesitant in the presence of a female expert (Reubens) in their classrooms, whereas the female teachers were inviting and willing to have her in their classrooms. One of the male teachers told Reubens he was leaving and left her alone with the children for about 15 minutes before returning, talking on his cell
EGMA: Pilot of the Early Grade Mathematics Assessment 11
phone. He then excused the class for break. It is interesting that the teacher did not seem to think this behavior betrayed a lack of professionalism or accountability: One wonders, if this is possible under outside observation, what might happen in normal settings?
4.4 Random Sampling of Schools Before the RTI EGMA team went to Kenya, it was planned that AKF would assist RTI and EADEC in identifying 20 schools participating in AKF’s projects that were not using the EGRA. After the RTI experts’ arrival, however, it was decided that the schools would be selected not only from the AKF project schools, but also from all the schools in the six zones in the Malindi district. The schools were randomly chosen. A number of the schools chosen were quite a distance away from the town of Malindi (e.g., 60 km). This change gave the pilot a better base of observation. The following is a brief overview of the sampling framework for the EGMA pilot.
The sampling of the 20 schools for the pilot of the EGMA took place in three divisions in the Malindi District: (1) Malindi, (2) Magarini, and (3) Marafa, with a total of 121 public primary schools. Forty of the 121 schools were removed from the sampling frame as these schools were implementing EGRA. The remaining 81 schools were used in the sampling. Selection was randomized to 20 schools within the six zones located in the three aforementioned divisions. The zones were the following: (1) Central, (2) Kakoneni, (3) Watamu, (4) Magarini, (5) Marafa, and (6) Garashi.
For selection of students who would participate in the assessment, a computer-generated list of random digits was completed based on the total number of students (N) in each classroom. Overall, 12 numbers were generated—6 for boys and 6 for girls—, though only 8 (4 for boys and 4 for girls) would be used, to allow for replacement if students were absent. The N for each Standard 1, 2, and 3 classroom that had been selected within the sampled schools was obtained from the Malindi district office. The assessors would use the schools’ class registers to select the students who would participate in an assessment. Each of the schools had separate class registers by gender that were used in identifying the participants.
5. BRIEF REVIEW OF TEACHER SURVEY As noted in Section 1, the EGMA pilot included a survey for the primary lead teacher (the lead teacher in the first selected classroom for each level in each school) in Standards 1, 2, and 3, to be filled out during the same day the assessors were in the school. A total of 58 teachers (Standard 1, n = 19; Standard 2, n = 20; and Standard 3, n = 19) participated in filling out a survey. Fifty-one of the teachers who participated reported they had been teaching the same class they were reporting on since the beginning of the school year.
12 EGMA: Pilot of the Early Grade Mathematics Assessment
To ensure the surveys were filled out in their entirety, the assessors were available while the teachers filled them out. This section provides an overview of teacher education, training, and preparation of lessons, and a teacher-reported look at mathematics activities in a classroom over a 5-day period.
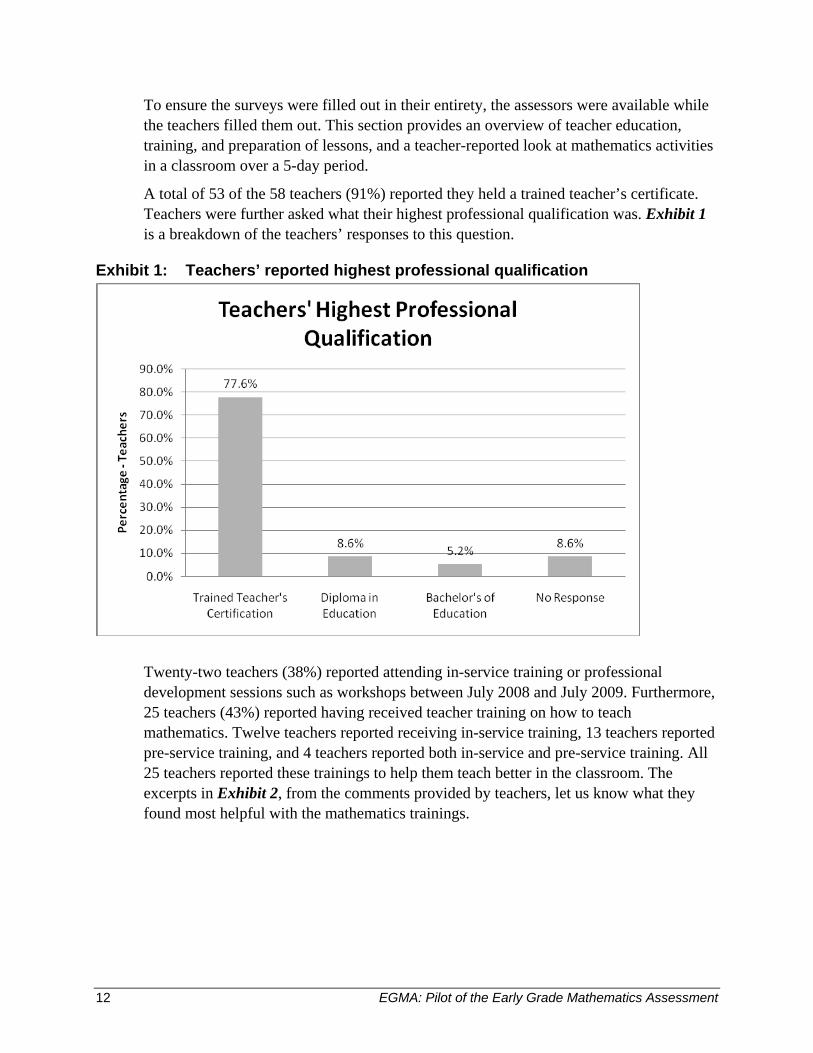
A total of 53 of the 58 teachers (91%) reported they held a trained teacher’s certificate. Teachers were further asked what their highest professional qualification was. Exhibit 1 is a breakdown of the teachers’ responses to this question.
Exhibit 1: Teachers’ reported highest professional qualification
Twenty-two teachers (38%) reported attending in-service training or professional development sessions such as workshops between July 2008 and July 2009. Furthermore, 25 teachers (43%) reported having received teacher training on how to teach mathematics. Twelve teachers reported receiving in-service training, 13 teachers reported pre-service training, and 4 teachers reported both in-service and pre-service training. All 25 teachers reported these trainings to help them teach better in the classroom. The excerpts in Exhibit 2, from the comments provided by teachers, let us know what they found most helpful with the mathematics trainings.
EGMA: Pilot of the Early Grade Mathematics Assessment 13
Exhibit 2: Teachers’ reports on what they found most helpful with mathematics trainings
Teachers were also asked if they prepared mathematics lesson plans before conducting their class sessions. Fifty-five teachers (95%) reported that they did prepare these lesson plans. When asked if they faced any difficulties in preparing the lesson plans, 30 teachers (55%) responded that they did not. The teachers who responded that they did have difficulties (45%) were asked to share their difficulties in preparing their lesson plans. Fourteen of these teachers responded. Six (43%) of these 14 teachers reported lack of or unavailable teaching aids to use with their lesson plans. Exhibit 3 shows excerpts of the teachers’ reports.
Exhibit 3: Teachers’ reports on difficulties in preparing lesson plans
The days per week spent teaching mathematics broke down as follows.
For Standard 1, all the teachers (19) reported teaching mathematics 5 days a week. Two teachers reported teaching mathematics for 60 minutes a day and two teachers reported 35 to 40 minutes a day. The remaining teachers (79%) reported teaching mathematics for 30 minutes a day.
For Standard 2, 19 teachers reported teaching mathematics 5 days a week and 1 teacher reported 4 times a week. Three teachers reported teaching mathematics for 35 to 40 minutes a day. The remaining teachers (85%) reported teaching mathematics for 30 minutes a day.
For Standard 3, 18 teachers reported teaching mathematics 5 days a week and one teacher reported four times a week. Four teachers reported teaching mathematics for 35 to 40 minutes a day. The remaining teachers (79%) reported teaching mathematics for 30 minutes a day.
Not enough time to prepare well due to reviewing work of a large number of students.
There is over enrolment, you don't accomplish your lesson development and there is poor remedial
Lack of recommended teaching aids
Sometimes the teacher's books and course books require one to get specific materials which require time to collect. This makes it hard for all pupils to use them such as teaching aids
Understand teaching methodologies employed in maths, acquire skills of teaching maths.
Enables the teachers [to] gain skills according to their levels, individual differences, group teaching, development and use of teaching aids.
Learn new methods of teaching maths (e.g., how to use teaching aids effectively and on reflecting on lessons).
Handle students better and to employ better use of teaching methods (better teaching practices).
14 EGMA: Pilot of the Early Grade Mathematics Assessment
A total of 14 teachers (24%) reported on the lack of time in the classroom teaching mathematics. Exhibit 4 provides excerpts based on the time spent on mathematics in the classroom.
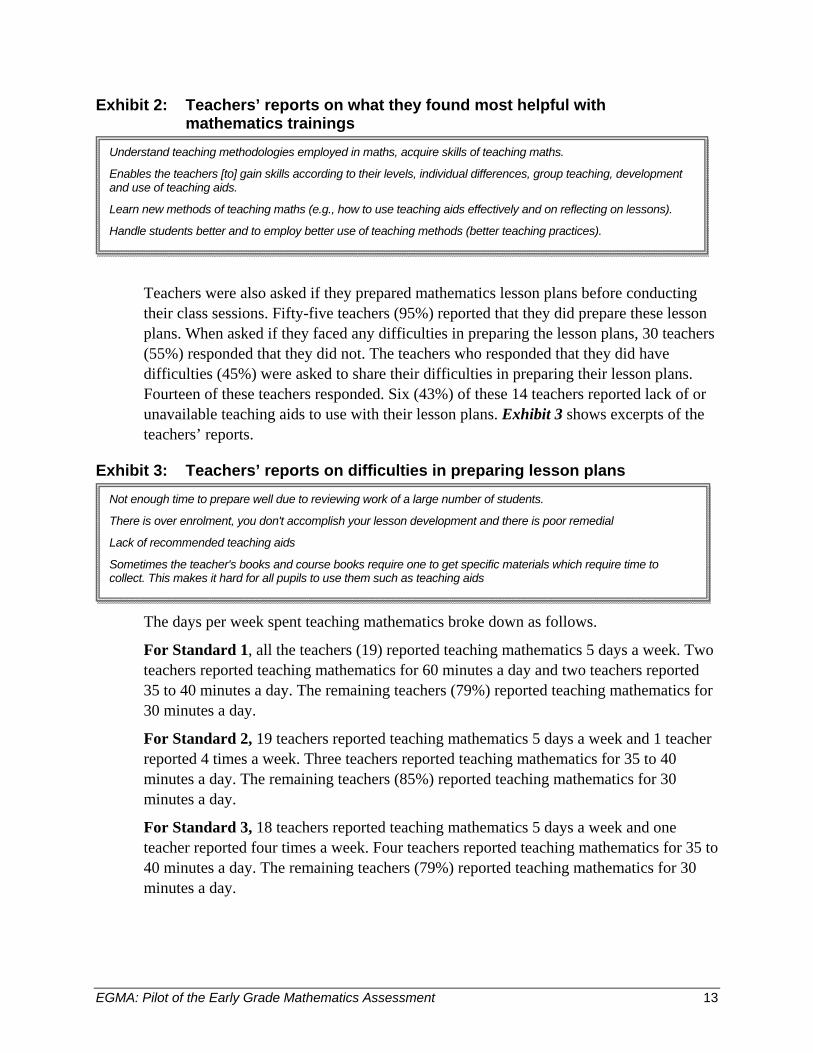
As indicated in the comments in Exhibit 4, some teachers reported “large pupil numbers” as a challenge. Overall, 23 of the 58 teachers reported large numbers of students as a challenge in teaching mathematics. Exhibit 5 enumerates some of the challenges teachers reported.
Exhibit 4: Teachers’ reports on time-related difficulties
Exhibit 5: Summary of teachers’ reports on challenges in teaching mathematics, by Standard
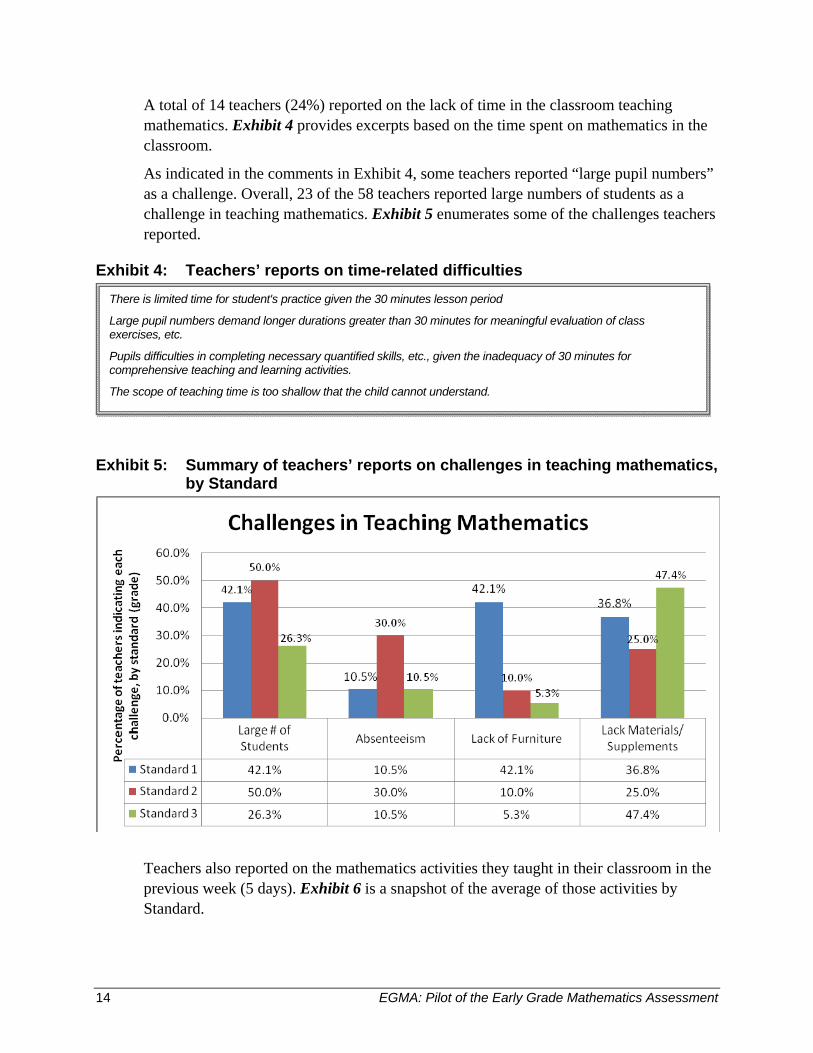
Teachers also reported on the mathematics activities they taught in their classroom in the previous week (5 days). Exhibit 6 is a snapshot of the average of those activities by Standard.
There is limited time for student's practice given the 30 minutes lesson period
Large pupil numbers demand longer durations greater than 30 minutes for meaningful evaluation of class exercises, etc.
Pupils difficulties in completing necessary quantified skills, etc., given the inadequacy of 30 minutes for comprehensive teaching and learning activities.
The scope of teaching time is too shallow that the child cannot understand.
EGMA: Pilot of the Early Grade Mathematics Assessment 15
Exhibit 6: Five-day snapshot of mathematics activities taking place, by Standard
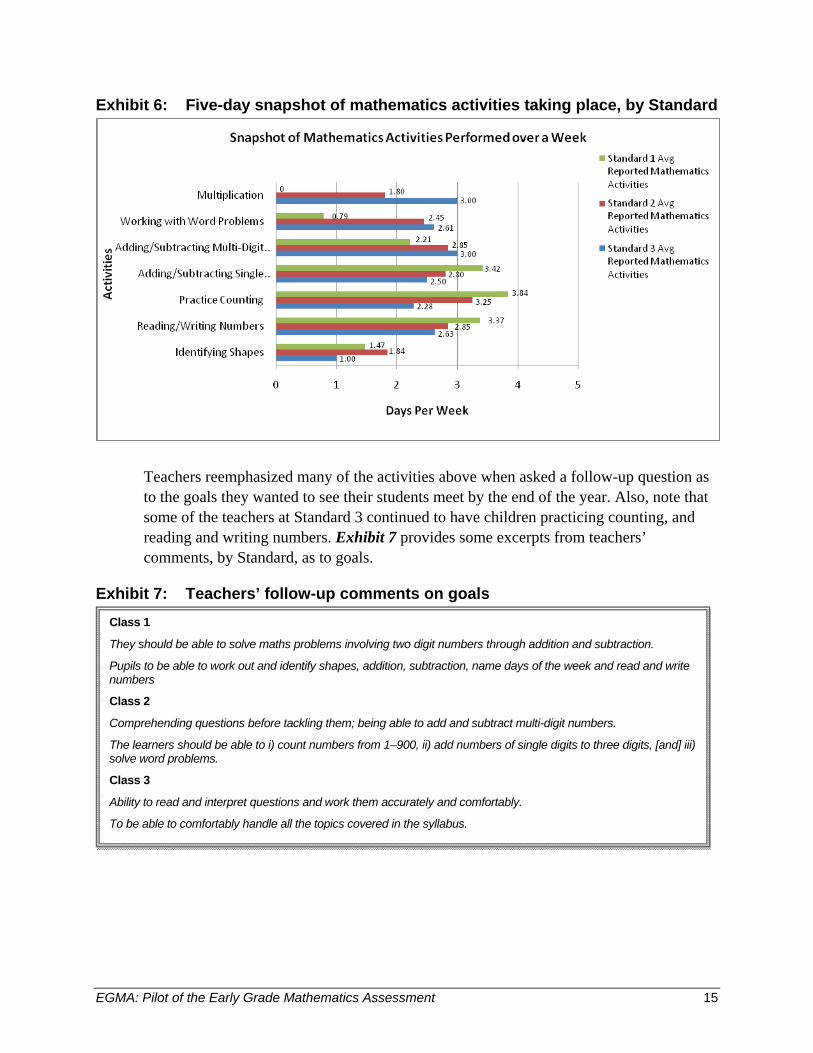
Teachers reemphasized many of the activities above when asked a follow-up question as to the goals they wanted to see their students meet by the end of the year. Also, note that some of the teachers at Standard 3 continued to have children practicing counting, and reading and writing numbers. Exhibit 7 provides some excerpts from teachers’ comments, by Standard, as to goals.
Exhibit 7: Teachers’ follow-up comments on goals
Class 1
They should be able to solve maths problems involving two digit numbers through addition and subtraction.
Pupils to be able to work out and identify shapes, addition, subtraction, name days of the week and read and write numbers
Class 2
Comprehending questions before tackling them; being able to add and subtract multi-digit numbers.
The learners should be able to i) count numbers from 1–900, ii) add numbers of single digits to three digits, [and] iii) solve word problems.
Class 3
Ability to read and interpret questions and work them accurately and comfortably.
To be able to comfortably handle all the topics covered in the syllabus.

16 EGMA: Pilot of the Early Grade Mathematics Assessment
6. CHILD ASSESSMENT BACKGROUND QUESTIONS Before students began the mathematics assessment, they were asked some questions, such as: Did they attend preschool? Do they have a mathematics textbook? What do they do in mathematics class? Section 6 describes the responses to some of these questions.
6.1 Preschool Question A large number of students (94.8%) reported attending nursery or preschool—that is, Pre-Primary 1 and 2. Even in a relatively poor area, it seems that the enormous majority of students attended pre-school. This runs counter to received wisdom and, in many countries, runs counter to information provided by the Education Management Information Systems (EMIS).
Did you go to any nursery/preschool?
Response Number of Student
Responses (%)
Yes 455 (94.8%)
No 24 (5.0%)
No response 1 (0.2%)
The following are examples from the Kenya Ministry of Education’s syllabus for children in the Pre-Primary years.
Based on the early childhood development syllabus at the Pre-Primary 1 level, students should be: grouping and matching objects, making patterns, carrying out counting activities for numbers 1 through 20 (e.g., counting games, counting songs), counting concrete objects, and recognizing and sequencing numbers 1 through 9 (KIE, 2008).
At the Pre-Primary 2 level, students should be: sorting and grouping objects, matching and pairing objects according to attributes, sequencing objects to make patterns and designs, developing familiarity with numbers 1 through 50 (e.g., counting games, counting songs), counting concrete objects, recognizing numbers 1 through 20, sequencing numbers 1 through 9, understanding number value, and writing numbers 1 through 9 (KIE, 2008).
Some teachers reported that students beginning Standard 1 were not prepared. Exhibit 8 contains some relevant excerpts from the teacher survey.
EGMA: Pilot of the Early Grade Mathematics Assessment 17
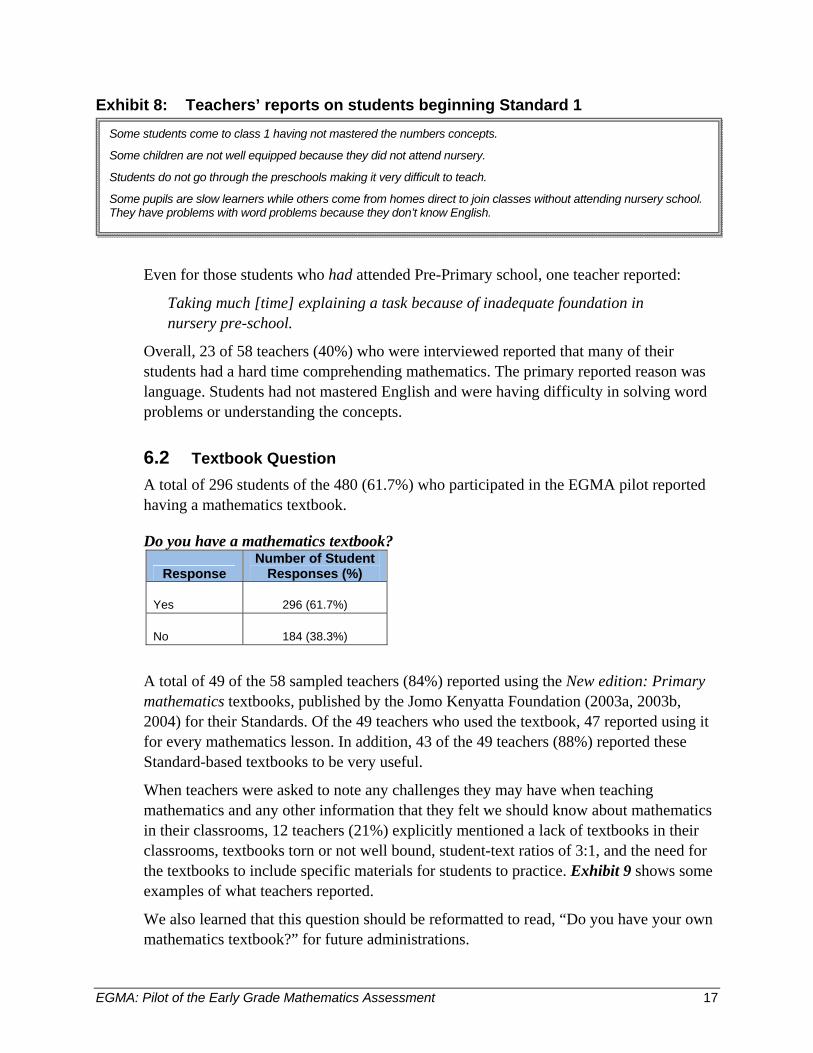
Exhibit 8: Teachers’ reports on students beginning Standard 1
Even for those students who had attended Pre-Primary school, one teacher reported:
Taking much [time] explaining a task because of inadequate foundation in nursery pre-school.
Overall, 23 of 58 teachers (40%) who were interviewed reported that many of their students had a hard time comprehending mathematics. The primary reported reason was language. Students had not mastered English and were having difficulty in solving word problems or understanding the concepts.
6.2 Textbook Question A total of 296 students of the 480 (61.7%) who participated in the EGMA pilot reported having a mathematics textbook.
Do you have a mathematics textbook?
Response Number of Student
Responses (%)
Yes 296 (61.7%)
No 184 (38.3%)
A total of 49 of the 58 sampled teachers (84%) reported using the New edition: Primary mathematics textbooks, published by the Jomo Kenyatta Foundation (2003a, 2003b, 2004) for their Standards. Of the 49 teachers who used the textbook, 47 reported using it for every mathematics lesson. In addition, 43 of the 49 teachers (88%) reported these Standard-based textbooks to be very useful.
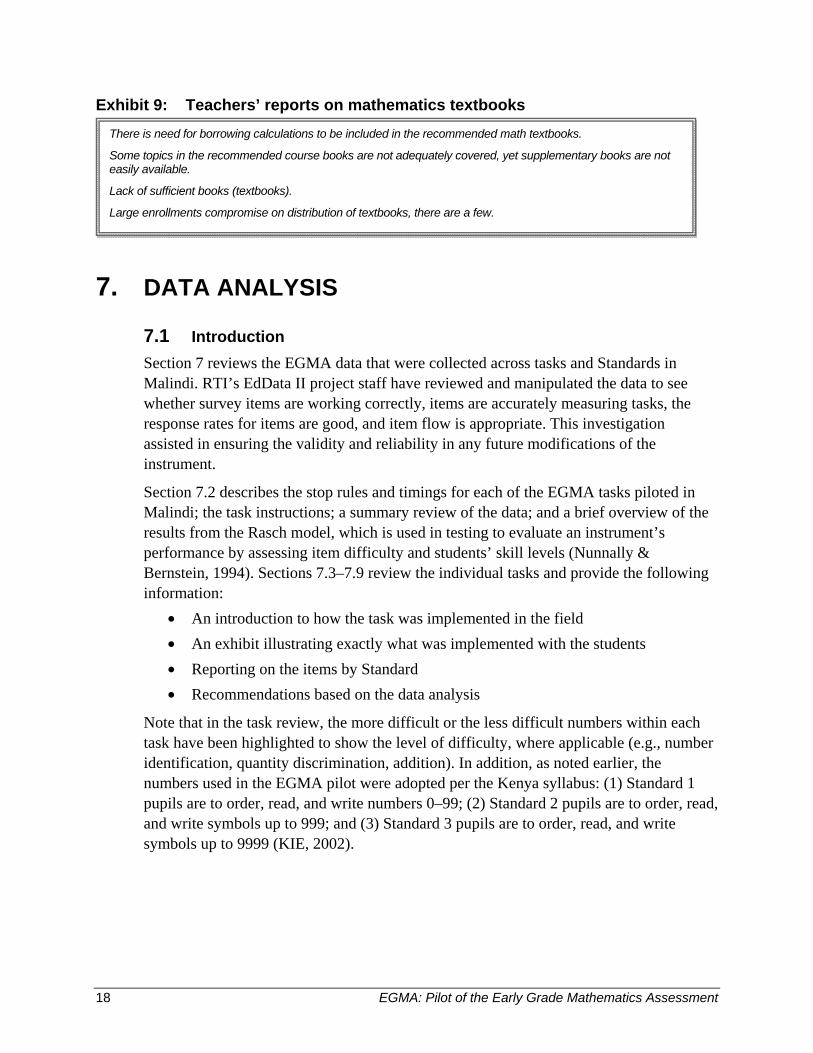
When teachers were asked to note any challenges they may have when teaching mathematics and any other information that they felt we should know about mathematics in their classrooms, 12 teachers (21%) explicitly mentioned a lack of textbooks in their classrooms, textbooks torn or not well bound, student-text ratios of 3:1, and the need for the textbooks to include specific materials for students to practice. Exhibit 9 shows some examples of what teachers reported.
We also learned that this question should be reformatted to read, “Do you have your own mathematics textbook?” for future administrations.
Some students come to class 1 having not mastered the numbers concepts.
Some children are not well equipped because they did not attend nursery.
Students do not go through the preschools making it very difficult to teach.
Some pupils are slow learners while others come from homes direct to join classes without attending nursery school. They have problems with word problems because they don’t know English.
18 EGMA: Pilot of the Early Grade Mathematics Assessment
Exhibit 9: Teachers’ reports on mathematics textbooks
7. DATA ANALYSIS
7.1 Introduction Section 7 reviews the EGMA data that were collected across tasks and Standards in Malindi. RTI’s EdData II project staff have reviewed and manipulated the data to see whether survey items are working correctly, items are accurately measuring tasks, the response rates for items are good, and item flow is appropriate. This investigation assisted in ensuring the validity and reliability in any future modifications of the instrument.
Section 7.2 describes the stop rules and timings for each of the EGMA tasks piloted in Malindi; the task instructions; a summary review of the data; and a brief overview of the results from the Rasch model, which is used in testing to evaluate an instrument’s performance by assessing item difficulty and students’ skill levels (Nunnally & Bernstein, 1994). Sections 7.3–7.9 review the individual tasks and provide the following information:
• An introduction to how the task was implemented in the field • An exhibit illustrating exactly what was implemented with the students • Reporting on the items by Standard • Recommendations based on the data analysis
Note that in the task review, the more difficult or the less difficult numbers within each task have been highlighted to show the level of difficulty, where applicable (e.g., number identification, quantity discrimination, addition). In addition, as noted earlier, the numbers used in the EGMA pilot were adopted per the Kenya syllabus: (1) Standard 1 pupils are to order, read, and write numbers 0–99; (2) Standard 2 pupils are to order, read, and write symbols up to 999; and (3) Standard 3 pupils are to order, read, and write symbols up to 9999 (KIE, 2002).
There is need for borrowing calculations to be included in the recommended math textbooks.
Some topics in the recommended course books are not adequately covered, yet supplementary books are not easily available.
Lack of sufficient books (textbooks).
Large enrollments compromise on distribution of textbooks, there are a few.
EGMA: Pilot of the Early Grade Mathematics Assessment 19
7.2 Overview by Tasks and Standard In a preliminary examination7 of the data (Attachment I), we reviewed the Pearson correlation coefficients, significance values, and the number of cases with non-missing values for each Standard for 4 of the 5 tasks that make up the number operations components in the EGMA (number identification, quantity discrimination, missing number, addition and subtraction).
The correlations (see Attachment I) of the listed variables to Standard are all significant at the .01 level and are very high. Being in school one more year makes a difference, as one expects, and adds to the sense of the face validity of the instrument. Furthermore,
• There is a positive relation between all the listed tasks. • The strongest correlation is between subtraction and addition, r = .748, with a
significance level (p value) of <0.0001. • Even the weakest correlation, that between subtraction and Standard level, is r =
.468 with a p value of <0.0001.
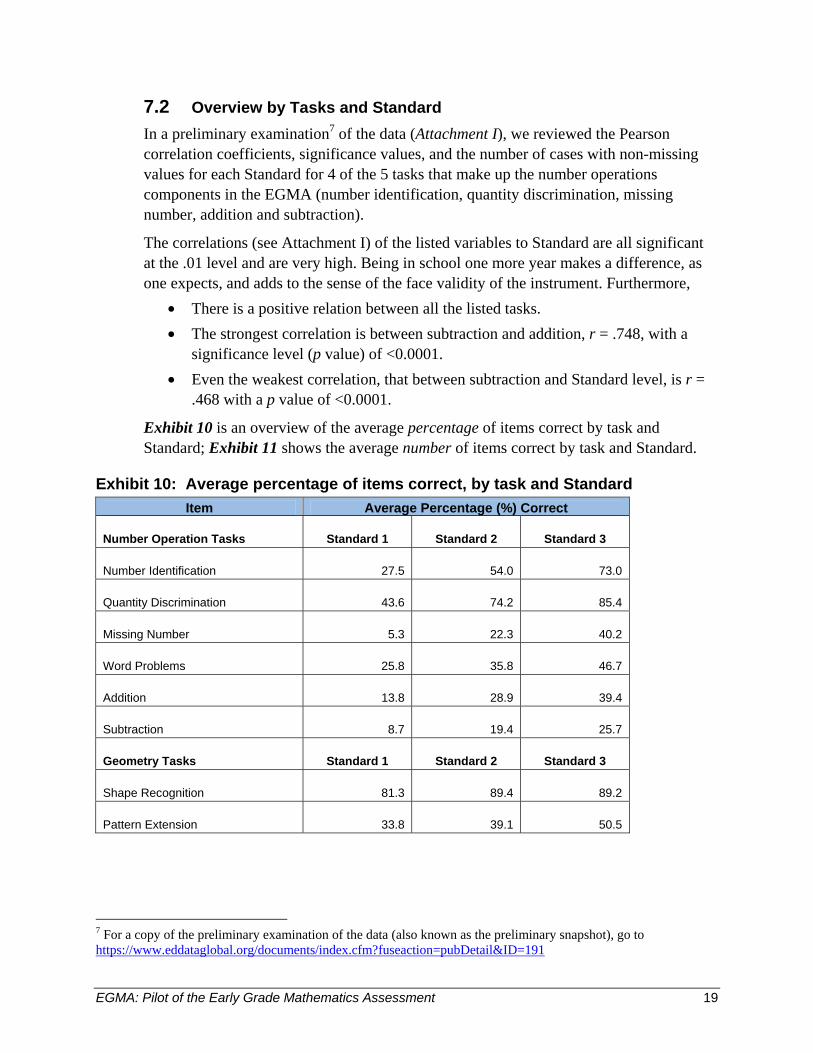
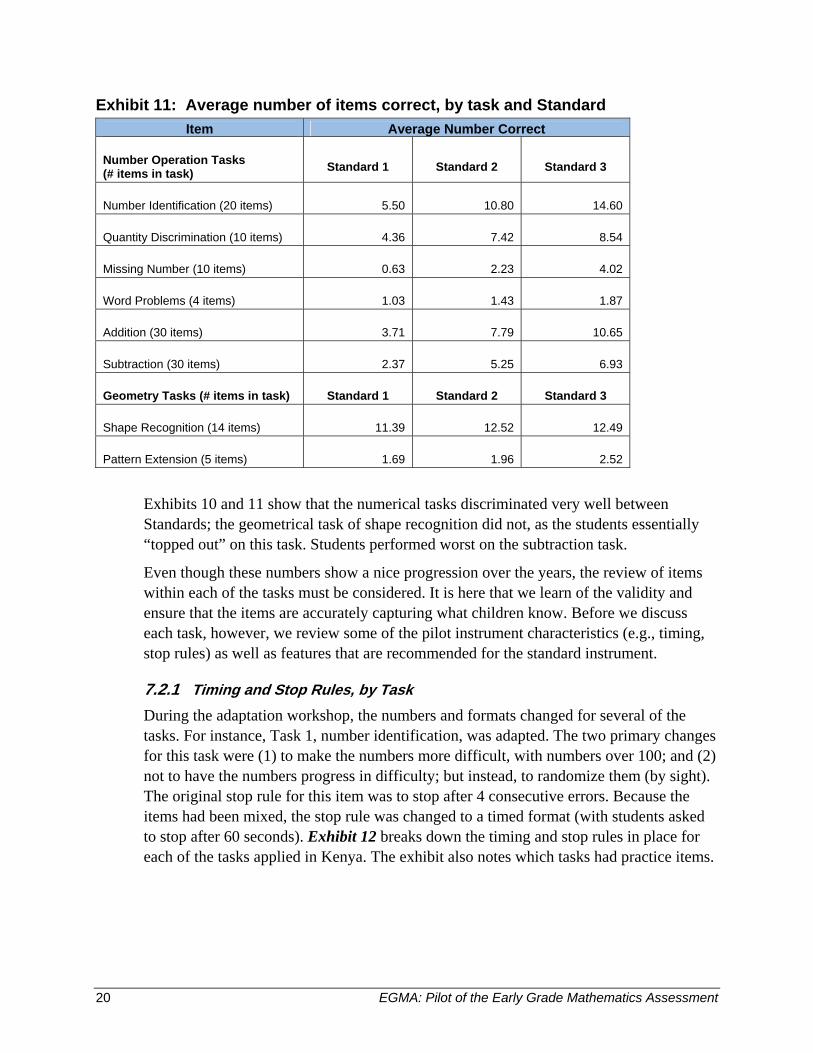
Exhibit 10 is an overview of the average percentage of items correct by task and Standard; Exhibit 11 shows the average number of items correct by task and Standard.
Exhibit 10: Average percentage of items correct, by task and Standard Item Average Percentage (%) Correct
Number Operation Tasks Standard 1 Standard 2 Standard 3
Number Identification 27.5 54.0 73.0
Quantity Discrimination 43.6 74.2 85.4
Missing Number 5.3 22.3 40.2
Word Problems 25.8 35.8 46.7
Addition 13.8 28.9 39.4
Subtraction 8.7 19.4 25.7
Geometry Tasks Standard 1 Standard 2 Standard 3
Shape Recognition 81.3 89.4 89.2
Pattern Extension 33.8 39.1 50.5
7 For a copy of the preliminary examination of the data (also known as the preliminary snapshot), go to https://www.eddataglobal.org/documents/index.cfm?fuseaction=pubDetail&ID=191
20 EGMA: Pilot of the Early Grade Mathematics Assessment
Exhibit 11: Average number of items correct, by task and Standard Item Average Number Correct
Number Operation Tasks (# items in task) Standard 1 Standard 2 Standard 3
Number Identification (20 items) 5.50 10.80 14.60
Quantity Discrimination (10 items) 4.36 7.42 8.54
Missing Number (10 items) 0.63 2.23 4.02
Word Problems (4 items) 1.03 1.43 1.87
Addition (30 items) 3.71 7.79 10.65
Subtraction (30 items) 2.37 5.25 6.93
Geometry Tasks (# items in task) Standard 1 Standard 2 Standard 3
Shape Recognition (14 items) 11.39 12.52 12.49
Pattern Extension (5 items) 1.69 1.96 2.52
Exhibits 10 and 11 show that the numerical tasks discriminated very well between Standards; the geometrical task of shape recognition did not, as the students essentially “topped out” on this task. Students performed worst on the subtraction task.
Even though these numbers show a nice progression over the years, the review of items within each of the tasks must be considered. It is here that we learn of the validity and ensure that the items are accurately capturing what children know. Before we discuss each task, however, we review some of the pilot instrument characteristics (e.g., timing, stop rules) as well as features that are recommended for the standard instrument.
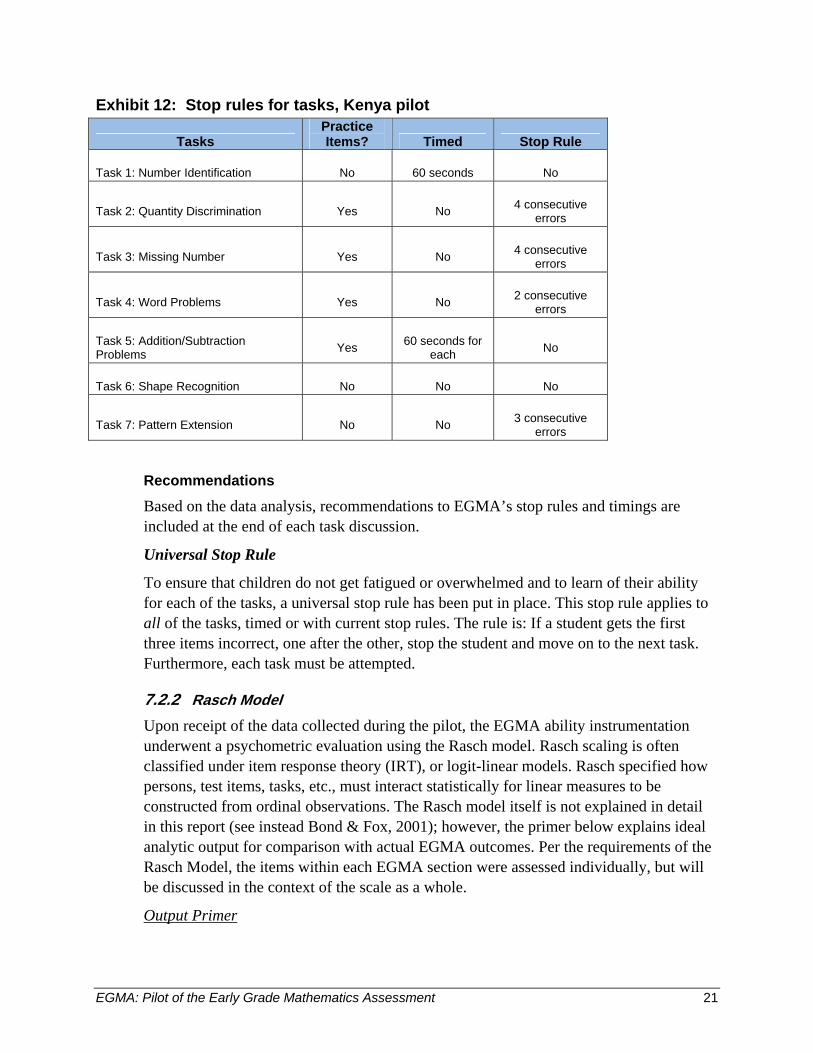
7.2.1 Timing and Stop Rules, by Task During the adaptation workshop, the numbers and formats changed for several of the tasks. For instance, Task 1, number identification, was adapted. The two primary changes for this task were (1) to make the numbers more difficult, with numbers over 100; and (2) not to have the numbers progress in difficulty; but instead, to randomize them (by sight). The original stop rule for this item was to stop after 4 consecutive errors. Because the items had been mixed, the stop rule was changed to a timed format (with students asked to stop after 60 seconds). Exhibit 12 breaks down the timing and stop rules in place for each of the tasks applied in Kenya. The exhibit also notes which tasks had practice items.
EGMA: Pilot of the Early Grade Mathematics Assessment 21
Exhibit 12: Stop rules for tasks, Kenya pilot
Tasks Practice Items? Timed Stop Rule
Task 1: Number Identification No 60 seconds No
Task 2: Quantity Discrimination Yes No 4 consecutive errors
Task 3: Missing Number Yes No 4 consecutive errors
Task 4: Word Problems Yes No 2 consecutive errors
Task 5: Addition/Subtraction Problems Yes 60 seconds for
each No
Task 6: Shape Recognition No No No
Task 7: Pattern Extension No No 3 consecutive errors
Recommendations
Based on the data analysis, recommendations to EGMA’s stop rules and timings are included at the end of each task discussion.
Universal Stop Rule
To ensure that children do not get fatigued or overwhelmed and to learn of their ability for each of the tasks, a universal stop rule has been put in place. This stop rule applies to all of the tasks, timed or with current stop rules. The rule is: If a student gets the first three items incorrect, one after the other, stop the student and move on to the next task. Furthermore, each task must be attempted.
7.2.2 Rasch Model Upon receipt of the data collected during the pilot, the EGMA ability instrumentation underwent a psychometric evaluation using the Rasch model. Rasch scaling is often classified under item response theory (IRT), or logit-linear models. Rasch specified how persons, test items, tasks, etc., must interact statistically for linear measures to be constructed from ordinal observations. The Rasch model itself is not explained in detail in this report (see instead Bond & Fox, 2001); however, the primer below explains ideal analytic output for comparison with actual EGMA outcomes. Per the requirements of the Rasch Model, the items within each EGMA section were assessed individually, but will be discussed in the context of the scale as a whole.
Output Primer
22 EGMA: Pilot of the Early Grade Mathematics Assessment
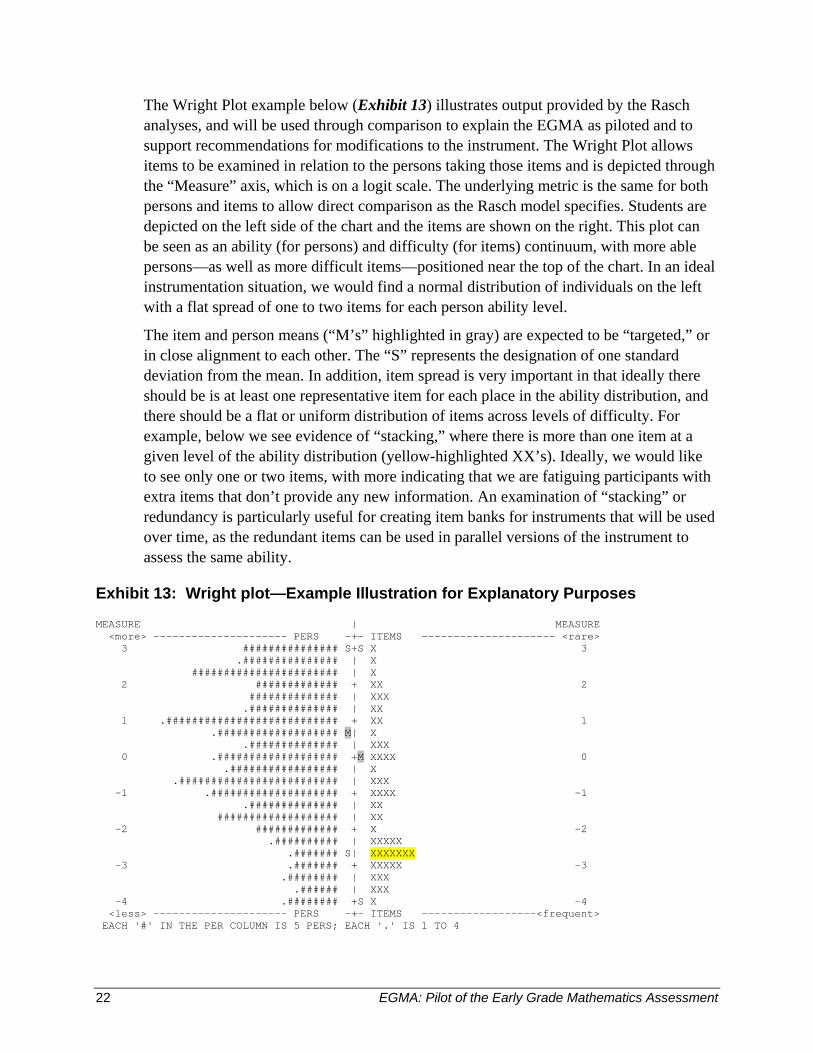
The Wright Plot example below (Exhibit 13) illustrates output provided by the Rasch analyses, and will be used through comparison to explain the EGMA as piloted and to support recommendations for modifications to the instrument. The Wright Plot allows items to be examined in relation to the persons taking those items and is depicted through the “Measure” axis, which is on a logit scale. The underlying metric is the same for both persons and items to allow direct comparison as the Rasch model specifies. Students are depicted on the left side of the chart and the items are shown on the right. This plot can be seen as an ability (for persons) and difficulty (for items) continuum, with more able persons—as well as more difficult items—positioned near the top of the chart. In an ideal instrumentation situation, we would find a normal distribution of individuals on the left with a flat spread of one to two items for each person ability level.
The item and person means (“M’s” highlighted in gray) are expected to be “targeted,” or in close alignment to each other. The “S” represents the designation of one standard deviation from the mean. In addition, item spread is very important in that ideally there should be is at least one representative item for each place in the ability distribution, and there should be a flat or uniform distribution of items across levels of difficulty. For example, below we see evidence of “stacking,” where there is more than one item at a given level of the ability distribution (yellow-highlighted XX’s). Ideally, we would like to see only one or two items, with more indicating that we are fatiguing participants with extra items that don’t provide any new information. An examination of “stacking” or redundancy is particularly useful for creating item banks for instruments that will be used over time, as the redundant items can be used in parallel versions of the instrument to assess the same ability.
Exhibit 13: Wright plot—Example Illustration for Explanatory Purposes MEASURE | MEASURE <more> --------------------- PERS -+- ITEMS --------------------- <rare> 3 ############### S+S X 3 .############### | X ####################### | X 2 ############# + XX 2 ############## | XXX .############## | XX 1 .########################### + XX 1 .################### M| X .############## | XXX 0 .################### +M XXXX 0 .################# | X .######################### | XXX -1 .#################### + XXXX -1 .############## | XX ################### | XX -2 ############# + X -2 .########## | XXXXX .####### S| XXXXXXX -3 .####### + XXXXX -3 .######## | XXX .###### | XXX -4 .######## +S X -4 <less> --------------------- PERS -+- ITEMS ------------------<frequent> EACH '#' IN THE PER COLUMN IS 5 PERS; EACH '.' IS 1 TO 4
EGMA: Pilot of the Early Grade Mathematics Assessment 23
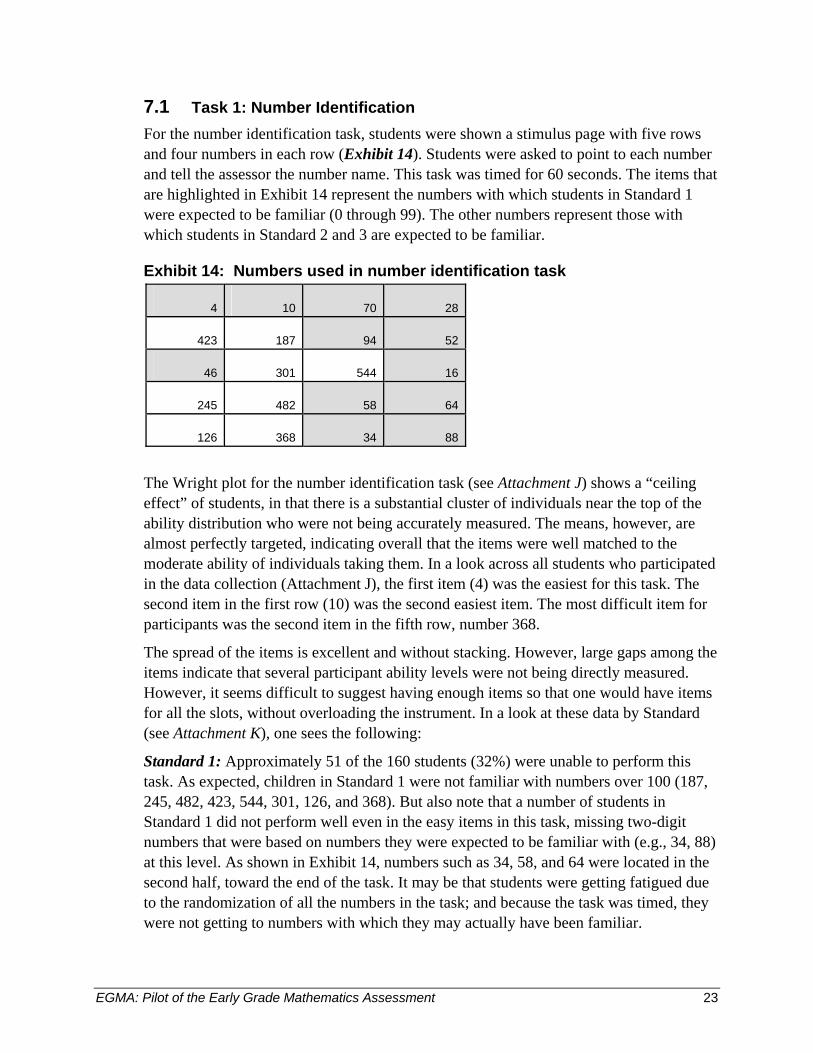
7.1 Task 1: Number Identification For the number identification task, students were shown a stimulus page with five rows and four numbers in each row (Exhibit 14). Students were asked to point to each number and tell the assessor the number name. This task was timed for 60 seconds. The items that are highlighted in Exhibit 14 represent the numbers with which students in Standard 1 were expected to be familiar (0 through 99). The other numbers represent those with which students in Standard 2 and 3 are expected to be familiar.
Exhibit 14: Numbers used in number identification task
4 10 70 28
423 187 94 52
46 301 544 16
245 482 58 64
126 368 34 88
The Wright plot for the number identification task (see Attachment J) shows a “ceiling effect” of students, in that there is a substantial cluster of individuals near the top of the ability distribution who were not being accurately measured. The means, however, are almost perfectly targeted, indicating overall that the items were well matched to the moderate ability of individuals taking them. In a look across all students who participated in the data collection (Attachment J), the first item (4) was the easiest for this task. The second item in the first row (10) was the second easiest item. The most difficult item for participants was the second item in the fifth row, number 368.
The spread of the items is excellent and without stacking. However, large gaps among the items indicate that several participant ability levels were not being directly measured. However, it seems difficult to suggest having enough items so that one would have items for all the slots, without overloading the instrument. In a look at these data by Standard (see Attachment K), one sees the following:
Standard 1: Approximately 51 of the 160 students (32%) were unable to perform this task. As expected, children in Standard 1 were not familiar with numbers over 100 (187, 245, 482, 423, 544, 301, 126, and 368). But also note that a number of students in Standard 1 did not perform well even in the easy items in this task, missing two-digit numbers that were based on numbers they were expected to be familiar with (e.g., 34, 88) at this level. As shown in Exhibit 14, numbers such as 34, 58, and 64 were located in the second half, toward the end of the task. It may be that students were getting fatigued due to the randomization of all the numbers in the task; and because the task was timed, they were not getting to numbers with which they may actually have been familiar.
24 EGMA: Pilot of the Early Grade Mathematics Assessment
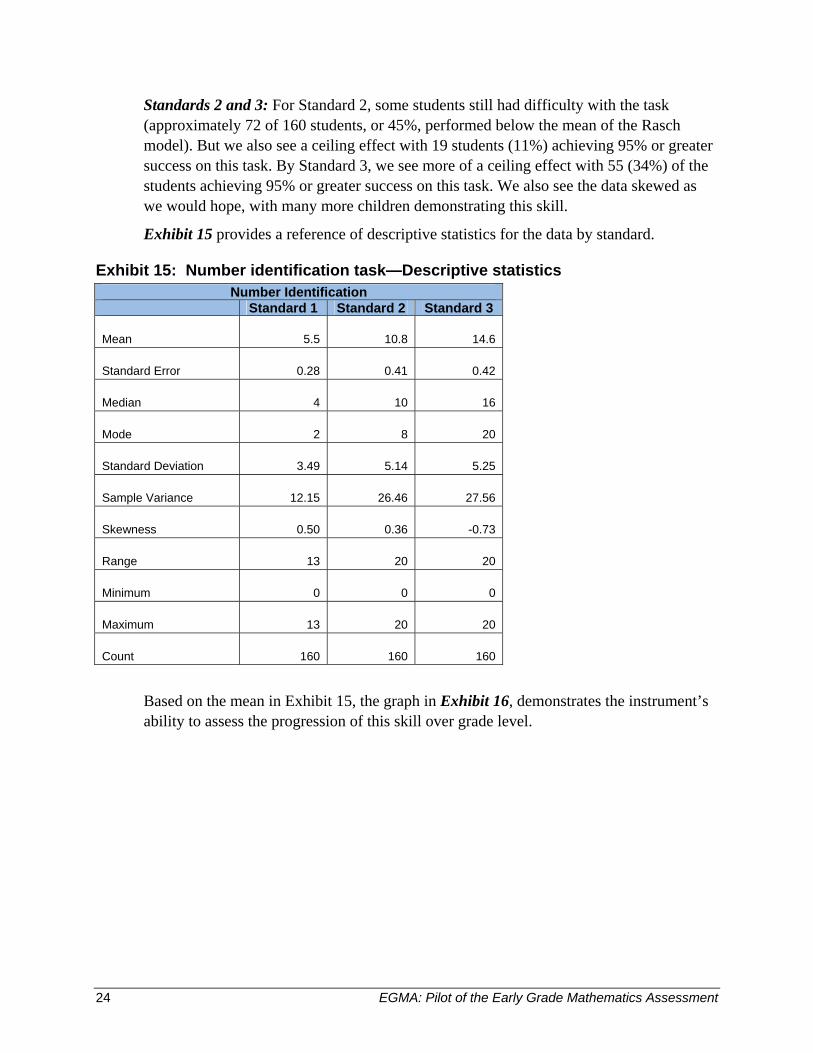
Standards 2 and 3: For Standard 2, some students still had difficulty with the task (approximately 72 of 160 students, or 45%, performed below the mean of the Rasch model). But we also see a ceiling effect with 19 students (11%) achieving 95% or greater success on this task. By Standard 3, we see more of a ceiling effect with 55 (34%) of the students achieving 95% or greater success on this task. We also see the data skewed as we would hope, with many more children demonstrating this skill.
Exhibit 15 provides a reference of descriptive statistics for the data by standard.
Exhibit 15: Number identification task—Descriptive statistics Number Identification
Standard 1 Standard 2 Standard 3
Mean 5.5 10.8 14.6
Standard Error 0.28 0.41 0.42
Median 4 10 16
Mode 2 8 20
Standard Deviation 3.49 5.14 5.25
Sample Variance 12.15 26.46 27.56
Skewness 0.50 0.36 -0.73
Range 13 20 20
Minimum 0 0 0
Maximum 13 20 20
Count 160 160 160
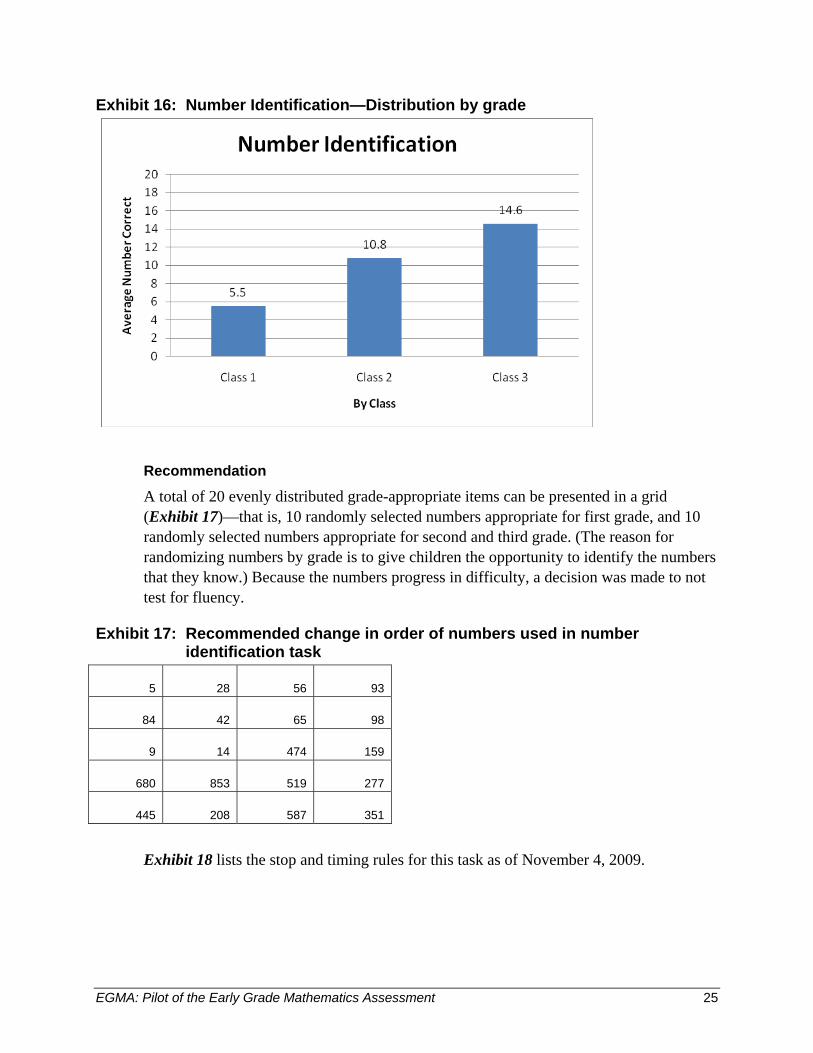
Based on the mean in Exhibit 15, the graph in Exhibit 16, demonstrates the instrument’s ability to assess the progression of this skill over grade level.
EGMA: Pilot of the Early Grade Mathematics Assessment 25
Exhibit 16: Number Identification—Distribution by grade
Recommendation
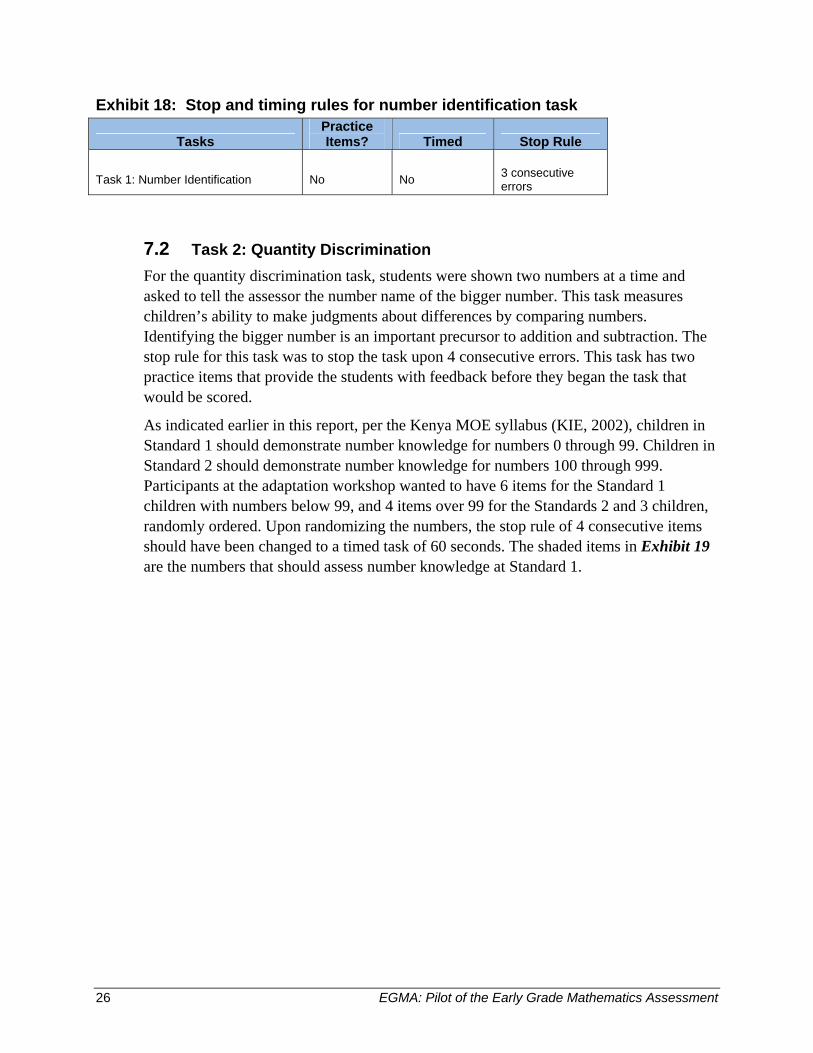
A total of 20 evenly distributed grade-appropriate items can be presented in a grid (Exhibit 17)—that is, 10 randomly selected numbers appropriate for first grade, and 10 randomly selected numbers appropriate for second and third grade. (The reason for randomizing numbers by grade is to give children the opportunity to identify the numbers that they know.) Because the numbers progress in difficulty, a decision was made to not test for fluency.
Exhibit 17: Recommended change in order of numbers used in number identification task
5 28 56 93
84 42 65 98
9 14 474 159
680 853 519 277
445 208 587 351
Exhibit 18 lists the stop and timing rules for this task as of November 4, 2009.
26 EGMA: Pilot of the Early Grade Mathematics Assessment
Exhibit 18: Stop and timing rules for number identification task
Tasks Practice Items? Timed Stop Rule
Task 1: Number Identification No No 3 consecutive errors
7.2 Task 2: Quantity Discrimination For the quantity discrimination task, students were shown two numbers at a time and asked to tell the assessor the number name of the bigger number. This task measures children’s ability to make judgments about differences by comparing numbers. Identifying the bigger number is an important precursor to addition and subtraction. The stop rule for this task was to stop the task upon 4 consecutive errors. This task has two practice items that provide the students with feedback before they began the task that would be scored.
As indicated earlier in this report, per the Kenya MOE syllabus (KIE, 2002), children in Standard 1 should demonstrate number knowledge for numbers 0 through 99. Children in Standard 2 should demonstrate number knowledge for numbers 100 through 999. Participants at the adaptation workshop wanted to have 6 items for the Standard 1 children with numbers below 99, and 4 items over 99 for the Standards 2 and 3 children, randomly ordered. Upon randomizing the numbers, the stop rule of 4 consecutive items should have been changed to a timed task of 60 seconds. The shaded items in Exhibit 19 are the numbers that should assess number knowledge at Standard 1.

EGMA: Pilot of the Early Grade Mathematics Assessment 27
Exhibit 19: Numbers used in quantity discrimination task Item No.
Numbers Presented to Students
1. 6 8
2. 63 54
3. 381 279
4. 79 80
5. 44 53
6. 238 229
7. 675 684
8. 25 16
9. 82 91
10. 523 532
The Wright plot for the quantity discrimination task (see Attachment L) shows another instance of a ceiling effect of students, in that there is a substantial cluster of individuals near the top of the ability distribution who were not being accurately measured, but this is to be expected in a situation where three grades are being tested with the same instrument. The mean targeting is relatively close, indicating that the measurement of persons and items aligned nicely. There is a good spread of items, but the inclusion of items at the extremes of the ability distribution (high and low) would greatly improve the scale. In addition, the more difficult items also appeared toward the end of the presentation list, and the difficulty may have resulted more from these items not being reached than from actual item difficulty. The following is a review of the items by Standard (see also Attachment M).
Standard 1: The most difficult items were item 6 (238 vs. 229), with 34 students (21%) responding correctly; and item 9 (82 vs. 91), with 33 students (21%) responding correctly. The easiest item was item 1 (6 vs. 8), with 137 students (86%) responding correctly. Overall, Standard 1 shows an almost bimodal distribution, with a large subset of participants at the bottom of the distribution while the rest seem to fall into a normal distribution around the mean.
Standards 2 and 3: Unlike Standard 1, both Standards 2 and 3 demonstrate a ceiling effect with a number of students in Standard 2 (approx. 60) and 3 (approx. 66) demonstrating ease with this task. For Standard 2, the most difficult items were item 6 (238 vs. 229) with 75 students responding correctly, item 7 (675 vs. 684) with 95 students
28 EGMA: Pilot of the Early Grade Mathematics Assessment
(59%) responding correctly, and item 9 (82 vs. 91) with 96 students (60%) responding correctly. Overall, for Standard 2, we begin to see a ceiling effect. For Standard 3, the most difficult items were item 6 (238 vs. 229) with 115 students (72%) responding correctly and item 10 (523 vs. 532) with 120 students (75%) responding correctly. The easiest items were item 1 (6 vs. 8) with 154 students (96%) responding correctly and item 2 (63 vs. 54) with 150 students (94%) responding correctly. A substantial ceiling effect occurred as expected for Standard 3. However, the inclusion of more difficult items would more accurately measure those individuals at this level as well as the higher end of the Standard 2 ability spectrum.
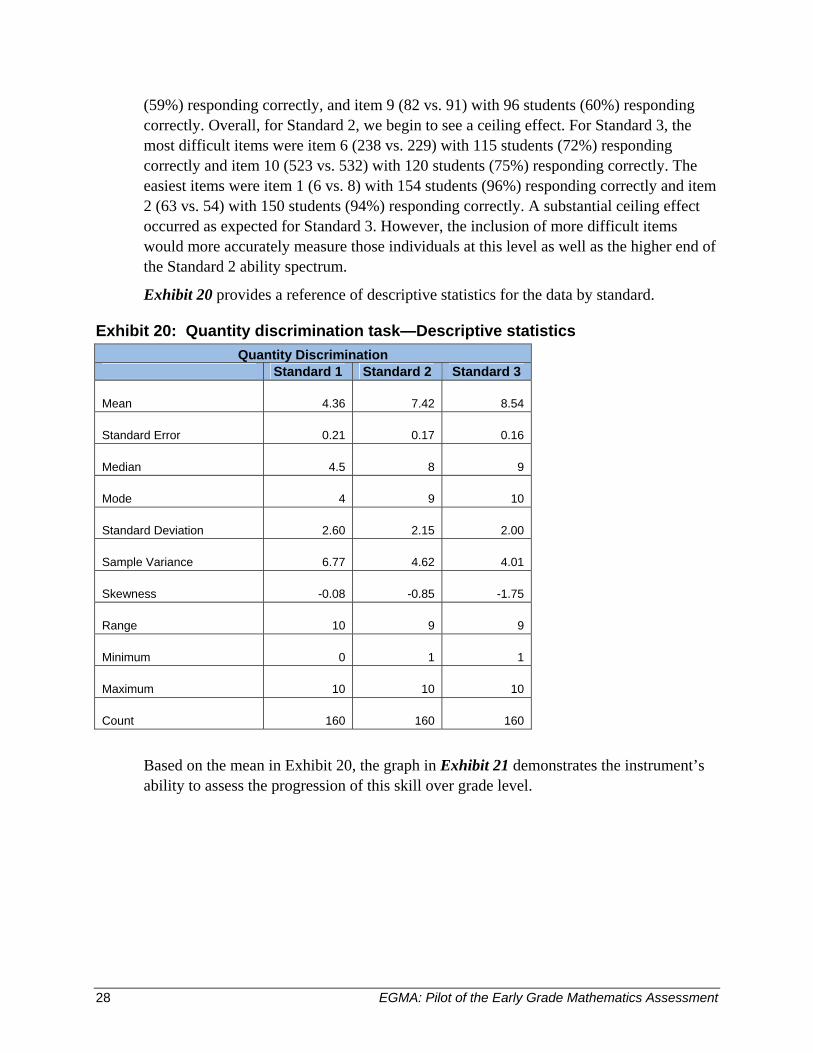
Exhibit 20 provides a reference of descriptive statistics for the data by standard.
Exhibit 20: Quantity discrimination task—Descriptive statistics Quantity Discrimination
Standard 1 Standard 2 Standard 3
Mean 4.36 7.42 8.54
Standard Error 0.21 0.17 0.16
Median 4.5 8 9
Mode 4 9 10
Standard Deviation 2.60 2.15 2.00
Sample Variance 6.77 4.62 4.01
Skewness -0.08 -0.85 -1.75
Range 10 9 9
Minimum 0 1 1
Maximum 10 10 10
Count 160 160 160
Based on the mean in Exhibit 20, the graph in Exhibit 21 demonstrates the instrument’s ability to assess the progression of this skill over grade level.
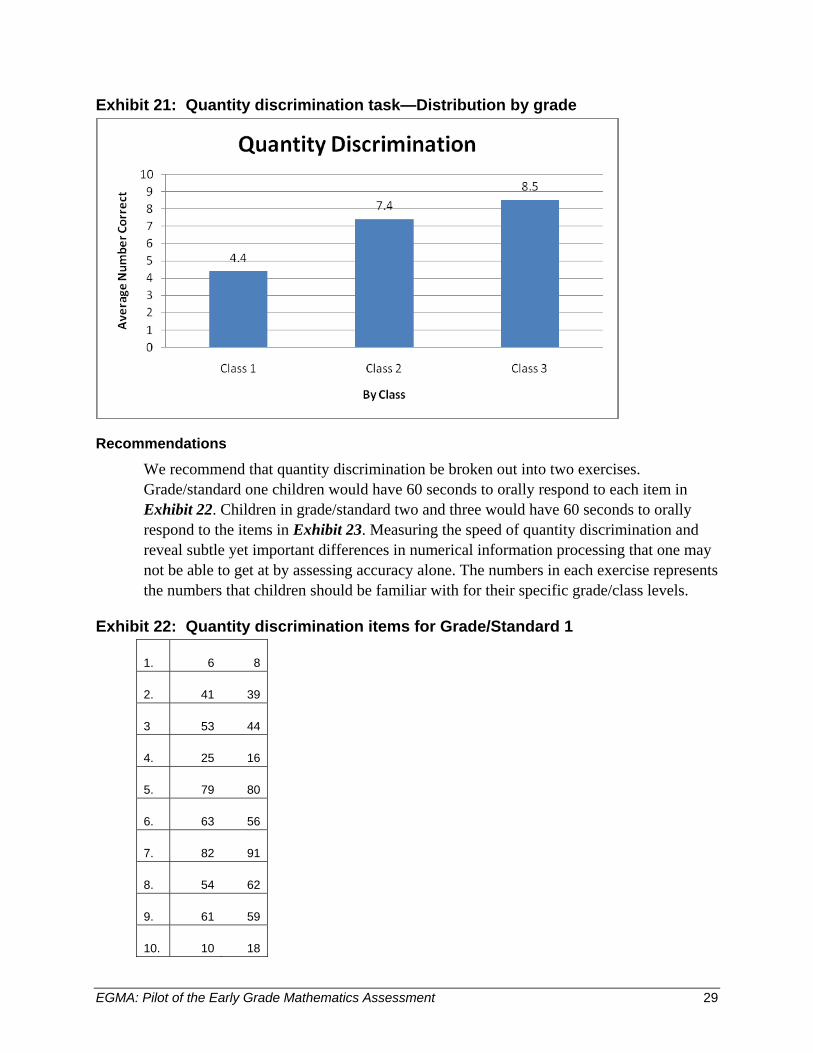
EGMA: Pilot of the Early Grade Mathematics Assessment 29
Exhibit 21: Quantity discrimination task—Distribution by grade
Recommendations
We recommend that quantity discrimination be broken out into two exercises. Grade/standard one children would have 60 seconds to orally respond to each item in Exhibit 22. Children in grade/standard two and three would have 60 seconds to orally respond to the items in Exhibit 23. Measuring the speed of quantity discrimination and reveal subtle yet important differences in numerical information processing that one may not be able to get at by assessing accuracy alone. The numbers in each exercise represents the numbers that children should be familiar with for their specific grade/class levels.
Exhibit 22: Quantity discrimination items for Grade/Standard 1
1. 6 8
2. 41 39
3 53 44
4. 25 16
5. 79 80
6. 63 56
7. 82 91
8. 54 62
9. 61 59
10. 10 18
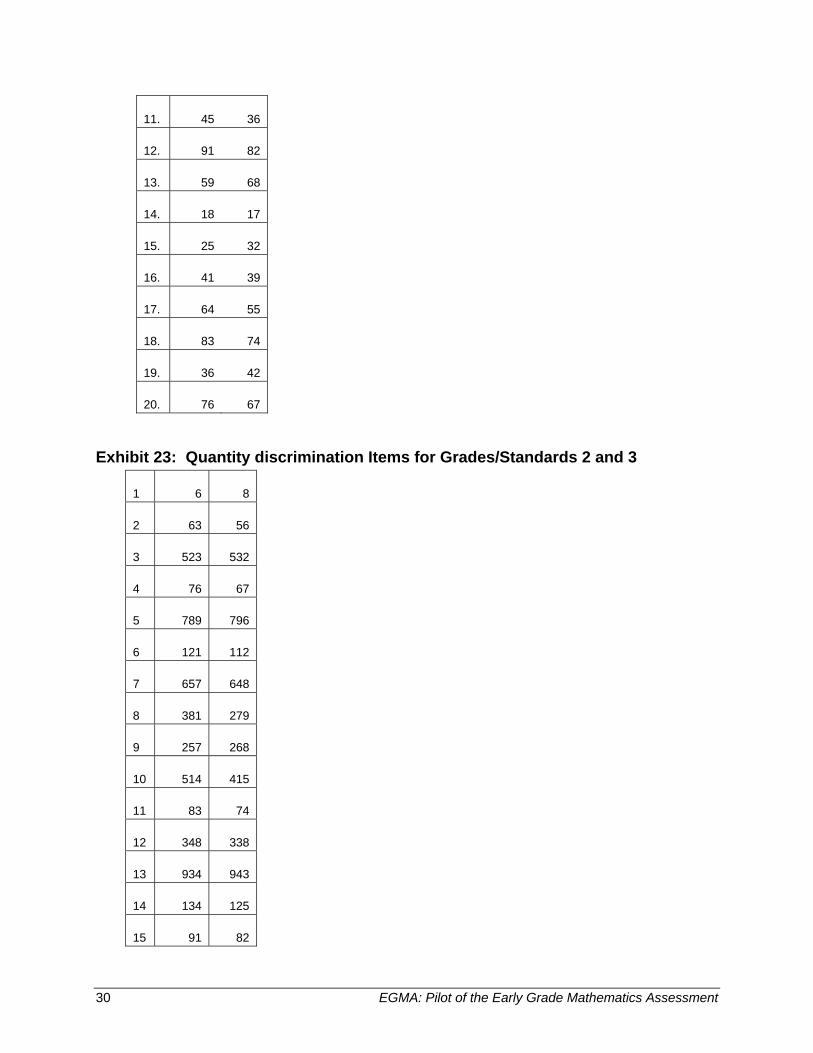
30 EGMA: Pilot of the Early Grade Mathematics Assessment
11. 45 36
12. 91 82
13. 59 68
14. 18 17
15. 25 32
16. 41 39
17. 64 55
18. 83 74
19. 36 42
20. 76 67
Exhibit 23: Quantity discrimination Items for Grades/Standards 2 and 3
1 6 8
2 63 56
3 523 532
4 76 67
5 789 796
6 121 112
7 657 648
8 381 279
9 257 268
10 514 415
11 83 74
12 348 338
13 934 943
14 134 125
15 91 82
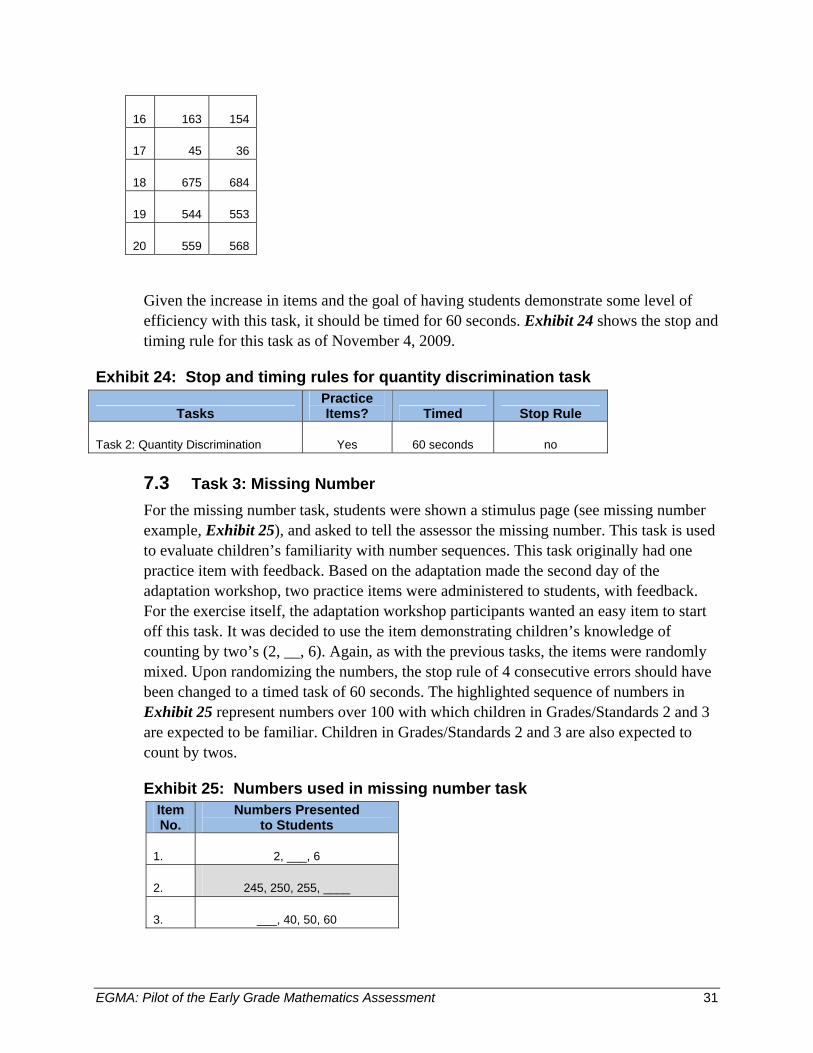
EGMA: Pilot of the Early Grade Mathematics Assessment 31
16 163 154
17 45 36
18 675 684
19 544 553
20 559 568
Given the increase in items and the goal of having students demonstrate some level of efficiency with this task, it should be timed for 60 seconds. Exhibit 24 shows the stop and timing rule for this task as of November 4, 2009.
Exhibit 24: Stop and timing rules for quantity discrimination task
Tasks Practice Items? Timed Stop Rule
Task 2: Quantity Discrimination Yes 60 seconds no
7.3 Task 3: Missing Number For the missing number task, students were shown a stimulus page (see missing number example, Exhibit 25), and asked to tell the assessor the missing number. This task is used to evaluate children’s familiarity with number sequences. This task originally had one practice item with feedback. Based on the adaptation made the second day of the adaptation workshop, two practice items were administered to students, with feedback. For the exercise itself, the adaptation workshop participants wanted an easy item to start off this task. It was decided to use the item demonstrating children’s knowledge of counting by two’s (2, __, 6). Again, as with the previous tasks, the items were randomly mixed. Upon randomizing the numbers, the stop rule of 4 consecutive errors should have been changed to a timed task of 60 seconds. The highlighted sequence of numbers in Exhibit 25 represent numbers over 100 with which children in Grades/Standards 2 and 3 are expected to be familiar. Children in Grades/Standards 2 and 3 are also expected to count by twos.
Exhibit 25: Numbers used in missing number task Item No.
Numbers Presented to Students
1. 2, ___, 6
2. 245, 250, 255, ____
3. ___, 40, 50, 60
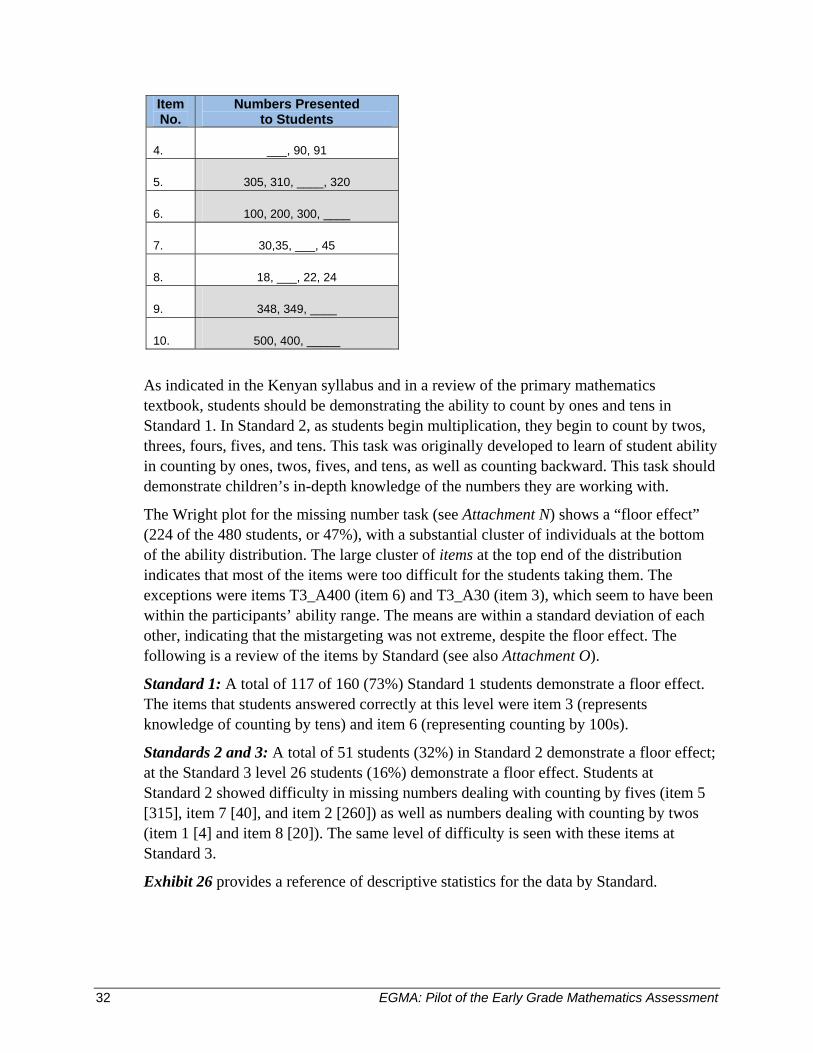
32 EGMA: Pilot of the Early Grade Mathematics Assessment
Item No.
Numbers Presented to Students
4. ___, 90, 91
5. 305, 310, ____, 320
6. 100, 200, 300, ____
7. 30,35, ___, 45
8. 18, ___, 22, 24
9. 348, 349, ____
10. 500, 400, _____
As indicated in the Kenyan syllabus and in a review of the primary mathematics textbook, students should be demonstrating the ability to count by ones and tens in Standard 1. In Standard 2, as students begin multiplication, they begin to count by twos, threes, fours, fives, and tens. This task was originally developed to learn of student ability in counting by ones, twos, fives, and tens, as well as counting backward. This task should demonstrate children’s in-depth knowledge of the numbers they are working with.
The Wright plot for the missing number task (see Attachment N) shows a “floor effect” (224 of the 480 students, or 47%), with a substantial cluster of individuals at the bottom of the ability distribution. The large cluster of items at the top end of the distribution indicates that most of the items were too difficult for the students taking them. The exceptions were items T3_A400 (item 6) and T3_A30 (item 3), which seem to have been within the participants’ ability range. The means are within a standard deviation of each other, indicating that the mistargeting was not extreme, despite the floor effect. The following is a review of the items by Standard (see also Attachment O).
Standard 1: A total of 117 of 160 (73%) Standard 1 students demonstrate a floor effect. The items that students answered correctly at this level were item 3 (represents knowledge of counting by tens) and item 6 (representing counting by 100s).
Standards 2 and 3: A total of 51 students (32%) in Standard 2 demonstrate a floor effect; at the Standard 3 level 26 students (16%) demonstrate a floor effect. Students at Standard 2 showed difficulty in missing numbers dealing with counting by fives (item 5 [315], item 7 [40], and item 2 [260]) as well as numbers dealing with counting by twos (item 1 [4] and item 8 [20]). The same level of difficulty is seen with these items at Standard 3.
Exhibit 26 provides a reference of descriptive statistics for the data by Standard.
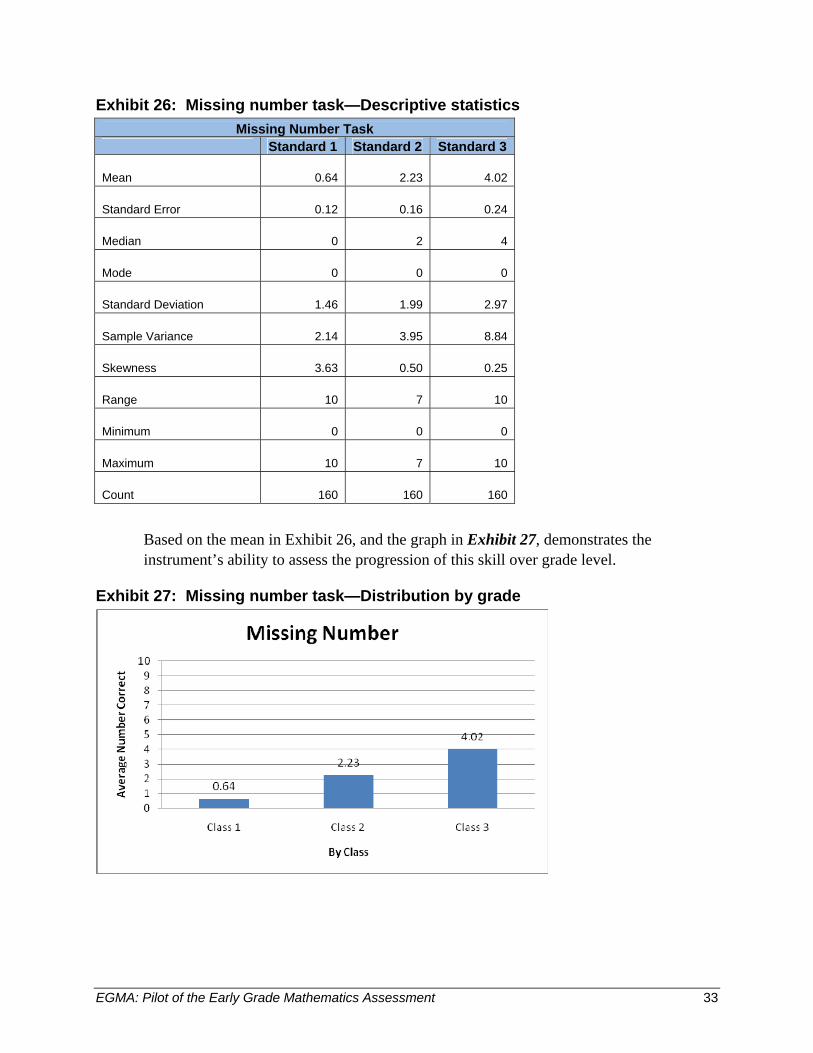
EGMA: Pilot of the Early Grade Mathematics Assessment 33
Exhibit 26: Missing number task—Descriptive statistics Missing Number Task
Standard 1 Standard 2 Standard 3
Mean 0.64 2.23 4.02
Standard Error 0.12 0.16 0.24
Median 0 2 4
Mode 0 0 0
Standard Deviation 1.46 1.99 2.97
Sample Variance 2.14 3.95 8.84
Skewness 3.63 0.50 0.25
Range 10 7 10
Minimum 0 0 0
Maximum 10 7 10
Count 160 160 160
Based on the mean in Exhibit 26, and the graph in Exhibit 27, demonstrates the instrument’s ability to assess the progression of this skill over grade level.
Exhibit 27: Missing number task—Distribution by grade

34 EGMA: Pilot of the Early Grade Mathematics Assessment
Recommendations
Items should progress based on the country goals for students by grade. Based on the information collected, we recommend reformatting this task with an even distribution of 10 items that progress in difficulty. The first 5 randomly sequenced items are appropriate for the first grade/class level. The second 5 randomly sequenced items are appropriate for the second grade/class level. This task should also have a stop rule that upon 3 consecutive errors, students should be stopped with the task. Exhibit 28 includes the proposed items.
Exhibit 28: Recommended numbers to use in missing number task
Item No.
Numbers Presented to Students
1. 15, 16, 17, ___
2. ___, 20, 30, 40
3. ___, 90, 91, 92
4. 100, 200, 300, ____
5. 30,35, ___, 45
6. 18, ___, 22, 24
7. 245, 250, 255, ____
8. 2, ___, 6, 8
9. 500, 400, 300, _____
10. 12, 15, ___, 21
Because the missing number task will progress in difficulty, there will be a stop rule of 3 consecutive errors. Exhibit 29 provides the stop and timing rule for this task as of November 4, 2009.
Exhibit 29: Stop and timing rules for missing number task
Tasks Practice Items? Timed Stop Rule
Task 3: Missing Number Yes No 3 consecutive errors
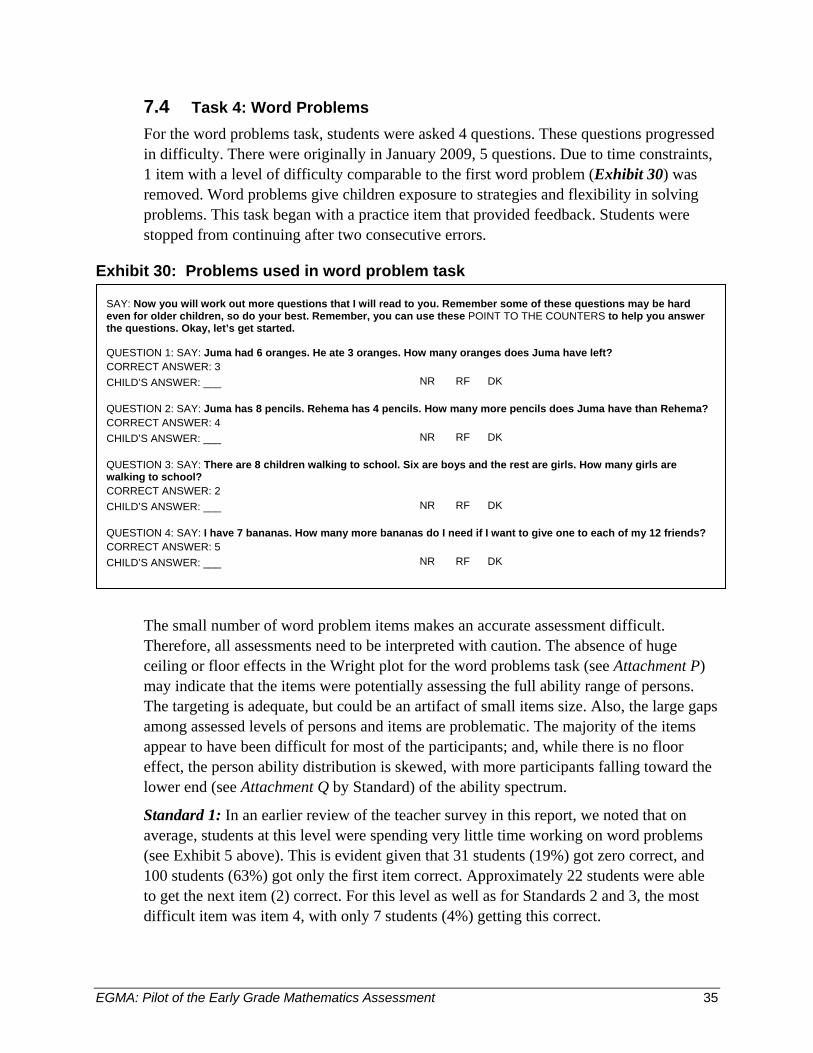
EGMA: Pilot of the Early Grade Mathematics Assessment 35
7.4 Task 4: Word Problems For the word problems task, students were asked 4 questions. These questions progressed in difficulty. There were originally in January 2009, 5 questions. Due to time constraints, 1 item with a level of difficulty comparable to the first word problem (Exhibit 30) was removed. Word problems give children exposure to strategies and flexibility in solving problems. This task began with a practice item that provided feedback. Students were stopped from continuing after two consecutive errors.
Exhibit 30: Problems used in word problem task
The small number of word problem items makes an accurate assessment difficult. Therefore, all assessments need to be interpreted with caution. The absence of huge ceiling or floor effects in the Wright plot for the word problems task (see Attachment P) may indicate that the items were potentially assessing the full ability range of persons. The targeting is adequate, but could be an artifact of small items size. Also, the large gaps among assessed levels of persons and items are problematic. The majority of the items appear to have been difficult for most of the participants; and, while there is no floor effect, the person ability distribution is skewed, with more participants falling toward the lower end (see Attachment Q by Standard) of the ability spectrum.
Standard 1: In an earlier review of the teacher survey in this report, we noted that on average, students at this level were spending very little time working on word problems (see Exhibit 5 above). This is evident given that 31 students (19%) got zero correct, and 100 students (63%) got only the first item correct. Approximately 22 students were able to get the next item (2) correct. For this level as well as for Standards 2 and 3, the most difficult item was item 4, with only 7 students (4%) getting this correct.
SAY: Now you will work out more questions that I will read to you. Remember some of these questions may be hard even for older children, so do your best. Remember, you can use these POINT TO THE COUNTERS to help you answer the questions. Okay, let’s get started. QUESTION 1: SAY: Juma had 6 oranges. He ate 3 oranges. How many oranges does Juma have left? CORRECT ANSWER: 3 CHILD’S ANSWER: ___ NR RF DK QUESTION 2: SAY: Juma has 8 pencils. Rehema has 4 pencils. How many more pencils does Juma have than Rehema? CORRECT ANSWER: 4 CHILD’S ANSWER: ___ NR RF DK QUESTION 3: SAY: There are 8 children walking to school. Six are boys and the rest are girls. How many girls are walking to school? CORRECT ANSWER: 2 CHILD’S ANSWER: ___ NR RF DK QUESTION 4: SAY: I have 7 bananas. How many more bananas do I need if I want to give one to each of my 12 friends? CORRECT ANSWER: 5 CHILD’S ANSWER: ___ NR RF DK
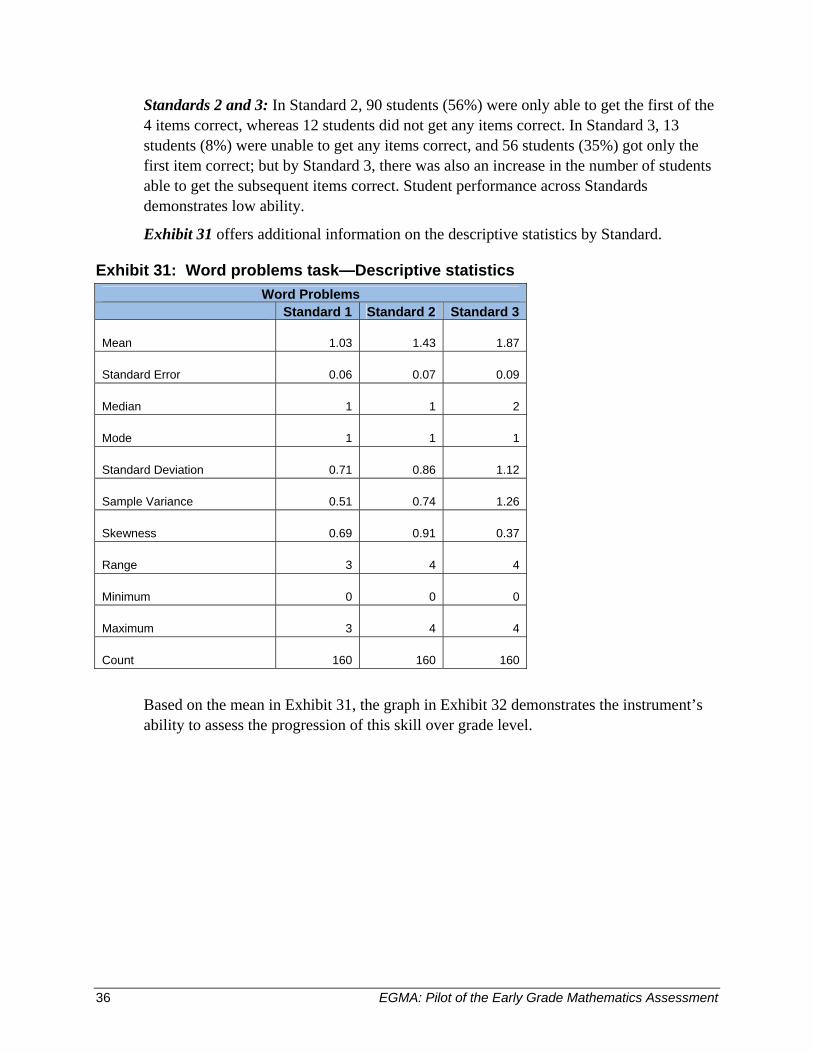
36 EGMA: Pilot of the Early Grade Mathematics Assessment
Standards 2 and 3: In Standard 2, 90 students (56%) were only able to get the first of the 4 items correct, whereas 12 students did not get any items correct. In Standard 3, 13 students (8%) were unable to get any items correct, and 56 students (35%) got only the first item correct; but by Standard 3, there was also an increase in the number of students able to get the subsequent items correct. Student performance across Standards demonstrates low ability.
Exhibit 31 offers additional information on the descriptive statistics by Standard.
Exhibit 31: Word problems task—Descriptive statistics Word Problems
Standard 1 Standard 2 Standard 3
Mean 1.03 1.43 1.87
Standard Error 0.06 0.07 0.09
Median 1 1 2
Mode 1 1 1
Standard Deviation 0.71 0.86 1.12
Sample Variance 0.51 0.74 1.26
Skewness 0.69 0.91 0.37
Range 3 4 4
Minimum 0 0 0
Maximum 3 4 4
Count 160 160 160
Based on the mean in Exhibit 31, the graph in Exhibit 32 demonstrates the instrument’s ability to assess the progression of this skill over grade level.
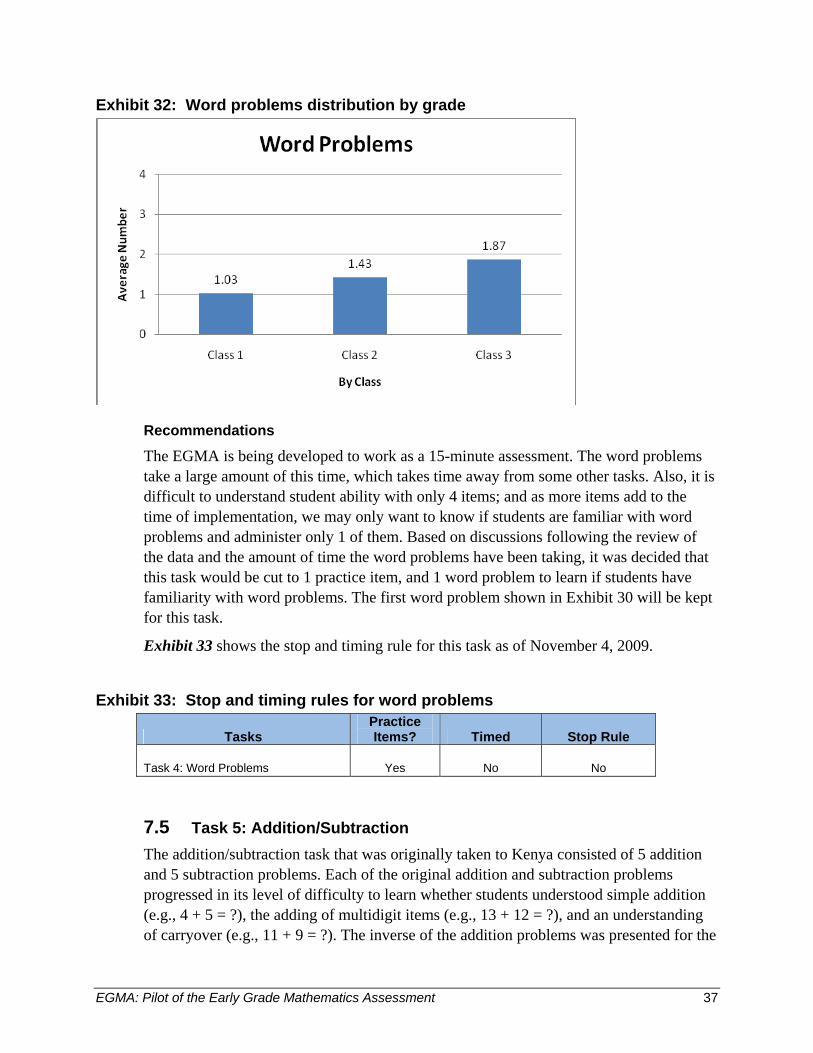
EGMA: Pilot of the Early Grade Mathematics Assessment 37
Exhibit 32: Word problems distribution by grade
Recommendations
The EGMA is being developed to work as a 15-minute assessment. The word problems take a large amount of this time, which takes time away from some other tasks. Also, it is difficult to understand student ability with only 4 items; and as more items add to the time of implementation, we may only want to know if students are familiar with word problems and administer only 1 of them. Based on discussions following the review of the data and the amount of time the word problems have been taking, it was decided that this task would be cut to 1 practice item, and 1 word problem to learn if students have familiarity with word problems. The first word problem shown in Exhibit 30 will be kept for this task.
Exhibit 33 shows the stop and timing rule for this task as of November 4, 2009.
Exhibit 33: Stop and timing rules for word problems
Tasks Practice Items? Timed Stop Rule
Task 4: Word Problems Yes No No
7.5 Task 5: Addition/Subtraction The addition/subtraction task that was originally taken to Kenya consisted of 5 addition and 5 subtraction problems. Each of the original addition and subtraction problems progressed in its level of difficulty to learn whether students understood simple addition (e.g., 4 + 5 = ?), the adding of multidigit items (e.g., 13 + 12 = ?), and an understanding of carryover (e.g., 11 + 9 = ?). The inverse of the addition problems was presented for the
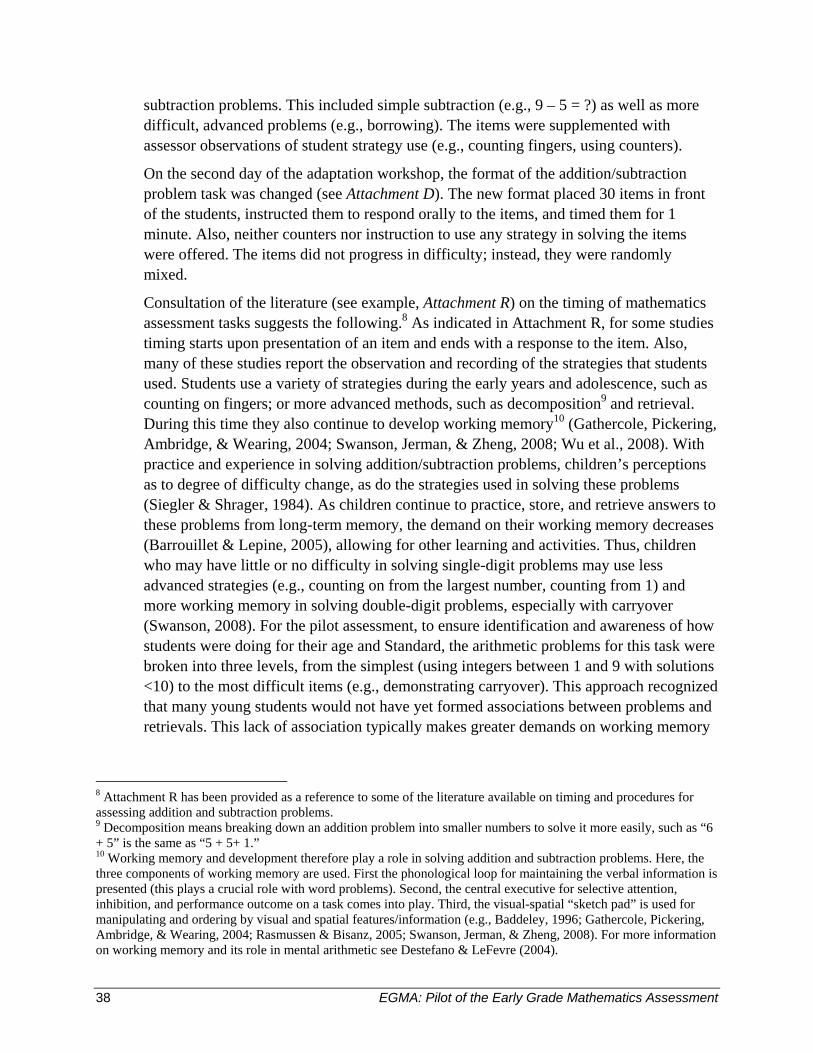
38 EGMA: Pilot of the Early Grade Mathematics Assessment
subtraction problems. This included simple subtraction (e.g., 9 – 5 = ?) as well as more difficult, advanced problems (e.g., borrowing). The items were supplemented with assessor observations of student strategy use (e.g., counting fingers, using counters).
On the second day of the adaptation workshop, the format of the addition/subtraction problem task was changed (see Attachment D). The new format placed 30 items in front of the students, instructed them to respond orally to the items, and timed them for 1 minute. Also, neither counters nor instruction to use any strategy in solving the items were offered. The items did not progress in difficulty; instead, they were randomly mixed.
Consultation of the literature (see example, Attachment R) on the timing of mathematics assessment tasks suggests the following.8 As indicated in Attachment R, for some studies timing starts upon presentation of an item and ends with a response to the item. Also, many of these studies report the observation and recording of the strategies that students used. Students use a variety of strategies during the early years and adolescence, such as counting on fingers; or more advanced methods, such as decomposition9 and retrieval. During this time they also continue to develop working memory10 (Gathercole, Pickering, Ambridge, & Wearing, 2004; Swanson, Jerman, & Zheng, 2008; Wu et al., 2008). With practice and experience in solving addition/subtraction problems, children’s perceptions as to degree of difficulty change, as do the strategies used in solving these problems (Siegler & Shrager, 1984). As children continue to practice, store, and retrieve answers to these problems from long-term memory, the demand on their working memory decreases (Barrouillet & Lepine, 2005), allowing for other learning and activities. Thus, children who may have little or no difficulty in solving single-digit problems may use less advanced strategies (e.g., counting on from the largest number, counting from 1) and more working memory in solving double-digit problems, especially with carryover (Swanson, 2008). For the pilot assessment, to ensure identification and awareness of how students were doing for their age and Standard, the arithmetic problems for this task were broken into three levels, from the simplest (using integers between 1 and 9 with solutions <10) to the most difficult items (e.g., demonstrating carryover). This approach recognized that many young students would not have yet formed associations between problems and retrievals. This lack of association typically makes greater demands on working memory
8 Attachment R has been provided as a reference to some of the literature available on timing and procedures for assessing addition and subtraction problems. 9 Decomposition means breaking down an addition problem into smaller numbers to solve it more easily, such as “6 + 5” is the same as “5 + 5+ 1.” 10 Working memory and development therefore play a role in solving addition and subtraction problems. Here, the three components of working memory are used. First the phonological loop for maintaining the verbal information is presented (this plays a crucial role with word problems). Second, the central executive for selective attention, inhibition, and performance outcome on a task comes into play. Third, the visual-spatial “sketch pad” is used for manipulating and ordering by visual and spatial features/information (e.g., Baddeley, 1996; Gathercole, Pickering, Ambridge, & Wearing, 2004; Rasmussen & Bisanz, 2005; Swanson, Jerman, & Zheng, 2008). For more information on working memory and its role in mental arithmetic see Destefano & LeFevre (2004).
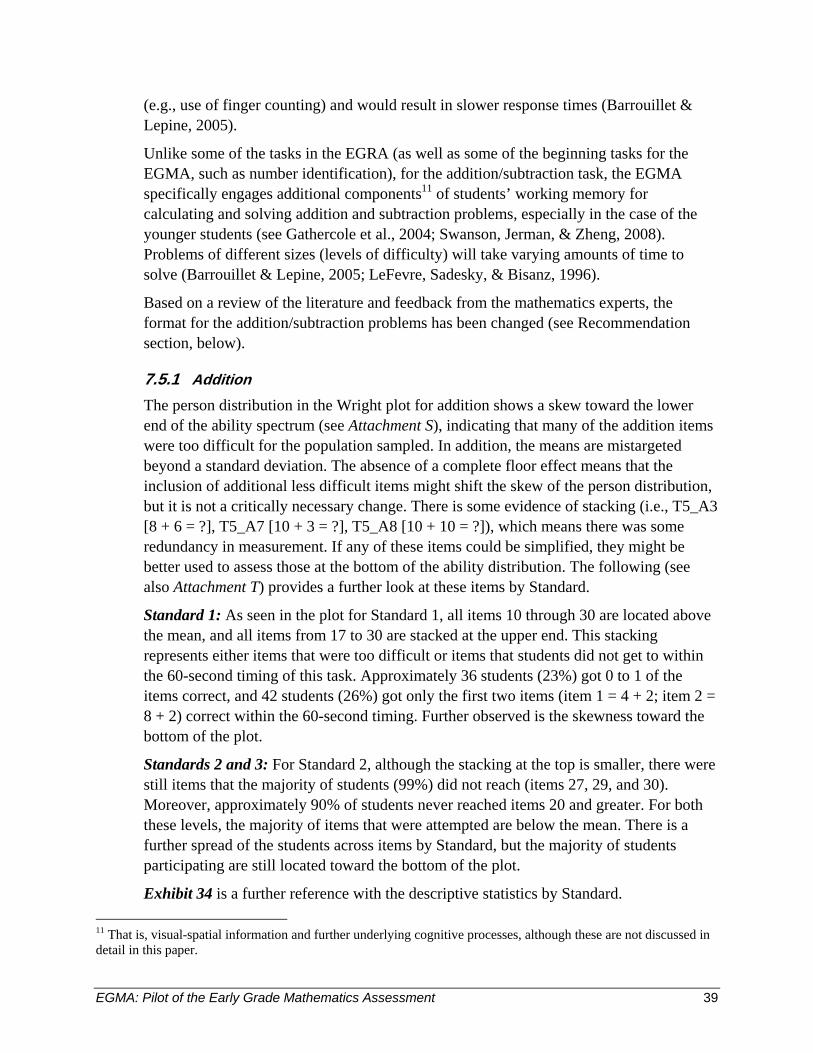
EGMA: Pilot of the Early Grade Mathematics Assessment 39
(e.g., use of finger counting) and would result in slower response times (Barrouillet & Lepine, 2005).
Unlike some of the tasks in the EGRA (as well as some of the beginning tasks for the EGMA, such as number identification), for the addition/subtraction task, the EGMA specifically engages additional components11 of students’ working memory for calculating and solving addition and subtraction problems, especially in the case of the younger students (see Gathercole et al., 2004; Swanson, Jerman, & Zheng, 2008). Problems of different sizes (levels of difficulty) will take varying amounts of time to solve (Barrouillet & Lepine, 2005; LeFevre, Sadesky, & Bisanz, 1996).
Based on a review of the literature and feedback from the mathematics experts, the format for the addition/subtraction problems has been changed (see Recommendation section, below).
7.5.1 Addition The person distribution in the Wright plot for addition shows a skew toward the lower end of the ability spectrum (see Attachment S), indicating that many of the addition items were too difficult for the population sampled. In addition, the means are mistargeted beyond a standard deviation. The absence of a complete floor effect means that the inclusion of additional less difficult items might shift the skew of the person distribution, but it is not a critically necessary change. There is some evidence of stacking (i.e., T5_A3 [8 + 6 = ?], T5_A7 [10 + 3 = ?], T5_A8 [10 + 10 = ?]), which means there was some redundancy in measurement. If any of these items could be simplified, they might be better used to assess those at the bottom of the ability distribution. The following (see also Attachment T) provides a further look at these items by Standard.
Standard 1: As seen in the plot for Standard 1, all items 10 through 30 are located above the mean, and all items from 17 to 30 are stacked at the upper end. This stacking represents either items that were too difficult or items that students did not get to within the 60-second timing of this task. Approximately 36 students (23%) got 0 to 1 of the items correct, and 42 students (26%) got only the first two items (item 1 = 4 + 2; item 2 = 8 + 2) correct within the 60-second timing. Further observed is the skewness toward the bottom of the plot.
Standards 2 and 3: For Standard 2, although the stacking at the top is smaller, there were still items that the majority of students (99%) did not reach (items 27, 29, and 30). Moreover, approximately 90% of students never reached items 20 and greater. For both these levels, the majority of items that were attempted are below the mean. There is a further spread of the students across items by Standard, but the majority of students participating are still located toward the bottom of the plot.
Exhibit 34 is a further reference with the descriptive statistics by Standard. 11 That is, visual-spatial information and further underlying cognitive processes, although these are not discussed in detail in this paper.
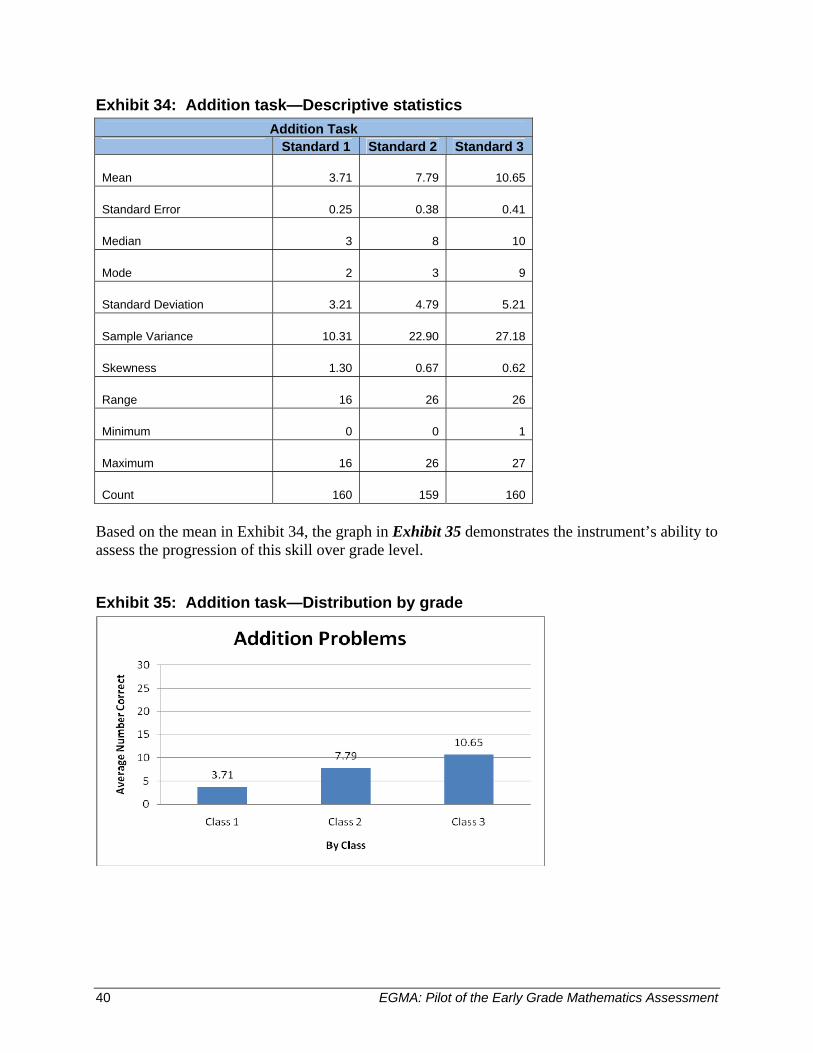
40 EGMA: Pilot of the Early Grade Mathematics Assessment
Exhibit 34: Addition task—Descriptive statistics Addition Task
Standard 1 Standard 2 Standard 3
Mean 3.71 7.79 10.65
Standard Error 0.25 0.38 0.41
Median 3 8 10
Mode 2 3 9
Standard Deviation 3.21 4.79 5.21
Sample Variance 10.31 22.90 27.18
Skewness 1.30 0.67 0.62
Range 16 26 26
Minimum 0 0 1
Maximum 16 26 27
Count 160 159 160 Based on the mean in Exhibit 34, the graph in Exhibit 35 demonstrates the instrument’s ability to assess the progression of this skill over grade level.
Exhibit 35: Addition task—Distribution by grade
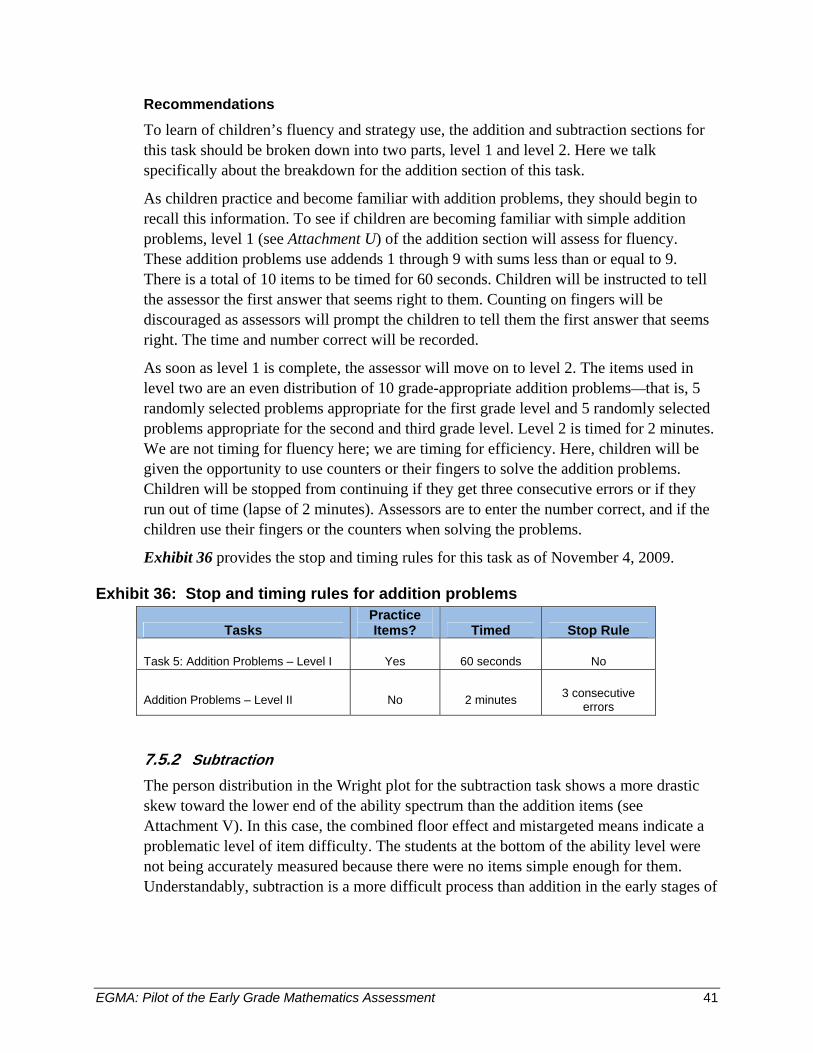
EGMA: Pilot of the Early Grade Mathematics Assessment 41
Recommendations
To learn of children’s fluency and strategy use, the addition and subtraction sections for this task should be broken down into two parts, level 1 and level 2. Here we talk specifically about the breakdown for the addition section of this task.
As children practice and become familiar with addition problems, they should begin to recall this information. To see if children are becoming familiar with simple addition problems, level 1 (see Attachment U) of the addition section will assess for fluency. These addition problems use addends 1 through 9 with sums less than or equal to 9. There is a total of 10 items to be timed for 60 seconds. Children will be instructed to tell the assessor the first answer that seems right to them. Counting on fingers will be discouraged as assessors will prompt the children to tell them the first answer that seems right. The time and number correct will be recorded.
As soon as level 1 is complete, the assessor will move on to level 2. The items used in level two are an even distribution of 10 grade-appropriate addition problems—that is, 5 randomly selected problems appropriate for the first grade level and 5 randomly selected problems appropriate for the second and third grade level. Level 2 is timed for 2 minutes. We are not timing for fluency here; we are timing for efficiency. Here, children will be given the opportunity to use counters or their fingers to solve the addition problems. Children will be stopped from continuing if they get three consecutive errors or if they run out of time (lapse of 2 minutes). Assessors are to enter the number correct, and if the children use their fingers or the counters when solving the problems.
Exhibit 36 provides the stop and timing rules for this task as of November 4, 2009.
Exhibit 36: Stop and timing rules for addition problems
Tasks Practice Items? Timed Stop Rule
Task 5: Addition Problems – Level I Yes 60 seconds No
Addition Problems – Level II No 2 minutes 3 consecutive errors
7.5.2 Subtraction The person distribution in the Wright plot for the subtraction task shows a more drastic skew toward the lower end of the ability spectrum than the addition items (see Attachment V). In this case, the combined floor effect and mistargeted means indicate a problematic level of item difficulty. The students at the bottom of the ability level were not being accurately measured because there were no items simple enough for them. Understandably, subtraction is a more difficult process than addition in the early stages of
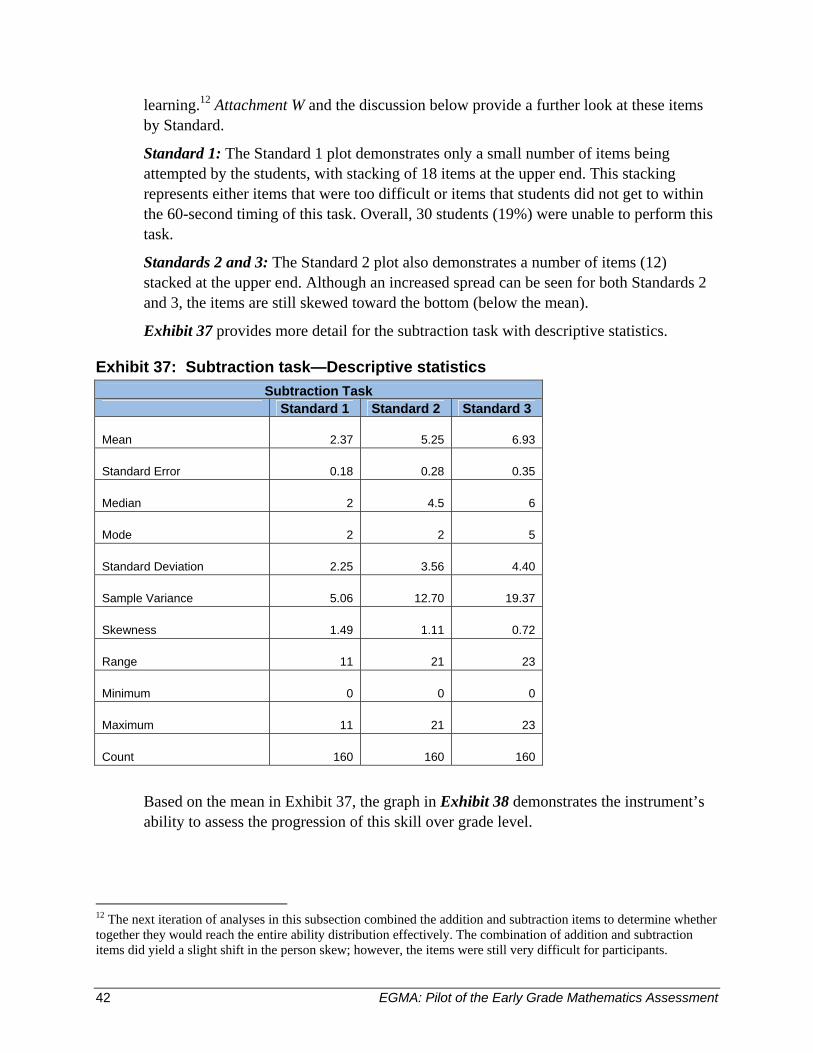
42 EGMA: Pilot of the Early Grade Mathematics Assessment
learning.12 Attachment W and the discussion below provide a further look at these items by Standard.
Standard 1: The Standard 1 plot demonstrates only a small number of items being attempted by the students, with stacking of 18 items at the upper end. This stacking represents either items that were too difficult or items that students did not get to within the 60-second timing of this task. Overall, 30 students (19%) were unable to perform this task.
Standards 2 and 3: The Standard 2 plot also demonstrates a number of items (12) stacked at the upper end. Although an increased spread can be seen for both Standards 2 and 3, the items are still skewed toward the bottom (below the mean).
Exhibit 37 provides more detail for the subtraction task with descriptive statistics.
Exhibit 37: Subtraction task—Descriptive statistics Subtraction Task
Standard 1 Standard 2 Standard 3
Mean 2.37 5.25 6.93
Standard Error 0.18 0.28 0.35
Median 2 4.5 6
Mode 2 2 5
Standard Deviation 2.25 3.56 4.40
Sample Variance 5.06 12.70 19.37
Skewness 1.49 1.11 0.72
Range 11 21 23
Minimum 0 0 0
Maximum 11 21 23
Count 160 160 160
Based on the mean in Exhibit 37, the graph in Exhibit 38 demonstrates the instrument’s ability to assess the progression of this skill over grade level.
12 The next iteration of analyses in this subsection combined the addition and subtraction items to determine whether together they would reach the entire ability distribution effectively. The combination of addition and subtraction items did yield a slight shift in the person skew; however, the items were still very difficult for participants.
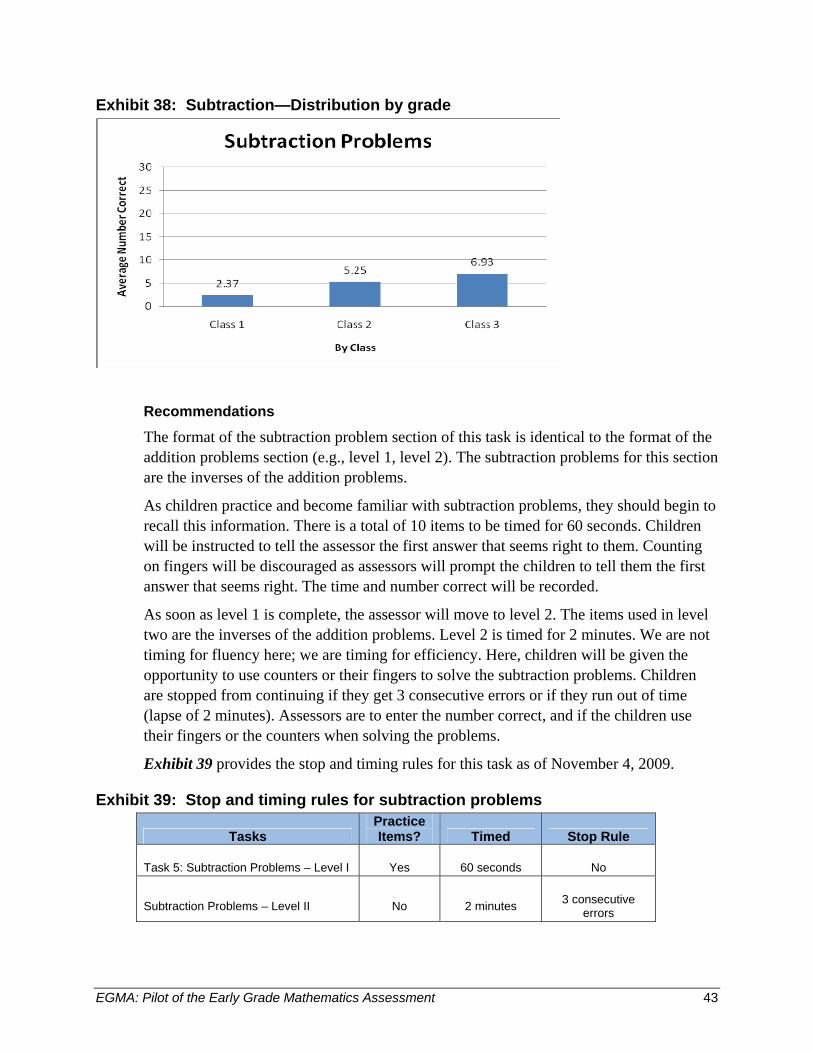
EGMA: Pilot of the Early Grade Mathematics Assessment 43
Exhibit 38: Subtraction—Distribution by grade
Recommendations
The format of the subtraction problem section of this task is identical to the format of the addition problems section (e.g., level 1, level 2). The subtraction problems for this section are the inverses of the addition problems.
As children practice and become familiar with subtraction problems, they should begin to recall this information. There is a total of 10 items to be timed for 60 seconds. Children will be instructed to tell the assessor the first answer that seems right to them. Counting on fingers will be discouraged as assessors will prompt the children to tell them the first answer that seems right. The time and number correct will be recorded.
As soon as level 1 is complete, the assessor will move to level 2. The items used in level two are the inverses of the addition problems. Level 2 is timed for 2 minutes. We are not timing for fluency here; we are timing for efficiency. Here, children will be given the opportunity to use counters or their fingers to solve the subtraction problems. Children are stopped from continuing if they get 3 consecutive errors or if they run out of time (lapse of 2 minutes). Assessors are to enter the number correct, and if the children use their fingers or the counters when solving the problems.
Exhibit 39 provides the stop and timing rules for this task as of November 4, 2009.
Exhibit 39: Stop and timing rules for subtraction problems
Tasks Practice Items? Timed Stop Rule
Task 5: Subtraction Problems – Level I Yes 60 seconds No
Subtraction Problems – Level II No 2 minutes 3 consecutive errors
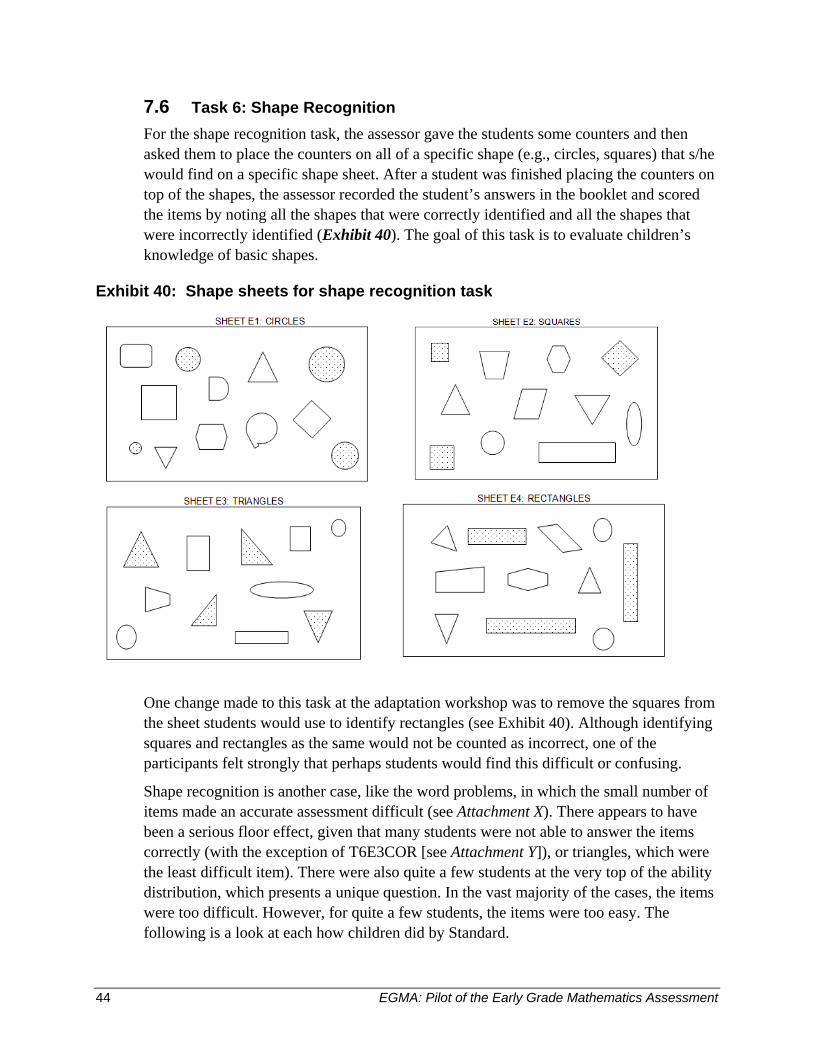
44 EGMA: Pilot of the Early Grade Mathematics Assessment
7.6 Task 6: Shape Recognition For the shape recognition task, the assessor gave the students some counters and then asked them to place the counters on all of a specific shape (e.g., circles, squares) that s/he would find on a specific shape sheet. After a student was finished placing the counters on top of the shapes, the assessor recorded the student’s answers in the booklet and scored the items by noting all the shapes that were correctly identified and all the shapes that were incorrectly identified (Exhibit 40). The goal of this task is to evaluate children’s knowledge of basic shapes.
Exhibit 40: Shape sheets for shape recognition task
One change made to this task at the adaptation workshop was to remove the squares from the sheet students would use to identify rectangles (see Exhibit 40). Although identifying squares and rectangles as the same would not be counted as incorrect, one of the participants felt strongly that perhaps students would find this difficult or confusing.
Shape recognition is another case, like the word problems, in which the small number of items made an accurate assessment difficult (see Attachment X). There appears to have been a serious floor effect, given that many students were not able to answer the items correctly (with the exception of T6E3COR [see Attachment Y]), or triangles, which were the least difficult item). There were also quite a few students at the very top of the ability distribution, which presents a unique question. In the vast majority of the cases, the items were too difficult. However, for quite a few students, the items were too easy. The following is a look at each how children did by Standard.
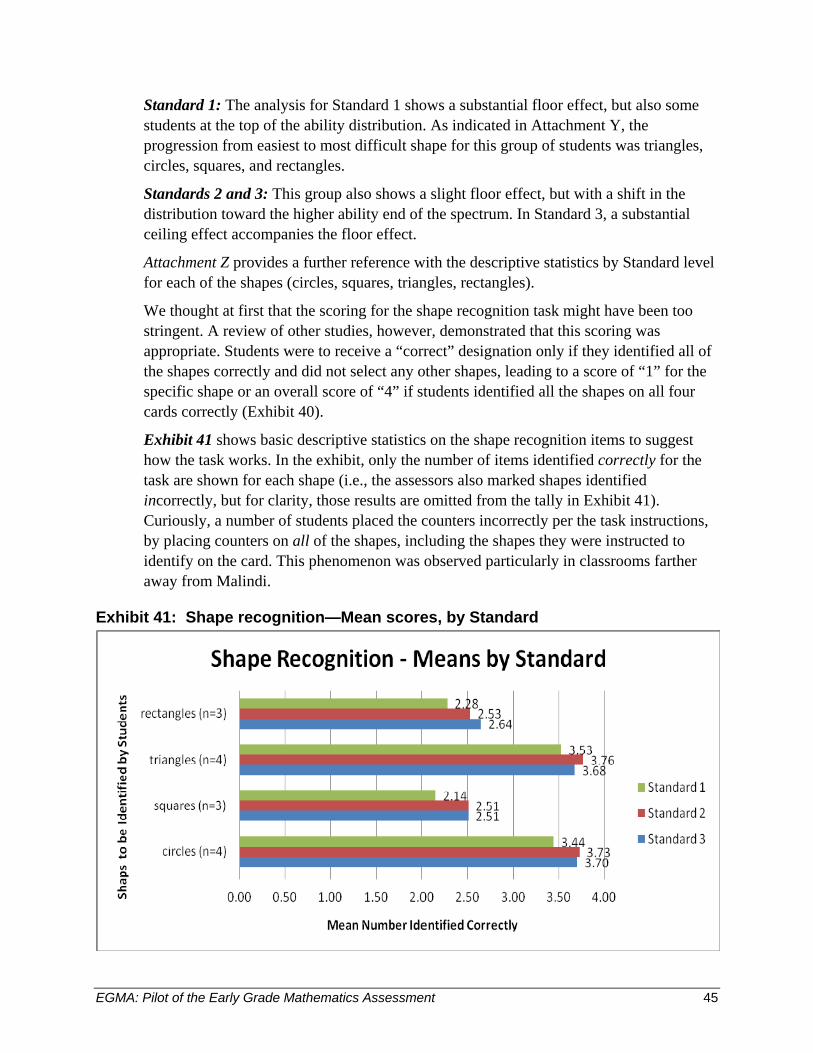
EGMA: Pilot of the Early Grade Mathematics Assessment 45
Standard 1: The analysis for Standard 1 shows a substantial floor effect, but also some students at the top of the ability distribution. As indicated in Attachment Y, the progression from easiest to most difficult shape for this group of students was triangles, circles, squares, and rectangles.
Standards 2 and 3: This group also shows a slight floor effect, but with a shift in the distribution toward the higher ability end of the spectrum. In Standard 3, a substantial ceiling effect accompanies the floor effect.
Attachment Z provides a further reference with the descriptive statistics by Standard level for each of the shapes (circles, squares, triangles, rectangles).
We thought at first that the scoring for the shape recognition task might have been too stringent. A review of other studies, however, demonstrated that this scoring was appropriate. Students were to receive a “correct” designation only if they identified all of the shapes correctly and did not select any other shapes, leading to a score of “1” for the specific shape or an overall score of “4” if students identified all the shapes on all four cards correctly (Exhibit 40).
Exhibit 41 shows basic descriptive statistics on the shape recognition items to suggest how the task works. In the exhibit, only the number of items identified correctly for the task are shown for each shape (i.e., the assessors also marked shapes identified incorrectly, but for clarity, those results are omitted from the tally in Exhibit 41). Curiously, a number of students placed the counters incorrectly per the task instructions, by placing counters on all of the shapes, including the shapes they were instructed to identify on the card. This phenomenon was observed particularly in classrooms farther away from Malindi.
Exhibit 41: Shape recognition—Mean scores, by Standard
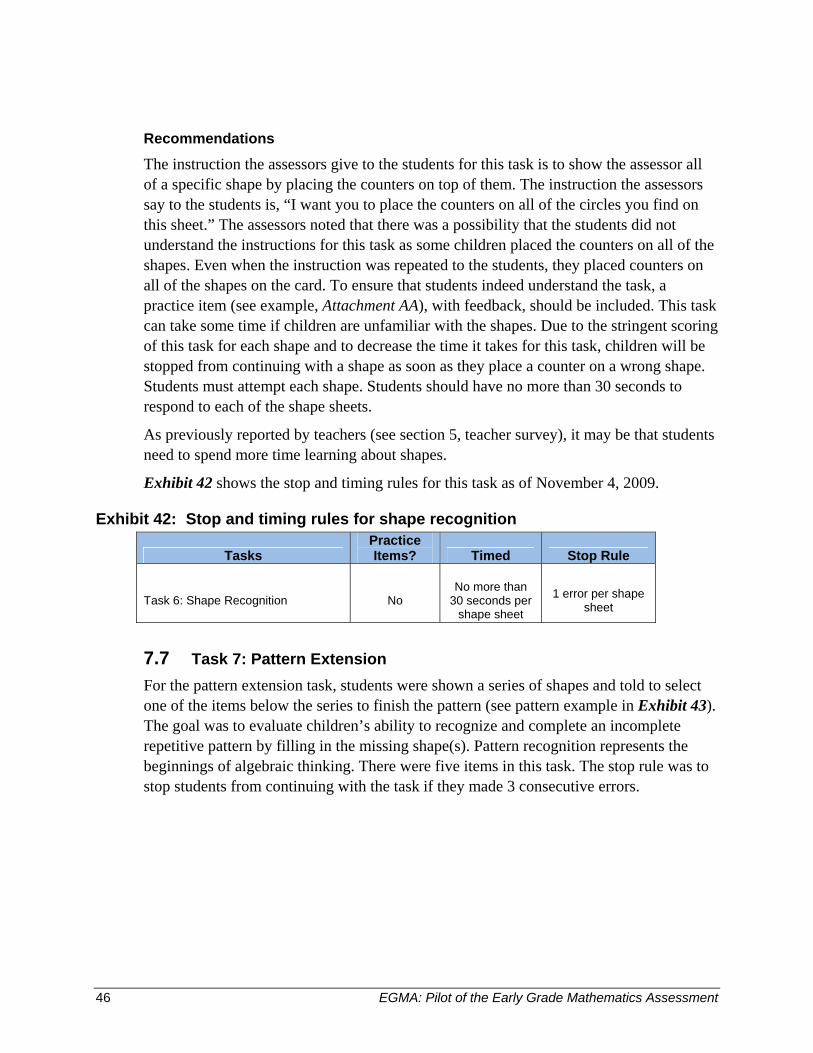
46 EGMA: Pilot of the Early Grade Mathematics Assessment
Recommendations
The instruction the assessors give to the students for this task is to show the assessor all of a specific shape by placing the counters on top of them. The instruction the assessors say to the students is, “I want you to place the counters on all of the circles you find on this sheet.” The assessors noted that there was a possibility that the students did not understand the instructions for this task as some children placed the counters on all of the shapes. Even when the instruction was repeated to the students, they placed counters on all of the shapes on the card. To ensure that students indeed understand the task, a practice item (see example, Attachment AA), with feedback, should be included. This task can take some time if children are unfamiliar with the shapes. Due to the stringent scoring of this task for each shape and to decrease the time it takes for this task, children will be stopped from continuing with a shape as soon as they place a counter on a wrong shape. Students must attempt each shape. Students should have no more than 30 seconds to respond to each of the shape sheets.
As previously reported by teachers (see section 5, teacher survey), it may be that students need to spend more time learning about shapes.
Exhibit 42 shows the stop and timing rules for this task as of November 4, 2009.
Exhibit 42: Stop and timing rules for shape recognition
Tasks Practice Items? Timed Stop Rule
Task 6: Shape Recognition No No more than
30 seconds per shape sheet
1 error per shape sheet
7.7 Task 7: Pattern Extension For the pattern extension task, students were shown a series of shapes and told to select one of the items below the series to finish the pattern (see pattern example in Exhibit 43). The goal was to evaluate children’s ability to recognize and complete an incomplete repetitive pattern by filling in the missing shape(s). Pattern recognition represents the beginnings of algebraic thinking. There were five items in this task. The stop rule was to stop students from continuing with the task if they made 3 consecutive errors.
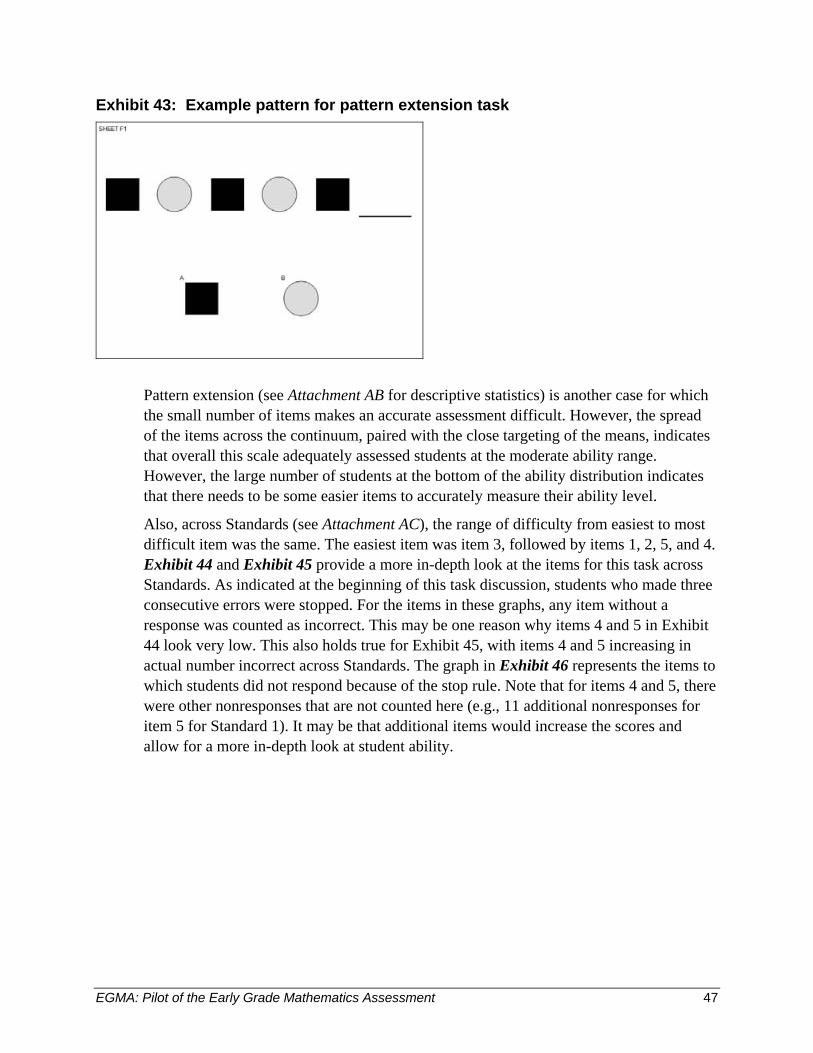
EGMA: Pilot of the Early Grade Mathematics Assessment 47
Exhibit 43: Example pattern for pattern extension task
Pattern extension (see Attachment AB for descriptive statistics) is another case for which the small number of items makes an accurate assessment difficult. However, the spread of the items across the continuum, paired with the close targeting of the means, indicates that overall this scale adequately assessed students at the moderate ability range. However, the large number of students at the bottom of the ability distribution indicates that there needs to be some easier items to accurately measure their ability level.
Also, across Standards (see Attachment AC), the range of difficulty from easiest to most difficult item was the same. The easiest item was item 3, followed by items 1, 2, 5, and 4. Exhibit 44 and Exhibit 45 provide a more in-depth look at the items for this task across Standards. As indicated at the beginning of this task discussion, students who made three consecutive errors were stopped. For the items in these graphs, any item without a response was counted as incorrect. This may be one reason why items 4 and 5 in Exhibit 44 look very low. This also holds true for Exhibit 45, with items 4 and 5 increasing in actual number incorrect across Standards. The graph in Exhibit 46 represents the items to which students did not respond because of the stop rule. Note that for items 4 and 5, there were other nonresponses that are not counted here (e.g., 11 additional nonresponses for item 5 for Standard 1). It may be that additional items would increase the scores and allow for a more in-depth look at student ability.
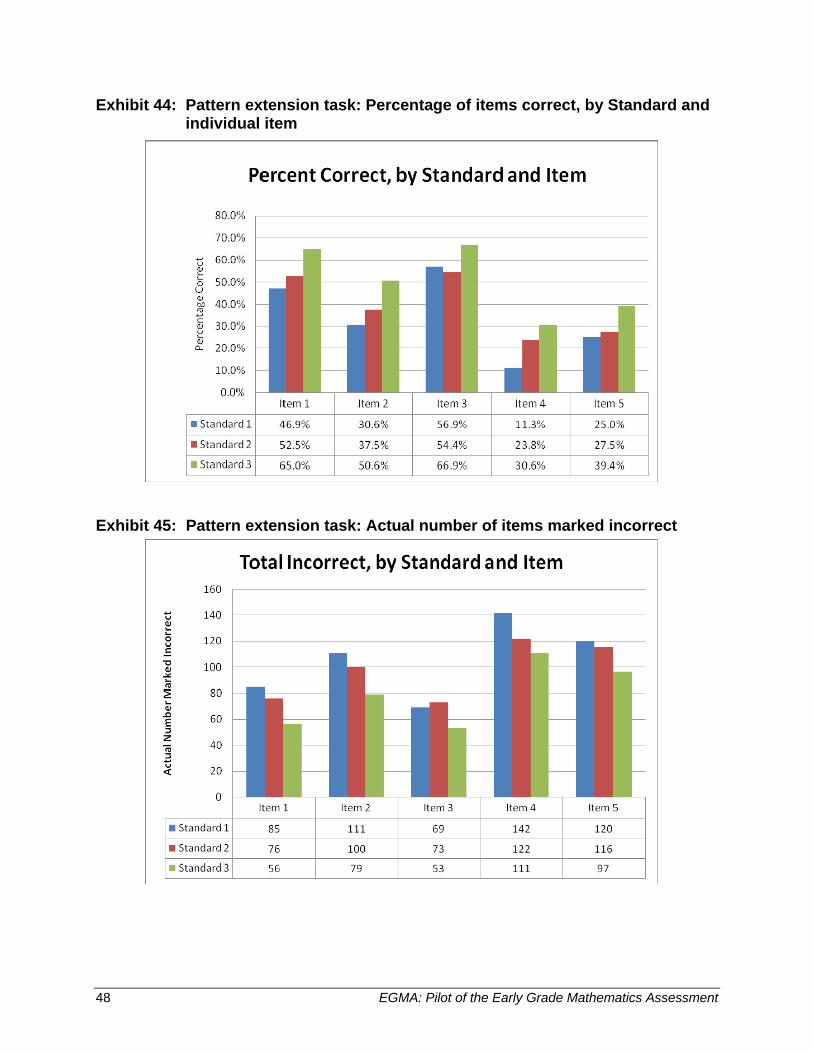
48 EGMA: Pilot of the Early Grade Mathematics Assessment
Exhibit 44: Pattern extension task: Percentage of items correct, by Standard and individual item
Exhibit 45: Pattern extension task: Actual number of items marked incorrect
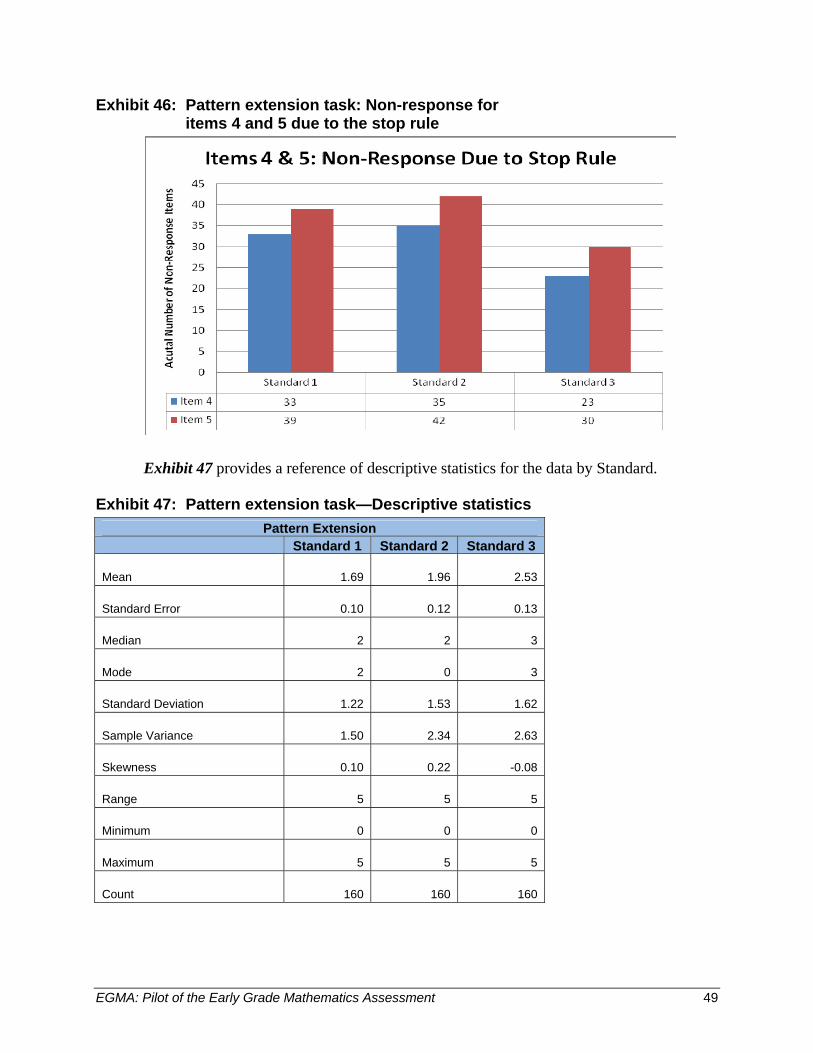
EGMA: Pilot of the Early Grade Mathematics Assessment 49
Exhibit 46: Pattern extension task: Non-response for items 4 and 5 due to the stop rule
Exhibit 47 provides a reference of descriptive statistics for the data by Standard.
Exhibit 47: Pattern extension task—Descriptive statistics Pattern Extension
Standard 1 Standard 2 Standard 3
Mean 1.69 1.96 2.53
Standard Error 0.10 0.12 0.13
Median 2 2 3
Mode 2 0 3
Standard Deviation 1.22 1.53 1.62
Sample Variance 1.50 2.34 2.63
Skewness 0.10 0.22 -0.08
Range 5 5 5
Minimum 0 0 0
Maximum 5 5 5
Count 160 160 160
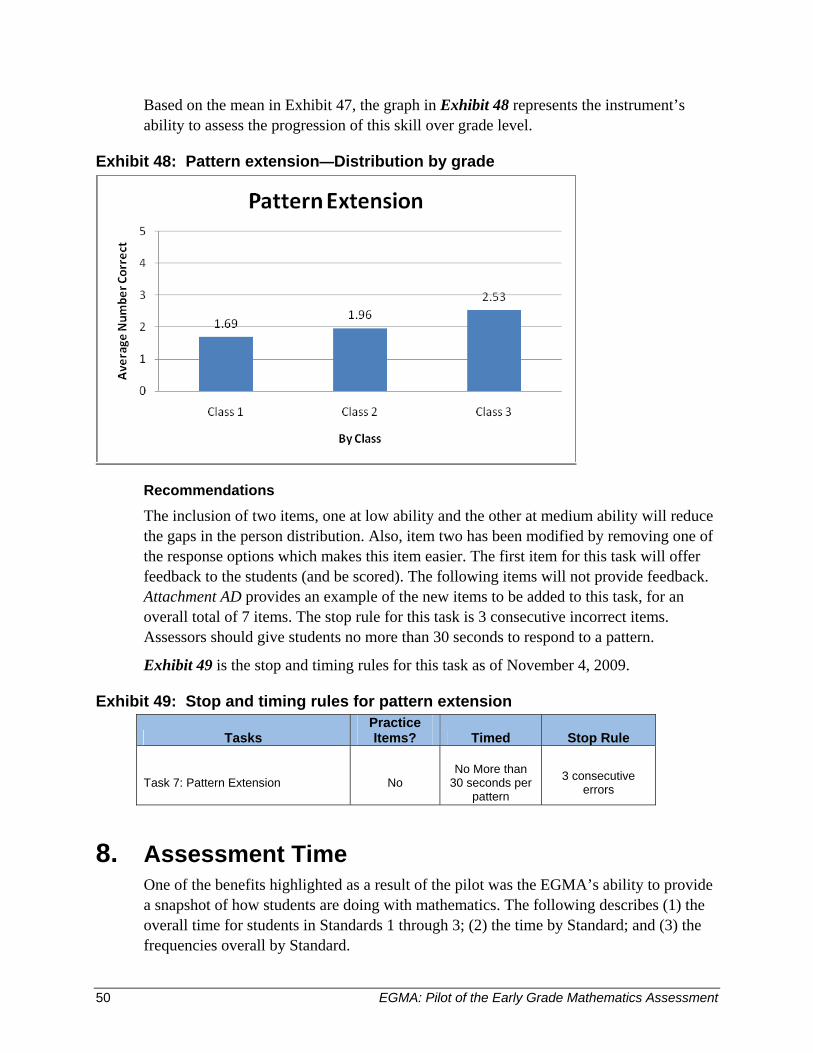
50 EGMA: Pilot of the Early Grade Mathematics Assessment
Based on the mean in Exhibit 47, the graph in Exhibit 48 represents the instrument’s ability to assess the progression of this skill over grade level.
Exhibit 48: Pattern extension—Distribution by grade
Recommendations
The inclusion of two items, one at low ability and the other at medium ability will reduce the gaps in the person distribution. Also, item two has been modified by removing one of the response options which makes this item easier. The first item for this task will offer feedback to the students (and be scored). The following items will not provide feedback. Attachment AD provides an example of the new items to be added to this task, for an overall total of 7 items. The stop rule for this task is 3 consecutive incorrect items. Assessors should give students no more than 30 seconds to respond to a pattern.
Exhibit 49 is the stop and timing rules for this task as of November 4, 2009.
Exhibit 49: Stop and timing rules for pattern extension
Tasks Practice Items? Timed Stop Rule
Task 7: Pattern Extension No No More than
30 seconds per pattern
3 consecutive errors
8. Assessment Time One of the benefits highlighted as a result of the pilot was the EGMA’s ability to provide a snapshot of how students are doing with mathematics. The following describes (1) the overall time for students in Standards 1 through 3; (2) the time by Standard; and (3) the frequencies overall by Standard.
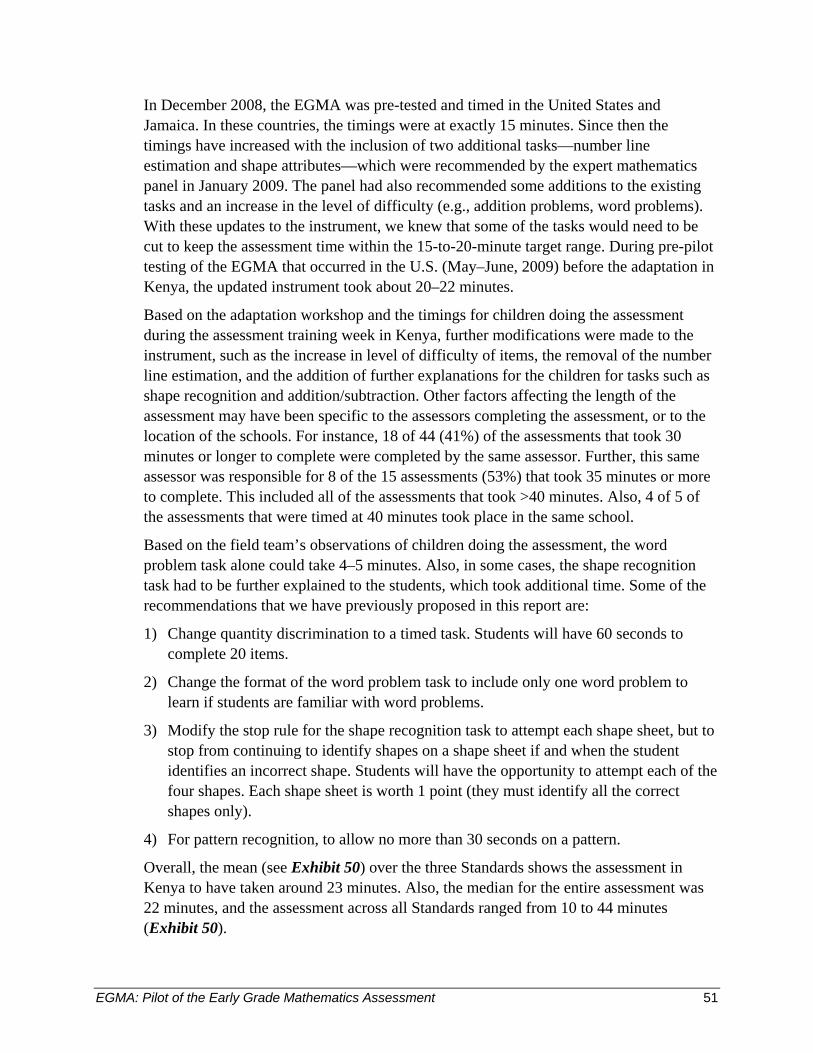
EGMA: Pilot of the Early Grade Mathematics Assessment 51
In December 2008, the EGMA was pre-tested and timed in the United States and Jamaica. In these countries, the timings were at exactly 15 minutes. Since then the timings have increased with the inclusion of two additional tasks—number line estimation and shape attributes—which were recommended by the expert mathematics panel in January 2009. The panel had also recommended some additions to the existing tasks and an increase in the level of difficulty (e.g., addition problems, word problems). With these updates to the instrument, we knew that some of the tasks would need to be cut to keep the assessment time within the 15-to-20-minute target range. During pre-pilot testing of the EGMA that occurred in the U.S. (May–June, 2009) before the adaptation in Kenya, the updated instrument took about 20–22 minutes.
Based on the adaptation workshop and the timings for children doing the assessment during the assessment training week in Kenya, further modifications were made to the instrument, such as the increase in level of difficulty of items, the removal of the number line estimation, and the addition of further explanations for the children for tasks such as shape recognition and addition/subtraction. Other factors affecting the length of the assessment may have been specific to the assessors completing the assessment, or to the location of the schools. For instance, 18 of 44 (41%) of the assessments that took 30 minutes or longer to complete were completed by the same assessor. Further, this same assessor was responsible for 8 of the 15 assessments (53%) that took 35 minutes or more to complete. This included all of the assessments that took >40 minutes. Also, 4 of 5 of the assessments that were timed at 40 minutes took place in the same school.
Based on the field team’s observations of children doing the assessment, the word problem task alone could take 4–5 minutes. Also, in some cases, the shape recognition task had to be further explained to the students, which took additional time. Some of the recommendations that we have previously proposed in this report are:
1) Change quantity discrimination to a timed task. Students will have 60 seconds to complete 20 items.
2) Change the format of the word problem task to include only one word problem to learn if students are familiar with word problems.
3) Modify the stop rule for the shape recognition task to attempt each shape sheet, but to stop from continuing to identify shapes on a shape sheet if and when the student identifies an incorrect shape. Students will have the opportunity to attempt each of the four shapes. Each shape sheet is worth 1 point (they must identify all the correct shapes only).
4) For pattern recognition, to allow no more than 30 seconds on a pattern.
Overall, the mean (see Exhibit 50) over the three Standards shows the assessment in Kenya to have taken around 23 minutes. Also, the median for the entire assessment was 22 minutes, and the assessment across all Standards ranged from 10 to 44 minutes (Exhibit 50).
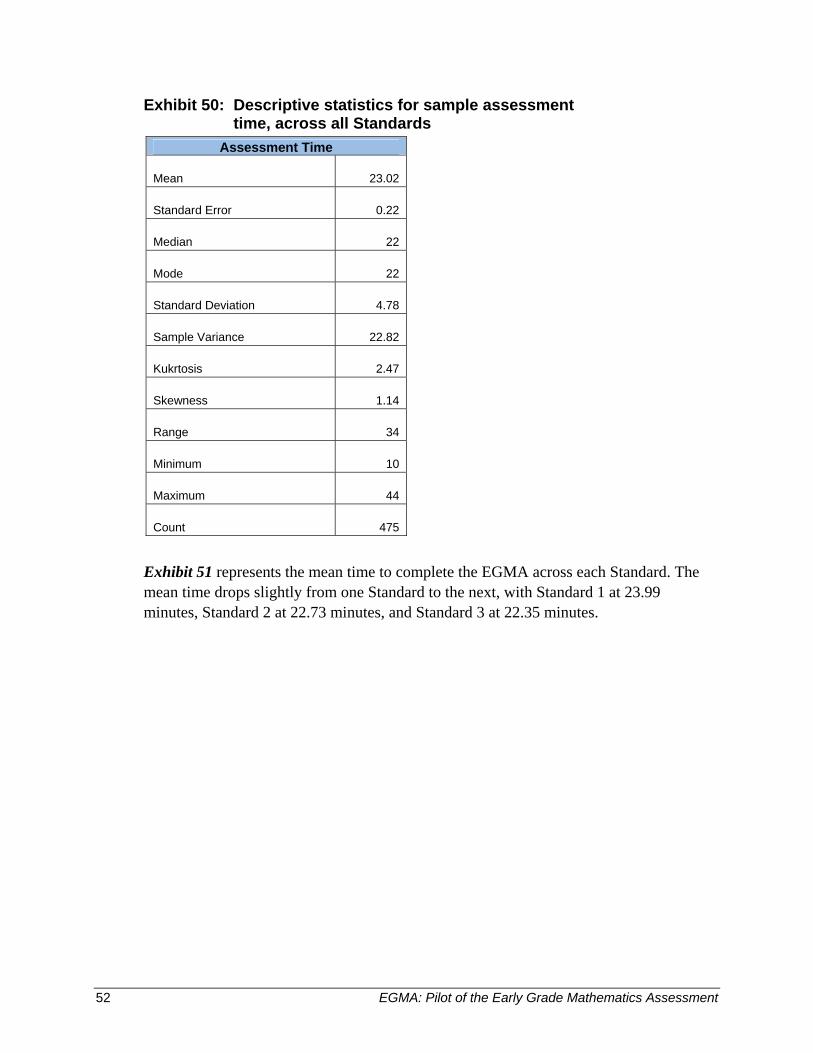
52 EGMA: Pilot of the Early Grade Mathematics Assessment
Exhibit 50: Descriptive statistics for sample assessment time, across all Standards
Assessment Time
Mean 23.02
Standard Error 0.22
Median 22
Mode 22
Standard Deviation 4.78
Sample Variance 22.82
Kukrtosis 2.47
Skewness 1.14
Range 34
Minimum 10
Maximum 44
Count 475
Exhibit 51 represents the mean time to complete the EGMA across each Standard. The mean time drops slightly from one Standard to the next, with Standard 1 at 23.99 minutes, Standard 2 at 22.73 minutes, and Standard 3 at 22.35 minutes.
EGMA: Pilot of the Early Grade Mathematics Assessment 53
Exhibit 51: Time to complete the EGMA, by Standard
9. SUMMARY Overall, the EGMA instrument is performing as intended. It reveals how students are doing in mathematics for the first through third grades/standards. The modifications proposed to the tasks that make up the EGMA make it a more efficient and time-sensitive tool that will provide a more accurate assessment across classrooms and schools. Some key observations that will only strengthen this tool and discussed in this report are summarized below.
Data analysis results. We found strong correlations between several of the number/operation tasks, with a nice progression over the Standards. Within tasks—especially for number identification and quantity discrimination—the Wright plot analysis shows a good spread of the items. We also see a nice progression taking place across grades.
Assessment time. Time was an issue, as assessment with this instrument should take around 15 minutes. In our review of the tasks, we proposed modifications that should decrease the time tasks (e.g., quantity discrimination, word problems) take. One method to reduce the time would be to train the assessors to be more efficient in moving from one task to the next. Another method would be to pretest the instrument with the recommended new timings and stop rules, and to eliminate the items that demonstrate the most stacking; we can be reasonably certain that deleting them would not prevent the measure from accurately reporting ability.
Number line estimation. This task was removed at the suggestion of the Kenyan experts after the assessor practice that took place in two schools during the assessor training

54 EGMA: Pilot of the Early Grade Mathematics Assessment
(week of June 29–July 3, 2009) which followed the adaptation workshop. While piloting the EGMA, we learned that this task was taking too long. Students did not understand what assessors were asking them to do. Assessors were spending at least 5 minutes trying to teach the children the task. As a result, it was obvious that the principle of the number line is unfamiliar to students in these early years in Kenya. Knowledge of the number line is an important predictor of success in mathematics—it can play a role in how well students learn and efficiently carry out tasks such as addition and subtraction (Siegler & Ramani, 2009). Assessment of number line estimation can also demonstrate to system authorities how far along students are in developing number line skills (Booth & Siegler, 2008). One is faced with a dilemma: Including this task would make the overall assessment take even longer. Yet, based on the literature, as we have seen, it is an important type of knowledge. One possibility would be to include it in the assessment of a subset of the children. Taking a non-parametric approach, one could conclude even with a small sample that if, none of the children can do a task without coaching from the assessor, this is strong evidence that there is no instruction in the number line.
EGMA: Pilot of the Early Grade Mathematics Assessment 55
REFERENCES Baddeley, A. (1996). Exploring the central executive. Quarterly Journal of Experimental
Psychology, 49a(1), 5–28.
Baker, D. P., & LeTendre, G. K. (2005). National differences, global similarities: World culture and the future of schooling. Stanford, California: Stanford University Press.
Baroody, A. (1999). Children’s relational knowledge of addition and subtraction. Cognition and Instruction, 17, 137–175.
Barrouillet, P., & Lepine, R. (2005). Working memory and children’s use of retrieval to solve addition problems. Journal of Experimental Child Psychology, 91, 183–204.
Bond, T. G., & Fox, C. M. (2001). Applying the Rasch model: Fundamental measurement in the human sciences. Mahwah, New Jersey: Lawrence Erlbaum Associates.
Cai, J. (2005). U.S. and Chinese teachers’ constructing, knowing, and evaluating representations to teach mathematics. Mathematical Thinking and Learning, 7(2), 135–169.
DeStefano, D., & LeFevre, J. (2004). The role of working memory in mental arithmetic. European Journal of Cognitive Psychology, 16(3), 353–386.
Fennell, F. S., Faulkner, L. R., Ma, L. Schmid, W., Stotsky, S., Wu, H., & Flawn, T. (2008). Chapter 3: Report of the Task Group on Conceptual Knowledge and Skills. In U.S. Department of Education, Foundations for success: The final report of the National Mathematics Advisory Panel. Retrieved September 29, 2009, from http://www.ed.gov/about/bdscomm/list/mathpanel/reports.html
Fuchs, L. S., Fuchs, D., Eaton, S. B., Hamlett, C. L., & Karns, K. M. (2000). Supplementing teacher judgments of mathematics test accommodations with objective data sources. School Psychology Review, 29(1), 65–85.
Garden, R. A., Lie, S., Robitaille, D. F., Angell, C., Martin, M. O., Mullis, I. V. S., et al. (2006). TIMSS advanced 2008 assessment frameworks. Retrieved October 6, 2008, from http://timss.bc.edu/PDF/TIMSS_Advanced_AF.pdf
Gathercole, S. E., Pickering, S. J., Ambridge, B., & Wearing, H. (2004). The structure of working memory from 4 to 15 years of age. Developmental Psychology, 40(2), 177–190.
Geary, D. C., Brown, S. C., & Samaranayake, V. A. (1991). Cognitive addition: A short longitudinal study of strategy choice and speed-of-processing differences in normal and mathematically disabled children. Developmental Psychology, 27(5), 787–797.
Hoard, M. K., Geary, D. C., Byrd-Craven, J., & Nugent, L. (2008). Mathematical cognition in intellectually precocious first grades. Developmental Neuropsychology, 33(3), 251–276.
56 EGMA: Pilot of the Early Grade Mathematics Assessment
Houlihan, D. M., & Ginsburg, H. P. (1981). The addition methods of first- and second-grade children. Journal for Research in Mathematics Education, 12(2), 95–106.
Jomo Kenyatta Foundation (2003a). New edition: Primary mathematics 1. Nairobi, Kenya: Author.
Jomo Kenyatta Foundation (2003b). New edition: Primary mathematics 2. Nairobi, Kenya: Author.
Jomo Kenyatta Foundation (2004). New edition: Primary mathematics 3. Nairobi, Kenya: Author.
Kenya Institute of Education (KIE). (2002). Republic of Kenya, Ministry of Education: Primary education syllabus. Nairobi: Author.
KIE. (2008). Republic of Kenya, Ministry of Education: Handbook for early childhood development education syllabus. Nairobi: Author.
LeFevre, J., Sadesky, G. S., & Bisanz, J. (1996). Selection of procedures in mental addition: Reassessing the problem size effect in adults. Journal of Experimental Psychology: Learning, Memory, & Cognition, 22(1), 216–230.
Ma, L. (1999). Knowing and teaching elementary mathematics: Teachers’ understanding of fundamental mathematics in China and the United States. Mahwah, New Jersey: Lawrence Erlbaum Associates.
Mullis, I. V. S., Martin, M. O., & Foy, P. (2008). TIMSS 2007 international mathematics report: Findings from IEA’s Trends in International Mathematics and Science Study at the fourth and eighth grades. Chestnut Hill, Massachusetts: Trends in International Mathematics and Science Study (TIMSS) and Progress in International Reading Literacy Study (PIRLS), International Study Center, Lynch School of Education, Boston College. Retrieved September 29, 2009, from http://timss.bc.edu/timss2007/mathreport.html
Nunnally, J. C., & Bernstein, I. H. (1994). Psychometric theory. New York: McGraw-Hill.
Rasmussen, C., & Bisanz, J. (2005). Representation and working memory in early arithmetic. Journal of Experimental Child Psychology, 91, 137–157.
Siegler, R. S. (2003). Implications of cognitive science research for mathematics education. In J. Kilpatrick, W. G. Martin, & D. Schifter (Eds.), A research companion to principles and standards for school mathematics (pp. 289–303). Reston, Virginia: The National Council of Teachers of Mathematics.
Siegler, R. S., & Ramani, G. B. (2009). Playing linear number board games—but not circular ones—improves low-income preschoolers’ numerical understanding. Journal of Educational Psychology, 101(3), 545–560.
EGMA: Pilot of the Early Grade Mathematics Assessment 57
Siegler, R. S., & Robinson, M. (1982). The development of numerical understandings. In H. W. Reese & L. P. Lipsitt (Eds.), Advances in child development and behavior: Vol. 16 (pp. 242–312). New York: Academic Press.
Siegler, R. S., & Shrager, J. (1984). Strategy choice in additional and subtraction: How do children know what to do? In C. Sophian (Ed.), Origins of cognitive skills (pp. 229–293). Mahwah, New Jersey: Lawrence Erlbaum Associates.
Siegler, R. S., & Stern, E. (1998). Conscious and unconscious strategy discoveries: A microgenetic analysis. Journal of Experimental Psychology: General, 127, 377–397.
Swanson, J. L. (2008). Working memory and intelligence in children: What develops? Journal of Educational Psychology, 100(3), 581-602.
Swanson, H.L., Jerman, O., & Zheng, X. (2008). Growth in working memory and mathematical problem solving in children at risk and not at risk for serious math difficulties. Journal of Educational Psychology, 100(2), 343–379.
U.S. Department of Education (2008). Foundations for success: The final report of the National Mathematics Advisory Panel. Retrieved May 6, 2009, from http://www.ed.gov/about/bdscomm/list/mathpanel/report/final-report.pdf
Wu, S. S., Meyer, M. L., Maeda, U., Salimpoor, V., Tomiyama, S., Geary, D. C., & Menon, V. (2008). Standardized assessment of strategy use and working memory in early mental arithmetic performance. Developmental Neuropsychology, 33(3), 365–393.
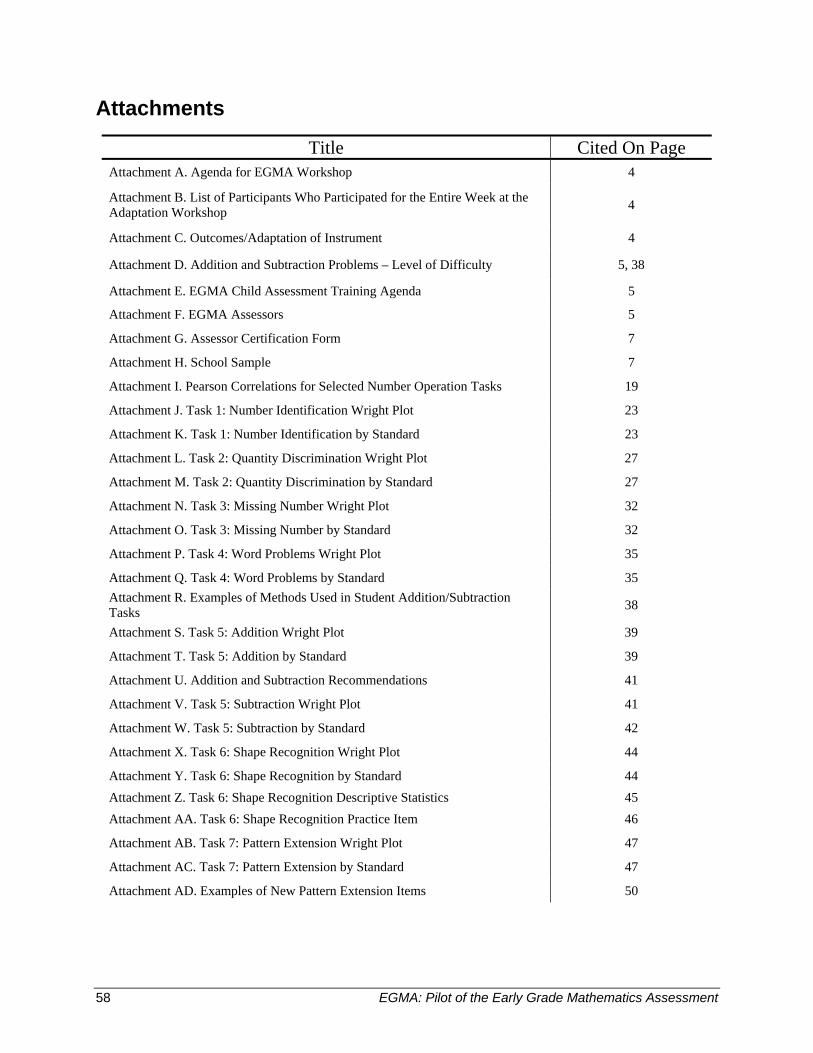
58 EGMA: Pilot of the Early Grade Mathematics Assessment
Attachments
Title Cited On Page Attachment A. Agenda for EGMA Workshop 4
Attachment B. List of Participants Who Participated for the Entire Week at the Adaptation Workshop 4
Attachment C. Outcomes/Adaptation of Instrument 4
Attachment D. Addition and Subtraction Problems – Level of Difficulty 5, 38
Attachment E. EGMA Child Assessment Training Agenda 5
Attachment F. EGMA Assessors 5
Attachment G. Assessor Certification Form 7
Attachment H. School Sample 7
Attachment I. Pearson Correlations for Selected Number Operation Tasks 19
Attachment J. Task 1: Number Identification Wright Plot 23
Attachment K. Task 1: Number Identification by Standard 23
Attachment L. Task 2: Quantity Discrimination Wright Plot 27
Attachment M. Task 2: Quantity Discrimination by Standard 27
Attachment N. Task 3: Missing Number Wright Plot 32
Attachment O. Task 3: Missing Number by Standard 32
Attachment P. Task 4: Word Problems Wright Plot 35
Attachment Q. Task 4: Word Problems by Standard 35 Attachment R. Examples of Methods Used in Student Addition/Subtraction Tasks 38
Attachment S. Task 5: Addition Wright Plot 39
Attachment T. Task 5: Addition by Standard 39
Attachment U. Addition and Subtraction Recommendations 41
Attachment V. Task 5: Subtraction Wright Plot 41
Attachment W. Task 5: Subtraction by Standard 42
Attachment X. Task 6: Shape Recognition Wright Plot 44
Attachment Y. Task 6: Shape Recognition by Standard 44 Attachment Z. Task 6: Shape Recognition Descriptive Statistics 45 Attachment AA. Task 6: Shape Recognition Practice Item 46
Attachment AB. Task 7: Pattern Extension Wright Plot 47
Attachment AC. Task 7: Pattern Extension by Standard 47
Attachment AD. Examples of New Pattern Extension Items 50
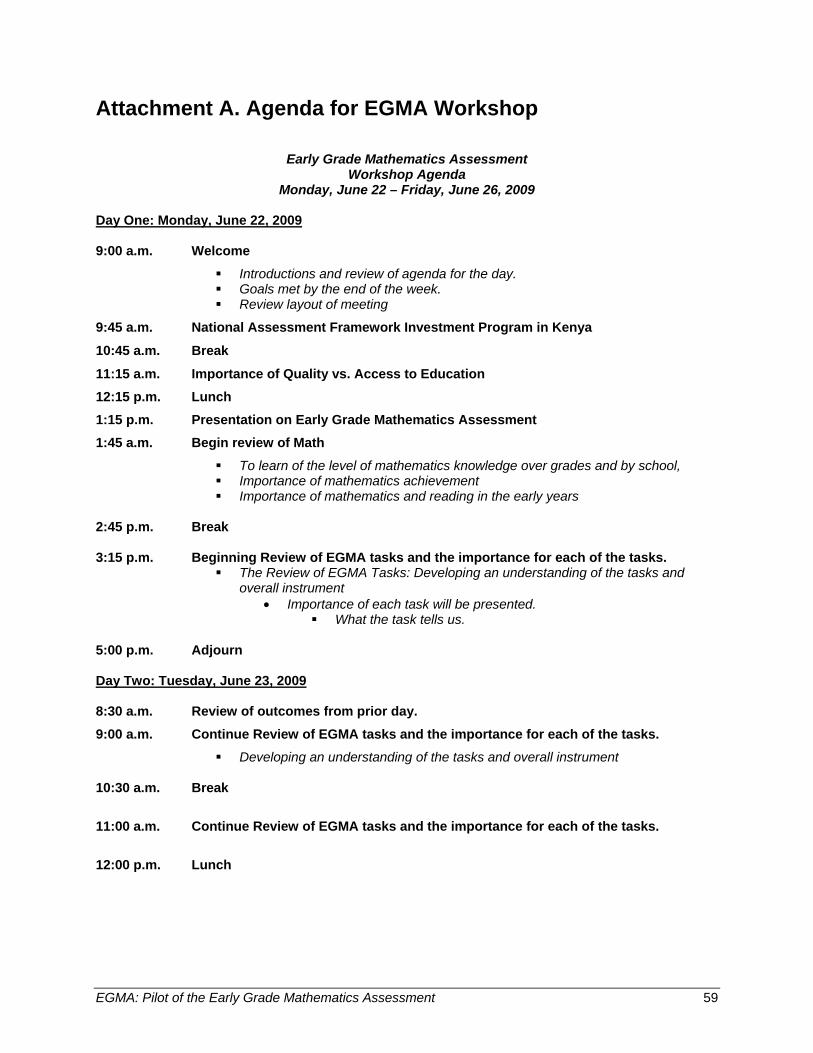
EGMA: Pilot of the Early Grade Mathematics Assessment 59
Attachment A. Agenda for EGMA Workshop
Early Grade Mathematics Assessment Workshop Agenda
Monday, June 22 – Friday, June 26, 2009 Day One: Monday, June 22, 2009 9:00 a.m. Welcome
Introductions and review of agenda for the day. Goals met by the end of the week. Review layout of meeting
9:45 a.m. National Assessment Framework Investment Program in Kenya
10:45 a.m. Break
11:15 a.m. Importance of Quality vs. Access to Education 12:15 p.m. Lunch 1:15 p.m. Presentation on Early Grade Mathematics Assessment 1:45 a.m. Begin review of Math
To learn of the level of mathematics knowledge over grades and by school, Importance of mathematics achievement Importance of mathematics and reading in the early years
2:45 p.m. Break 3:15 p.m. Beginning Review of EGMA tasks and the importance for each of the tasks.
The Review of EGMA Tasks: Developing an understanding of the tasks and overall instrument
• Importance of each task will be presented. What the task tells us.
5:00 p.m. Adjourn Day Two: Tuesday, June 23, 2009 8:30 a.m. Review of outcomes from prior day. 9:00 a.m. Continue Review of EGMA tasks and the importance for each of the tasks.
Developing an understanding of the tasks and overall instrument 10:30 a.m. Break
11:00 a.m. Continue Review of EGMA tasks and the importance for each of the tasks.
12:00 p.m. Lunch
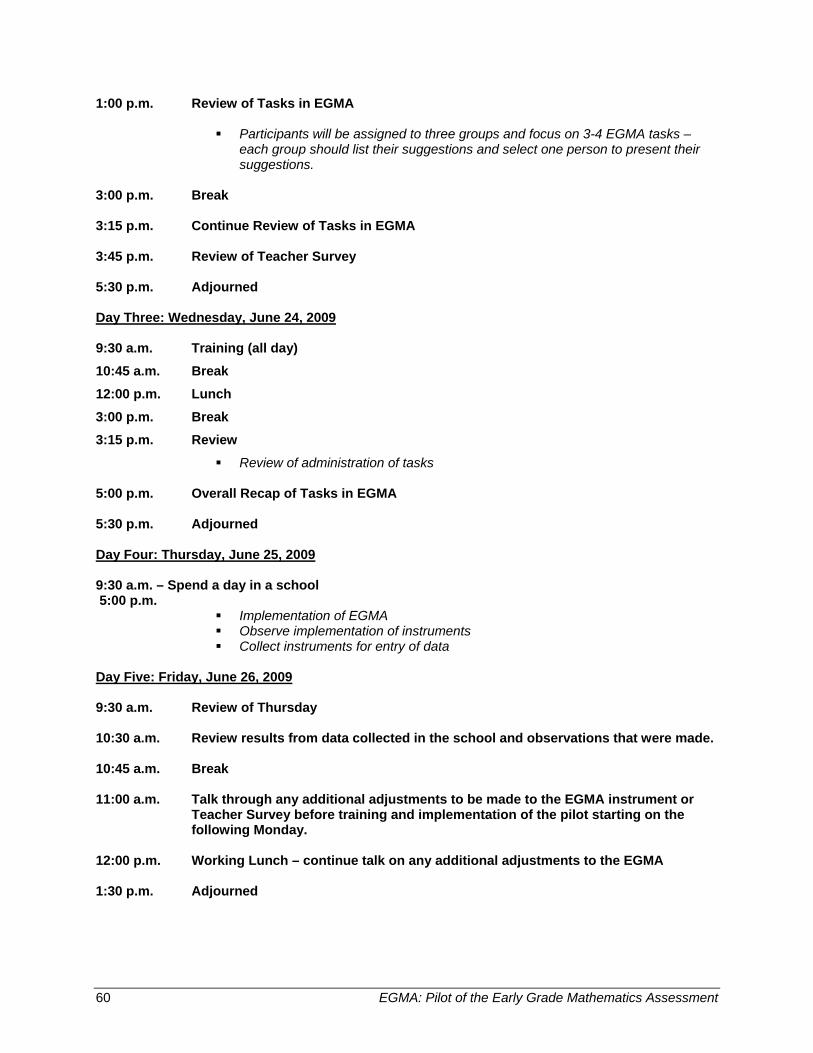
60 EGMA: Pilot of the Early Grade Mathematics Assessment
1:00 p.m. Review of Tasks in EGMA
Participants will be assigned to three groups and focus on 3-4 EGMA tasks – each group should list their suggestions and select one person to present their suggestions.
3:00 p.m. Break 3:15 p.m. Continue Review of Tasks in EGMA 3:45 p.m. Review of Teacher Survey 5:30 p.m. Adjourned Day Three: Wednesday, June 24, 2009 9:30 a.m. Training (all day) 10:45 a.m. Break 12:00 p.m. Lunch 3:00 p.m. Break 3:15 p.m. Review
Review of administration of tasks 5:00 p.m. Overall Recap of Tasks in EGMA 5:30 p.m. Adjourned Day Four: Thursday, June 25, 2009 9:30 a.m. – Spend a day in a school 5:00 p.m.
Implementation of EGMA Observe implementation of instruments Collect instruments for entry of data
Day Five: Friday, June 26, 2009 9:30 a.m. Review of Thursday
10:30 a.m. Review results from data collected in the school and observations that were made. 10:45 a.m. Break 11:00 a.m. Talk through any additional adjustments to be made to the EGMA instrument or
Teacher Survey before training and implementation of the pilot starting on the following Monday.
12:00 p.m. Working Lunch – continue talk on any additional adjustments to the EGMA 1:30 p.m. Adjourned
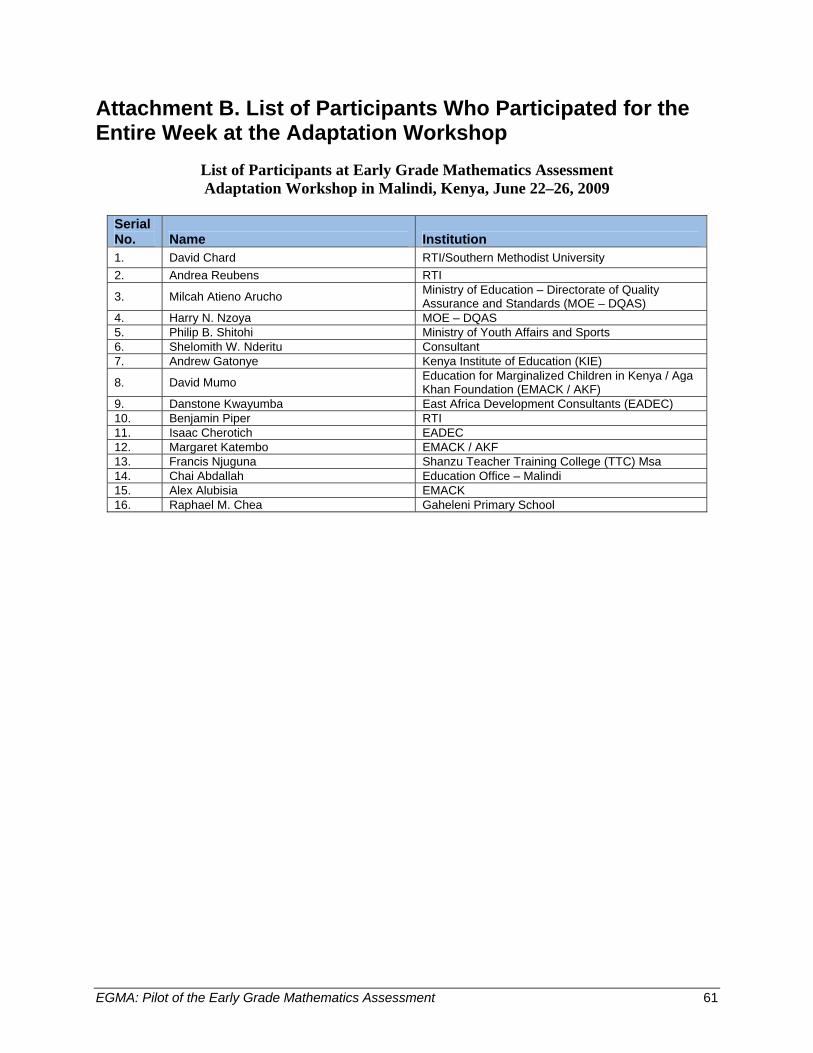
EGMA: Pilot of the Early Grade Mathematics Assessment 61
Attachment B. List of Participants Who Participated for the Entire Week at the Adaptation Workshop
List of Participants at Early Grade Mathematics Assessment Adaptation Workshop in Malindi, Kenya, June 22–26, 2009
Serial No. Name Institution 1. David Chard RTI/Southern Methodist University 2. Andrea Reubens RTI
3. Milcah Atieno Arucho Ministry of Education – Directorate of Quality Assurance and Standards (MOE – DQAS)
4. Harry N. Nzoya MOE – DQAS 5. Philip B. Shitohi Ministry of Youth Affairs and Sports 6. Shelomith W. Nderitu Consultant 7. Andrew Gatonye Kenya Institute of Education (KIE)
8. David Mumo Education for Marginalized Children in Kenya / Aga Khan Foundation (EMACK / AKF)
9. Danstone Kwayumba East Africa Development Consultants (EADEC) 10. Benjamin Piper RTI 11. Isaac Cherotich EADEC 12. Margaret Katembo EMACK / AKF 13. Francis Njuguna Shanzu Teacher Training College (TTC) Msa 14. Chai Abdallah Education Office – Malindi 15. Alex Alubisia EMACK 16. Raphael M. Chea Gaheleni Primary School
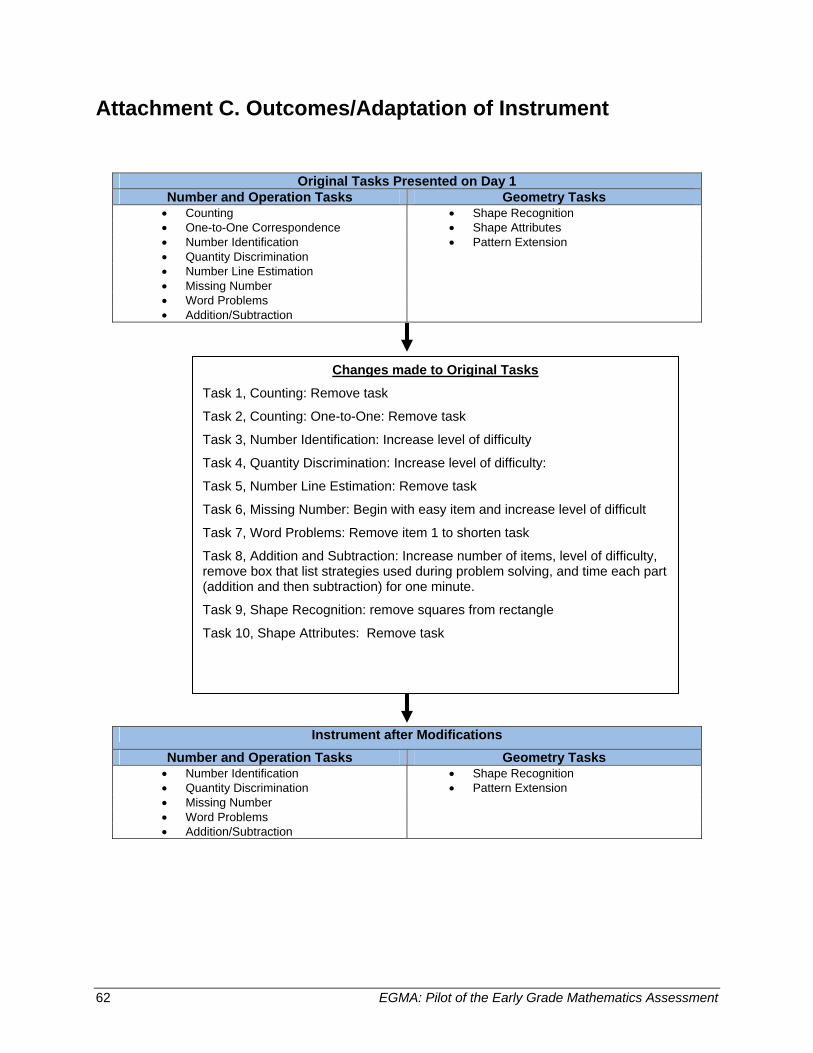
62 EGMA: Pilot of the Early Grade Mathematics Assessment
Attachment C. Outcomes/Adaptation of Instrument
Original Tasks Presented on Day 1 Number and Operation Tasks Geometry Tasks
• Counting • Shape Recognition • One-to-One Correspondence • Shape Attributes • Number Identification • Pattern Extension • Quantity Discrimination • Number Line Estimation • Missing Number • Word Problems • Addition/Subtraction
Instrument after Modifications Number and Operation Tasks Geometry Tasks
• Number Identification • Shape Recognition • Quantity Discrimination • Pattern Extension • Missing Number • Word Problems • Addition/Subtraction
Changes made to Original Tasks
Task 1, Counting: Remove task
Task 2, Counting: One-to-One: Remove task
Task 3, Number Identification: Increase level of difficulty
Task 4, Quantity Discrimination: Increase level of difficulty:
Task 5, Number Line Estimation: Remove task
Task 6, Missing Number: Begin with easy item and increase level of difficult
Task 7, Word Problems: Remove item 1 to shorten task
Task 8, Addition and Subtraction: Increase number of items, level of difficulty, remove box that list strategies used during problem solving, and time each part (addition and then subtraction) for one minute.
Task 9, Shape Recognition: remove squares from rectangle
Task 10, Shape Attributes: Remove task
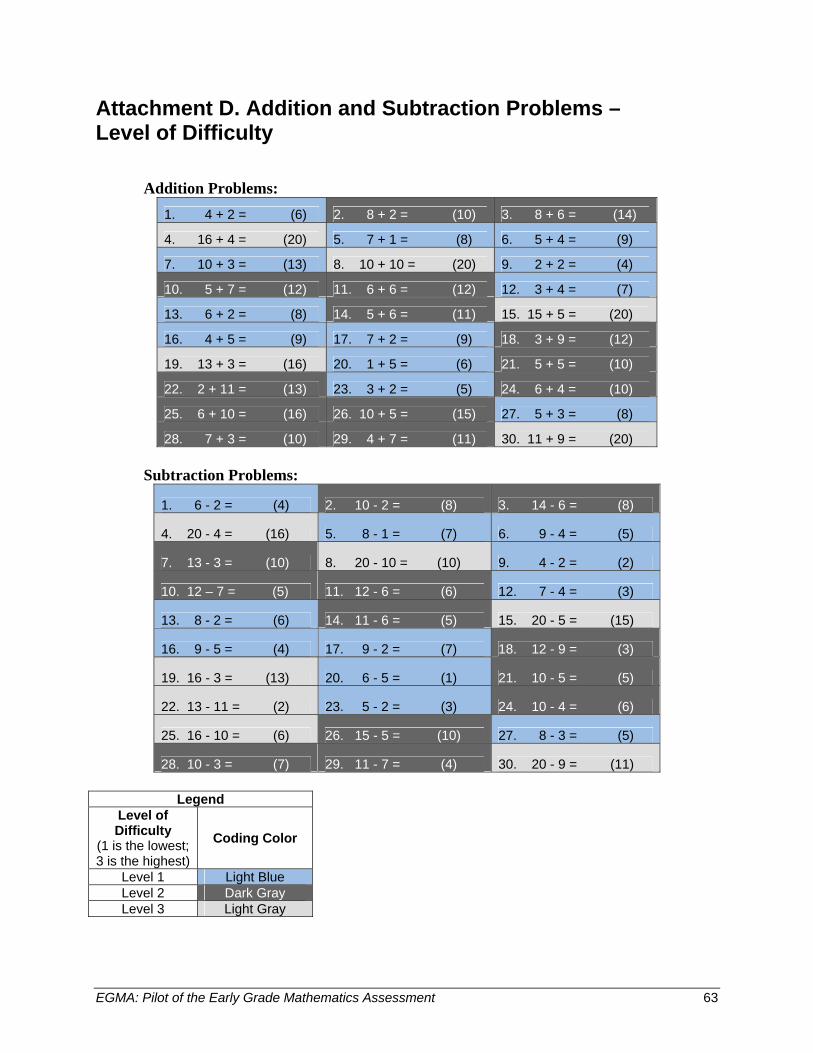
EGMA: Pilot of the Early Grade Mathematics Assessment 63
Attachment D. Addition and Subtraction Problems – Level of Difficulty
Addition Problems: 1. 4 + 2 = (6) 2. 8 + 2 = (10) 3. 8 + 6 = (14)
4. 16 + 4 = (20) 5. 7 + 1 = (8) 6. 5 + 4 = (9)
7. 10 + 3 = (13) 8. 10 + 10 = (20) 9. 2 + 2 = (4)
10. 5 + 7 = (12) 11. 6 + 6 = (12) 12. 3 + 4 = (7)
13. 6 + 2 = (8) 14. 5 + 6 = (11) 15. 15 + 5 = (20)
16. 4 + 5 = (9) 17. 7 + 2 = (9) 18. 3 + 9 = (12)
19. 13 + 3 = (16) 20. 1 + 5 = (6) 21. 5 + 5 = (10)
22. 2 + 11 = (13) 23. 3 + 2 = (5) 24. 6 + 4 = (10)
25. 6 + 10 = (16) 26. 10 + 5 = (15) 27. 5 + 3 = (8)
28. 7 + 3 = (10) 29. 4 + 7 = (11) 30. 11 + 9 = (20)
Subtraction Problems:
1. 6 - 2 = (4) 2. 10 - 2 = (8) 3. 14 - 6 = (8)
4. 20 - 4 = (16) 5. 8 - 1 = (7) 6. 9 - 4 = (5)
7. 13 - 3 = (10) 8. 20 - 10 = (10) 9. 4 - 2 = (2)
10. 12 – 7 = (5) 11. 12 - 6 = (6) 12. 7 - 4 = (3)
13. 8 - 2 = (6) 14. 11 - 6 = (5) 15. 20 - 5 = (15)
16. 9 - 5 = (4) 17. 9 - 2 = (7) 18. 12 - 9 = (3)
19. 16 - 3 = (13) 20. 6 - 5 = (1) 21. 10 - 5 = (5)
22. 13 - 11 = (2) 23. 5 - 2 = (3) 24. 10 - 4 = (6)
25. 16 - 10 = (6) 26. 15 - 5 = (10) 27. 8 - 3 = (5)
28. 10 - 3 = (7) 29. 11 - 7 = (4) 30. 20 - 9 = (11)
Legend Level of Difficulty
(1 is the lowest; 3 is the highest)
Coding Color
Level 1 Light Blue Level 2 Dark Gray Level 3 Light Gray
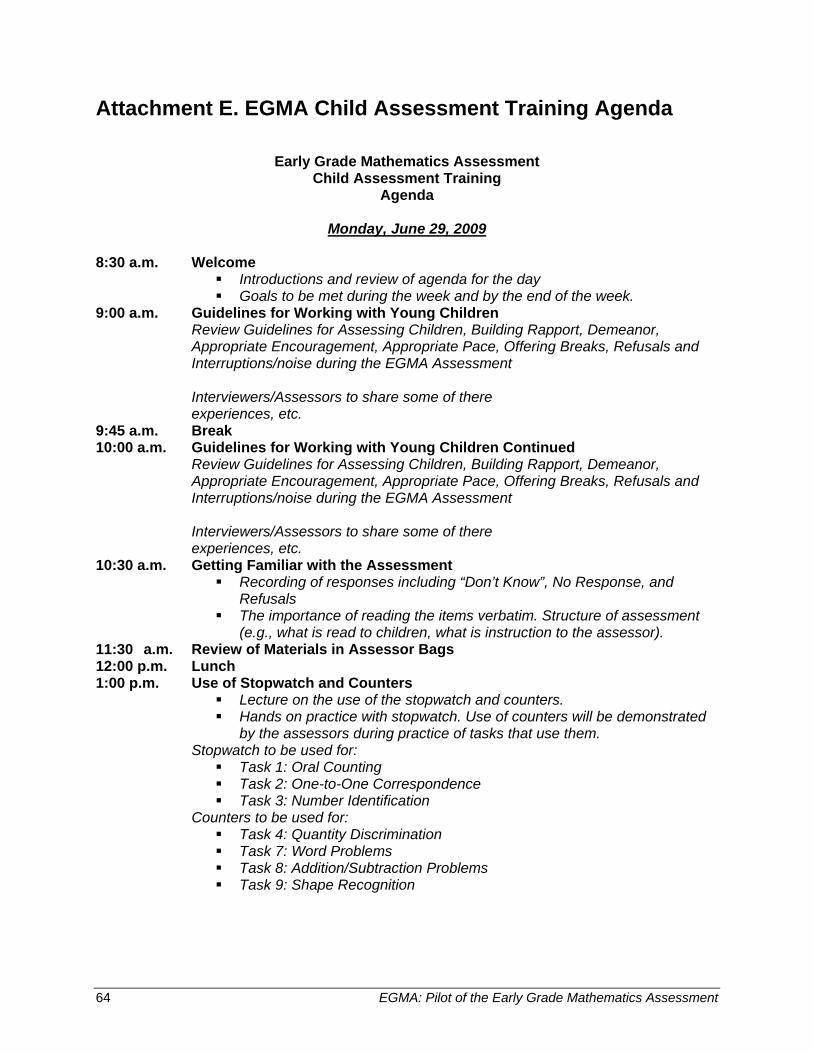
64 EGMA: Pilot of the Early Grade Mathematics Assessment
Attachment E. EGMA Child Assessment Training Agenda
Early Grade Mathematics Assessment Child Assessment Training
Agenda
Monday, June 29, 2009 8:30 a.m. Welcome
Introductions and review of agenda for the day Goals to be met during the week and by the end of the week.
9:00 a.m. Guidelines for Working with Young Children Review Guidelines for Assessing Children, Building Rapport, Demeanor, Appropriate Encouragement, Appropriate Pace, Offering Breaks, Refusals and Interruptions/noise during the EGMA Assessment Interviewers/Assessors to share some of there experiences, etc.
9:45 a.m. Break 10:00 a.m. Guidelines for Working with Young Children Continued
Review Guidelines for Assessing Children, Building Rapport, Demeanor, Appropriate Encouragement, Appropriate Pace, Offering Breaks, Refusals and Interruptions/noise during the EGMA Assessment Interviewers/Assessors to share some of there experiences, etc.
10:30 a.m. Getting Familiar with the Assessment Recording of responses including “Don’t Know”, No Response, and
Refusals The importance of reading the items verbatim. Structure of assessment
(e.g., what is read to children, what is instruction to the assessor). 11:30 a.m. Review of Materials in Assessor Bags 12:00 p.m. Lunch 1:00 p.m. Use of Stopwatch and Counters
Lecture on the use of the stopwatch and counters. Hands on practice with stopwatch. Use of counters will be demonstrated
by the assessors during practice of tasks that use them. Stopwatch to be used for:
Task 1: Oral Counting Task 2: One-to-One Correspondence Task 3: Number Identification
Counters to be used for: Task 4: Quantity Discrimination Task 7: Word Problems Task 8: Addition/Subtraction Problems Task 9: Shape Recognition
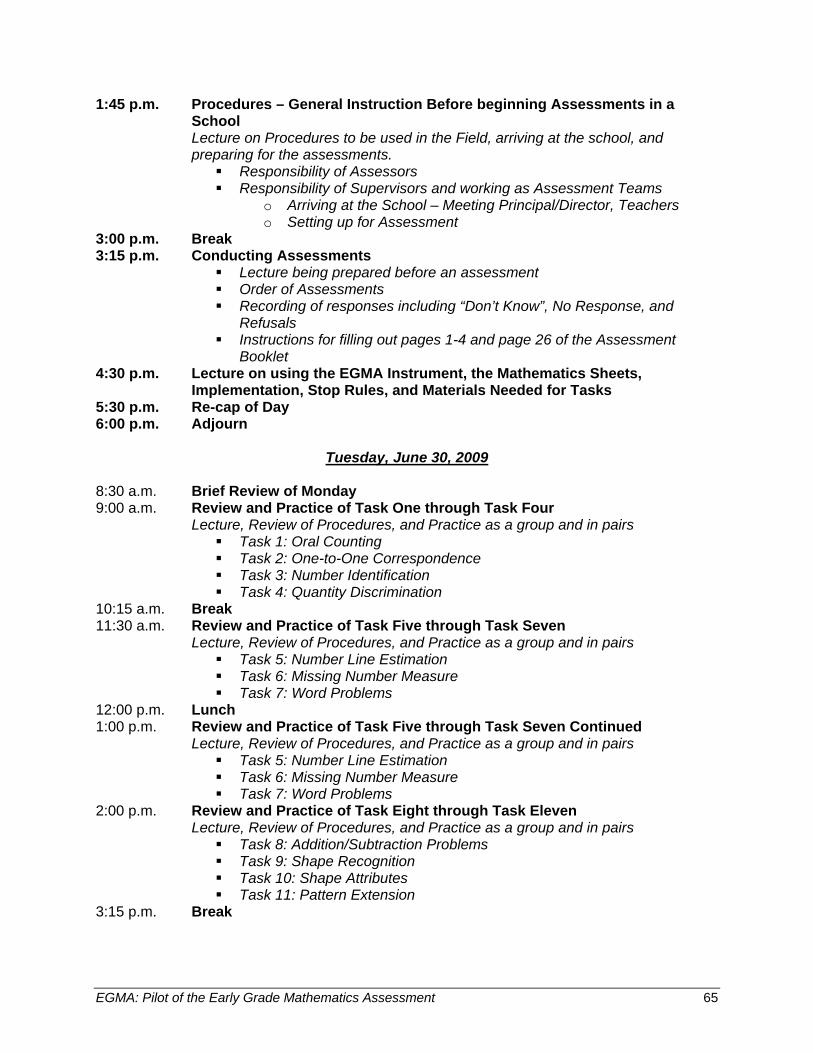
EGMA: Pilot of the Early Grade Mathematics Assessment 65
1:45 p.m. Procedures – General Instruction Before beginning Assessments in a School Lecture on Procedures to be used in the Field, arriving at the school, and preparing for the assessments.
Responsibility of Assessors Responsibility of Supervisors and working as Assessment Teams
o Arriving at the School – Meeting Principal/Director, Teachers o Setting up for Assessment
3:00 p.m. Break 3:15 p.m. Conducting Assessments
Lecture being prepared before an assessment Order of Assessments Recording of responses including “Don’t Know”, No Response, and
Refusals Instructions for filling out pages 1-4 and page 26 of the Assessment
Booklet 4:30 p.m. Lecture on using the EGMA Instrument, the Mathematics Sheets,
Implementation, Stop Rules, and Materials Needed for Tasks 5:30 p.m. Re-cap of Day 6:00 p.m. Adjourn
Tuesday, June 30, 2009 8:30 a.m. Brief Review of Monday 9:00 a.m. Review and Practice of Task One through Task Four Lecture, Review of Procedures, and Practice as a group and in pairs
Task 1: Oral Counting Task 2: One-to-One Correspondence Task 3: Number Identification Task 4: Quantity Discrimination
10:15 a.m. Break 11:30 a.m. Review and Practice of Task Five through Task Seven Lecture, Review of Procedures, and Practice as a group and in pairs
Task 5: Number Line Estimation Task 6: Missing Number Measure Task 7: Word Problems
12:00 p.m. Lunch 1:00 p.m. Review and Practice of Task Five through Task Seven Continued Lecture, Review of Procedures, and Practice as a group and in pairs
Task 5: Number Line Estimation Task 6: Missing Number Measure Task 7: Word Problems
2:00 p.m. Review and Practice of Task Eight through Task Eleven Lecture, Review of Procedures, and Practice as a group and in pairs
Task 8: Addition/Subtraction Problems Task 9: Shape Recognition Task 10: Shape Attributes Task 11: Pattern Extension
3:15 p.m. Break
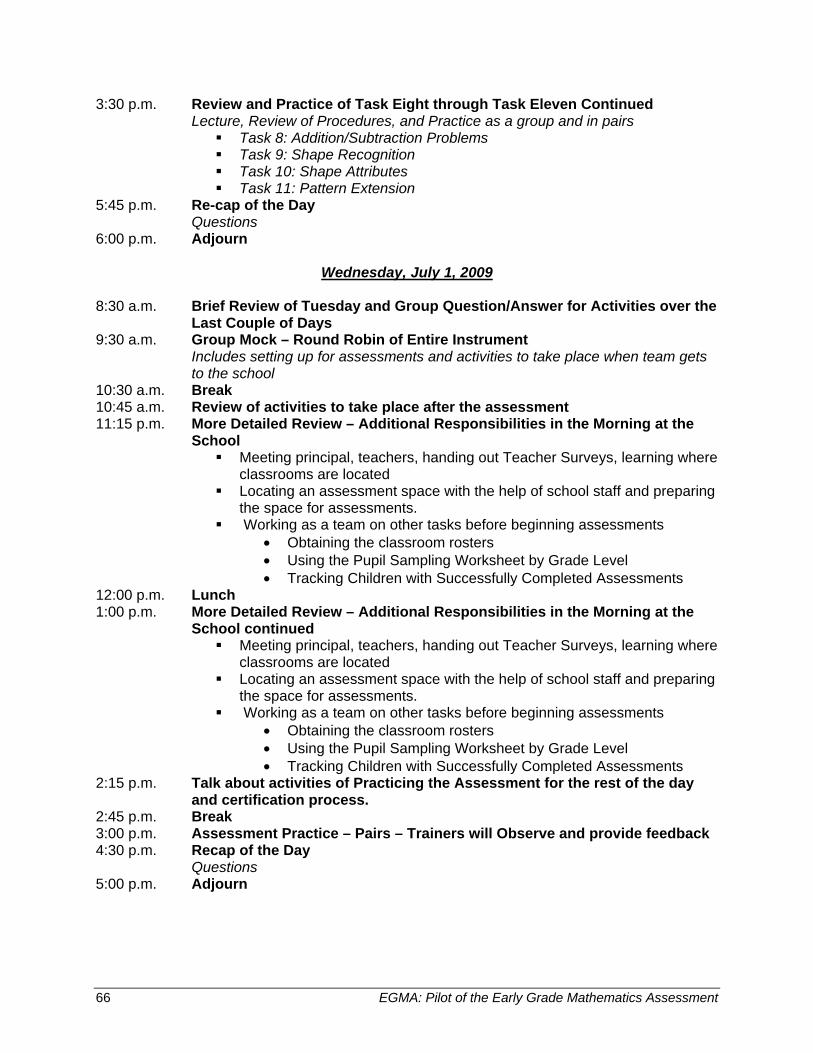
66 EGMA: Pilot of the Early Grade Mathematics Assessment
3:30 p.m. Review and Practice of Task Eight through Task Eleven Continued Lecture, Review of Procedures, and Practice as a group and in pairs
Task 8: Addition/Subtraction Problems Task 9: Shape Recognition Task 10: Shape Attributes Task 11: Pattern Extension
5:45 p.m. Re-cap of the Day Questions 6:00 p.m. Adjourn
Wednesday, July 1, 2009 8:30 a.m. Brief Review of Tuesday and Group Question/Answer for Activities over the
Last Couple of Days 9:30 a.m. Group Mock – Round Robin of Entire Instrument Includes setting up for assessments and activities to take place when team gets
to the school 10:30 a.m. Break 10:45 a.m. Review of activities to take place after the assessment 11:15 p.m. More Detailed Review – Additional Responsibilities in the Morning at the
School Meeting principal, teachers, handing out Teacher Surveys, learning where
classrooms are located Locating an assessment space with the help of school staff and preparing
the space for assessments. Working as a team on other tasks before beginning assessments
• Obtaining the classroom rosters • Using the Pupil Sampling Worksheet by Grade Level • Tracking Children with Successfully Completed Assessments
12:00 p.m. Lunch 1:00 p.m. More Detailed Review – Additional Responsibilities in the Morning at the
School continued Meeting principal, teachers, handing out Teacher Surveys, learning where
classrooms are located Locating an assessment space with the help of school staff and preparing
the space for assessments. Working as a team on other tasks before beginning assessments
• Obtaining the classroom rosters • Using the Pupil Sampling Worksheet by Grade Level • Tracking Children with Successfully Completed Assessments
2:15 p.m. Talk about activities of Practicing the Assessment for the rest of the day and certification process.
2:45 p.m. Break 3:00 p.m. Assessment Practice – Pairs – Trainers will Observe and provide feedback 4:30 p.m. Recap of the Day Questions 5:00 p.m. Adjourn
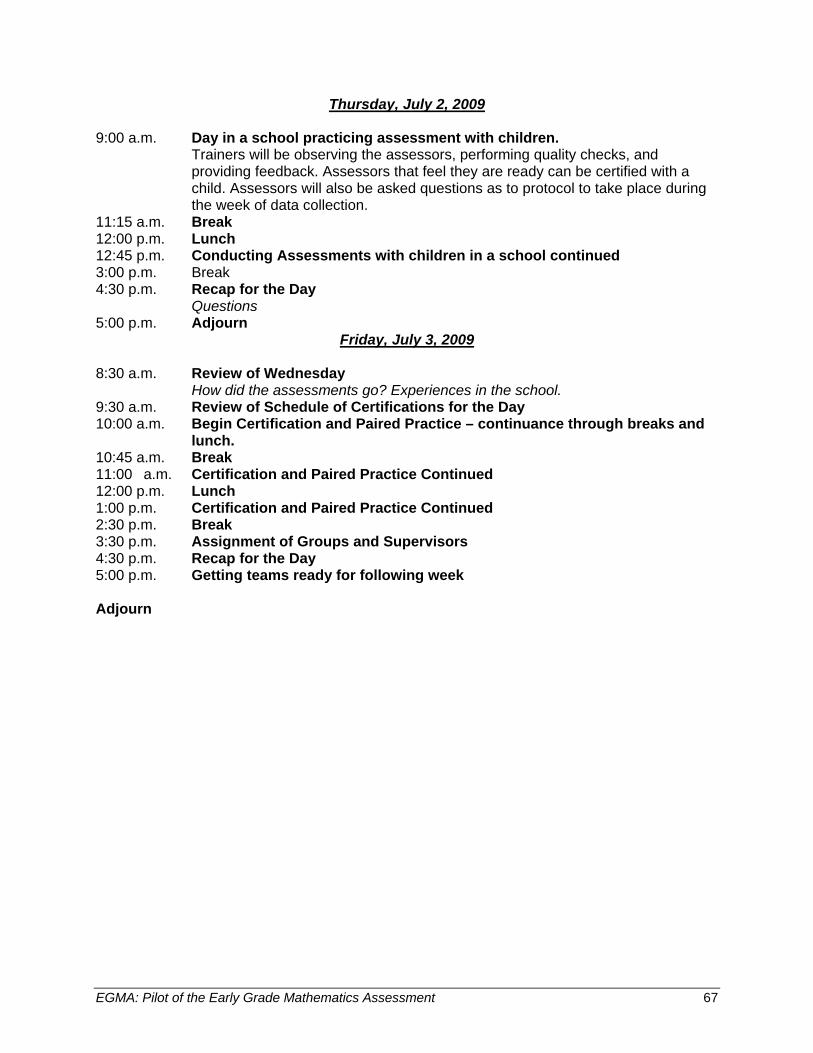
EGMA: Pilot of the Early Grade Mathematics Assessment 67
Thursday, July 2, 2009
9:00 a.m. Day in a school practicing assessment with children. Trainers will be observing the assessors, performing quality checks, and
providing feedback. Assessors that feel they are ready can be certified with a child. Assessors will also be asked questions as to protocol to take place during the week of data collection.
11:15 a.m. Break 12:00 p.m. Lunch 12:45 p.m. Conducting Assessments with children in a school continued 3:00 p.m. Break 4:30 p.m. Recap for the Day Questions 5:00 p.m. Adjourn
Friday, July 3, 2009 8:30 a.m. Review of Wednesday How did the assessments go? Experiences in the school. 9:30 a.m. Review of Schedule of Certifications for the Day 10:00 a.m. Begin Certification and Paired Practice – continuance through breaks and
lunch. 10:45 a.m. Break 11:00 a.m. Certification and Paired Practice Continued 12:00 p.m. Lunch 1:00 p.m. Certification and Paired Practice Continued 2:30 p.m. Break 3:30 p.m. Assignment of Groups and Supervisors 4:30 p.m. Recap for the Day 5:00 p.m. Getting teams ready for following week Adjourn
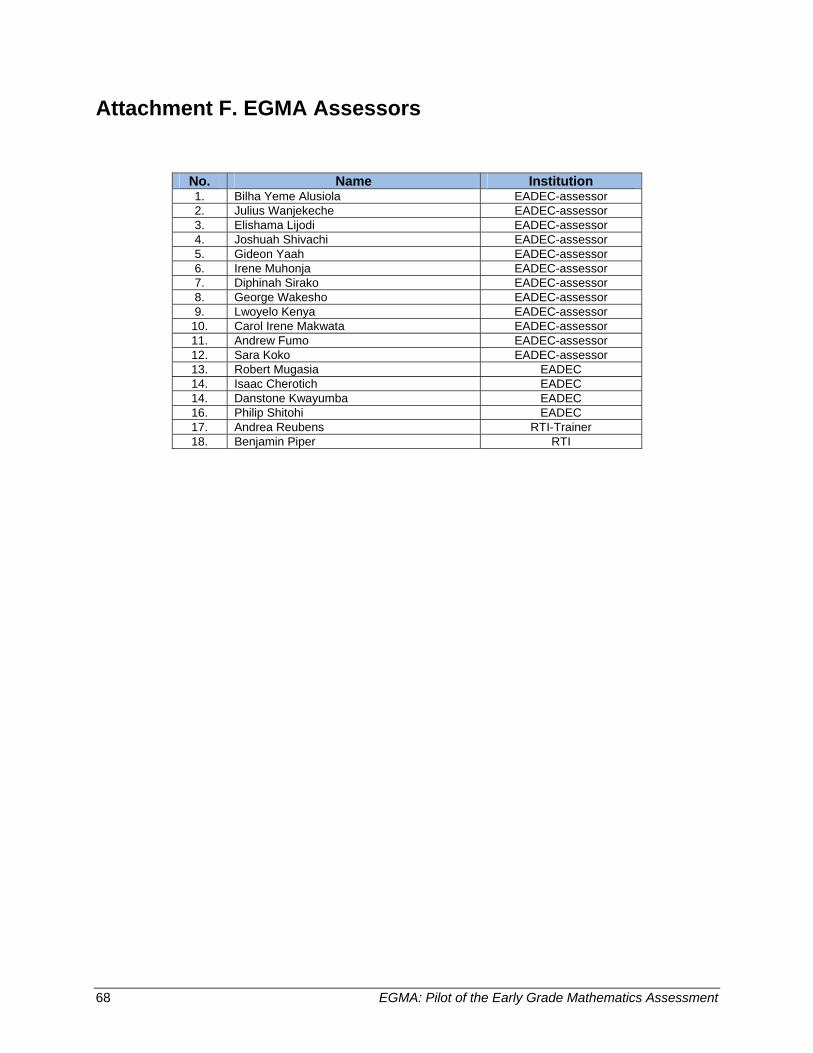
68 EGMA: Pilot of the Early Grade Mathematics Assessment
Attachment F. EGMA Assessors
No. Name Institution 1. Bilha Yeme Alusiola EADEC-assessor 2. Julius Wanjekeche EADEC-assessor 3. Elishama Lijodi EADEC-assessor 4. Joshuah Shivachi EADEC-assessor 5. Gideon Yaah EADEC-assessor 6. Irene Muhonja EADEC-assessor 7. Diphinah Sirako EADEC-assessor 8. George Wakesho EADEC-assessor 9. Lwoyelo Kenya EADEC-assessor 10. Carol Irene Makwata EADEC-assessor 11. Andrew Fumo EADEC-assessor 12. Sara Koko EADEC-assessor 13. Robert Mugasia EADEC 14. Isaac Cherotich EADEC 14. Danstone Kwayumba EADEC 16. Philip Shitohi EADEC 17. Andrea Reubens RTI-Trainer 18. Benjamin Piper RTI
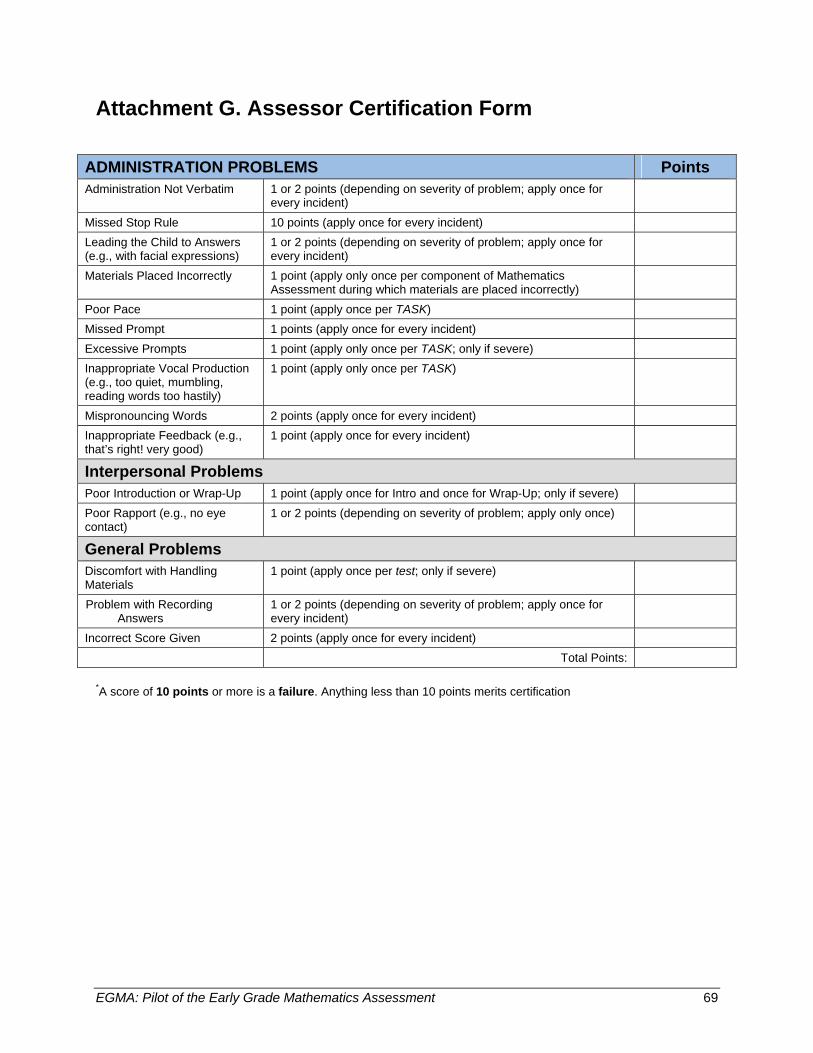
EGMA: Pilot of the Early Grade Mathematics Assessment 69
Attachment G. Assessor Certification Form
ADMINISTRATION PROBLEMS Points Administration Not Verbatim 1 or 2 points (depending on severity of problem; apply once for
every incident)
Missed Stop Rule 10 points (apply once for every incident) Leading the Child to Answers (e.g., with facial expressions)
1 or 2 points (depending on severity of problem; apply once for every incident)
Materials Placed Incorrectly 1 point (apply only once per component of Mathematics Assessment during which materials are placed incorrectly)
Poor Pace 1 point (apply once per TASK) Missed Prompt 1 points (apply once for every incident) Excessive Prompts 1 point (apply only once per TASK; only if severe) Inappropriate Vocal Production (e.g., too quiet, mumbling, reading words too hastily)
1 point (apply only once per TASK)
Mispronouncing Words 2 points (apply once for every incident) Inappropriate Feedback (e.g., that’s right! very good)
1 point (apply once for every incident)
Interpersonal Problems Poor Introduction or Wrap-Up 1 point (apply once for Intro and once for Wrap-Up; only if severe) Poor Rapport (e.g., no eye contact)
1 or 2 points (depending on severity of problem; apply only once)
General Problems Discomfort with Handling Materials
1 point (apply once per test; only if severe)
Problem with Recording Answers
1 or 2 points (depending on severity of problem; apply once for every incident)
Incorrect Score Given 2 points (apply once for every incident) Total Points:
*A score of 10 points or more is a failure. Anything less than 10 points merits certification
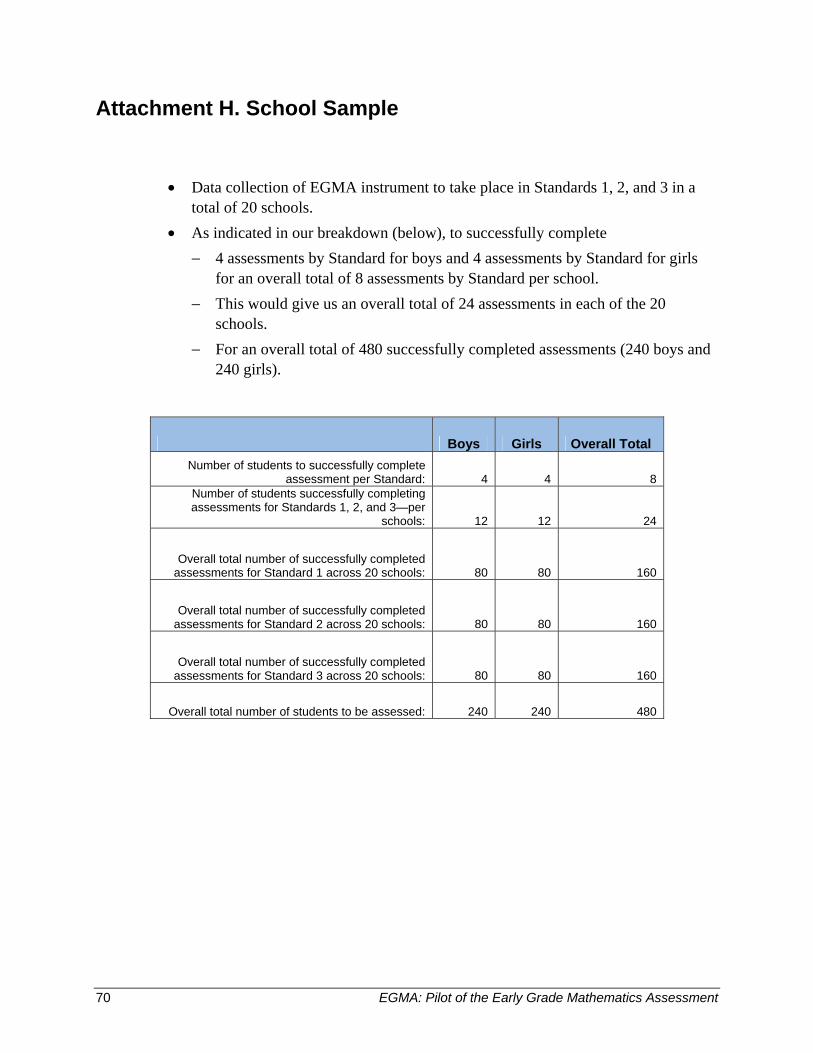
70 EGMA: Pilot of the Early Grade Mathematics Assessment
Attachment H. School Sample
• Data collection of EGMA instrument to take place in Standards 1, 2, and 3 in a total of 20 schools.
• As indicated in our breakdown (below), to successfully complete − 4 assessments by Standard for boys and 4 assessments by Standard for girls
for an overall total of 8 assessments by Standard per school. − This would give us an overall total of 24 assessments in each of the 20
schools. − For an overall total of 480 successfully completed assessments (240 boys and
240 girls).
Boys Girls Overall Total Number of students to successfully complete
assessment per Standard: 4 4 8 Number of students successfully completing assessments for Standards 1, 2, and 3—per
schools: 12 12 24
Overall total number of successfully completed assessments for Standard 1 across 20 schools: 80 80 160
Overall total number of successfully completed assessments for Standard 2 across 20 schools: 80 80 160
Overall total number of successfully completed assessments for Standard 3 across 20 schools: 80 80 160
Overall total number of students to be assessed: 240 240 480
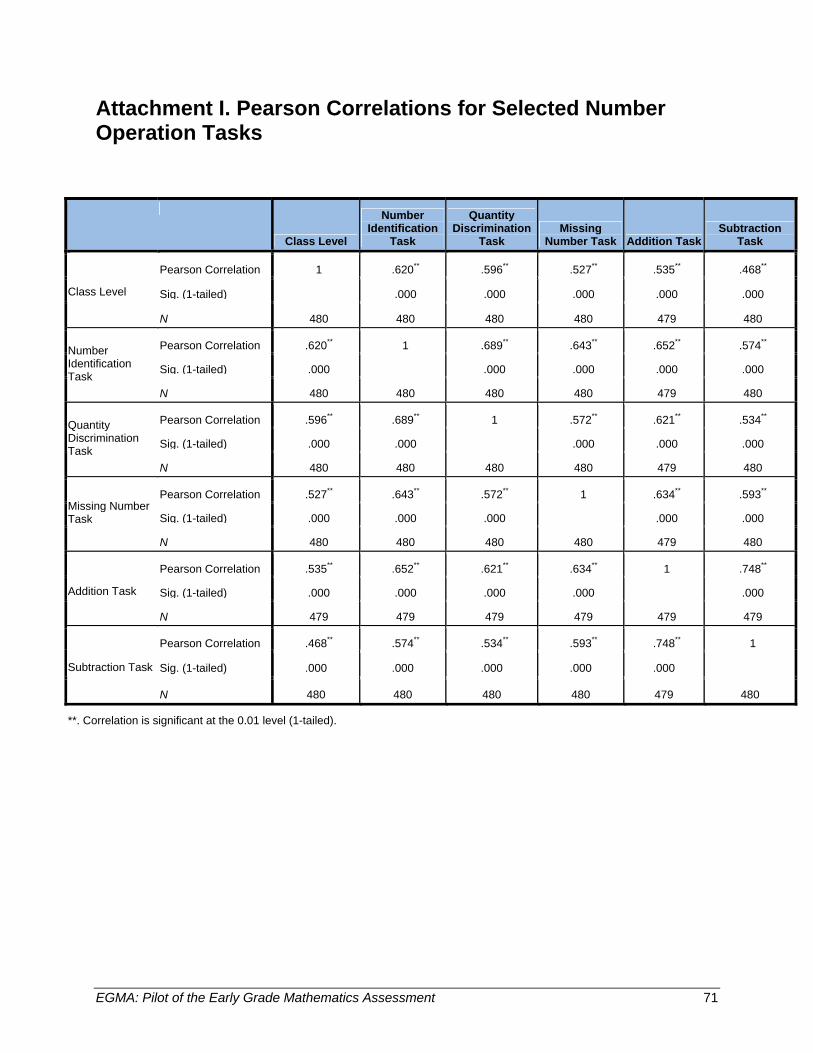
EGMA: Pilot of the Early Grade Mathematics Assessment 71
Attachment I. Pearson Correlations for Selected Number Operation Tasks
Class Level
Number Identification
Task
Quantity Discrimination
Task Missing
Number Task Addition TaskSubtraction
Task
Pearson Correlation 1 .620** .596** .527** .535** .468**
Sig. (1-tailed)
.000 .000 .000 .000 .000Class Level
N 480 480 480 480 479 480
Pearson Correlation .620** 1 .689** .643** .652** .574**
Sig. (1-tailed) .000
.000 .000 .000 .000Number Identification Task
N 480 480 480 480 479 480
Pearson Correlation .596** .689** 1 .572** .621** .534**
Sig. (1-tailed) .000 .000
.000 .000 .000Quantity Discrimination Task
N 480 480 480 480 479 480
Pearson Correlation .527** .643** .572** 1 .634** .593**
Sig. (1-tailed) .000 .000 .000
.000 .000Missing Number Task
N 480 480 480 480 479 480
Pearson Correlation .535** .652** .621** .634** 1 .748**
Sig. (1-tailed) .000 .000 .000 .000
.000Addition Task
N 479 479 479 479 479 479
Pearson Correlation .468** .574** .534** .593** .748** 1
Sig. (1-tailed) .000 .000 .000 .000 .000 Subtraction Task
N 480 480 480 480 479 480
**. Correlation is significant at the 0.01 level (1-tailed).
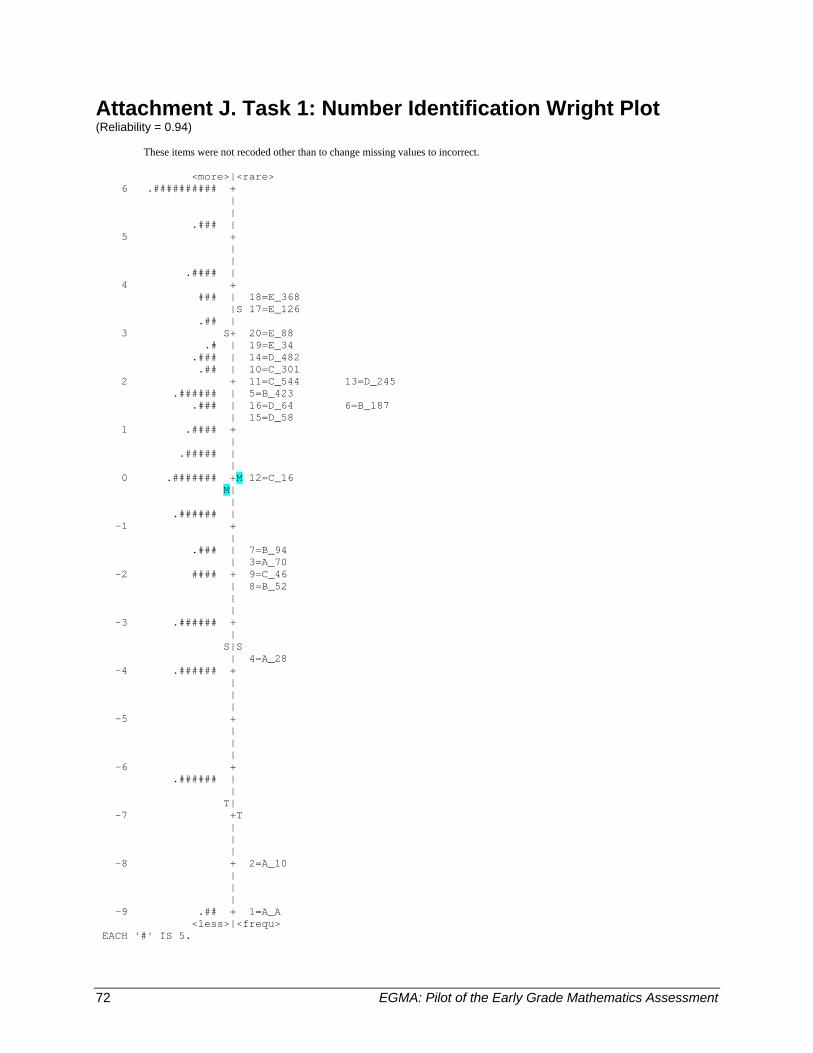
72 EGMA: Pilot of the Early Grade Mathematics Assessment
Attachment J. Task 1: Number Identification Wright Plot (Reliability = 0.94) These items were not recoded other than to change missing values to incorrect. <more>|<rare> 6 .########## + | | .### | 5 + | | .#### | 4 + ### | 18=E_368 |S 17=E_126 .## | 3 S+ 20=E_88 .# | 19=E_34 .### | 14=D_482 .## | 10=C_301 2 + 11=C_544 13=D_245 .###### | 5=B_423 .### | 16=D_64 6=B_187 | 15=D_58 1 .#### + | .##### | | 0 .####### +M 12=C_16 M| | .###### | -1 + | .### | 7=B_94 | 3=A_70 -2 #### + 9=C_46 | 8=B_52 | | -3 .###### + | S|S | 4=A_28 -4 .###### + | | | -5 + | | | -6 + .###### | | T| -7 +T | | | -8 + 2=A_10 | | | -9 .## + 1=A_A <less>|<frequ> EACH '#' IS 5.
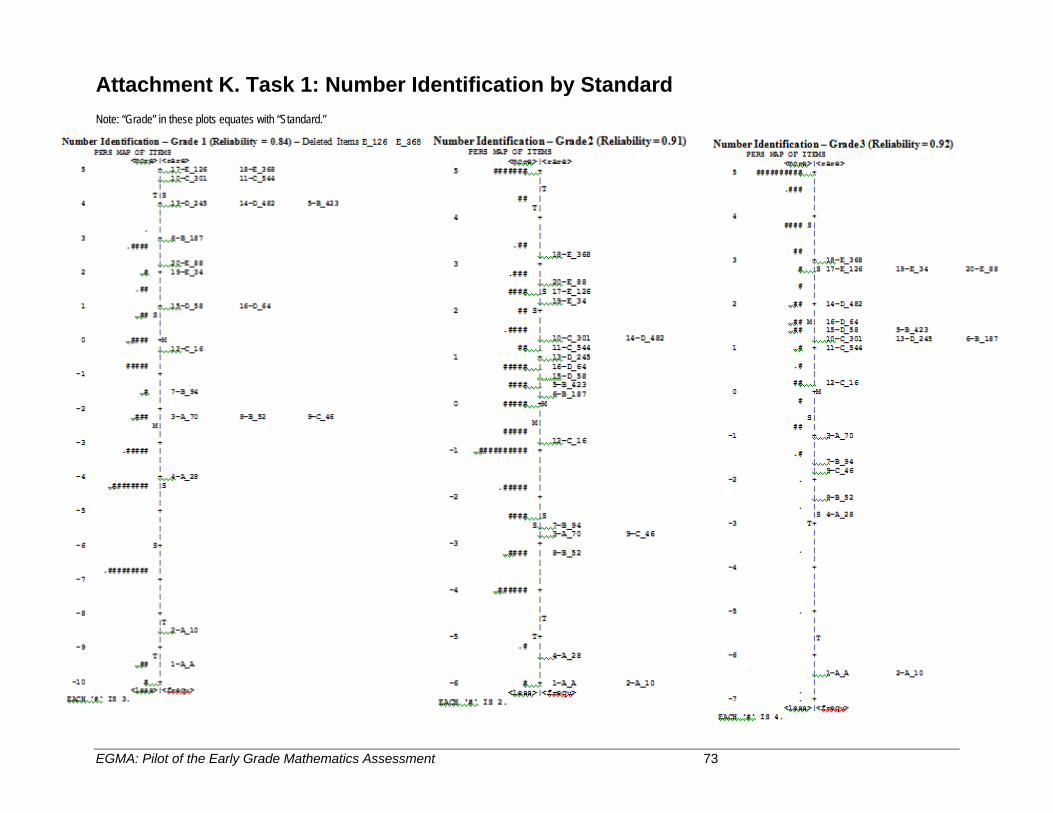
EGMA: Pilot of the Early Grade Mathematics Assessment 73
Attachment K. Task 1: Number Identification by Standard Note: “Grade” in these plots equates with “Standard.”
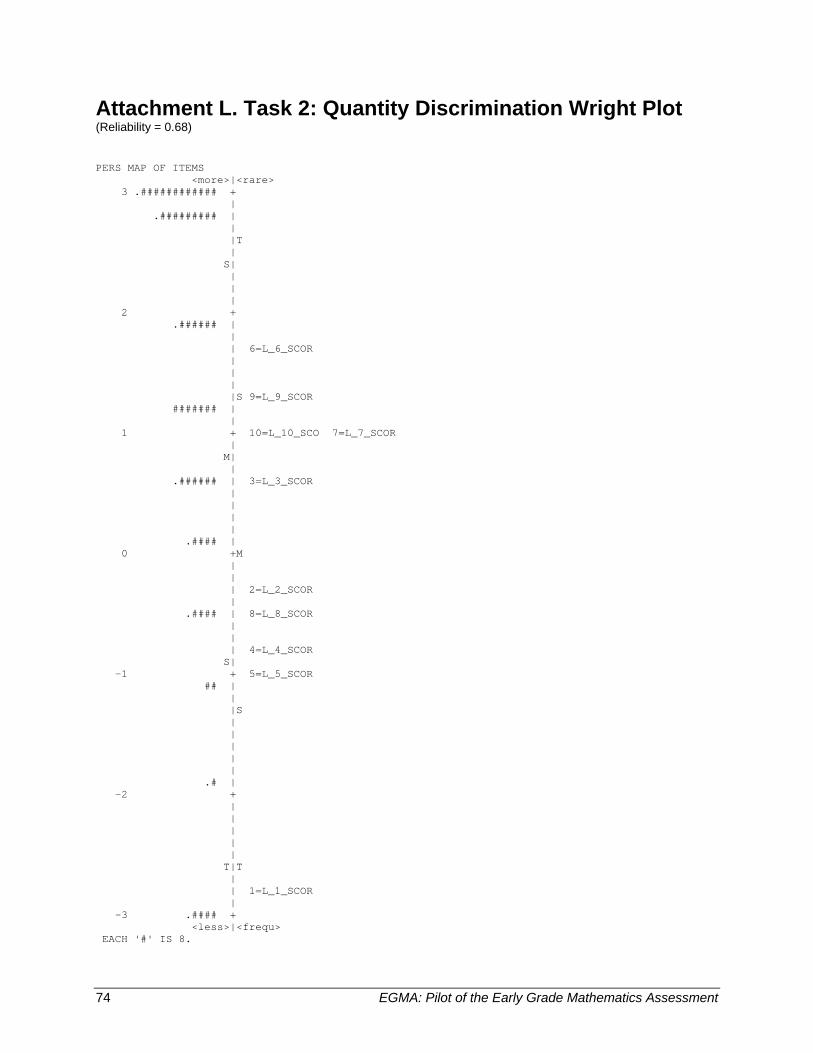
74 EGMA: Pilot of the Early Grade Mathematics Assessment
Attachment L. Task 2: Quantity Discrimination Wright Plot (Reliability = 0.68)
PERS MAP OF ITEMS <more>|<rare> 3 .############ + | .######### | | |T | S| | | | 2 + .###### | | | 6=L_6_SCOR | | | |S 9=L_9_SCOR ####### | | 1 + 10=L_10_SCO 7=L_7_SCOR | M| | .###### | 3=L_3_SCOR | | | | .#### | 0 +M | | | 2=L_2_SCOR | .#### | 8=L_8_SCOR | | | 4=L_4_SCOR S| -1 + 5=L_5_SCOR ## | | |S | | | | | .# | -2 + | | | | | T|T | | 1=L_1_SCOR | -3 .#### + <less>|<frequ> EACH '#' IS 8.
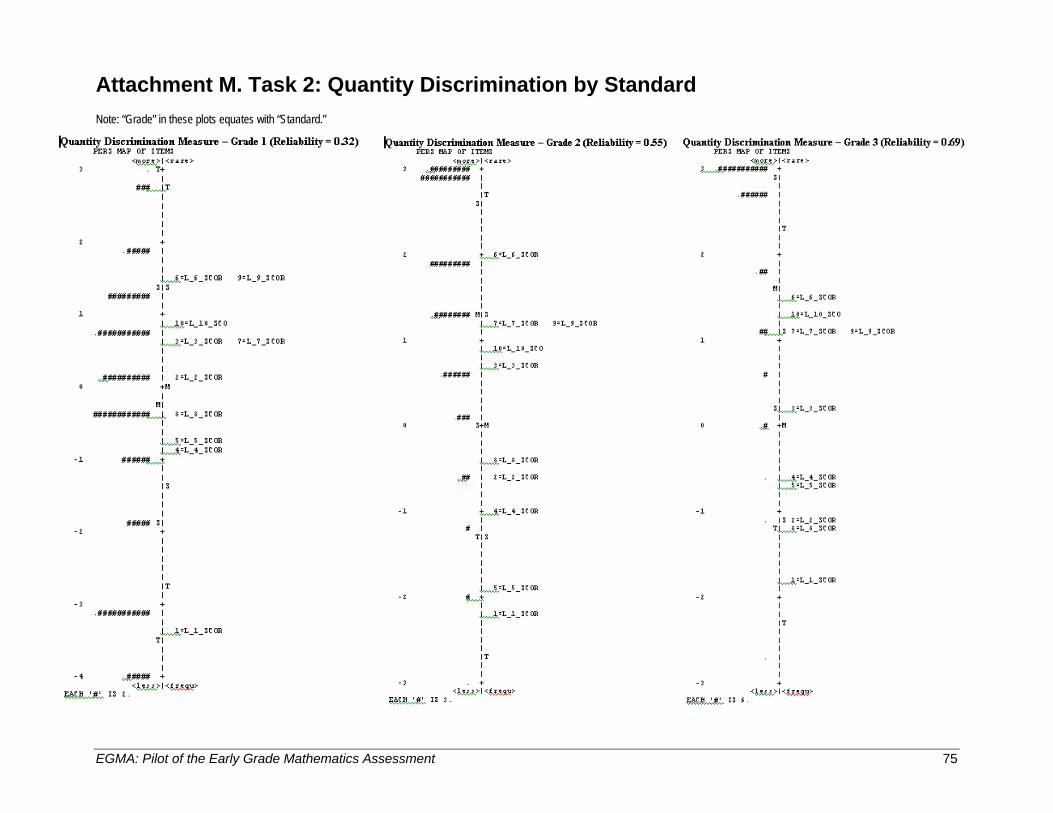
EGMA: Pilot of the Early Grade Mathematics Assessment 75
Attachment M. Task 2: Quantity Discrimination by Standard Note: “Grade” in these plots equates with “Standard.”
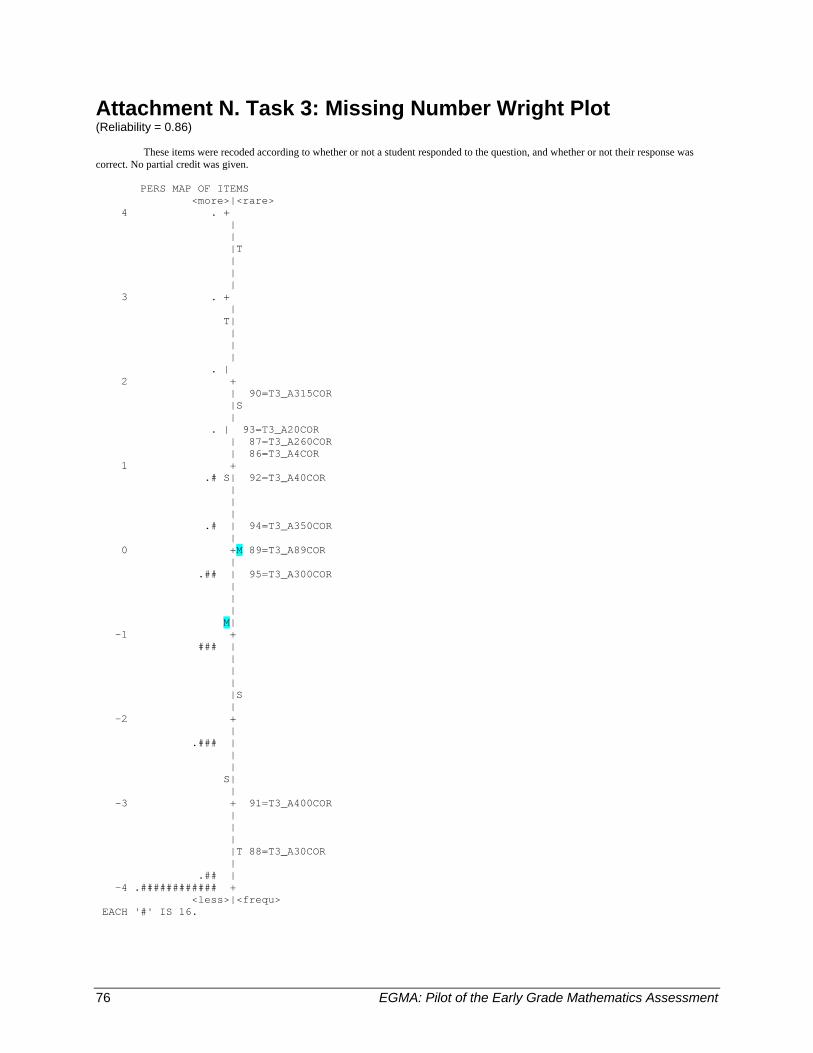
76 EGMA: Pilot of the Early Grade Mathematics Assessment
Attachment N. Task 3: Missing Number Wright Plot (Reliability = 0.86)
These items were recoded according to whether or not a student responded to the question, and whether or not their response was
correct. No partial credit was given.
PERS MAP OF ITEMS <more>|<rare> 4 . + | | |T | | | 3 . + | T| | | | . | 2 + | 90=T3_A315COR |S | . | 93=T3_A20COR | 87=T3_A260COR | 86=T3_A4COR 1 + .# S| 92=T3_A40COR | | | .# | 94=T3_A350COR | 0 +M 89=T3_A89COR | .## | 95=T3_A300COR | | | M| -1 + ### | | | | |S | -2 + | .### | | | S| | -3 + 91=T3_A400COR | | | |T 88=T3_A30COR | .## | -4 .############ + <less>|<frequ> EACH '#' IS 16.
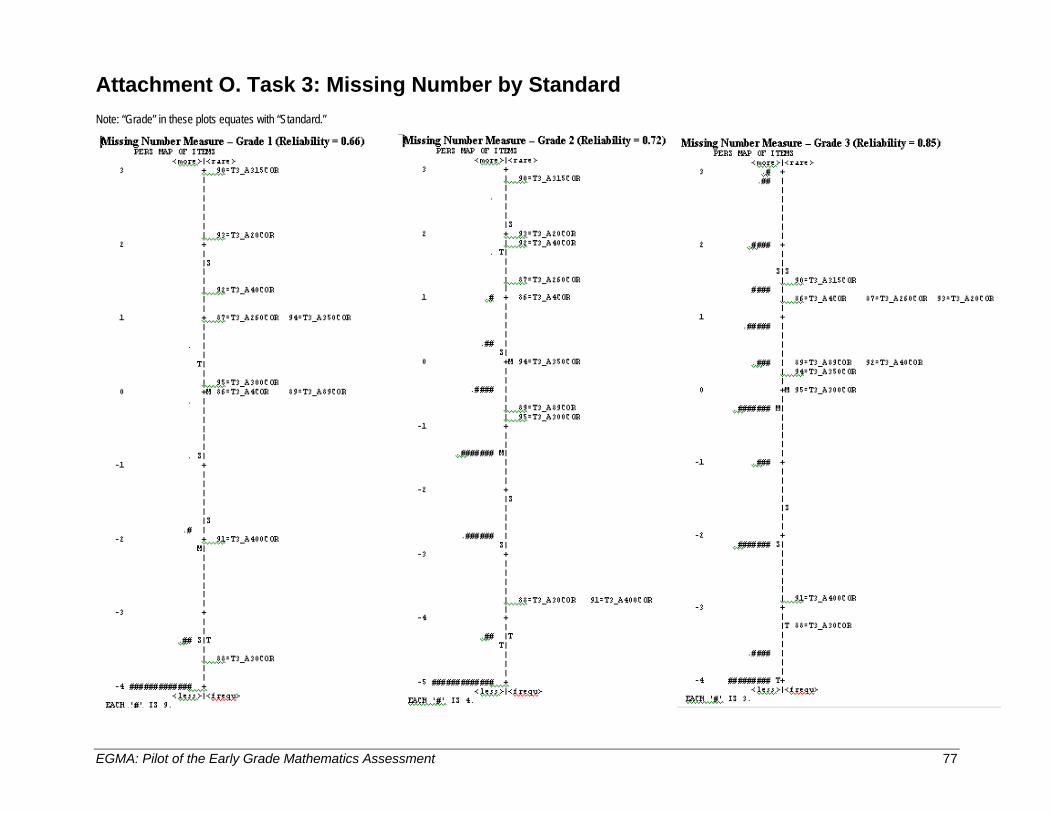
EGMA: Pilot of the Early Grade Mathematics Assessment 77
Attachment O. Task 3: Missing Number by Standard Note: “Grade” in these plots equates with “Standard.”
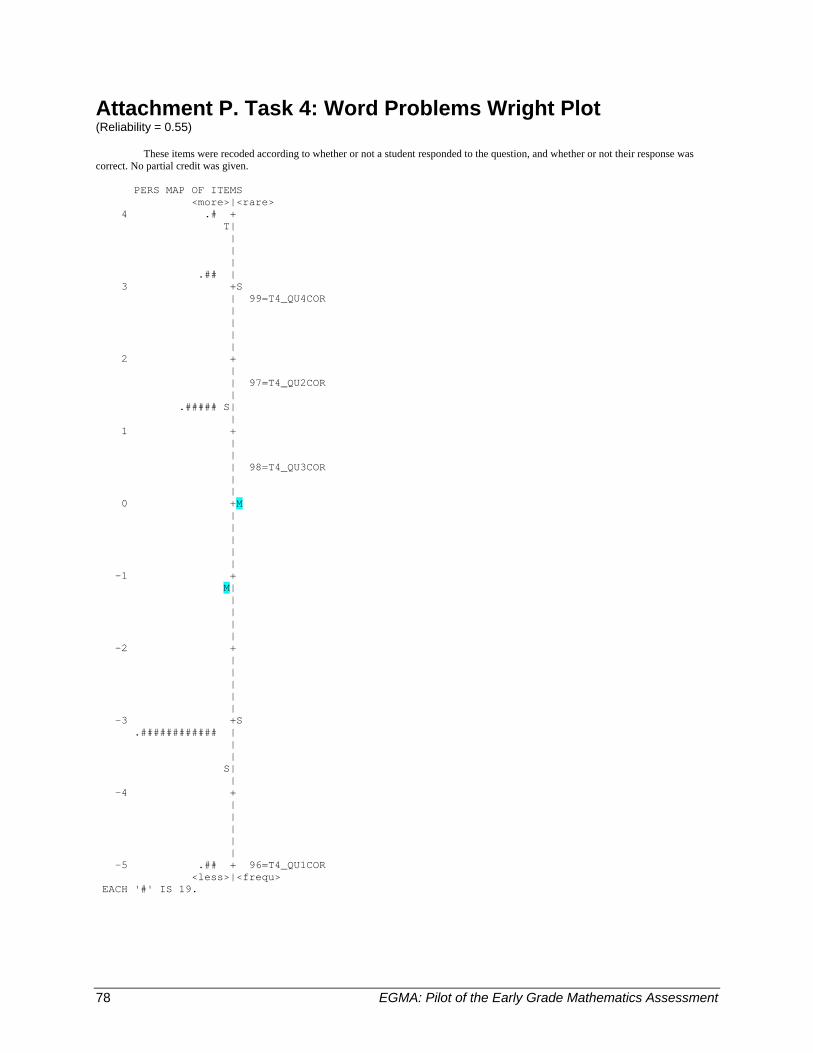
78 EGMA: Pilot of the Early Grade Mathematics Assessment
Attachment P. Task 4: Word Problems Wright Plot (Reliability = 0.55)
These items were recoded according to whether or not a student responded to the question, and whether or not their response was correct. No partial credit was given.
PERS MAP OF ITEMS <more>|<rare> 4 .# + T| | | | .## | 3 +S | 99=T4_QU4COR | | | | 2 + | | 97=T4_QU2COR | .##### S| | 1 + | | | 98=T4_QU3COR | | 0 +M | | | | | -1 + M| | | | | -2 + | | | | | -3 +S .############ | | | S| | -4 + | | | | | -5 .## + 96=T4_QU1COR <less>|<frequ> EACH '#' IS 19.
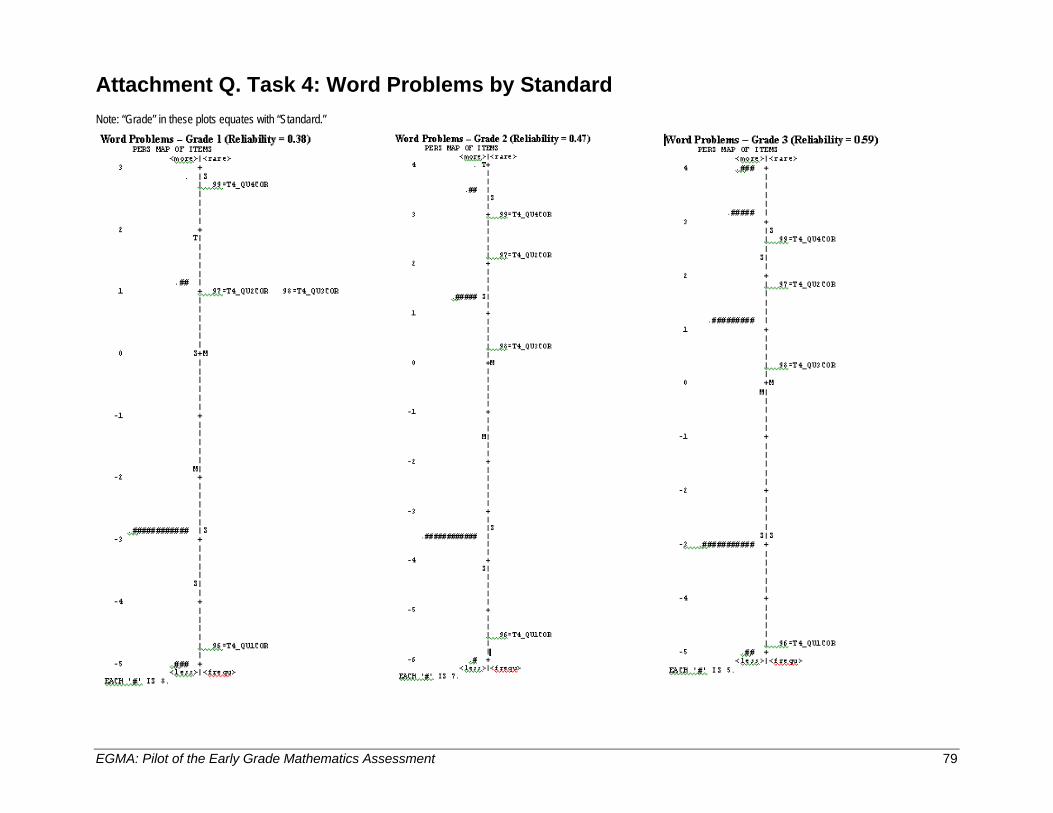
EGMA: Pilot of the Early Grade Mathematics Assessment 79
Attachment Q. Task 4: Word Problems by Standard Note: “Grade” in these plots equates with “Standard.”
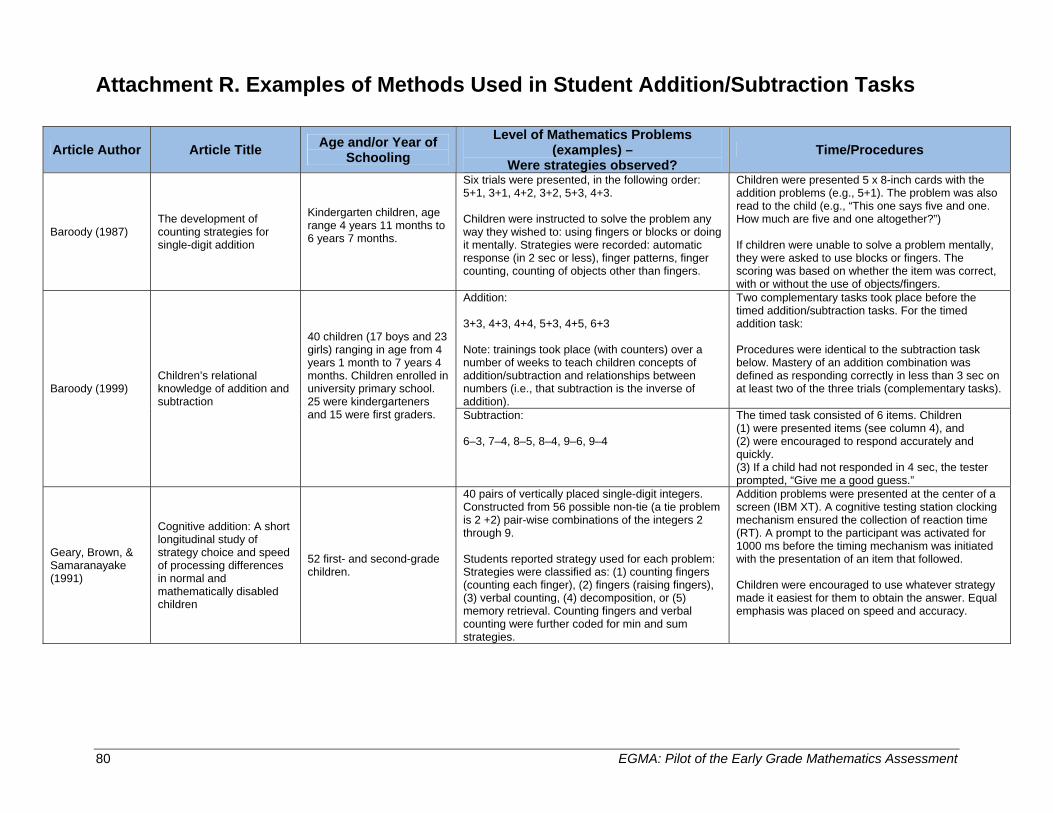
80 EGMA: Pilot of the Early Grade Mathematics Assessment
Attachment R. Examples of Methods Used in Student Addition/Subtraction Tasks
Article Author Article Title Age and/or Year of Schooling
Level of Mathematics Problems (examples) –
Were strategies observed? Time/Procedures
Baroody (1987) The development of counting strategies for single-digit addition
Kindergarten children, age range 4 years 11 months to 6 years 7 months.
Six trials were presented, in the following order: 5+1, 3+1, 4+2, 3+2, 5+3, 4+3. Children were instructed to solve the problem any way they wished to: using fingers or blocks or doing it mentally. Strategies were recorded: automatic response (in 2 sec or less), finger patterns, finger counting, counting of objects other than fingers.
Children were presented 5 x 8-inch cards with the addition problems (e.g., 5+1). The problem was also read to the child (e.g., “This one says five and one. How much are five and one altogether?”) If children were unable to solve a problem mentally, they were asked to use blocks or fingers. The scoring was based on whether the item was correct, with or without the use of objects/fingers.
Addition: 3+3, 4+3, 4+4, 5+3, 4+5, 6+3 Note: trainings took place (with counters) over a number of weeks to teach children concepts of addition/subtraction and relationships between numbers (i.e., that subtraction is the inverse of addition).
Two complementary tasks took place before the timed addition/subtraction tasks. For the timed addition task: Procedures were identical to the subtraction task below. Mastery of an addition combination was defined as responding correctly in less than 3 sec on at least two of the three trials (complementary tasks). Baroody (1999)
Children’s relational knowledge of addition and subtraction
40 children (17 boys and 23 girls) ranging in age from 4 years 1 month to 7 years 4 months. Children enrolled in university primary school. 25 were kindergarteners and 15 were first graders.
Subtraction: 6–3, 7–4, 8–5, 8–4, 9–6, 9–4
The timed task consisted of 6 items. Children (1) were presented items (see column 4), and (2) were encouraged to respond accurately and quickly. (3) If a child had not responded in 4 sec, the tester prompted, “Give me a good guess.”
Geary, Brown, & Samaranayake (1991)
Cognitive addition: A short longitudinal study of strategy choice and speed of processing differences in normal and mathematically disabled children
52 first- and second-grade children.
40 pairs of vertically placed single-digit integers. Constructed from 56 possible non-tie (a tie problem is 2 +2) pair-wise combinations of the integers 2 through 9. Students reported strategy used for each problem: Strategies were classified as: (1) counting fingers (counting each finger), (2) fingers (raising fingers), (3) verbal counting, (4) decomposition, or (5) memory retrieval. Counting fingers and verbal counting were further coded for min and sum strategies.
Addition problems were presented at the center of a screen (IBM XT). A cognitive testing station clocking mechanism ensured the collection of reaction time (RT). A prompt to the participant was activated for 1000 ms before the timing mechanism was initiated with the presentation of an item that followed. Children were encouraged to use whatever strategy made it easiest for them to obtain the answer. Equal emphasis was placed on speed and accuracy.
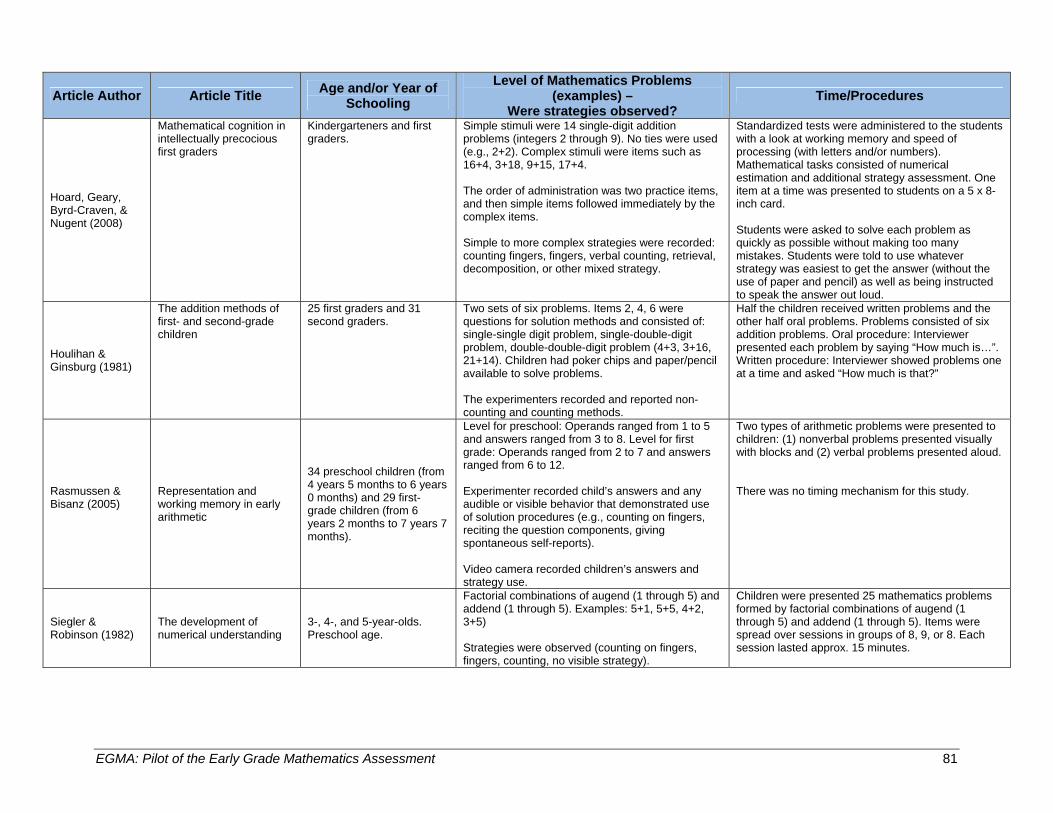
EGMA: Pilot of the Early Grade Mathematics Assessment 81
Article Author Article Title Age and/or Year of Schooling
Level of Mathematics Problems (examples) –
Were strategies observed? Time/Procedures
Hoard, Geary, Byrd-Craven, & Nugent (2008)
Mathematical cognition in intellectually precocious first graders
Kindergarteners and first graders.
Simple stimuli were 14 single-digit addition problems (integers 2 through 9). No ties were used (e.g., 2+2). Complex stimuli were items such as 16+4, 3+18, 9+15, 17+4. The order of administration was two practice items, and then simple items followed immediately by the complex items. Simple to more complex strategies were recorded: counting fingers, fingers, verbal counting, retrieval, decomposition, or other mixed strategy.
Standardized tests were administered to the students with a look at working memory and speed of processing (with letters and/or numbers). Mathematical tasks consisted of numerical estimation and additional strategy assessment. One item at a time was presented to students on a 5 x 8-inch card. Students were asked to solve each problem as quickly as possible without making too many mistakes. Students were told to use whatever strategy was easiest to get the answer (without the use of paper and pencil) as well as being instructed to speak the answer out loud.
Houlihan & Ginsburg (1981)
The addition methods of first- and second-grade children
25 first graders and 31 second graders.
Two sets of six problems. Items 2, 4, 6 were questions for solution methods and consisted of: single-single digit problem, single-double-digit problem, double-double-digit problem (4+3, 3+16, 21+14). Children had poker chips and paper/pencil available to solve problems. The experimenters recorded and reported non-counting and counting methods.
Half the children received written problems and the other half oral problems. Problems consisted of six addition problems. Oral procedure: Interviewer presented each problem by saying “How much is…”. Written procedure: Interviewer showed problems one at a time and asked “How much is that?”
Rasmussen & Bisanz (2005)
Representation and working memory in early arithmetic
34 preschool children (from 4 years 5 months to 6 years 0 months) and 29 first-grade children (from 6 years 2 months to 7 years 7 months).
Level for preschool: Operands ranged from 1 to 5 and answers ranged from 3 to 8. Level for first grade: Operands ranged from 2 to 7 and answers ranged from 6 to 12. Experimenter recorded child’s answers and any audible or visible behavior that demonstrated use of solution procedures (e.g., counting on fingers, reciting the question components, giving spontaneous self-reports). Video camera recorded children’s answers and strategy use.
Two types of arithmetic problems were presented to children: (1) nonverbal problems presented visually with blocks and (2) verbal problems presented aloud. There was no timing mechanism for this study.
Siegler & Robinson (1982)
The development of numerical understanding
3-, 4-, and 5-year-olds. Preschool age.
Factorial combinations of augend (1 through 5) and addend (1 through 5). Examples: 5+1, 5+5, 4+2, 3+5) Strategies were observed (counting on fingers, fingers, counting, no visible strategy).
Children were presented 25 mathematics problems formed by factorial combinations of augend (1 through 5) and addend (1 through 5). Items were spread over sessions in groups of 8, 9, or 8. Each session lasted approx. 15 minutes.
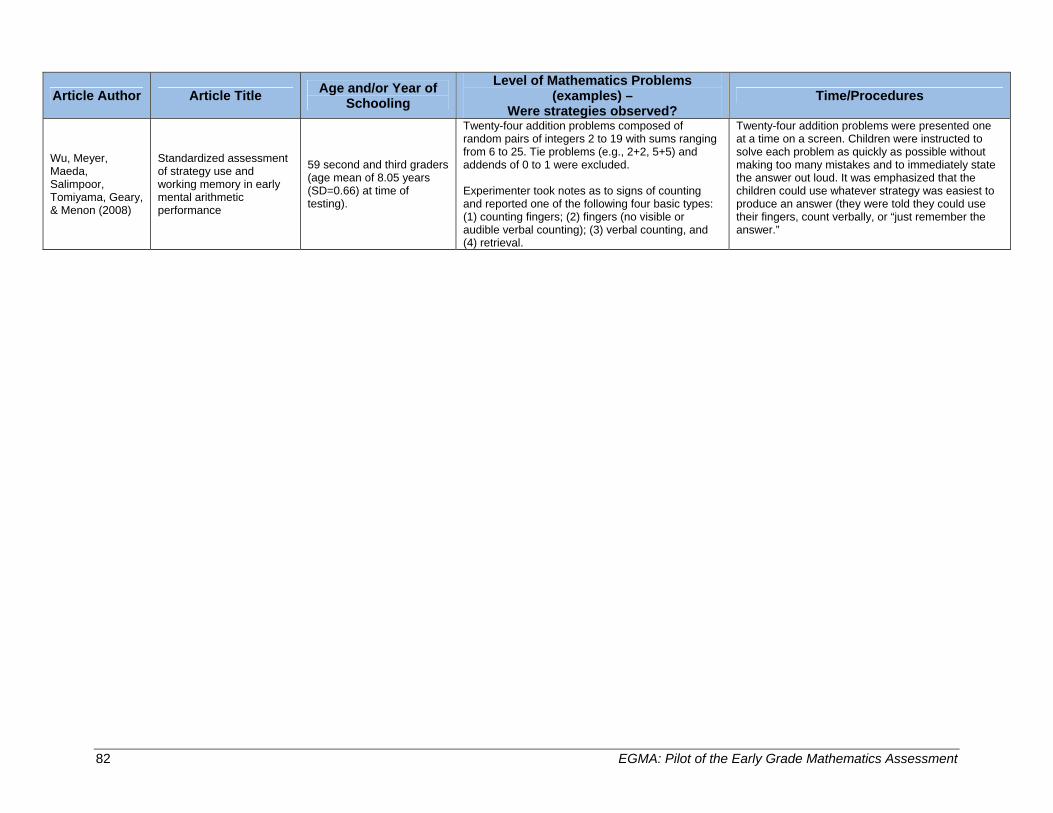
82 EGMA: Pilot of the Early Grade Mathematics Assessment
Article Author Article Title Age and/or Year of Schooling
Level of Mathematics Problems (examples) –
Were strategies observed? Time/Procedures
Wu, Meyer, Maeda, Salimpoor, Tomiyama, Geary, & Menon (2008)
Standardized assessment of strategy use and working memory in early mental arithmetic performance
59 second and third graders (age mean of 8.05 years (SD=0.66) at time of testing).
Twenty-four addition problems composed of random pairs of integers 2 to 19 with sums ranging from 6 to 25. Tie problems (e.g., 2+2, 5+5) and addends of 0 to 1 were excluded. Experimenter took notes as to signs of counting and reported one of the following four basic types: (1) counting fingers; (2) fingers (no visible or audible verbal counting); (3) verbal counting, and (4) retrieval.
Twenty-four addition problems were presented one at a time on a screen. Children were instructed to solve each problem as quickly as possible without making too many mistakes and to immediately state the answer out loud. It was emphasized that the children could use whatever strategy was easiest to produce an answer (they were told they could use their fingers, count verbally, or “just remember the answer.”
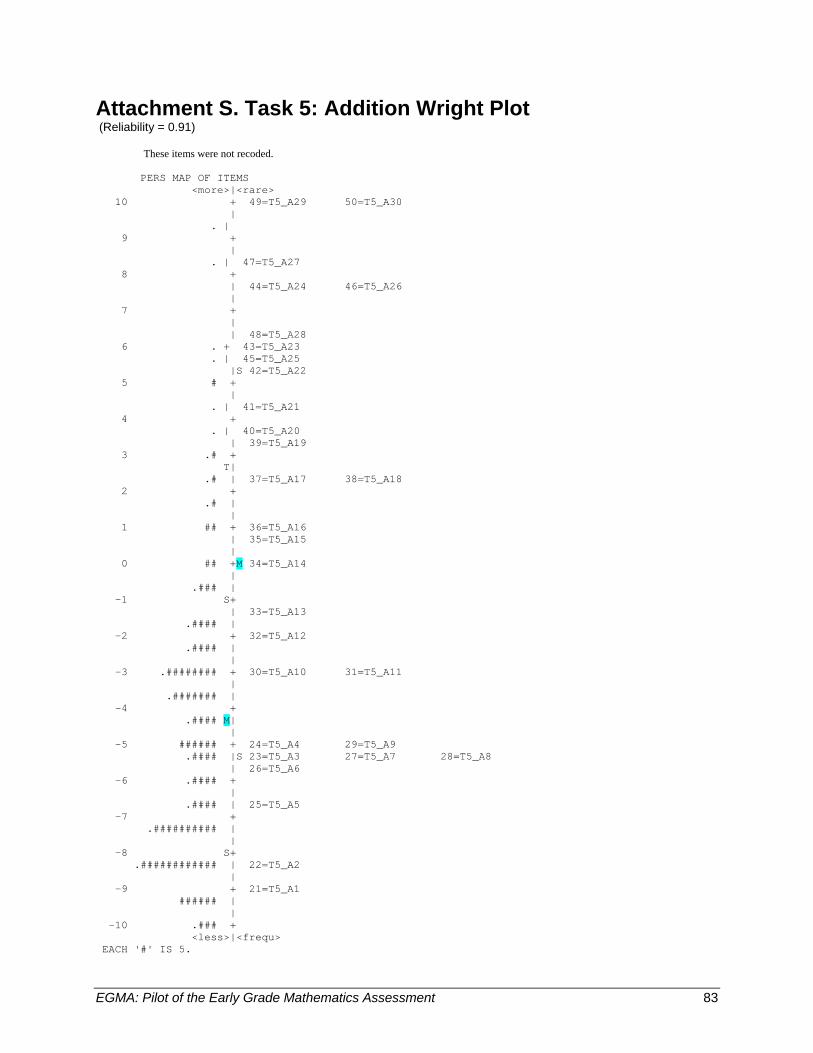
EGMA: Pilot of the Early Grade Mathematics Assessment 83
Attachment S. Task 5: Addition Wright Plot (Reliability = 0.91)
These items were not recoded. PERS MAP OF ITEMS <more>|<rare> 10 + 49=T5_A29 50=T5_A30 | . | 9 + | . | 47=T5_A27 8 + | 44=T5_A24 46=T5_A26 | 7 + | | 48=T5_A28 6 . + 43=T5_A23 . | 45=T5_A25 |S 42=T5_A22 5 # + | . | 41=T5_A21 4 + . | 40=T5_A20 | 39=T5_A19 3 .# + T| .# | 37=T5_A17 38=T5_A18 2 + .# | | 1 ## + 36=T5_A16 | 35=T5_A15 | 0 ## +M 34=T5_A14 | .### | -1 S+ | 33=T5_A13 .#### | -2 + 32=T5_A12 .#### | | -3 .######## + 30=T5_A10 31=T5_A11 | .####### | -4 + .#### M| | -5 ###### + 24=T5_A4 29=T5_A9 .#### |S 23=T5_A3 27=T5_A7 28=T5_A8 | 26=T5_A6 -6 .#### + | .#### | 25=T5_A5 -7 + .########## | | -8 S+ .############ | 22=T5_A2 | -9 + 21=T5_A1 ###### | | -10 .### + <less>|<frequ> EACH '#' IS 5.
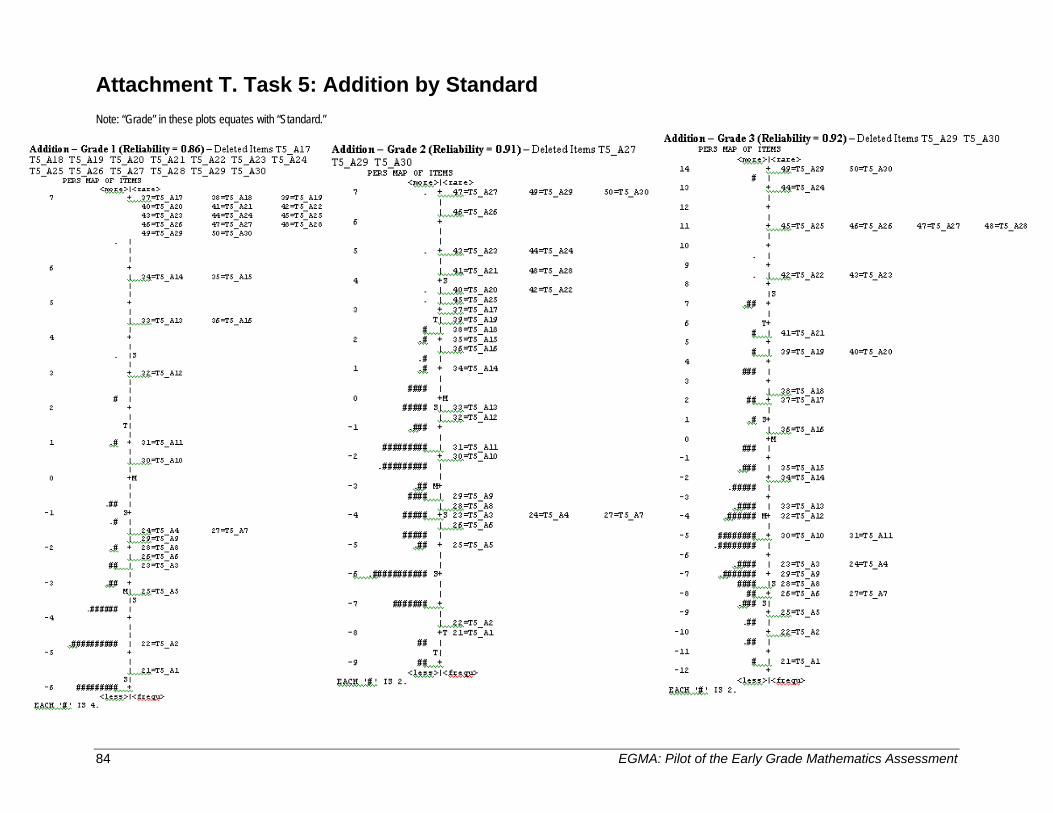
84 EGMA: Pilot of the Early Grade Mathematics Assessment
Attachment T. Task 5: Addition by Standard Note: “Grade” in these plots equates with “Standard.”
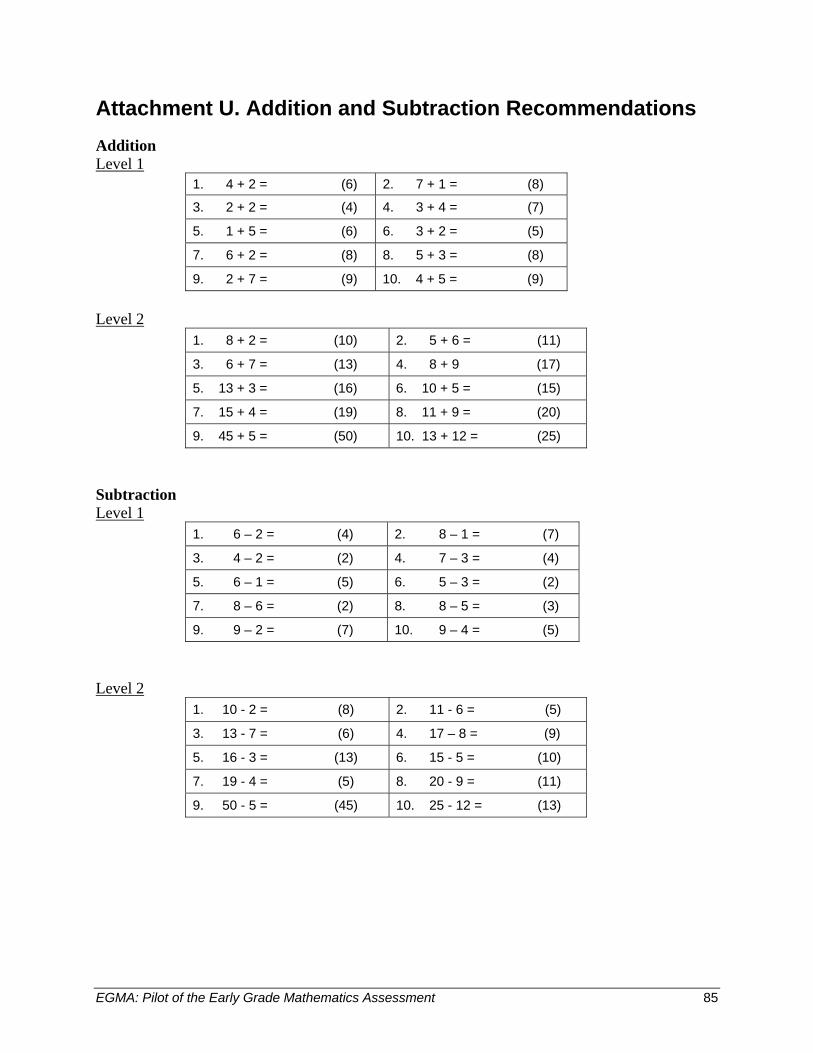
EGMA: Pilot of the Early Grade Mathematics Assessment 85
Attachment U. Addition and Subtraction Recommendations Addition Level 1
1. 4 + 2 = (6) 2. 7 + 1 = (8) 3. 2 + 2 = (4) 4. 3 + 4 = (7) 5. 1 + 5 = (6) 6. 3 + 2 = (5) 7. 6 + 2 = (8) 8. 5 + 3 = (8) 9. 2 + 7 = (9) 10. 4 + 5 = (9)
Level 2
1. 8 + 2 = (10) 2. 5 + 6 = (11)
3. 6 + 7 = (13) 4. 8 + 9 (17)
5. 13 + 3 = (16) 6. 10 + 5 = (15)
7. 15 + 4 = (19) 8. 11 + 9 = (20)
9. 45 + 5 = (50) 10. 13 + 12 = (25)
Subtraction Level 1
1. 6 – 2 = (4) 2. 8 – 1 = (7)
3. 4 – 2 = (2) 4. 7 – 3 = (4)
5. 6 – 1 = (5) 6. 5 – 3 = (2)
7. 8 – 6 = (2) 8. 8 – 5 = (3)
9. 9 – 2 = (7) 10. 9 – 4 = (5)
Level 2
1. 10 - 2 = (8) 2. 11 - 6 = (5)
3. 13 - 7 = (6) 4. 17 – 8 = (9)
5. 16 - 3 = (13) 6. 15 - 5 = (10)
7. 19 - 4 = (5) 8. 20 - 9 = (11)
9. 50 - 5 = (45) 10. 25 - 12 = (13)
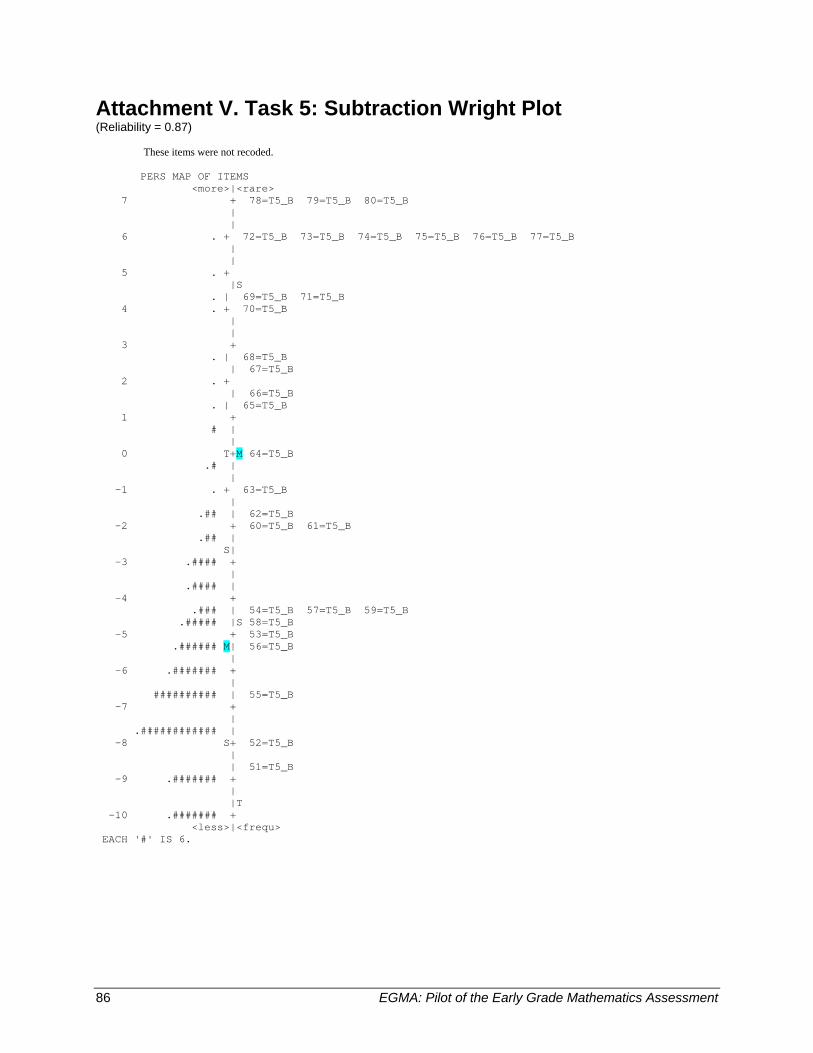
86 EGMA: Pilot of the Early Grade Mathematics Assessment
Attachment V. Task 5: Subtraction Wright Plot (Reliability = 0.87)
These items were not recoded.
PERS MAP OF ITEMS <more>|<rare> 7 + 78=T5_B 79=T5_B 80=T5_B | | 6 . + 72=T5_B 73=T5_B 74=T5_B 75=T5_B 76=T5_B 77=T5_B | | 5 . + |S . | 69=T5_B 71=T5_B 4 . + 70=T5_B | | 3 + . | 68=T5_B | 67=T5_B 2 . + | 66=T5_B . | 65=T5_B 1 + # | | 0 T+M 64=T5_B .# | | -1 . + 63=T5_B | .## | 62=T5_B -2 + 60=T5_B 61=T5_B .## | S| -3 .#### + | .#### | -4 + .### | 54=T5_B 57=T5_B 59=T5_B .##### |S 58=T5_B -5 + 53=T5_B .###### M| 56=T5_B | -6 .####### + | ########## | 55=T5_B -7 + | .############ | -8 S+ 52=T5_B | | 51=T5_B -9 .####### + | |T -10 .####### + <less>|<frequ> EACH '#' IS 6.
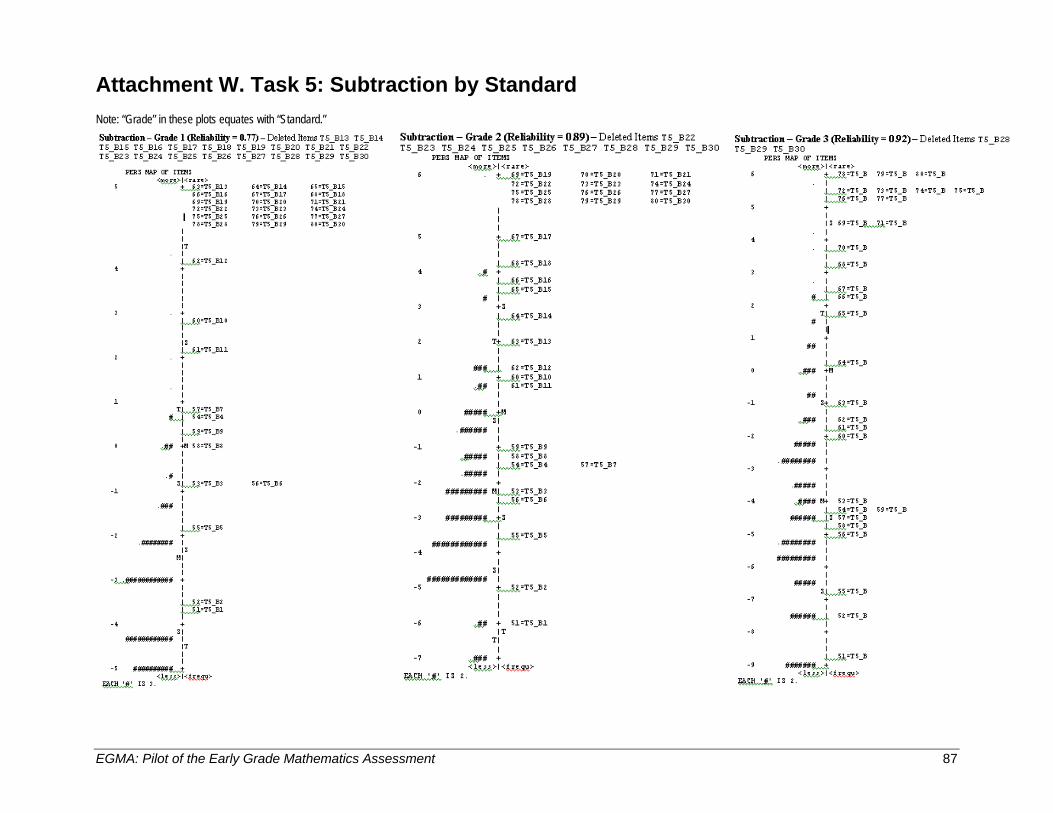
EGMA: Pilot of the Early Grade Mathematics Assessment 87
Attachment W. Task 5: Subtraction by Standard Note: “Grade” in these plots equates with “Standard.”
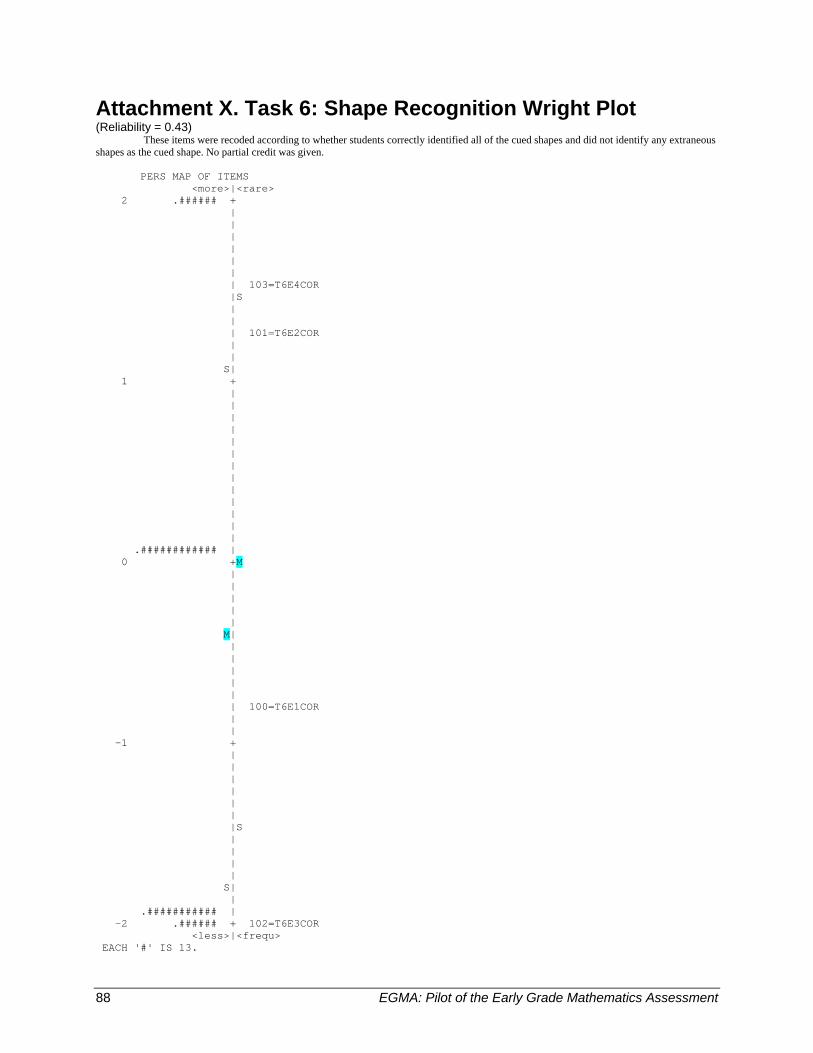
88 EGMA: Pilot of the Early Grade Mathematics Assessment
Attachment X. Task 6: Shape Recognition Wright Plot (Reliability = 0.43)
These items were recoded according to whether students correctly identified all of the cued shapes and did not identify any extraneous shapes as the cued shape. No partial credit was given. PERS MAP OF ITEMS <more>|<rare> 2 .###### + | | | | | | | 103=T6E4COR |S | | | 101=T6E2COR | | S| 1 + | | | | | | | | | | | | | .############ | 0 +M | | | | | M| | | | | | | 100=T6E1COR | | -1 + | | | | | | |S | | | | S| | .########### | -2 .###### + 102=T6E3COR <less>|<frequ> EACH '#' IS 13.
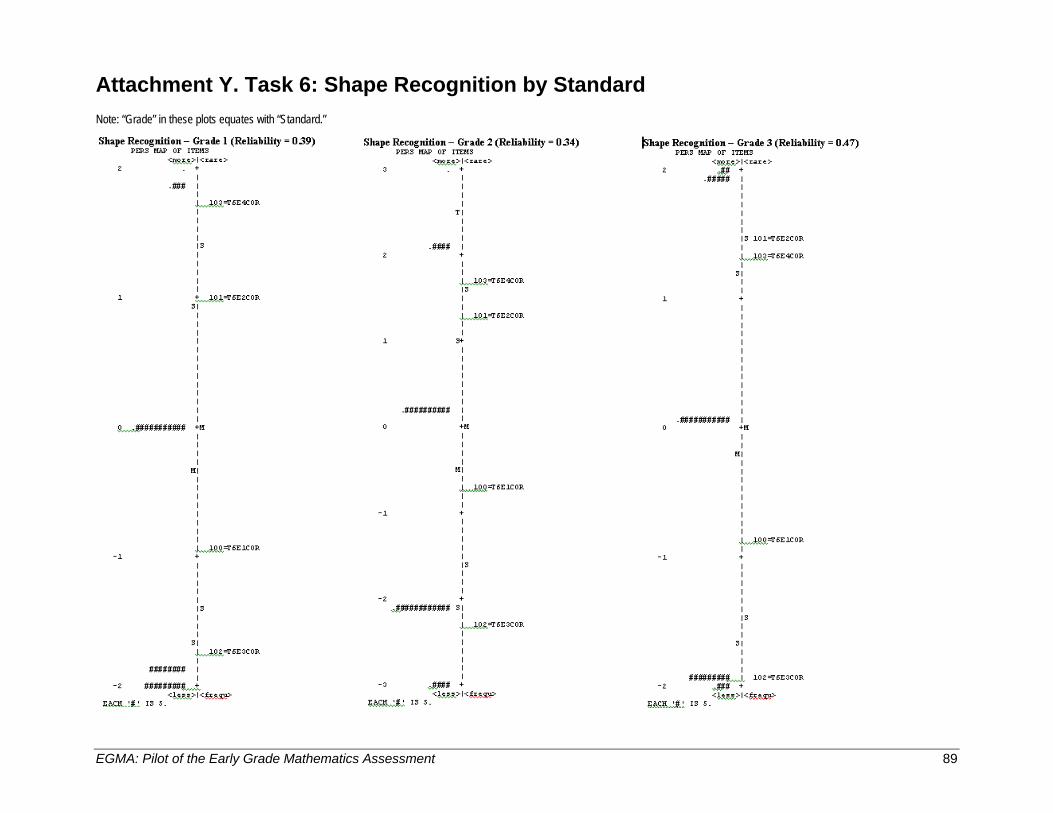
EGMA: Pilot of the Early Grade Mathematics Assessment 89
Attachment Y. Task 6: Shape Recognition by Standard Note: “Grade” in these plots equates with “Standard.”
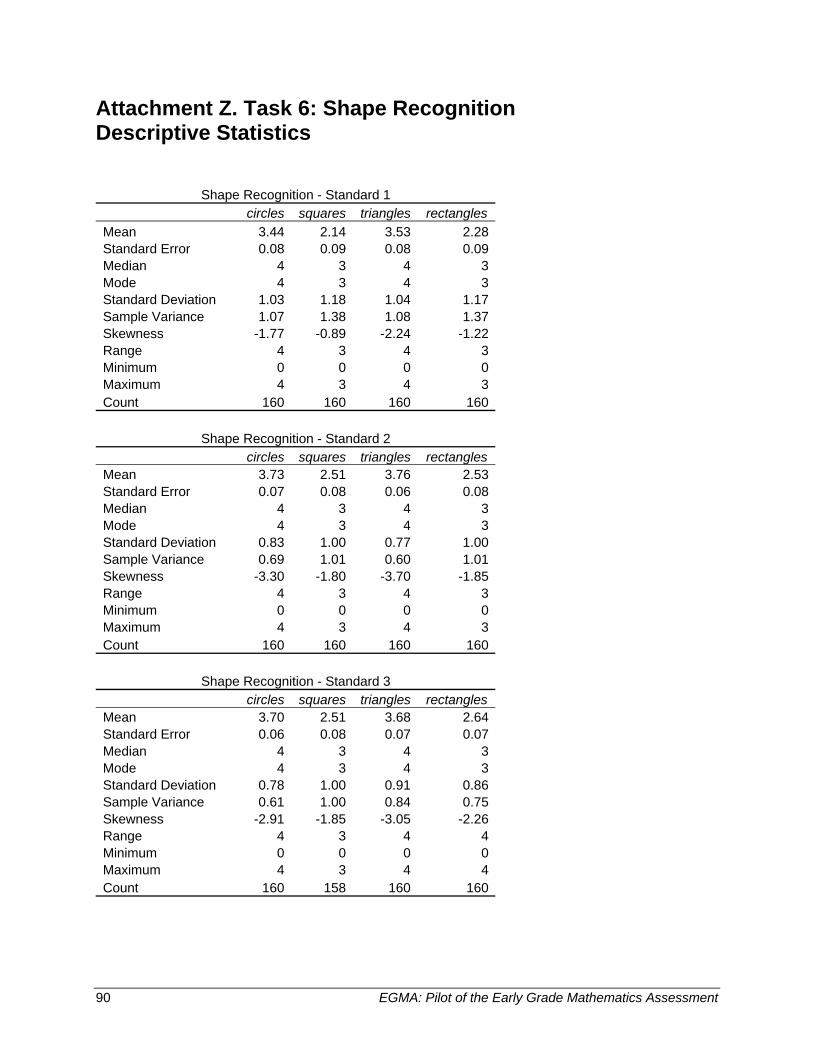
90 EGMA: Pilot of the Early Grade Mathematics Assessment
Attachment Z. Task 6: Shape Recognition Descriptive Statistics
Shape Recognition - Standard 1 circles squares triangles rectangles Mean 3.44 2.14 3.53 2.28Standard Error 0.08 0.09 0.08 0.09Median 4 3 4 3Mode 4 3 4 3Standard Deviation 1.03 1.18 1.04 1.17Sample Variance 1.07 1.38 1.08 1.37Skewness -1.77 -0.89 -2.24 -1.22Range 4 3 4 3Minimum 0 0 0 0Maximum 4 3 4 3Count 160 160 160 160
Shape Recognition - Standard 2 circles squares triangles rectangles Mean 3.73 2.51 3.76 2.53Standard Error 0.07 0.08 0.06 0.08Median 4 3 4 3Mode 4 3 4 3Standard Deviation 0.83 1.00 0.77 1.00Sample Variance 0.69 1.01 0.60 1.01Skewness -3.30 -1.80 -3.70 -1.85Range 4 3 4 3Minimum 0 0 0 0Maximum 4 3 4 3Count 160 160 160 160
Shape Recognition - Standard 3 circles squares triangles rectangles Mean 3.70 2.51 3.68 2.64Standard Error 0.06 0.08 0.07 0.07Median 4 3 4 3Mode 4 3 4 3Standard Deviation 0.78 1.00 0.91 0.86Sample Variance 0.61 1.00 0.84 0.75Skewness -2.91 -1.85 -3.05 -2.26Range 4 3 4 4Minimum 0 0 0 0Maximum 4 3 4 4Count 160 158 160 160
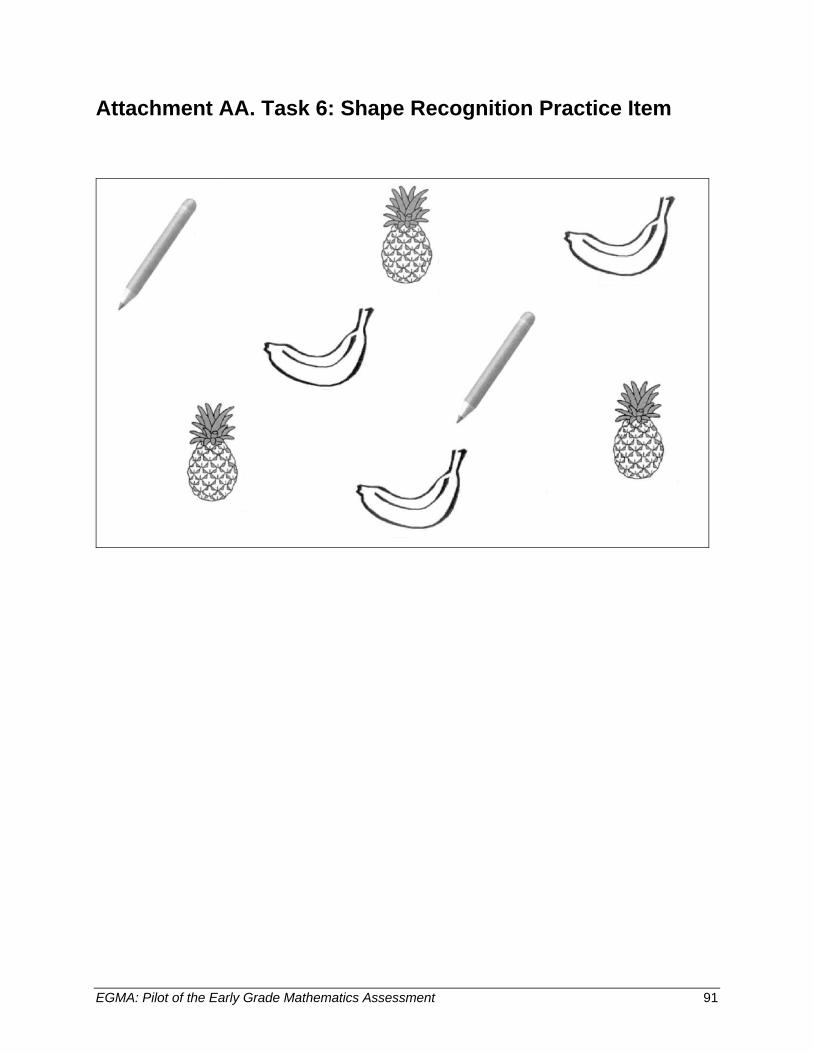
EGMA: Pilot of the Early Grade Mathematics Assessment 91
Attachment AA. Task 6: Shape Recognition Practice Item
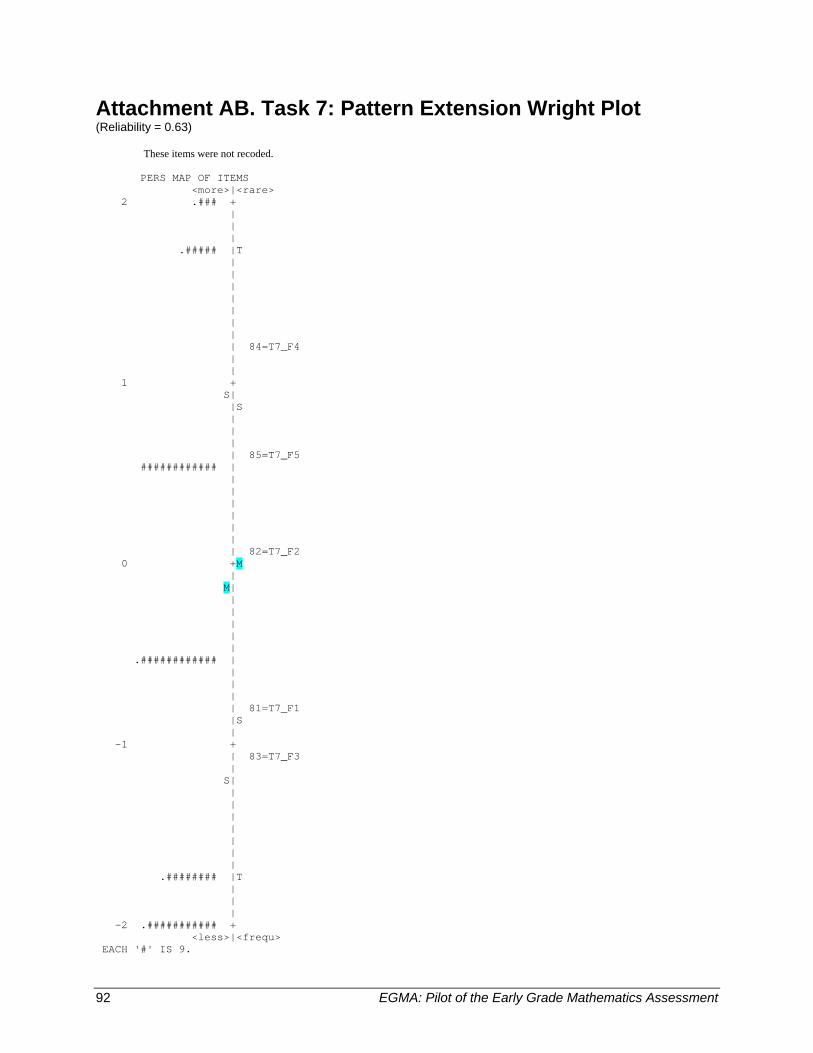
92 EGMA: Pilot of the Early Grade Mathematics Assessment
Attachment AB. Task 7: Pattern Extension Wright Plot (Reliability = 0.63)
These items were not recoded. PERS MAP OF ITEMS <more>|<rare> 2 .### + | | | .##### |T | | | | | | | | 84=T7_F4 | | 1 + S| |S | | | | 85=T7_F5 ############ | | | | | | | | 82=T7_F2 0 +M | M| | | | | | .############ | | | | | 81=T7_F1 |S | -1 + | 83=T7_F3 | S| | | | | | | | .######## |T | | | -2 .########### + <less>|<frequ> EACH '#' IS 9.
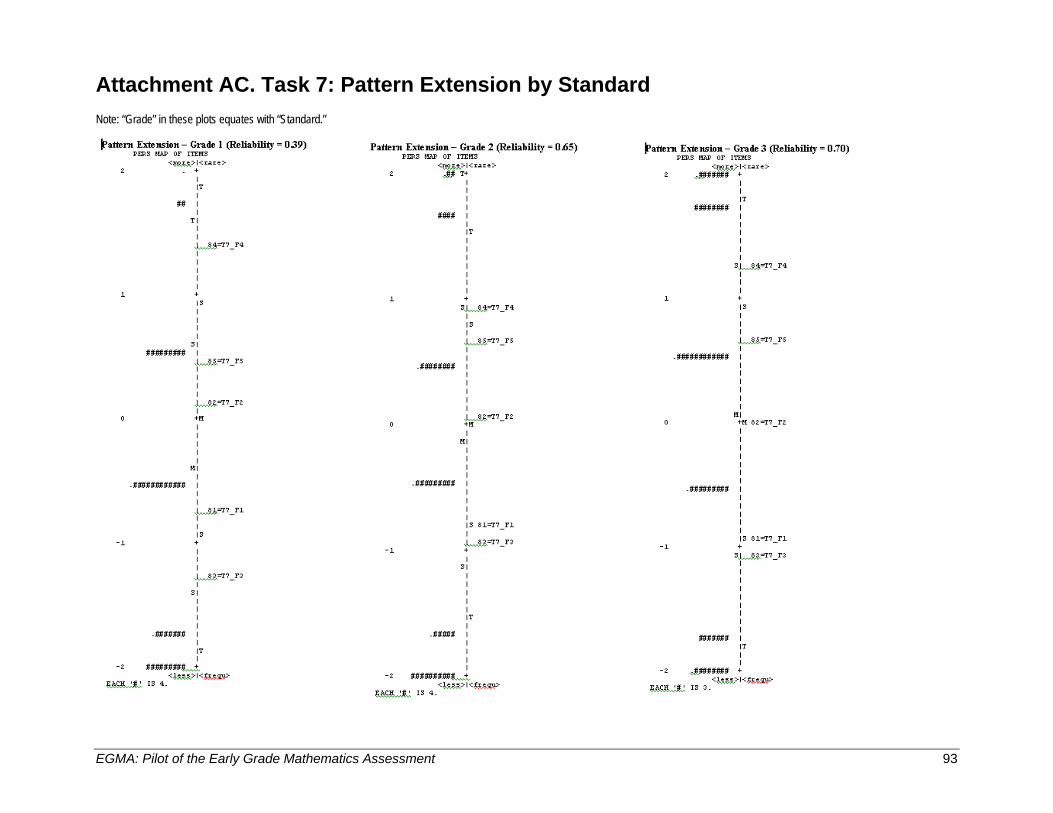
EGMA: Pilot of the Early Grade Mathematics Assessment 93
Attachment AC. Task 7: Pattern Extension by Standard Note: “Grade” in these plots equates with “Standard.”
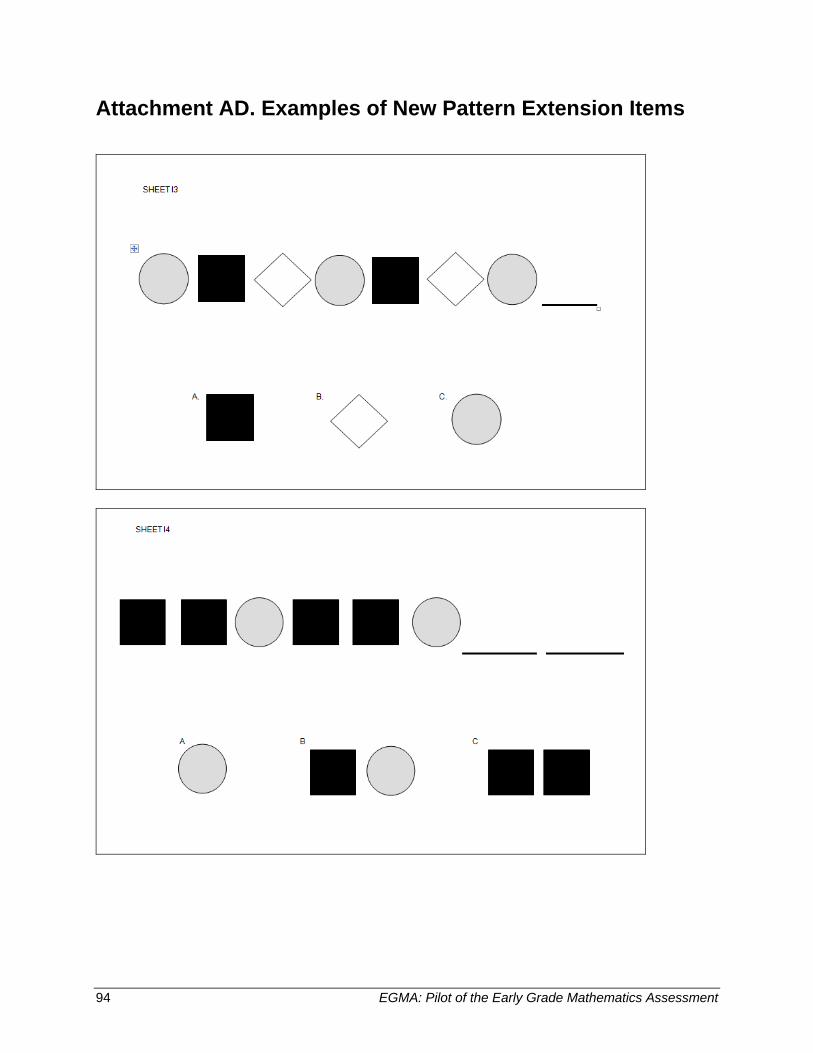
94 EGMA: Pilot of the Early Grade Mathematics Assessment
Attachment AD. Examples of New Pattern Extension Items