CAUSE Updates on Research, CAUSEweb, and USCOTS JSM 2005, Minneapolis, Minnesota.

Seasonal Effect Data Set – Resource 01
Title:Seasonal Effect Project
Overview of Teaching Resource:
This is an individual or small-group project.
The goal is to familiarize students with odds ratios, logistic regression and confounding within the general context of the clinical research setting.
Concepts covered in this activity include:
1) Calculating and providing a proper statistical interpretation of an odds ratio;
2) Associating a contingency table with a simple logistic regression;
3) Assessing confounding conceptually by applying the definition and in practice within the regression modeling framework;
4) Fitting multivariable logistic regression models and interpreting results.
Resources Needed:The resource file needed for this activity is the Seasonal Effect Data Set file, “Seasonal Effect Data Set” and is available in 3 formats:
- excel (“Seasonal Effect.xlsx”),- SAS (“Seasonal Effect.sas7bdat”), and - Stata (“Seasonal Effect.dta”)
Notes to Instructor:
This word document contains both questions and solutions.
The analyses shown were performed in JMP (note - JMP uses +1/-1 effect coding, not 0/1 effect coding). If you are using a different statistical package (e.g. – R, SAS, or STATA), you will need to edit the solution to question 2.
Contributor: David Ngendahimana 1

Seasonal Effect Data Set – Resource 01
Introduction
Colorectal surgery is associated with a high rate of surgical site infection (SSI), the latter occurring in about 11-28% of patients who undergo colorectal surgery. Complications arising from SSI significantly increase an individual’s length of hospital stay, reduce quality of life and can also lead to additional health care needs.
Among the potentially mutable risk factors for SSI are those related to challenges to the immune system, as weakened immune systems are more prone to SSI. Seasonal variations in weather and associated season related illnesses contribute significantly to immune system fluctuations. For example, infections such as cold, flu and chest infections are more common in the winter. It has been suggested that the upsurge in infections seen in the winter may be associated with lower concentration of vitamin D (25- hydroxyvitamin D). However, while much is known about the prevalence of hypovitaminosis D and season related effects on the immune system status in the general population, there is a scarcity of studies focusing on surgical patients.
The primary aim of this study was to compare the relative frequencies of surgical site infection (SSI) among patients having colorectal surgery in the winter to SSI among patients having surgery in the summer. The secondary aim was to compare rates of postoperative infections after colorectal surgery between patients with high Vitamin D concentration and those with low vitamin D concentration.
A total of 2,919 patients who underwent colorectal surgery were included in the study. Patients were divided into season surgical procedures depending on their date of surgery (spring: March 21–June 20; summer: June 21–September 22; fall: September. 23–December 20; and winter: December 21–March 20). All patients who had any measured vitamin D were considered for secondary analysis in this study. Documented vitamin D levels were obtained starting 3 months prior procedure date to 1 month after. Vitamin-D sufficiency was defined as a serum 25(OH) D level of 32 ng/mL. Vitamin-D inadequacy was defined as a serum 25(OH) D level of
< 32 ng/mL and was further divided into vitamin-D insufficiency (20 to < 32 ng/mL) and vitamin-D deficiency (< 20 ng/mL). Selected covariate information was also obtained and included, but was not limited to: demographics, diagnoses, type of procedure, and intraoperative variables (e.g. intraoperative blood transfusions and length of surgery). Pediatric patients and patients with missing covariate information were excluded from the study.
Source:The dataset represents data from a study by Turan et al. "Season and vitamin D status do not affect probability for surgical site infection after colorectal surgery " 2015; 47:341-345.
Contributor: David Ngendahimana 2

Seasonal Effect Data Set – Resource 01
Data Dictionary
Contributor: David Ngendahimana 3

Seasonal Effect Data Set – Resource 01
QUESTIONS
U s i n g form a l s t a t i s t i c a l i n fe r e n ce, ans wer t h e fo ll ow i n g c l i n i c a l q u e s t i o n s . Be s u re to p r e s e n t h yp o t h e s e s , t e s t s t a t i s t i c, p -va l u e a n d c o n c lu s i o n s w h en app ropr ia te. For s a ke of b re v i ty, y o u d o n ot h a ve to c h eck regre s s i on model assu mption s un less th e qu es tion s pecifically requ es ts it.
1. Is there an association between gender and surgical site infection (SSI)?Formally test using Pearson’s Chi-square test. Using hand calculations and your contingency table, obtain the odds of SSI for females. Next obtain the odds of SSI for males. Finally calculate the odds ratio of SSI for females compared to males. Interpret the odds ratio estimate.
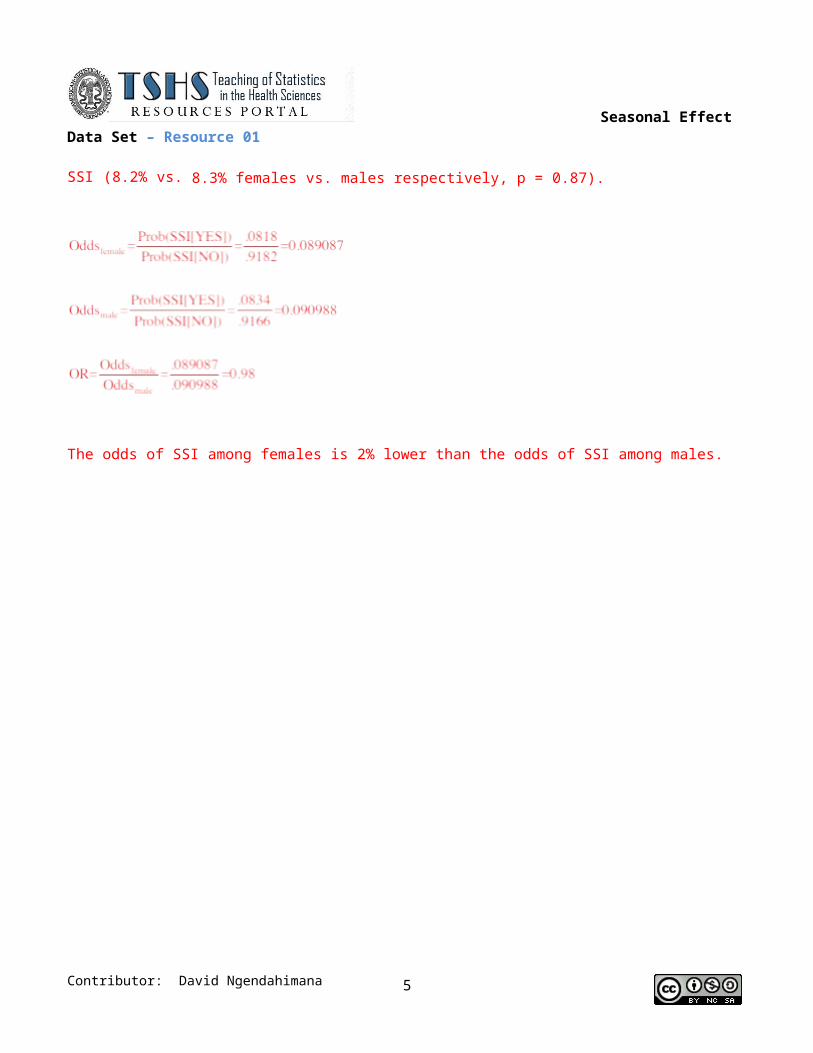
There is no statistically significant evidence that gender is associated with SSI (8.2% vs. 8.3% females vs. males respectively, p = 0.87).
Contributor: David Ngendahimana 4
Seasonal Effect Data Set – Resource 01
The odds of SSI among females is 2% lower than the odds of SSI among males.
Contributor: David Ngendahimana 5
Seasonal Effect Data Set – Resource 01
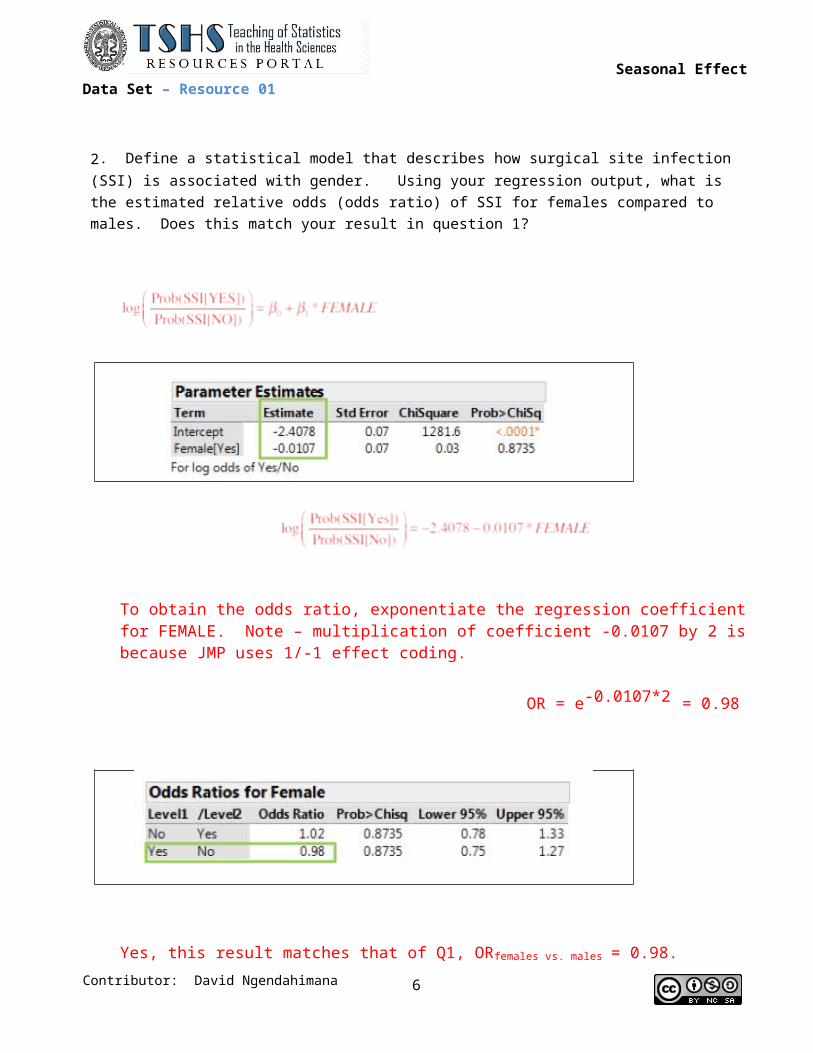
2. Define a statistical model that describes how surgical site infection (SSI) is associated with gender. Using your regression output, what is the estimated relative odds (odds ratio) of SSI for females compared to males. Does this match your result in question 1?
To obtain the odds ratio, exponentiate the regression coefficient for FEMALE. Note – multiplication of coefficient -0.0107 by 2 is because JMP uses 1/-1 effect coding. OR = e-0.0107*2 = 0.98
Yes, this result matches that of Q1, ORfemales vs. males = 0.98.
Contributor: David Ngendahimana 6

Seasonal Effect Data Set – Resource 01
3. Graphically examine the relationship between age and season (winter versus summer) of surgery. Comment briefly on whether there is visually an association between age and season of surgery. In particular, does the data suggest that age differs (increases or decreases) by season of surgery? Then, using an appropriate statistical method, formally test whether age is associated with season of surgery (two sided). Restrict analyses to subjects having surgery during the winter of summer.
Visualization of the data suggests that individuals having surgery in winter and summer are on average the same age.
Now conduct a two-sample t-test, but first check the assumption of equal variances.
H0: σ2Winter = σ2SummerH1: σ2Winter ≠ σ2Summer
Tests that the variance are equal
Not statistically significant (p-value = .62). No evidence of heteroskedasticity. Thus, we may assume equal variances.
Contributor: David Ngendahimana 7

Seasonal Effect Data Set – Resource 01
Two Sample t-test
H0: μWinter = μSummer
H1: μWinter ≠ μSummer
There is no statistically significant evidence that age is associated with season of surgery (mean age winter vs. summer 52.0 vs. 52.3, p = 0.68).
4. Graphically examine the relationship between age and SSI. Comment briefly on whether there is visually an association between age and SSI. Then, using an appropriate statistical method, formally test whether age is associated with SSI. Restrict analyses to subjects having surgery during the winter or summer.
Visualization of the data suggests that the age distributions are similar for those developing SSI and those not developing SSI.
Contributor: David Ngendahimana 8

Seasonal Effect Data Set – Resource 01
Now conduct a two-sample independent t test, but first check variance homogeneity assumption.
H0: σ2SSI = σ2
No SSI
H1: σ2SSI ≠ σ2No SSI
Tests of Equality of Variances
No evidence of variance heteroskedasticity, thus we assume equal variances.
Two Sample t-Test
H0: μSSI = μNo SSI
H1: μSSI ≠ μNo SSI
In the subset of surgeries occurr ing in the winter and summer, there is no statistically significant evidence that age is associated with SSI (mean age SSI vs. no SSI 52.4 vs. 52.2, p =0.87).
Contributor: David Ngendahimana 9

Seasonal Effect Data Set – Resource 01
5. By definition, a variable must be associated with the exposure of interest and the outcome (but not in the causal pathway) to be a confounder. Based on this definition and the results of questions 3 and 4, is age a p o t e nti a l confounder in the relationship between season (winter vs. summer) of surgery and SSI?
Since age is not associated with season of surgery (Q3) nor is age associated with SSI (Q4), there is no statistically significant evidence that age is a confounder of the relationship between season of surgery and SSI.
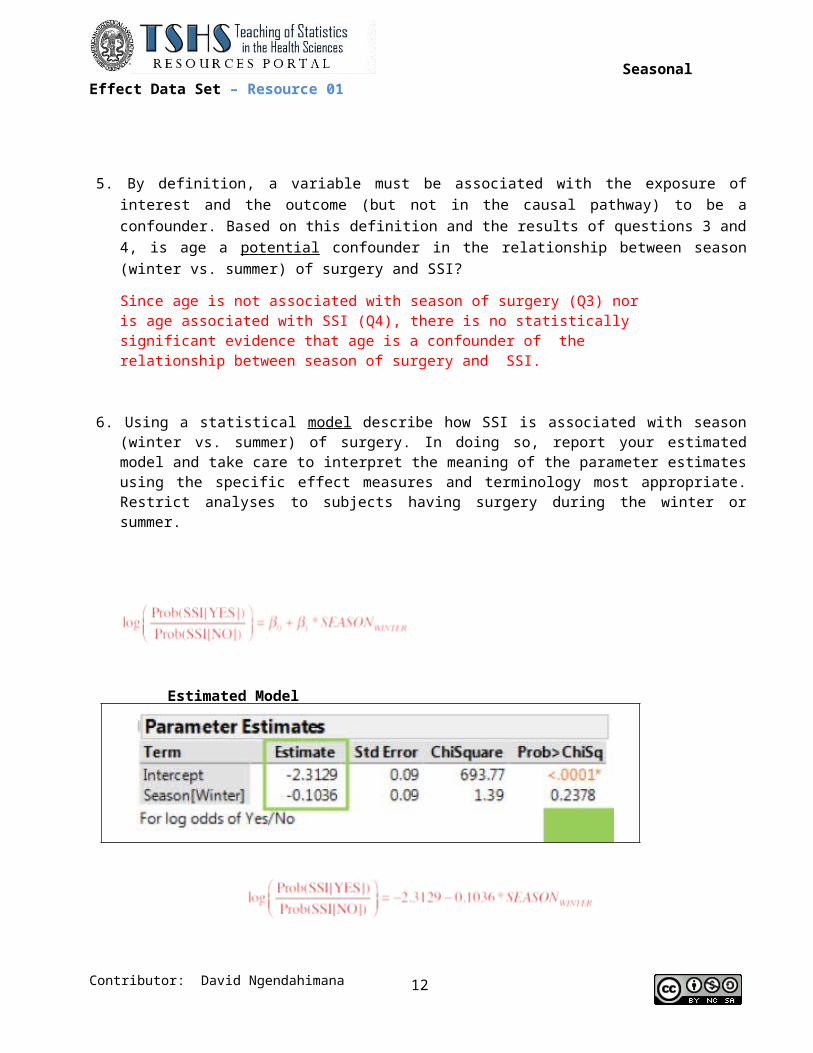
6. Using a statistical m o d e l describe how SSI is associated with season (winter vs. summer) of surgery. In doing so, report your estimated model and take care to interpret the meaning of the parameter estimates using the specific effect measures and terminology most appropriate. Restrict analyses to subjects having surgery during the winter or summer.
Estimated Model
The odds of SSI decrease 19% for surgeries performed in winter compared to summer (OR = 0.81, 95% CI (0.57, 1.14)). Since the CI for the OR contains 1, this decrease in odds is not statistically significant.
Contributor: David Ngendahimana 10

Seasonal Effect Data Set – Resource 01
7. Using an appropriately defined statistical model, describe how SSI is associated with season (winter versus summer) of surgery adjusting for age. Using this model and that of the previous question, demonstrate how one can statistically assess whether or not age confounds the relationship between SSI and season of surgery. Does your conclusion match that of question 5? Restrict analyses to subjects having surgery during the winter or summer.
Fit model without potential confounder (Q6):
Fit model with potential confounder:
Assess how much the regression coefficient for season changes when age is added to the model:
The coefficient for the predictor SEASON[WINTER] changes negligibly, by an estimated one tenth of 1%, with the inclusion of age in the model. Thus, there is no statistically significant evidence that age is confounder of the relationship between season of surgery and SSI. This conclusion matches that of question 5.
Contributor: David Ngendahimana 11
Seasonal Effect Data Set – Resource 01
8. Using an appropriately defined statistical model, describe how SSI is assocated with season (winter vs. summer) of surgery adjusting for BMI, race, gender, diabetes status, chronic renal failure, preoperative steroids, ASA status, red blood cell count and duration of surgery. Which variables are statistically significantly associated with SSI? Interpret the appropriate effect measure for this model relating season (winter vs. summer) to SSI. Interpret the appropriate effect measure for this model relating duration of surgery to SSI. Restrict analyses to subjects having surgery during the winter or summer.
Use the effects tests to assess which variables are associated with SSI.
Diabetes and duration of surgery are associated with SSI (p = 0.003 and p < .0001 respectively).
Contributor: David Ngendahimana 12

Seasonal Effect Data Set – Resource 01
The odds of SSI is 22% lower among winter surgery patients, relative to summer surgery patients, but is not statistically significant. (OR =0.78, 95% CI (0.55, 1.11)).
A one-hour increase in duration of surgery is associated with a 25% increase in the odds of a SSI (OR = 1.25, 95% CI (1.15, 1.36)), after adjusting for other covariates.
Contributor: David Ngendahimana 13