ED 398 978 JC 960 537 AUTHOR Sarkar, Gerlinde TITLE ... · Table 5 Where have you taken this...
37
DOCUMENT RESUME ED 398 978 JC 960 537 AUTHOR Sarkar, Gerlinde TITLE SIAST Longitudinal Study. INSTITUTION Saskatchewan Inst. of Applied Science and Technology, Saskatoon. REPORT NO SIAST-95-10 PUB DATE Jul 95 NOTE 40p.; For the 1991 retention study, see JC 960 535. PUB TYPE Reports Research/Technical (143) Tests /Evaluation Instruments (160) EDRS PRICE MF01/PCO2 Plus Postage. DESCRIPTORS Comparative Analysis; *Enrollment Influences; Followup Studies; Foreign Countries; Longitudinal Studies; *Outcomes of Education; *Student Attitudes; *Student Behavior; *Student Characteristics; *Student Educational Objectives; Technical Institutes; Two Year Colleges IDENTIFIERS Saskatchewan Institute of Applied Sci and Techn ABSTRACT In 1991, the Saskatchewan Institute Of Applied Science and Technology (SIAST) initiated a study of factors affecting student persistence, finding that high employment rates in particular sectors were related to higher rates of student attrition. In 1994, a follow-up study was conducted of the career/educational paths of 1,498 respondents from the 1991 study to determine whether students who continued training demonstrated significantly different characteristics, attitudes, and beliefs than those who did not. Major findings, based on 409 responses, included the following: (1) by 1994, 85% of the students had completed their SIAST program, 29% had enrolled in some further training, while only 6% of those continuing had changed their field of study, generally going into computer related fields; (2) the most common reason cited for continuing training was improved job prospects as a result of more education; (3) students who continued their education had expressed higher career goals in the 1991 study than those who did not; (4) program completers had higher academic averages before entering SIAST in 1991 than non-completers; and (5) 27.7% of those who continued had attended university before starting their SIAST program, compared to 22.2% of all first year students. Data tables are included. The survey instrument is appended. (HAA) *********************************************************************** Reproductions supplied by EDRS are the best that can be made from the original document. ***********************************************************************
Transcript of ED 398 978 JC 960 537 AUTHOR Sarkar, Gerlinde TITLE ... · Table 5 Where have you taken this...

DOCUMENT RESUME
ED 398 978 JC 960 537
AUTHOR Sarkar, GerlindeTITLE SIAST Longitudinal Study.INSTITUTION Saskatchewan Inst. of Applied Science and Technology,
Saskatoon.REPORT NO SIAST-95-10PUB DATE Jul 95NOTE 40p.; For the 1991 retention study, see JC 960
535.
PUB TYPE Reports Research/Technical (143)Tests /Evaluation Instruments (160)
EDRS PRICE MF01/PCO2 Plus Postage.DESCRIPTORS Comparative Analysis; *Enrollment Influences;
Followup Studies; Foreign Countries; LongitudinalStudies; *Outcomes of Education; *Student Attitudes;*Student Behavior; *Student Characteristics; *StudentEducational Objectives; Technical Institutes; TwoYear Colleges
IDENTIFIERS Saskatchewan Institute of Applied Sci and Techn
ABSTRACTIn 1991, the Saskatchewan Institute Of Applied
Science and Technology (SIAST) initiated a study of factors affectingstudent persistence, finding that high employment rates in particularsectors were related to higher rates of student attrition. In 1994, afollow-up study was conducted of the career/educational paths of1,498 respondents from the 1991 study to determine whether studentswho continued training demonstrated significantly differentcharacteristics, attitudes, and beliefs than those who did not. Majorfindings, based on 409 responses, included the following: (1) by1994, 85% of the students had completed their SIAST program, 29% hadenrolled in some further training, while only 6% of those continuinghad changed their field of study, generally going into computerrelated fields; (2) the most common reason cited for continuingtraining was improved job prospects as a result of more education;(3) students who continued their education had expressed highercareer goals in the 1991 study than those who did not; (4) programcompleters had higher academic averages before entering SIAST in 1991than non-completers; and (5) 27.7% of those who continued hadattended university before starting their SIAST program, compared to22.2% of all first year students. Data tables are included. Thesurvey instrument is appended. (HAA)
***********************************************************************
Reproductions supplied by EDRS are the best that can be madefrom the original document.
***********************************************************************

00
00CTCr)
(21
SIASTLongitudinal Study
Prepared by:
SIAST Research and Development
July 199595-10
::411 SIASTSASKATCHEWAN INSTITUTE OFAPPLIED SCIENCE AND TECHNOLOGY
U.S. DEPARTMENT OF EDUCATIONOffice of Educational Research and improvement
EDUCATIONAL RESOURCES INFORMATIONACENTER (ERIC)
This document has been reproduced aSerceivec1 from the person or organization
originating itO Minor changes have been made to improve
reproduction duality
PERMISSION TO REPRODUCE ANDDISSEMINATE THIS MATERIAL
HAS BEEN GRANTED BY
G. Sarkar
e Points Of mew or opinions stated in this docu-ment do not necessarily represent official TO THE EDUCATIONAL RESOURCESOERI position or policy INFORMATION CENTER (ERIC)
BEST COPY AVAILABLE
Saskatchewan Institute of Applied
Science and Technology
SIAST Longitudinal Study
Prepared by:
SIAST Research and Development
Saskatchewan Institute of Applied Science & Technology ©
July 1995
Reproduction of the report or parts thereof are permitted provided
proper acknowledgements are made.
3
Table of Contents
Acknowledgements 1
Executive Summary 2
1.0 Introduction 4
1.1 Background 41.2 Objective of the Longitudinal Study 41.3 Applications 4
2.0 Methodology 5
3.0 Other Research in This Area 6
4.0 Results of the Study 7
4.1 Responses to the Part III Questionnaire 7
4.1.1 Program Completion 8
4.1.2 Continuing Students 9
4.1.3 Reasons for Continuing Education 10
4.1.4 Present Status 11
4.1.5 Intent to Pursue Further Training 12
4.2 Comparison to Responses of Part I and II 13
4.2.1 Goal Commitment 13
4.2.2 Academic Background 15
4.2.3 Demographic Characteristics 16
5.0 Conclusion 18
6.0 Implications 19
7.0 References 20
Appendix A - Summary of Respondents
Appendix B - Questionnaire
Appendix C - Comments (under separate cover)
4

List of Tables
Table 1 Response Rates and Percent Continuing By Institute 7
Table 2 In what SIAST program were you enroled in September 1991? 8
Table 3 Did you complete the 1991 program? 8
Table 4 When was the 1991 program completed? 8
Table 5 Where have you taken this additional training? 9
Table 6 Why did you take the training after the 1991 program? 10
Table 7 Why did you not complete this additional training? 10
Table 8 What is your present status? 11
Table 9 Are you currently working in the field in which you trained inSeptember 1991? 12
Table 10 High School Grades 15

Acknowledgements
This report is the result of three separate surveys and required the cooperation of a number of people.I would like to express my appreciation to two people in particular who have played a significant rolethroughout all phases of the report and especially this last phase, which is Part III of the original SIASTRetention Study.
I would like to thank:
Claire Stallard, Research and Development Services, SIAST Secretariat, who coordinated the dataentry, conducted the statistical analysis of the data, and prepared the graphical representations; and
Michele Conn, Research and Development Services, SIAST Secretariat, who coordinated the projectfrom the mailing of the questionnaires for all three parts, to the typing of the text and tables and the lay-out and production of the final report.
We would also like to thank those students who responded to the three surveys and provided valuablecomments.
Gerlinde SarkarCoordinator, Research and DevelopmentSIAST SecretariatJuly 1995
6
SIAST Longitudinal Study Page 1

Executive Summary
This Longitudinal Study is a continuation (Part III) of the 1991 SIAST Retention Study, in which we foundthat student attrition rates show a strong positive correlation with employment rates in particularoccupational sectors. In other words, if it is relatively easy to find employment, students are more likelyto leave before completing their program of study. If employment rates are low in that occupation, thenstudents are more likely to persist in order to gain the extra edge in the employment market.
The purpose of this Longitudinal Study was to follow the career paths of previous SIAST students andto determine whether students who continue training demonstrate significantly different characteristics,attitudes, and beliefs.
The major findings are as follows:
85% of first year students (in 1991) who responded to the study have completed their program.
29% of all previous students who responded to Part III had enroled in some further training afterthe 1991 program.
53% of those having taken further training took this at a SIAST institute and 19% took it at auniversity.
Only 6% of those continuing had changed their field of study by 1994, generally going intocomputer related areas. The majority of the additional training was in the same field of study asthe first program.
32% of respondents to Part III in 1994 indicated that they are planning to pursue furthereducation.
16% of the 1994 respondents would like to take further education at the university level.
10% of the 1994 respondents plan to change their career field.
Perceived improved job prospects as a result of more education was the major reason forcontinuing education.
Continuers were less sure about their career choice in 1991.
Continuers indicated a higher career goal in 1991.
Continuers (and completers) believed more strongly that completing a certificate or diplomawould help them find employment.
Continuers believed more strongly (in 1991) that they would be able to earn a higher income witha completed certificate or diploma.
Fewer completers and continuers said in 1991 that they would take a job right now in preferenceto first finishing the program.
Completers had the highest academic average before entering the program in 1991.
Page 2 SIAST Longitudinal Study
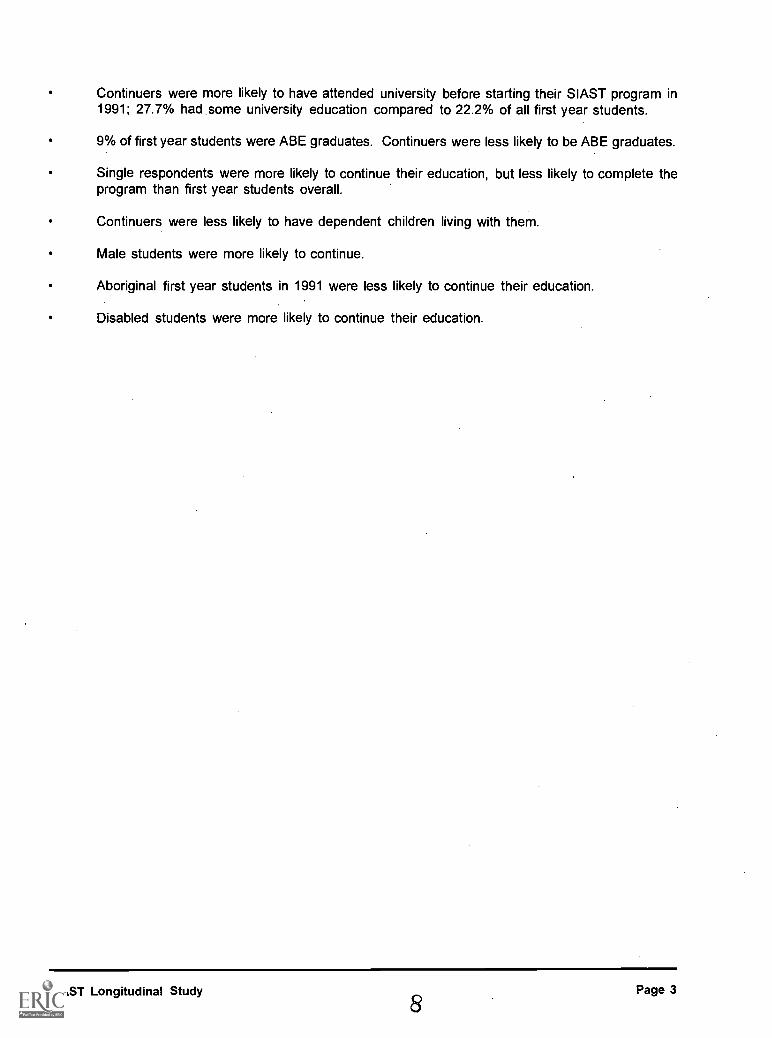
Continuers were more likely to have attended university before starting their SIAST program in1991; 27.7% had some university education compared to 22.2% of all first year students.
9% of first year students were ABE graduates. Continuers were less likely to be ABE graduates.
Single respondents were more likely to continue their education, but less likely to complete theprogram than first year students overall.
Continuers were less likely to have dependent children living with them.
Male students were more likely to continue.
Aboriginal first year students in 1991 were less likely to continue their education.
Disabled students were more likely to continue their education.
SIAST Longitudinal Study Page 3
8
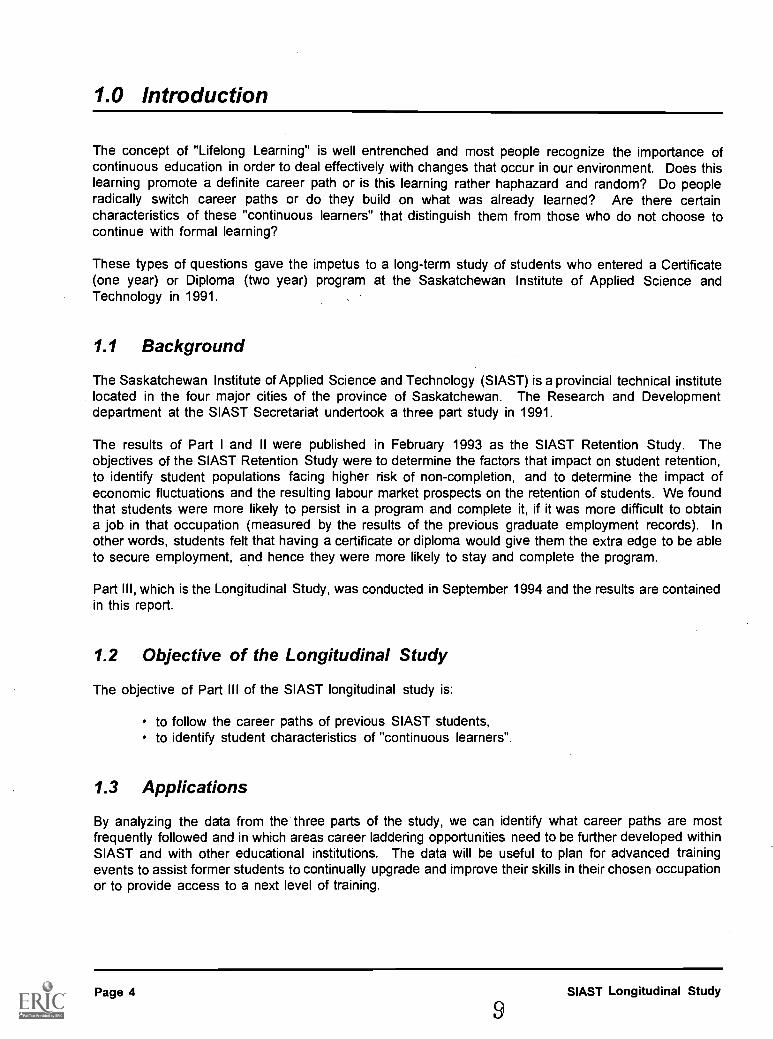
1.0 Introduction
The concept of "Lifelong Learning" is well entrenched and most people recognize the importance ofcontinuous education in order to deal effectively with changes that occur in our environment. Does thislearning promote a definite career path or is this learning rather haphazard and random? Do peopleradically switch career paths or do they build on what was already learned? Are there certaincharacteristics of these "continuous learners" that distinguish them from those who do not choose tocontinue with formal learning?
These types of questions gave the impetus to a long-term study of students who entered a Certificate(one year) or Diploma (two year) program at the Saskatchewan Institute of Applied Science andTechnology in 1991.
1.1 Background
The Saskatchewan Institute of Applied Science and Technology (SIAST) is a provincial technical institutelocated in the four major cities of the province of Saskatchewan. The Research and Developmentdepartment at the SIAST Secretariat undertook a three part study in 1991.
The results of Part I and II were published in February 1993 as the SIAST Retention Study. Theobjectives of the SIAST Retention Study were to determine the factors that impact on student retention,to identify student populations facing higher risk of non-completion, and to determine the impact ofeconomic fluctuations and the resulting labour market prospects on the retention of students. We foundthat students were more likely to persist in a program and complete it, if it was more difficult to obtaina job in that occupation (measured by the results of the previous graduate employment records). Inother words, students felt that having a certificate or diploma would give them the extra edge to be ableto secure employment, and hence they were more likely to stay and complete the program.
Part III, which is the Longitudinal Study, was conducted in September 1994 and the results are containedin this report.
1.2 Objective of the Longitudinal Study
The objective of Part III of the SIAST longitudinal study is:
to follow the career paths of previous SIAST students,to identify student characteristics of "continuous learners".
1.3 Applications
By analyzing the data from the three parts of the study, we can identify what career paths are mostfrequently followed and in which areas career laddering opportunities need to be further developed withinSIAST and with other educational institutions. The data will be useful to plan for advanced trainingevents to assist former students to continually upgrade and improve their skills in their chosen occupationor to provide access to a next level of training.
Page 4 SIAST Longitudinal Study
2.0 Methodology
The data for all three parts of the study were obtained by using questionnaires that were mailed to theparticipants of the study. For Part I, a questionnaire was mailed in September 1991 to all first year on-campus SIAST Certificate and Diploma students (2,822) registered at that time.
For Part II, a follow-up questionnaire was mailed in June 1992 to all respondents of Part I (1,557).In September 1994, questionnaires were mailed to the respondents of Part I (less undeliverable surveysfrom Part II). 1,498 questionnaires were sent out. We received 409 completed questionnaires. By thistime many former students had moved and it was difficult to trace their present location. The results ofthe longitudinal study are based on the 409 responses.
SIAST Longitudinal Study 10 Page 5
3.0 Other Research in This Area
Annual participation rates in Canadian adult education have increased from about 4% in 19601 to 20%in 1983 with further steady increases since then2.
According to the OISE Survey of Educational Issues, which drew on the Gallup Poll3, the generalparticipation in adult education was 21% in 1986 and 31% in 1990.
People's motives for participating in continuing education activities have changed over the years.General personal development was cited as the most important reason in earlier years. In the 1980s,employment related objectives became more important'. This shift is in accord with the publicperception that recent technological changes increase the skill and training requirements for individualtypes of jobs and the labour force in generals.
The participation and growth in demand for continuing education has continued to grow despite persistentbarriers such as the obstacles of very limited financial support from either employer or government, lackof accessible information about or coordination between educational agencies, and restrictive admissionand scheduling practices6.
The most notable yet disturbing finding in the research about the demand for advanced or continuingadult education is the chronic under utilization within the paid workplaces. Researchers have extensivelydocumented a tendency for many employers to inflate required entry credentials beyond educationactually needed to perform job tasks. (Berg, 1970; Collins, 1979; Blackburn and Mann, 1979; Hunter1988). These researchers have found that about one-fifth of the entire employed labour force areunderemployed. At least one third of all workers under twenty-five and more than one-third of all workerswith post-secondary credentials are now underemployed in Ontario. Other Canada-wide surveys ofrecent post-secondary graduates confirm this trend (Clark and Zsigmond 1981; Nobert, 1990).
To resolve the discrepancies between the popular educational demands of adults and the chronicworkplace under utilization of workers at their workplace, greater choice must be provided to the"continuing learners" to choose incremental formal, customized short-term studies which meet theirspecific educational needs.
1 Selman, G., and P. Dampier (1991). The Foundations of Adult Education in Canada. Toronto: Thompson EducationalPublishing.
2Devereaux, M. (1985). One in Every Five. Ottawa: Statistics Canada and Education Support Section, Secretary of State.
3Gallup Canada (1990). "1 in 4 Adults Set for Classes." Toronto Star. (15 Nov.) A14.
4 Waniewiez, I. (1976). Demand for Part-time Learning in Ontario. Toronto: OISE/OELA.
5 Livingstone, D.W., D. Hart and L. Davie (1991). Public Attitude Toward Education in Ontario. Toronto: OISE.
6 Canadian Association for Adult Education (1982). From the adult's point of view. Toronto: CAAE/ICEA.
Page 6 SIAST Longitudinal Study
11
4.0 Results of the Study
In Part I, 2,822 questionnaires were sent out to all SIAST on-campus first year Certificate and Diplomastudents. The proportion of students by institute was: Kelsey 38.2%, Palliser 24.9%, Wascana 26.3%,and Woodland 10.5%. The overall response rate for Part I was 55.2% or 1,557 completedquestionnaires were received.
Part II of the study investigated whether students had completed their program and what reasonsimpacted on the decision to withdraw. 1,557 questionnaires were sent in June 1992 and 720 werereceived; a response rate of 46%. The non-completion rate for SIAST first year students overall was14.5%. The proportion of respondents by institute remained similar to Part I.
Part III of the study investigated whether the original students (enroled in 1991) had taken further trainingby September 1994. 1,498 questionnaires were mailed out in September 1994 and 409 completed werereceived, a response rate of 29%. 218 questionnaires were returned "undeliverable" since manystudents had moved and could not be traced since they had taken the program at SIAST in 1991. Fora complete breakdown of response rates by program, refer to Appendix A.
Throughout this report we will make. reference to participants of Part I, Part II, and Part III of this long-term study.
4.1 Responses to the Part 111 Questionnaire
This first section will report the results of the Part III questionnaire. In the next section responses willbe compared by "completers" and "continuers".
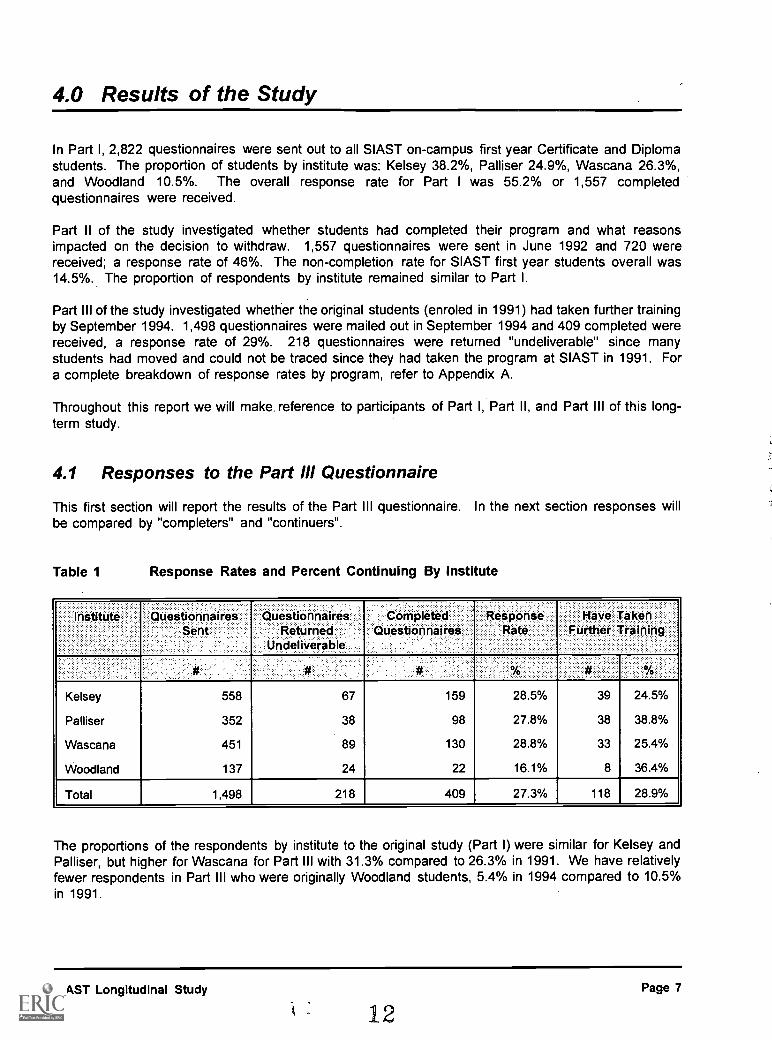
Table 1 Response Rates and Percent Continuing By Institute
Institute QuestionnairesSent
Questionnairet ompleted Response Have TakenReturned Questionnaires Rate Further Training
Undeliverable.
Kelsey 558 67 159 28.5% 39 24.5%
Palliser 352 38 98 27.8% 38 38.8%
Wascana 451 89 130 28.8% 33 25.4%
Woodland 137 24 22 16.1% 8 36.4%
Total 1,498 218 409 27.3% 118 28.9%
The proportions of the respondents by institute to the original study (Part I) were similar for Kelsey andPalliser, but higher for Wascana for Part III with 31.3% compared to 26.3% in 1991. We have relativelyfewer respondents in Part III who were originally Woodland students, 5.4% in 1994 compared to 10.5%in 1991.
SIAST Longitudinal Study
12Page 7

Table 2 In what SIAST program were you enroled in September 1991?
Part III Part I
Institute # % %
Kelsey 159 38.9% 38.2%
Palliser 98 24.0% 26.3%
Wascana 130 31.8% 26.3%
Woodland 22 5.4% 10.5%
Total 409 100% 100%
4.1.1 Program Completion
Table 3 Did you complete the 1991 program?
Number Percent
Yes
No
345
64
84.4%
15.6%
The percent of non-completion remains relatively stable at about 15% for Part II, as well as PartIll respondents. Of the 345 that completed the program, about 11% of students took more thanone year to complete a certificate program and two years to complete a diploma program. If wewere to count completion after the standard one or two year period, completion rates would dropto 75%.
Table 4 When was the 1991 program completed?
Year.
1992 165
1993 142
1994 32
No Year Given 6
Total 345
Rate of Program Completion,- 85%
Page 8 SIAST Longitudinal Study
13

4.1.2 Continuing Students
Did you take further training?
A total of 118 or 28.9% of the 409 that responded to the survey took further training after beingenroled in the program that they took in 1991. The majority of this additional training was takenat SIAST (52.9%). Further analysis of these 118 "continuers" shows that 83% had completedtheir original program (in which they were enroled in 1991) and 17% had not completed theoriginal 1991 program. Therefore, there does not appear to be any significant differencebetween completers and non-completers in terms of continuing further training.
Table 5 Where have you taken this additional training?
Institution # %
SIAST: 52.9%Kelsey 33Palliser 21
Wascana 19Woodland 1
University: 19.3%University of Saskatchewan 13
University of Regina 9
Other university 5
Other: 27.9%Regional College 6Private Trainer 2
Other 31
Total 140 100%
Some respondents indicated more than one institution where they have taken additional training,therefore the total is higher than 118.
The majority of the additional training was some kind of upgrading or continuing education in thesame general field as the original program. However, we also had a number of respondents whowithdrew from the previous (1991) program and then took training at a lower level, such asPractical Nursing rather than the original Diploma Nursing program. In the industrial programs,many are pursuing apprenticeship level training after a pre-employment program.
Changing the field or area of study altogether was not common. Only seven respondents (6%)changed their field and took training in unrelated programs; almost all of these went intocomputer related training.
Rate of Continuing Education - 29%
SIAST Longitudinal Study Page 9
14
4.1.3 Reasons for Continuing Education
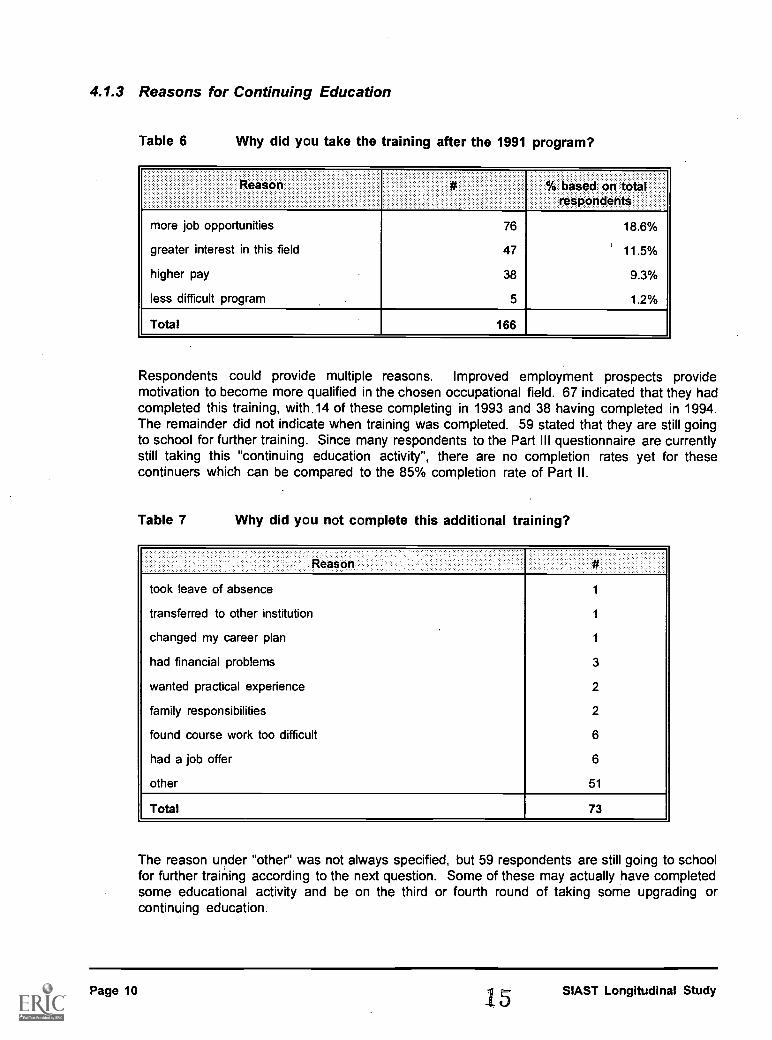
Table 6 Why did you take the training after the 1991 program?
Reason # % based on totalrespondents
more job opportunities 76 18.6%
greater interest in this field 47 11.5%
higher pay 38 9.3%
less difficult program 5 1.2%
Total 166
Respondents could provide multiple reasons. Improved employment prospects providemotivation to become more qualified in the chosen occupational field. 67 indicated that they hadcompleted this training, with.14 of these completing in 1993 and 38 having completed in 1994.The remainder did not indicate when training was completed. 59 stated that they are still goingto school for further training. Since many respondents to the Part Ill questionnaire are currentlystill taking this "continuing education activity", there are no completion rates yet for thesecontinuers which can be compared to the 85% completion rate of Part II.
Table 7 Why did you not complete this additional training?
Reason
took leave of absence 1
transferred to other institution 1
changed my career plan 1
had financial problems 3
wanted practical experience 2
family responsibilities 2
found course work too difficult 6
had a job offer 6
other 51
Total 73
The reason under "other" was not always specified, but 59 respondents are still going to schoolfor further training according to the next question. Some of these may actually have completedsome educational activity and be on the third or fourth round of taking some upgrading orcontinuing education.
Page 10 15 SIAST Longitudinal Study

4.1.4 Present Status
Table 8 What is your present status?
Status # %
full-time employed 248 60.6%
part-time employed (less than 30 hours per week) 81 19.8%
self-employed 29 7.1%
going to school for further training 59 14.4%
not employed but not looking for work 12 2.9%
not employed and looking for work 30 7.3%
Total 459
The total number is higher than 409 since respondents could provide multiple answers. Forexample, those who are full-time employed are also frequently going to school. 20 full-timeemployed, 6 part-time employed, and 13 self-employed indicated that they are also going toschool for further training. The graph below represents the number of respondents by theiremployment status.
Figure 1 Present Employment Status of Respondents
(n=400)
300
250
200
150
100
50
]llillif111111111 I I IP"
FuTime
Part
1111111111ilillillI"'
Alliii11111111111111111111ingoilimi
Se f Unemployed Not InTime Employed Labour Force
SIAST Longitudinal Study
6Page 11
1

Table 9 Are you currently working in the field in which you trained inSeptember 1991?
Yes 267 65.6%
No 140 34.4%
Total 407 100%
No response 2
Of those that are currently working in their field of training, the average number of months thatrespondents worked in this field was 21 months, with the most frequent number (mode) 12months. The median was 16 months (50% fall below and 50% are above this number).
Of the 140 who no longer work in the field related to the program in which they were enroled in1991, 59 have worked in this field at some time, with the average number of months being 15,mode 12 months, and median 9 months.
The reason given by those who have not worked at all in their field: 32 stated that there wereno jobs in this area, five stated that they no longer liked the field, and five had no workexperience. Three became disabled since taking the program.
4.1.5 Intent to Pursue Further Training
When asked whether they think that they will pursue further training in the future, 129(31.5%) replied positively.
95 indicated that they would take continuing or upgrading training in the same field or subjectarea.
20 would like to take education at the university level in the same field (one additionalrespondent was going to pursue a general Arts degree).
13 indicated that they were going to change their field of study; nine of these were going intocomputer related fields and four into other unrelated fields.
32% of Respondents are Planning to Pursue Further Education
Page 12 SIAST Longitudinal Study
17

4.2 . Comparison to Responses of Part I and II
In this section, we will investigate whether students who completed the first program in 1991 (calledcompleters), and those who took further training by September 1994 (called continuers) respondeddifferently in the first questionnaire (Part I). In other words, did the subsequent completers andcontinuers show different characteristics? Did they have a stronger goal commitment? Did they havehigher high school grades or aspire to higher educational goals in 1991 when they started as first yearstudents? The answers of all responding first-year students are labelled "all first-year".
The questions that were chosen for the analysis are provided as stated and numbered in the originalquestionnaire.
4.2.1 Goal Commitment
#3. How sure are you of your choice of career goal?
Continuers were slightly less sure about their career goals; completers were more sure aboutcareer goals. 8.8% of continuers indicated in 1991 that they are "not sure" of their career goal,compared to 5.5% of the completers and 6.2% of the total responding 1991 first year students.
Figure 2
10%
8%
6%
4%
2%
0%
Uncertain About Career Goal in 1991
6.2%
5.5%
8.8%
All First-Year Comp eters Continuers
SIAST Longitudinal Study Page 13
18

#5. During the next 5 - 10 years, what is the highest level of education you plan toachieve?
A higher percentage of the continuers (23.9%) indicated "obtaining a four year university degree"as their highest educational goal in 1991. 15.4% of completers and 17.1% of the overallstudents entering first year had this goal.
Figure 3 Four Year University Degree as Highest Educational Goal
30% /
25%
20%
15%
10%
5%
0%
171%
23.9%
All First-Year Comp eters Continuers
#7. Do you believe that you will be able to earn a higher income with a certificate ordiploma than without such qualifications?
Students overall have a strong believe that completing a certificate or diploma will increase theirchances for employment. Completers and continuers are slightly stronger in this belief; 98.2%and 98.1% respectively compared to 97.6% of all first year students.
A higher percentage of continuers (98.2%) believed that having a certificate or diploma willenable them to earn a higher income, compared to 95.2% of completers and all first yearstudents.
#8. If you were offered a job right now that requires your skills and which pays thegoing wage rate, would you take the job now or finish the program in which youare enroled?
The number of respondents who would definitely take the job in preference of finishing theirprogram is very small, 5.5% overall and 4.4% for completers and continuers.
Page 14 SIAST Longitudinal Study
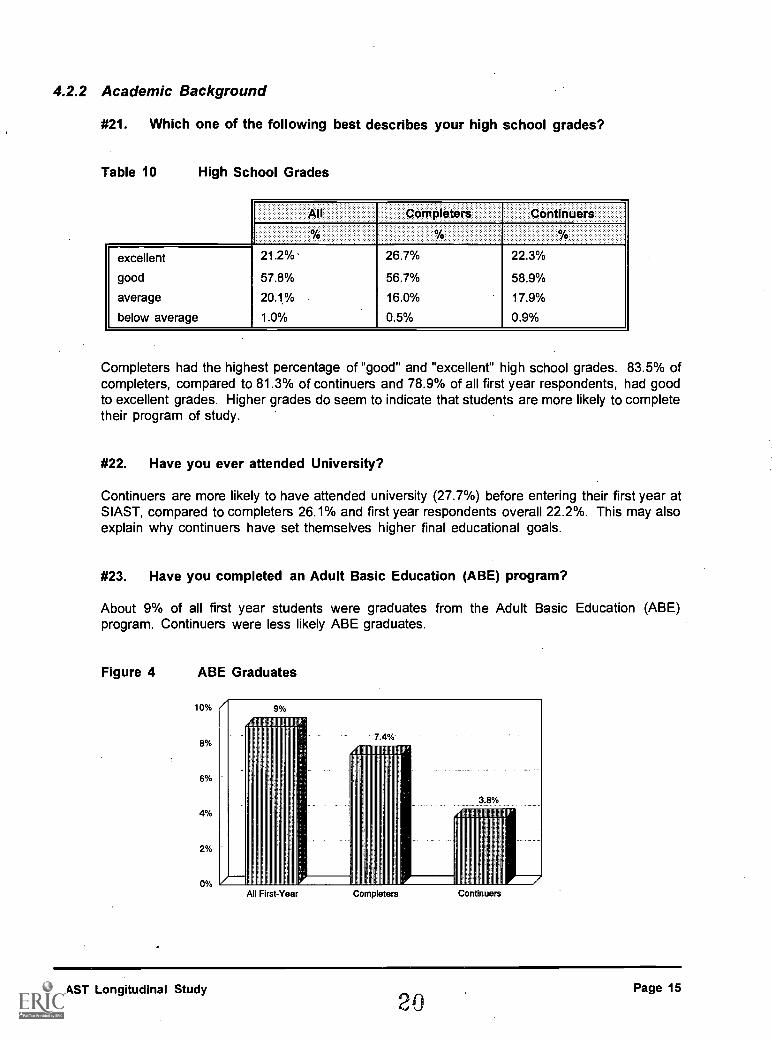
4.2.2 Academic Background
#21. Which one of the following best describes your high school grades?
Table 10 High School Grades
All Completers Continuers04
Yo %
excellent 21.2% ' 26.7% 22.3%
good 57.8% 56.7% 58.9%
average 20.1% 16.0% 17.9%
below average 1.0% 0.5% 0.9%
Completers had the highest percentage of "good" and "excellent" high school grades. 83.5% ofcompleters, compared to 81.3% of continuers and 78.9% of all first year respondents, had goodto excellent grades. Higher grades do seem to indicate that students are more likely to completetheir program of study.
#22. Have you ever attended University?
Continuers are more likely to have attended university (27.7%) before entering their first year atSIAST, compared to completers 26.1% and first year respondents overall 22.2%. This may alsoexplain why continuers have set themselves higher final educational goals.
#23. Have you completed an Adult Basic Education (ABE) program?
About 9% of all first year students were graduates from the Adult Basic Education (ABE)program. Continuers were less likely ABE graduates.
Figure 4 ABE Graduates
10% /
8%
6%
4%
2%
0%
9%
All First Year
7 4%'
38%
Comp eters Continuers
SIAST Longitudinal Study0
Page 15
2

4.2.3 Demographic Characteristics
#25. Are you single (including divorced, separated, widowed) or married (includingcommon law)?
Single respondents were more likely to continue their education, but less likely to complete theprogram than the first year students overall.
Figure 5
100%
Single Students
76 4% 75.2%82%
80%
60%
40%
20%
0%All First-Year Comp eters Continuers
#26. Do you have any dependent children living with you?
Continuers were less likely to have dependent children living with them (15.9%), but there wasno difference between the completers and first year students overall. A higher percentage ofcompleters compared to the other groups have only one child living with them.
Page 16 21 SIAST Longitudinal Study

#27. Are you male or female?
Figure 6 Gender Distribution
100%
75%
50%
25%
0%All First-Year
45%
Comp eters Continuers
pMaleFemale
Female students were more likely to complete the original program of study, however, they wereless likely to continue. The original proportion of male/female was higher for the female students(we had a higher percentage of female students enroled); but the male/female ratio is the samefor the continuers. More males continued which has balanced the ratio.
#28. Are you of Aboriginal ancestry?
Aboriginal participation was lower for the completer and continuer cohorts. In 1991, 6.2% ofresponding first-year students identified themselves as being of Aboriginal ancestry. Thepercentage of Aboriginals to all completers dropped to 5.0% and 4.4% for the continuers.
#29. Are you disabled?
Disabled students were more likely to continue; however, since we are dealing with very smallnumbers caution should be applied. 5.3% of continuers identified themselves as being disabled,compared to 4.6% of the completers and 4.9% of the total first year responding students. Thismay be a result of the employment market and the relative difficulty finding employment. It maybe the belief that having more education increases job prospects and opportunities foremployment.
SIAST Longitudinal Study 22Page 17

5.0 Conclusion
SIAST students demonstrate that "continuous learning" is very much a part of their lives. This study notonly demonstrated that students are coming to SIAST from a diverse academic background, but that theyare continuously involved in furthering their education by attending various post-secondary educationalinstitutions.
Those students who pursued further studies generally remained in the same broad area in which theyhad already trained, rather than switching fields altogether. In recent literature, it is documented thatpeople's motives for participating in further education have changed from the 1960s -when "personaldevelopment goals" were the major motivators. During the 1980s "employment related objectives"became the large motivating force' and our Longitudinal Study confirms this trend.
The study also identified that those students who continue their studies differ in some respects from thegeneral first year students. Continuers had higher educational goals and a stronger commitment to thesegoals when they entered their first year program at SIAST in 1991. They also expressed a strongerbelief that further education increases the chances of finding employment and receiving a higher income.Female students are more likely to complete a program, but being male increases the probability ofcontinuing further education. Being single and having no dependent children also increases thelikelihood of continuing studies.
7 Livingstone, D.W. "Lifelong Education and Chronic Underemployment: Exploring the Contradiction," Transitions: Schoolingand Employment in Canada, 94. Anisef, Paul and Paul Axelrod (editors) (1993). York University, Toronto: Thompson EducationalPublishing, Inc.
Page 18 SIAST Longitudinal Study
23

6.0 Implications
We have clear indications that SIAST students are pursuing "lifelong learning" and they are very mobilein terms of choosing educational institutions that meet their needs. In order to facilitate the mobility ofstudents throughout the system, transferability of credits and the recognition of previously acquiredknowledge and learning will become more and more important. We found that, in general, studentspursue the same field of study, therefore the concepts of career laddering must be expanded andbecome integral parts of our post-secondary programs.
The characteristic of any formal educational institution has been its self-containment. Success forstudents is generally based upon achievement or it is measured in terms of experience provided by theinstitution. We must now re-examine these criteria and look at the system as a whole. Multiple exit andentry points may better suit the continuing education and training needs of students who have tocompete in the job markets of changing economies. The challenge we face is to ease these exchangesor transitions between educational institutions and to give credit for learning acquired at the workplace,while at the same time maintaining the integrity of the certifying system.
SIAST Longitudinal Study Page 19
24

7.0 References
Anisef, Paul and Paul Axelrod (editors) (1993). Transitions: Schooling and Employment in Canada.York University, Toronto: Thompson Educational Publishing, Inc.
Canadian Association for Adult Education (1982). From the adult's point of view. Toronto: CAAE/ICEA.
Devereaux, M. (1985). One in Every Five. Ottawa: Statistics Canada and Education Support Section,Secretary of State.
Gallup Canada (1990). "1 in 4 Adults Set for Classes." Toronto Star. (15 Nov.) A14.
Livingstone, D.W. "Lifelong Education and Chronic Underemployment: Exploring the Contradiction,"Transitions: Schooling and Employment in Canada, 94. Anisef, Paul and Paul Axelrod (editors)(1993). York University, Toronto: Thompson Educational Publishing, Inc.
Livingstone, D.W., D. Hart and L. Davie (1991). Public Attitude Toward Education in Ontario. Toronto:OISE.
Selman, G., and P. Dampier (1991). The Foundations of Adult Education in Canada. Toronto: ThompsonEducational Publishing.
Waniewiez, I. (1976). Demand for Part-Time Learning in Ontario. Toronto: OISE/OELA.
Page 20 25 SIAST Longitudinal Study
Appendix A
Summary of Respondents
26
SIA
ST
LO
NG
ITU
DIN
AL
ST
UD
YS
epte
mbe
r 19
94
Pro
gram
Nam
e#
of Q
. Sen
t#
of Q
.R
etur
ned
(und
eliv
erab
le)
# of
Q.
Com
plet
ed
Fur
ther
Tra
inin
g
Yes
No
No
Ans
wer
Kel
sey
Inst
itute
Ani
mal
Hea
lth T
echn
olog
y (0
2 -
28)
132
43
1
Bio
logi
cal S
cien
ces
Tec
hnol
ogy
(33
- 52
)6
22
2
Cer
tifie
d C
ombi
ned
Tec
hnic
ian
(57
- 82
)8
32
1
Che
mic
al T
echn
icia
n (1
01 -
112
)5
22
Dip
lom
a N
ursi
ng (
115
- 25
7)81
830
720
3
Indi
an D
iplo
ma
Nur
sing
(25
826
9)4
11
EC
DC
ertif
icat
e (2
7829
8)12
42
2
EC
DD
iplo
ma
(299
316)
151
98
1
Foo
d S
ervi
ce A
dmin
istr
atio
n (3
17 -
344
)17
5
Hot
el &
Res
taur
ant A
dmin
. (34
5 -
373)
111
11
Libr
ary
Tec
hnic
ian
(377
- 4
02)
205
82
6
Med
ical
Lab
orat
ory
Tec
hnol
ogy
(404
- 4
70)
328
81
7
Med
ical
Rad
iatio
n T
echn
olog
y (4
73 -
493
)12
16
13
2
Pro
fess
iona
l Coo
king
(49
4 -
517)
125
11
Rec
reat
ion
& L
eisu
re (
519
553)
401
91
8
Reh
abili
tatio
n W
orke
r C
ertif
icat
e (5
54 -
579
)22
44
21
1
Reh
abili
tatio
n W
orke
r D
iplo
ma
(580
- 5
97)
126
24
Ret
ail M
eatc
uttin
g (5
9961
0)5
11
You
th C
are
Wor
ker
(612
- 6
22)
4
CA
D/C
AM
(62
6 -
654)
144
22
27B
EST
CO
PY A
VA
ILA
BL
E28
Pro
gram
Nam
e#
of Q
. Sen
t#
of Q
.R
etur
ned
(und
eliv
erab
le)
# of
Q.
Com
plet
ed
Fur
ther
Tra
inin
g
Yes
No
No
Ans
wer
Indu
stria
l Ele
ctro
nics
Tec
hnic
ian
(663
695)
163
52
3
Mec
hani
cal E
ngin
eerin
g T
echn
olog
y (6
97 -
738
)24
13
12
Mic
ro-c
ompu
ter
Man
agem
ent (
741
- 76
7)17
29
18
Agr
icul
tura
l Mac
hine
ry T
echn
icia
n (7
68 -
797
)12
13
21
Aut
o B
ody
Rep
air
(799
822)
152
31
2
Hea
vy E
quip
men
t Mec
hani
cs (
825
- 87
5)26
15
5
Indu
stria
l Mec
hani
cs (
876
- 88
9)10
41
1
Mac
hine
Sho
p (8
90 -
901
)9
13
12
Aut
omot
ive
Ser
vice
Tec
h.-
MV
MR
(90
2 -
952)
262
75
2
Par
ts M
anag
emen
t Tec
hnic
ian
(953
- 9
87)
175
5
Pow
er E
ngin
eerin
g (9
95 -
102
4)15
72
2
Ref
ridge
ratio
n &
Air
Con
ditio
ning
(10
26 -
103
7)5
22
0
Wel
ding
(10
40 -
107
7)21
15
32
Tot
al55
867
159
3911
28
2930

Pro
gram
Nam
e#
of Q
. Sen
t#
of Q
.R
etur
ned
(und
eliv
erab
le)
# of
Q.
Com
plet
ed
Fur
ther
Tra
inin
g
Yes
No
No
Ans
wer
Pal
liser
Inst
itute
Aut
o B
ody
(200
1 -
2020
)10
13
02
1
Bui
ldin
g C
onst
ruct
ion
(202
1 -
2033
)8
22
2
Pro
fess
iona
l Coo
king
(20
34 -
206
6)14
23
11
1
Ele
ctric
ian
(206
720
77)
71
Mas
onry
(20
78 -
208
5)5
21
1
MV
MR
(20
8621
23)
122
33
Rad
io-T
V E
lect
roni
cs (
2124
- 2
162)
202
92
61
Wel
ding
(21
63 -
218
0)5
11
1
Arc
h. E
ngin
eerin
g T
echn
olog
y (2
181
- 22
10)
122
2
Civ
il E
ngin
eerin
g T
echn
olog
y (2
211
- 22
40)
151
51
4
Com
pute
r E
ngin
eerin
g T
echn
olog
y (2
241
- 22
69)
121
52
3
Com
pute
r-A
ided
Dra
fting
Tec
h. (
2270
- 2
289)
71
33
Ele
ctric
al E
ngin
eerin
g T
ech.
(22
90 -
231
7).
123
3
Ele
ctro
nics
Eng
inee
ring
Tec
h. (
2318
- 2
347)
131
22
Inst
rum
enta
tion
Eng
inee
ring
Tec
h. (
2348
- 2
376)
101
53
11
Sur
veyi
ng E
ngin
eerin
g T
echn
olog
y (2
377
- 23
92)
71
1
Wat
er R
esou
rces
Eng
inee
ring
Tec
h. (
2393
- 2
421)
132
40
31
Offi
ce E
duca
tion
(242
2 -
2455
)19
16
33
0
Bus
ines
s I (
2456
- 2
704)
151
1939
2118
Tot
al35
238
9838
555
31
33
Pro
gram
Nam
e#
of Q
. Sen
t#
of Q
.R
etur
ned
(und
eliv
erab
le)
# of
Q.
Com
plet
ed
Fur
ther
Tra
inin
g
Yes
No
No
Ans
wer
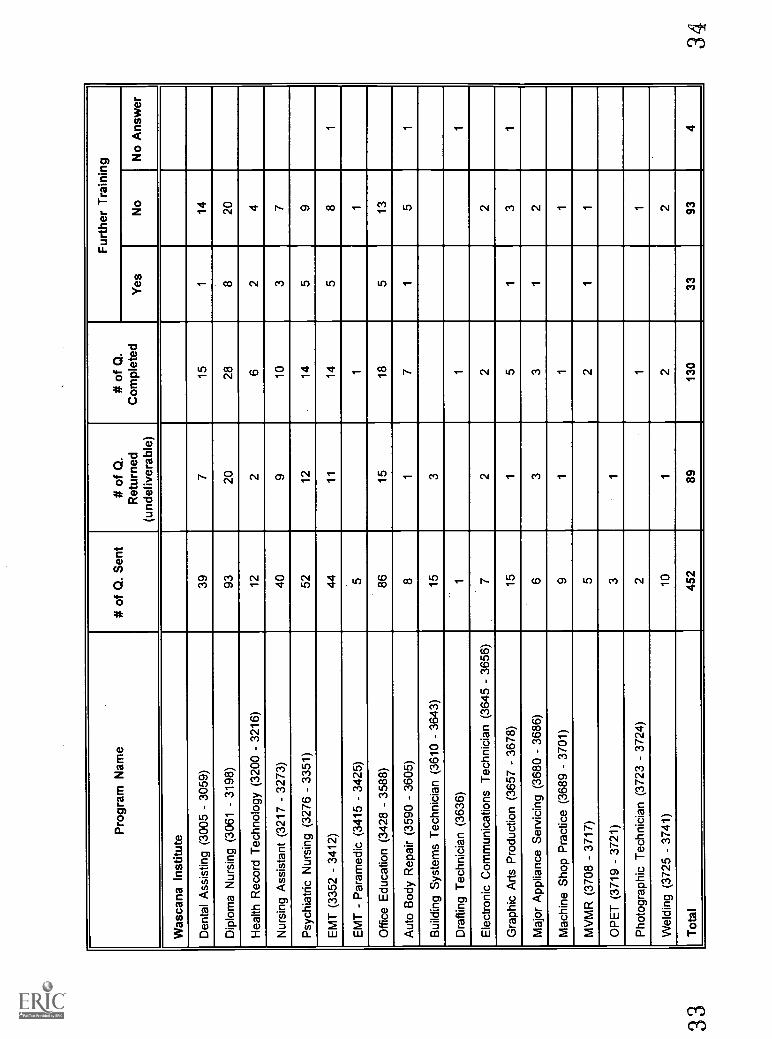
Was
cana
Inst
itute
Den
tal A
ssis
ting
(300
5 -
3059
)39
715
114
Dip
lom
a N
ursi
ng (
3061
- 3
198)
9320
288
20
Hea
lth R
ecor
d T
echn
olog
y (3
200
3216
)12
26
24
Nur
sing
Ass
ista
nt (
3217
- 3
273)
409
103
7
Psy
chia
tric
Nur
sing
(32
76 -
335
1)52
1214
59
EM
T (
3352
- 3
412)
4411
145
81
EM
T -
Par
amed
ic (
3415
- 3
425)
51
1
Offi
ce E
duca
tion
(342
8 -
3588
)86
1518
513
Aut
o B
ody
Rep
air
(359
0 -
3605
)8
17
15
1
Bui
ldin
g S
yste
ms
Tec
hnic
ian
(361
0 -
3643
)15
3
Dra
fting
Tec
hnic
ian
(363
6)1
11
Ele
ctro
nic
Com
mun
icat
ions
Tec
hnic
ian
(364
5 -
3656
)7
22
2
Gra
phic
Art
s P
rodu
ctio
n (3
657
- 36
78)
151
51
31
Maj
or A
pplia
nce
Ser
vici
ng (
3680
- 3
686)
63
31
2
Mac
hine
Sho
p P
ract
ice
(368
9 -
3701
)9
11
1
MV
MR
(37
0837
17)
52
11
OP
ET
(37
19 -
372
1)3
1
Pho
togr
aphi
c T
echn
icia
n (3
723
3724
)2
11
Wel
ding
(37
2537
41)
101
22
Tot
al45
289
130
3393
434

Pro
gram
Nam
e#
of Q
. Sen
t#
of Q
.R
etur
ned
(und
eliv
erab
le)
# of
Q.
Com
plet
ed
Fur
ther
Tra
inin
g
Yes
No
No
Ans
wer
Woo
dlan
d In
stitu
te
Bus
ines
s C
ompu
ter
Pro
gram
mer
(40
0540
12)
62
Bus
ines
s A
dmin
istr
atio
n (4
017
- 40
52)
172
21
1
Car
pent
er (
4054
4064
)5
Che
mic
al D
epen
denc
y W
orke
r (4
065
- 40
82)
82
22
Pro
fess
iona
l Coo
king
(40
8540
86)
31
1
Cor
rect
ions
Wor
ker
(409
8 -
4131
)19
83
21
Cos
mot
olog
ist (
4132
- 4
145)
92
11
Driv
er T
rain
ing
(414
9 -
4160
)7
22
EC
D (
4162
4176
)9
21
1
Hea
vy E
quip
men
t Ope
rato
r (4
181
- 41
89)
61
1
Inte
grat
ed R
esou
rce
Man
agem
ent (
4191
- 4
205)
131
44
Mic
ro-E
lect
roni
cs T
echn
icia
n (4
211
-'421
5)4
OP
ET
(42
19 -
422
2)3
1
Rad
io-T
V R
epai
r (4
230
4233
)3
Offi
ce T
echn
olog
y (4
224
- 42
65)
172
21
1
Tru
ck &
Tra
nspo
rt M
echa
nica
l Rep
air
(426
7 -
4275
)4
21
1
Wel
ding
(42
80 -
428
9)3
11
Hea
vy E
quip
men
t Mec
hani
cM
.L. (
4291
4298
)1
1
Tot
al13
724
228
140
SIA
ST
TO
TA
L1,
499
218
409
118
274
17
35B
EST
CO
PY A
VA
ILA
BL
E
36

Appendix B
Questionnaire
37

SIASTSASKATCHEWAN INSTITUTE OFAPPLIED SCIENCE AND TECHNOLOGY
Longitudinal StudyQuestionnaire
September 1994
1. In what SIAST program were you enroled in September 1991?
2. Did you complete this program?
Yes When? 1992 1993
After completing your program, did you take any further training?
Yes No (go to #7)
No Have you taken any further training since you were enroled in this program?
Yes No (go to #6)
3. Where have you taken the additional training? (Check as many as apply and indicateprogram name.)
SIAST: KelseyPalliserWascanaWoodland
University: U of SU of Rother university
Other: Regional CollegePrivate Trainerother
4. Why did you take this training after the 1991 program? (If more than one reason applies,rank the answers with the most important being number one.) Also please provide your ownreason.
more job opportunities greater interest in this fieldhigher pay less difficult programother (specify)
38

(Please turn to Page 2)
5. Did you complete the program(s) mentioned in #3? (If more than one program was taken, listcompletion or reasons for withdrawal as comments below.)
Yes, when? (go to #7)
6. Why did you not complete the program?
took leave of absencetransferred to other institutionchanged my career planhad financial problemsother(specify)
No
wanted practical experiencefamily responsibilitiesfound course work too difficulthad a job offer
7. What is your present status? (Check as many as apply.)
full-time employedpart-time employed (less than 30 hours per week)self-employedgoing to school for further trainingnot employed, but not looking for worknot employed and looking for work
8. Are you currently working in the field in which you trained in September 1991?
Yes How long have you worked in this field?
No Have you worked at all in this field?
years months
Yes How long?No Why not?
9. Please comment on how your training relates to job opportunities. Do you think you willpursue further training. If so, in what areas and why?
Thank you for completing this questionnaire.
39

Appendix C
Comments(under separate cover)
40

U.S. Department of EducationOffice of Educational Research and Improvement (OERI)
Educational Resources Information Center (ERIC)
REPRODUCTION RELEASE(Specific Document)
I. DOCUMENT IDENTIFICATION:
ERIC3c 6160 537-
Title:
g//e) s ton4,%/6, / ,g7(1,..ay
Author(s): S//95% geseare.A.veve/oiari7er,/ crire_ (ter Sark4r-Corporate Source:
5/ /Publication Date:
II. REPRODUCTION RELEASE:
In order to disseminate as widely as possible timely and significant materials of interest to the educational community, documents announcedin the monthly abstract journal of the ERIC system, Resources in Education (RIE), are usually made available to users in microfiche, reproducedpaper copy, and electronic/optical media, and sold through the ERIC Document Reproduction Service (EDRS) or other ERIC vendors. Credit isgiven to the source of each document, and, if reproduction release is granted, one of the following notices is affixed to the document.
If permission is granted to reproduce and disseminate the identified document, please CHECK ONE of the following two options and sign atthe bottom of the page.
Check hereFor Level 1 Release:Permitting reproduction inmicrofiche (4' x 6' film) orother ERIC archival media(e.g., electronic or optical)and paper copy.
Signhere,please
The sample sticker shown below will beaffixed to all Level 1 documents
PERMISSION TO REPRODUCE ANDDISSEMINATE THIS MATERIAL
HAS BEEN GRANTED BY
TO THE EDUCATIONAL RESOURCESINFORMATION CENTER (ERIC)
Level 1
The sample sticker shown below will beaffixed to all Level 2 documents
PERMISSION TO REPRODUCE ANDDISSEMINATE THIS
MATERIAL IN OTHER THAN PAPERCOPY HAS BEEN GRANTED BY
q4P
TO THE EDUCATIONAL RESOURCESINFORMATION CENTER (ERIC)
Level 2
Documents will be processed as indicated provided reproduction quality permits. If permissionto reproduce is granted, but neither box is checked, documents will be processed at Level 1.
D-ICheck here
For Level 2 Release:Permitting reproduction inmicrofiche (4' x 6' film) orother ERIC archival media(e.g., electronic or optical),but not in paper copy.
hereby grant to the Educational Resources Information Center (ERIC) nonexclusive permissionto reproduce and disseminatethis document as indicated above. Reproduction from the ERIC microfiche or electronic/optical media by persons other thanERIC employees and its system contractors requires permission from the copyright holder. Exception is made for non-profitreproduction by libraries and other service agencies to satisfy information needs of educators inresponse to discrete inquiries.'
Printed Name/PosiuoniTiOe:
Telephone:
-Mall Address:
FAX:
Date:

III. DOCUMENT AVAILABILITY INFORMATION (FROM NON-ERIC SOURCE):If permission to reproduce is not granted to ERIC, or, if you wish ERIC to cite the availability of the document from another source,please provide the following information regarding the availability of the document. (ERIC will not announce a document unless it ispublicly available, and a dependable source can be specified. Contributors should also be aware that ERIC selection criteria aresignificantly more stringent for documents that cannot be made available through EDRS.)
IV. REFERRAL OF ERIC TO COPYRIGHT/REPRODUCTION RIGHTS HOLDER:If the right to grant reproduction release is held by someone other than the addressee, please provide the appropriate name and address:
Name:
Address:
V. WHERE TO SEND THIS FORM:
Send this form to the following ERIC Clearinghouse: Rika NakazawaAquisitions CoordinatorERIC Clearinghouse for Community Colleges3051 Moore HallBox 951521Los Angeles, CA 90095-1521
(Rev. 3/96/96)
Association of Canadian Com-munity Colleges Annual Conf.Toronto, Ontario, May 26-28, 1996