ED 385 025 EC 304 053 AUTHOR Hall, Tracey E.; Baker ... RESUME ED 385 025 EC 304 053 AUTHOR Hall,...
18
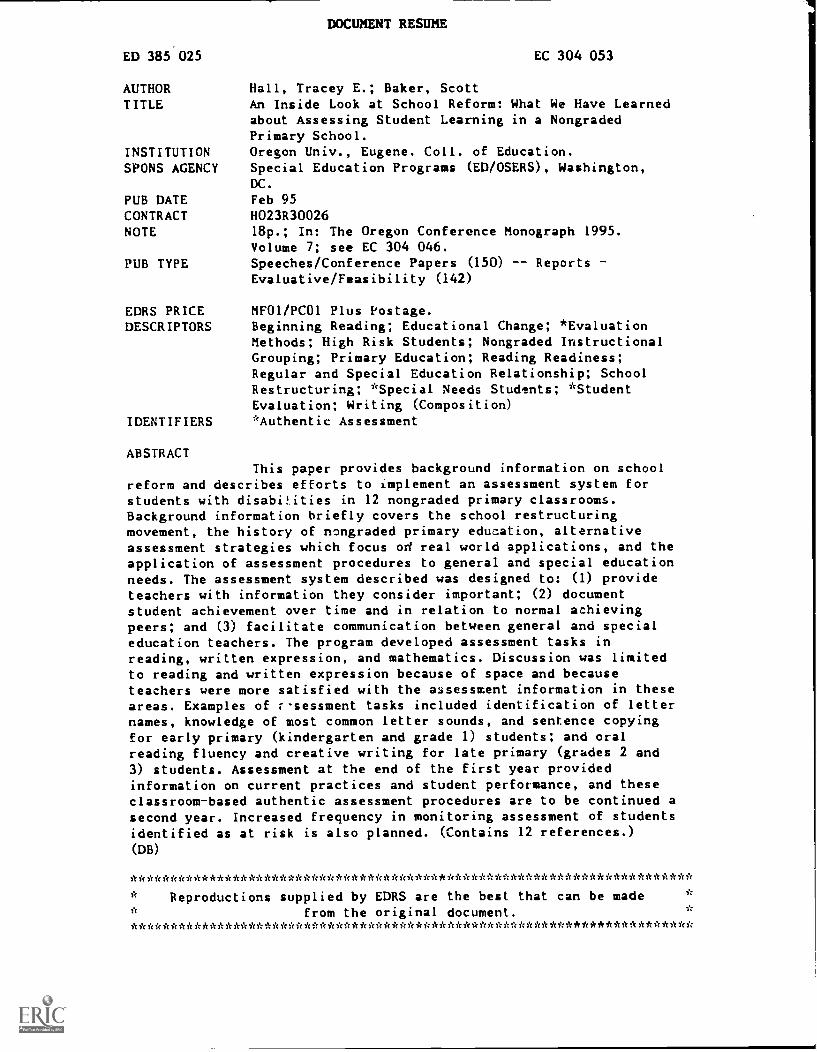
DOCUMENT RESUME ED 385 025 EC 304 053 AUTHOR Hall, Tracey E.; Baker, Scott TITLE An Inside Look at School Reform: What We Have Learned about Assessing Student Learning in a Nongraded Primary School. INSTITUTION Oregon Univ., Eugene. Coll. of Education. SPONS AGENCY Special Education Programs (ED/OSERS), Washington, DC. PUB DATE Feb 95 CONTRACT H023R30026 NOTE 18p.; In: The Oregon Conference Monograph 1995. Volume 7; see EC 304 046. PUB TYPE Speeches/Conference Papers (150) Reports Evaluative /Feasibility (142) EDRS PRICE MF01/PC01 Plus Postage. DESCRIPTORS Beginning Reading; Educational Change; *Evaluation Methods; High Risk Students; Nongraded Instructional Grouping; Primary Education; Reading Readiness; Regular and Special Education Relationship; School Restructuring; *Special Needs Students; *Student Evaluation; Writing (Composition) IDENTIFIERS *Authentic Assessment ABSTRACT This paper provides background information on school reform and describes efforts to implement an assessment system for students with disabi!ities in 12 nongraded primary classrooms. Background information briefly covers the school restructuring movement, the history of nongraded primary education, alternative assessment strategies which focus od real world applications, and the application of assessment procedures to general and special education needs. The assessment system described was designed to: (1) provide teachers with information they consider important; (2) document student achievement over time and in relation to normal achieving peers; and (3) facilitate communication between general and special education teachers. The program developed assessment tasks in reading, written expression, and mathematics. Discussion was limited to reading and written expression because of space and because teachers were more satisfied with the assessment information in these areas. Examples of r-sessment tasks included identification of letter names, knowledge of most common letter sounds, and sentence copying for early primary (kindergarten and grade 1) students; and oral reading fluency and creative writing for late primary (grades 2 and 3) students. Assessment at the end of the first year provided information on current practices and student performance, and these classroom-based authentic assessment procedures are to be continued a second year. Increased frequency in monitoring assessment of students identified as at risk is also planned. (Contains 12 references.) (DB) *********************************************************************** * Reproductions supplied by EDRS are the best that can be made * * from the original document. * ***********************************************************************
-
Upload
doankhuong -
Category
Documents
-
view
216 -
download
3
Transcript of ED 385 025 EC 304 053 AUTHOR Hall, Tracey E.; Baker ... RESUME ED 385 025 EC 304 053 AUTHOR Hall,...
DOCUMENT RESUME
ED 385 025 EC 304 053
AUTHOR Hall, Tracey E.; Baker, ScottTITLE An Inside Look at School Reform: What We Have Learned
about Assessing Student Learning in a NongradedPrimary School.
INSTITUTION Oregon Univ., Eugene. Coll. of Education.SPONS AGENCY Special Education Programs (ED/OSERS), Washington,
DC.
PUB DATE Feb 95
CONTRACT H023R30026NOTE 18p.; In: The Oregon Conference Monograph 1995.
Volume 7; see EC 304 046.PUB TYPE Speeches/Conference Papers (150) Reports
Evaluative /Feasibility (142)
EDRS PRICE MF01/PC01 Plus Postage.DESCRIPTORS Beginning Reading; Educational Change; *Evaluation
Methods; High Risk Students; Nongraded InstructionalGrouping; Primary Education; Reading Readiness;Regular and Special Education Relationship; SchoolRestructuring; *Special Needs Students; *StudentEvaluation; Writing (Composition)
IDENTIFIERS *Authentic Assessment
ABSTRACTThis paper provides background information on school
reform and describes efforts to implement an assessment system forstudents with disabi!ities in 12 nongraded primary classrooms.Background information briefly covers the school restructuringmovement, the history of nongraded primary education, alternativeassessment strategies which focus od real world applications, and theapplication of assessment procedures to general and special educationneeds. The assessment system described was designed to: (1) provideteachers with information they consider important; (2) documentstudent achievement over time and in relation to normal achievingpeers; and (3) facilitate communication between general and specialeducation teachers. The program developed assessment tasks inreading, written expression, and mathematics. Discussion was limitedto reading and written expression because of space and becauseteachers were more satisfied with the assessment information in theseareas. Examples of r-sessment tasks included identification of letternames, knowledge of most common letter sounds, and sentence copyingfor early primary (kindergarten and grade 1) students; and oralreading fluency and creative writing for late primary (grades 2 and3) students. Assessment at the end of the first year providedinformation on current practices and student performance, and theseclassroom-based authentic assessment procedures are to be continued asecond year. Increased frequency in monitoring assessment of studentsidentified as at risk is also planned. (Contains 12 references.)
(DB)
************************************************************************ Reproductions supplied by EDRS are the best that can be made *
* from the original document. *
***********************************************************************

1 )
U.S. 0E1 .AENT Of EDUCATIONOffice of Educauonal Rlaaren and improvement
rDuCATIONAL RESOURCES INFORMATIC-4CENTER (ERIC)
Finis document sas been reproduced asreceived from tn* DOM.:3n or OnallniZatn-Aoriginating it.
Minor changes have Wen made to "'prowreprOduction quality
Pants 01 eve. ofcamons.StarK1,r, th dopymerit do not neceSSanly 'present official0E141 position or pohcy
An Inside Loa t School Reform:What We Have Learned AboutAssessing Student Learning ina Nongraded Primary School
Tracey E. Hall, Ph.D.Scott Baker, Ph.D.
University of Oregon
PERMISSION TO REPRODUCE THISMATERIAL HAS BEEN GRANTED BY
TO THE EDUCATIONAL RESOURCESINFORMATION CENTER IERICI
THE COLLEGE OF EDUCATION AT THE UNIVERSITY OF OREGON IS IN THE SECOND YEAR OF A5-year collaborative project with three elementary schools in the Eugene area. The project isbeing funded by the U.S. Department of Special Education, Office of Special EducationPrograms. The Office of Special Education is interested in studying how school reform efforts,which are occurring at the national level, affect students with disabilities. The specific purposeof the grant is to influence and explain the relations among interdependent school systems andresource use strategies (e.g., team building, consultation, student assessment) within thecontext of school reform efforts including the implementation of nongraded, multi-ageprograms and developmentally appropriate practices, site-based management, and alterna-tive assessment practices.
The purpose of this paper is to provide background information on school reform anddescribe our efforts thus far in working with one elementary school to implement a studentassessment system that (a) provides teachers with information they consider important, (b)documents how well students in special education are learning over time and in relation tonormal achieving peers, and (c) facilitates communication between general and specialeducation teachers regarding how to improve instructional programs for students withdisabilities.
Address all correspondence to: Dr. Tracey E. Hall, Behavioral Research and Teaching, 233 College of Education, Universityof Oregon,
Eugene, OR 97403-1215.This project is funded by Systematic Efforts to Restructure School Grant (H023R30026)front the Office of Special Education Programs,
United States Department of Education. However, the opinions expressed herein do not necessarily reflect the position of the U.S
Department of Education or the College of Education at the University of Oregon, and no official endorsement by the Department, College,
or University should be inferredThis project has been completed with the assistance of Denise Swanson who managed the data coding, entry, and organization
Acknowledgment is also due to Nancy Bell and several Master's stucients involved in train ing, assessment, and teaching. This protect could
not have been accomplished without the enthusiastic support and work of the teachers and their students.
2BEST COPY AVAILABLE

152 Hall & Baker
School RestructuringSchool reform has received national atten-
tior during the last decade. National and state
mandates targeting "Goals 2000" and "21st
Century Schools" are discussed in schools, the
professional literature, and in the media. Gen-
eral components that characterize the latest
reform efforts include (a) the delegation -Nf
decision making from the district level to the
school level (Ogawa, 1994), (b) higher levelsof
student achievement (U.S. Department of
Education, p. 1), and (c) the use of alternative
and authentic assessment practices to mea-
sure studentoutcomes (Baker,O'Neil, & Linn,
1993; Linn, Baker, & Dunbar, 1991). One in-
creasingly popular approach for achieving
better student outcomes, and an approach
that has been widely adopted in th:.-2 state of
Oregon, is the use of nongraded prit-lary class-
rooms that adhere to developmentally ili:pro-
priate practice.
Nongraded Primary Education:Historical Perspective
From the 1950s through the early 1970s, a
movement in North America known as the
Nongraded Elementary School challenged the
traditional age-graded classroom structure.
The major purpose of nongraded schools was
to provide an alternative to the practices of
grade level retention and promotion. In the
1990s, several stateshave promoted the struc-
ture of nongraded classrooms as a way of
achieving genuineeducational reform (Willis,
1991). A fundamental addition to the latest
nongraded movement is the notion of "devel-
opmentally appropriate practices." These
practices emphasize activity-based instruction
and discourage grouping students by ability
or performance. Developmentally appropri-
ate practices (DAP) advocate that children
should be allowed to develop and acquire
skills at their own pace. For example, a tenet
of DAP is that some children are not ready to
learn to read at age (), and this should not be a
The Oregon ConferenceAlonograph, Vol. 7, 1995
source of concern for educators. Addition-
ally, DAP practices support the integration of
curriculum throughout the school day, inplace
of the more traditional subject-by-subject in-
struction. DAP tend to employ projects, learn-
ing stations, and cooperative learning which
are consistent with the philosophy of non-
graded primary programs.
Alternative Assessment StrategiesEducational reforms have begun to include
new assessment approaches to align more
closely with changes in school structure and
classroom practices. Approaches to assessing
student learning are changing dramatically in
general education (GE) settings (Linn, Baker,
& Dunbar, 1991), as well as in special educa-
tion (SE) settings, although support forchange
in SE seems to be less widespread. In GE, the
shift in assessment strategies has moved from
evaluating student learning with publishedmultiple-choice tests to evaluating learning
using "more open-ended problems, essays,hands-on science problems, computer simu-
lations of real world problems, and portfolios
of :3tudents work" (Linn, Baker, & Dunbar,
1991, p. 15). The hallmark of alternative as-
sessment strategies is their "authenticity," the
fact that they reflect real applications of the
challenging problems students engage in ev-
ery day in the classroom and which mirror the
real-world problems students can be expected
to face beyond school.Reforming special education assessment
practices has been spurred not so much by a
paradigm shift in instruction as by a desire to
make assessment more relevant to instruc-
tional decision making and what students
need to know, and do, to be successful in GE
settings. In addition to establishing a closer
link between instruction and assessment,other
characteristics ofalternative assessment prac-
tices in SE include utilizing more direct mea
sures of performance, requiring production
rather than selection responses, generating
3

data useful in making educational decisionsbeyond screening and eligibility for service,and collecting data that can be used to makeformative decisions about student progress aswell as summative decisions about overallstudent outcomes.Applying Assessment Procedures to Gen-
eral and Special Education NeedsThe way reform affects GE and SE settings
will have a strong influence on the educa-tional experiences of students wi:h disabili-ties. For example, the combination of site-based management, one of the foundations ofGE reform (Ogawa, 1994), with inclusion, aphilosophy of SE service being advocated andimplemented in many places throughout thecountry (Fuchs & Fuchs, 1994), has the potential to seriously alter the very nature of SEservice.
Technically adequate and functional as-sessment practices are needed to evaluate howstudents, including those with disabilities, areaffected by the latest educational reform ef-forts. Understanding the limitations of as-sessment practices being promoted in GE andSE, and merging the strengths of assessmentpractices within each domain should facilitateevaluating the influence reform has on indi-vidual students. One approach to bridgingthe GE and SE assessment gaps is to increasethe emphasis placed on classroom-based as-sessment procedures in which data have realmeaning for teachers and classroom instruc-tion.
PurposeOne focus of our project in studying how
school reform efforts affect students with dis-abilities has been on developing classroom-based assessment procedures. We are in thesecond year of data collection. In Year 1, ourintent was to develop assessment procedureswith teachers in the early and late primarygrades that (a) they would find useful, (b)adhered to high standards of psychometricquality, and (c) would provide important in-
School Reform 153
formation on the performance of students withdisabilities and students at risk for academicfailure. Data collection activities in Year 2 arebeing designed to provide teachers with nor-mative data regarding the performance of allstudents and multiple points during the year,and more frequent data on the progress ofselected students they believe are at risk.
Student Assessment Year 1Setting
The target elementary school involved islocated in the Pacific Northwest and servesapproximately 490 students in kindergartenthrough Grade 5. Twelve nongraded primaryclassrooms were the focus of data collection.Their class size averaged 29 students. Theimplementation of nongraded classrooms be-gan in this school during the 1992-93 schoolyear.
The nongraded model included six "earlyprimary" classrooms combining kindergar-ten and first grade students. Kindergartenstudents arrived in the morning and were inschool for two and one half hours, leaving justbefore lunch. First-grade students were inschool for 6 1 /2 hours. In the six "late pri-mary" classrooms were second and third gradestudents.
The assessment in Year 1 was conducted inthe spring. The purpose was to determinehow well students had mastered importantobjectives and to establish a student perfor-mance data base that we could build on in thefollowing years. All students in the early andlate primary block participated in the datacollection.
ProceduresWe collaborated with the early and late
primary teachers on the development of allassessment tasks. During an initial 4-hourmeeting with all teachers, it was decided thatreading, written expression, and mathematicswould constitute the assessment tasks for boththe early and late programs, and that to en-
4 Elmverstty of Oregon College of Education

154 Hall & Baker
hance decision making and continuity, therewould be at least one common task betweenthe programs.
After this initial meeting, the early and lategroups met separately with us to developassessment tasks. The tasks were developedduring three separate 4-hour meetings. Com-ponents of good assessment tasks were dis-cussed as well as the role of assessment withdevelopmentally appropriate practices. Fol-lowing is a description of the tasks and a briefpresentation of the results from the first year'simplementation. We have limited our discus-sion to reading and written expression be-cause of space and because these were theareas teachers were most satisfied with theassessment information.Early Primary Tasks
Reading. Three types of tasks were in-cluded in this assessment. All tasks requiredan oral response and were administered indi-vidually. First, students answered six ques-tions from Marie Clay's Concepts About PrintTest. This was administered to identify ifstudents were developing initial ideas aboutthe purposes of books and print.
On the second task set, students identifiedthe letters and sounds of the alphabet. A pageof random letters was presented to students,and they had to identify the names of capitaland lower case letters, and the sounds of lowercase letters. This task was administered be-cause teachers work on this skill with some oftheir students during the year and becauseknowledge of letter names and sounds hasbeen found to be strong predictor of reading(Adams, 1990). The third set of tasks werereading tasks. First, students were asked toread four simple 3 to 5 word sentences. Stu-dents who had some success with reading thesimple sentences were asked to read a passageselected by the teachers.
We will report findings for the capital let-ter identification tasks and the letter-soundidentification task. The number of correct
The Oregon Conference Monograph, Vol. 7, 1995
responses out of 26 was the score used on eachtask in data analysis.
Language Arts. Four types of writing taskswere included in the early primary assess-ment. The written expression tasks were ad-ministered to small groups of students (2-4).First, students were asked to write the lettersof the alphabet. Second, students were askedto write their first and last name. Third, stu-dents were given a series of sentences pre-sented visually (copy from a paper, from achart) or verbally (dictation) and asked towrite them.
On the fourth type of task, students had todevelop the writing content on their own.They wrote in response to a picture prompt,completed a sentence that was started forthem, and wrote a story in response to a storystarter.
We will report findings from one of thesentence copying tasks. This was scored quan-titatively, by counting the number of correctletter sequences, and qualitatively, by judgingthe form and alignment of letters on a 1-5 scale(see Baker, Hall, & Tindal, in review).Late Primary Tasks
Reading. The late primary reading tasksconsisted of oral reading fluency (ORF) and ameasure of oral retell. Students were admin-istered two teacher-selected ORF readingprobes. Classroom teachers determined thatstudents would read two probes of high andaverage difficulty or average and low diffi-culty. Thus, all students read the probe ofaverage difficulty. The students selected theirfavorite of the two passages and completed anoral retell of that story. We will report theresults of the ORF assessment, which used thenumber of words students read correctly inone minute as the dependent measure (Tindal& Marston, 1994).
Language Arts. The teachers modeled thewritten expression tasks on two sources: (a)the procedures used during classroom writ-ing instruction, and (b., the Oregon State As-
5

sessment writing task. Students engaged inonc., writing task administered to the wholeclass by the classroom teacher over three days.On day one, students brainstormed possiblecontent for two writing themes: describingho:i to make the best sandwich in the world,and describing a really good friend. The teach-ers were free to use whatever brainstormingtechniques they preferred. One-half hour wasallotted for this activity. On the second day,students selected the prompt they would writeabout. All students were allowed 30 minutesto write independently. On the third day,teachers lead students through a series of ques-tions which prompted editing of the materialthey had previously written. This activitytook 20 minutes.
We will present the results of the writingstudents did on Day 2. We will discuss thenumber of words students wrote in 30 min-utes, as well as a qualitative measure of the"cohesion" of the writing content. Cohesionrefers to the sentence-by-sentence coordina-tion and flow of writing.
School Reform 155
Results of Year 1The results of the Year 1 assessment will be
presented separately for the early and lateprimary groups. For the early primary group,we will highlight student performance on twotasks in the reading assessment and one taskin the writing assessment. With the late pri-mary group, we will discuss one task and onescoring procedure for the reading assessmentand one task and two scoring procedures forthe writing assessment.
Early Primary Results in ReadingThe results for the early primary assess-
ment in reading are presented in Tables 1 and2. Two measures are presented: identificationof the 26 capital letter names, and knowledgeof the most common sound for each cf the 26letters. Thus, on each task, a score of 26 correctwas possible. Student group performance canbe examined in three ways. First, classroomteachers identified approximately equalgroups of high, average, and low achievers.Second, the sample is divided into kindergar-ten students and first-grade students. Third,
Table 1. Early Primary Reading Assessment Task: Identify CapitalLetter Names of the Alphabet
Total Sample Kindergarten Students First-Grade Students
11 Mean SD a Mean SD 11 Mean SD
Total Number of Students 174 22.8 .5.9 85 20.9 7.1 89 24.6 3.7
Teacher Judgment
High Achievers 58 25.5 1.5 32 25.1 1.9 26 25.9 0.3
Average Achievers 69 23.4 4.8 33 2L2 6.1 36 25.5 0.8
Low Achievers 47 18.6 8.2 20 13.9 8.6 27 22.1 5.9
SchoolDefined Status
General Education 85 20.9 7.1 55 25.5 2.1
Chapter I 31 23.6 5.3
Special Education 3 18.3 5.5
University of Oregon College of Education

156 Hall & Baker
Table 2. Early Primary Reading Assessment: Letter Sound Identification
Total Sample Kindergarten Students First-Grade Students
ft Mean SD 11 Mean SD 11 Mean SD
Total Number of Students 172 14.7 9.4 83 8.1 8.3 89 20.9 5.4
Teacher Judgment
High Achievers 58 17.3 8.4 32 12.5 8.5 26 23.2 2.5
Average Achievers 69 14.7 9.1 33 7.6 7.6 36 21.3 4.1
Low Achievers 45 11.4 10.2 18 1.3 2.1 27 18.1 7.5
School-Defined Status
General Education ^ -- 83 8.1 8.3 55 21.9 0.7
Chapter 1 _ - - - 31 19.9 6.8
Special Education _ - - - - 3 13.0 7.5
some of the students in Grade 1 received ser-vices beyond general education: 31 studentswere in Chapter 1, and :". students were inspecial education.
Overall, there were few performance dif-ferences between student groups on knowl-edge of capital letter names, except for identi-fied low achievers in kindergarten who scoredonly about half as well as the high achievers.The overall difference between kindergartenand first-grade students seems to be due pri-marily to the performance of low kindergar-ten students.
A more interesting pattern occurs withletter sounds. A clear differenceexits betweenkindergarten and first-grade students. Forexample, high-achieving kindergarten stu-dents scored lower than the lowest group offirst-grade students. It may be that a focus onlearning letter sounds occurs more with firstgrade than kindergarten students. Althoughteachers indicate that theteaching of any sub-ject may occur at any time throughout the day,they suggested that more formal academicinstruction tended to occur in the afternoon,
The Oregon Conference Monograph, Vol. 7, 1995
after the kindergarten students were dis-missed.
Early Primary Results inWritten Expression
The written expression result, are pre-sented for the sentence copying task, whichwas scored using two criteria presented inTables 3 and 4. The number of correct lettersequences, out of 14 possible was calculated.There were virtually no differences betweenthe high, average, and low achievers in firstgrade, despite the fact that students onlyearned about 54% of the total possible score.The high-achieving kindergarten studentsperformed about as well as the first-gradestudents; the average- and low-achieving kin-dergarten students were about .41 and 1.0standard deviation units below the high-achieving kindergarten students, respectively.
The teacher rated the form and alignmentof the sentence copying task on a 1 to 5 scaleanchored by student samples. They did notrate the students in their own class, and werenot aware of whether a student they wererating was in kindergarten or first grade. In
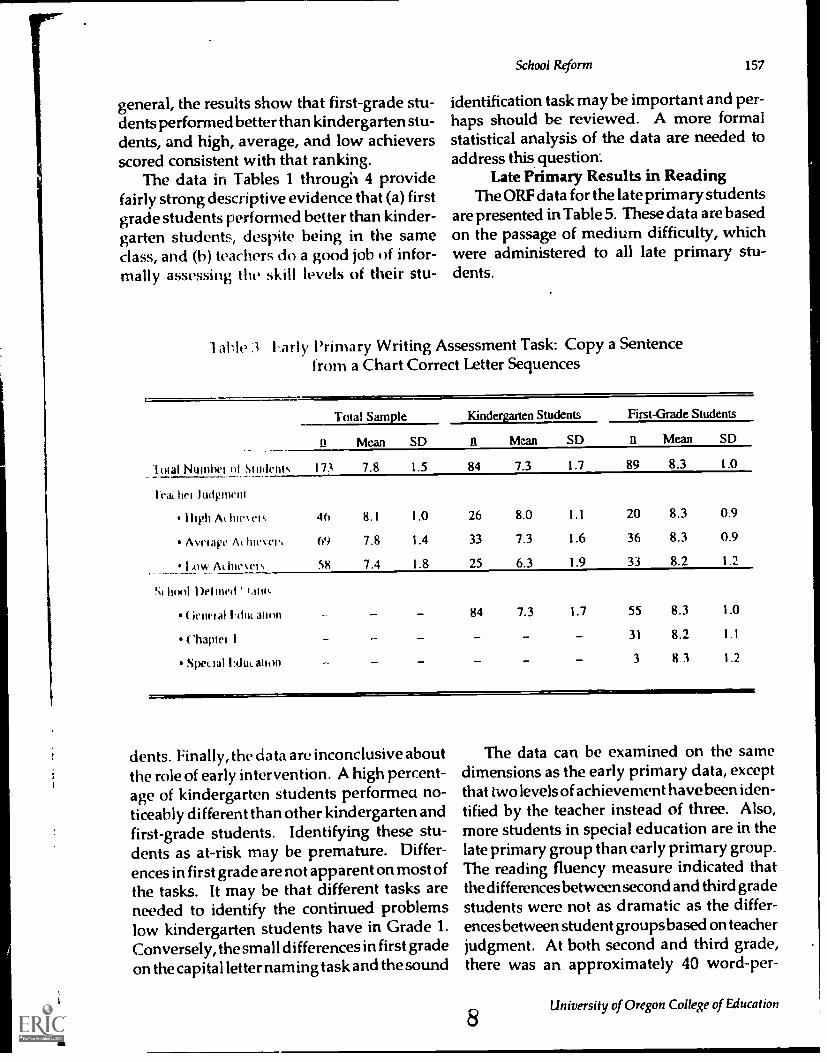
general, the results show that first-grade stu-dents performed better than kindergarten stu-dents, and high, average, and low achieversscored consistent with that ranking.
The data in Tables 1 through 4 providefairly strong descriptive evidence that (a) firstgrade students performed better than kinder-garten students, despite being in the sameclass, and (b) teachers do a good job of infor-mally assessing the skill levels of their stu-
School Reform 157
identification task may be important and per-haps should be reviewed. A more formaistatistical analysis of the data are needed toaddress this question..
Late Primary Results in ReadingThe ORF data for the late primary students
are presented in Table 5. These data are basedon the passage of medium difficulty, whichwere administered to all late primary stu-dents.
I able 3 Early Primary Writing Assessment Task: Copy a Sentencefrom a Chart Correct Letter Sequences
Total Sample Kindergarten Students First-Grade Students
Mean SD II Mean SD 11 Mean SD
(gal Numbr of Student' 173 7.8 1.5 84 7.3 1.7 89 8.3 1.0
Tea. hei.ludrnieni
Mph A( Ilieer 4O 8.1 1.0 26 8.0 1.1 20 8.3 0.9
Aver ape AL 'never, 69 7.8 1.4 33 7.3 1.6 36 8.3 0.9
.1,0w At. lueeis 58 7.4 1.8 25 6.3 1.9 33 8.2 1.2
N(11()01 Defined '
General l.dik awn - - 84 7.3 1.7 55 8.3 1.0
t'haptei I - - - - - 31 8.2 1 I
Special Edw. alum - - - - - 3 8.3 1.2
dents. Finally, the data are inconclusive aboutthe role of early intervention. A high percent-age of kindergarten students performed no-ticeably different than other kindergarten andfirst-grade students. Identifying these stu-dents as at-risk may be premature. Differ-ences in first grade are not apparent on most ofthe tasks. It may be that different tasks areneeded to identify the continued problemslow kindergarten students have in Grade 1.Conversely, the small differences in first gradeon the capital letter naming task and the sound
The data can be examined on the samedimensions as the early primary data, exceptthat two levels of achievement have been iden-tified by the teacher instead of three. Also,more students in special education are in thelate primary group than early primary group.The reading fluency measure indicated thatthe differences between second and third gradestudents were not as dramatic as the differ-ences between student groups based on teacherjudgment. At both second and third grade,there was an approximately 40 word-per-
8University of Oregon College of Education

158 Hall & Baker
Table 4. Early Primary Writing Assessment Task: Copy aSentence from a Chart Qualitative Analysis
Total Sample Kindergarten Students First-Grade Students
B Mean SD n Mean SD n Mean SD
Total Number of Students 173 2.6 1.1 84 2.2 0.9 89 3.1 1.1
leacher Judgment
High Achievers 46 3.1 1.1 26 2.8 0.8 20 3.6 1.2
Average Achievers 69 2.8 I 7 33 2.1 0.9 36 3.4 0.9
1,ow Achievers 58 2.1 0.9 25 1.6 0.7 33 2.4 0.9
School Defined Status
t ieneral 1;,ducation 84 2.2 0.4 55 3.4 1.0
t 'hapter I - - - - 31 2.6 1.1
Slecial Education - - - 3 3.3 1.241=M11111111111111111=111111111711111111
minute difference between high and lowachievement groups. This difference producesan effect size of approximately 1.3 standarddeviation units. Apparently, teachers had astrong sense of their students' basic readingskills, and these reading skills correspondedclosely to their judgments about overall stu-dent reading proficiency.
Late Primary Results inWritten Expression
The data for written expression are pre-sented in Tables 6 and 7. Total number ofwords written is presented in Table 6, and thequalitative score of writing cohesion is in Table7. Teachers die rate their students' writing
h' fore f:ie assessment, so there are no
Table 5. Late Primary Reading Assessment Task: Oral ReadingFluency Correct Words Per Minute
Total Sample Second-Grade Students Third-Grade Students
11 Mean SD n Mean SD II Mean SD
Total Number of Students 158 80.8 33.1 76 68.7 32 7 82 92.0 29.5
School-Defined Status
General Education 120 92.4 26.3 56. 81.3 25.6 64 102.0 23.1
Chapter 1 25 52.6 22.4 14 41.4 22.8 II 66.8 11.6
SnillEducation 13 28.2 21.7 6 14.2 4.0 7 40.3 23.6
Teacher Defined Status
Above Average 85 101.0 22.3 29 94.3 19.4 56 104.0 23.2
Below Averac 73 57.5 27.9 47 52.9 29.0 26 65.8 24.1
The Oregon Conference Monograph, Vol. 7, 1995 9

Sikh,/ keform
Table 6. Late Primary Written Expression Asscf0,111011 1 ask.Total Number of Words Written
159
Total Sample Second-Grade Students 'Duni -tit adc Students
n Mean SD it Mean St) 11 Mean SD
Total Number of Students 152 77.1 46.9 72 60.7 37 7 KO 91 8 49.5
School-Defined Status
General Education 115 81.2 48.5 53 63.8 40 9 62 96 0 49.8
Chapter 1 25 63.2 32.4 14 53 0 22.0 11 76 I 39.5
Special Education 12 66.8 52.6 5 49.2 36.9 7 79.4 60.9
high and low achievement groups as therewere with the reading measure.
As with the reading measure, the third-grade students produced more than second-grade students, although the effect sizes wereless than 1. The most interesting fi ndirtg onthe writing task concerned the relation be-tween the amount of writing done by thespecial education students and how their writ-ing was evaluated. In terms of writing pro-ductivity, the seven special education stu-dents in third grade produced more wordsthan any of the student groups in secondgrade. However, the quality of their writingwas rated the lowest of any group, except forspecial education students in second grade.Although this pattern is based on a smallsample, it does highlight an interesting find-ing that may have instructional implications.For example, instruction with these specialeducation students should focus more heavily,perhaps, on writing content than quantity.
Student Assessment Year 2Setting
The school has made some changes in thenongraded primary structure for kindergar-ten through third-grade students in Year 2 ofthe project. The early primary group, previ-
ously kindergarten and first grade, has splitinto separate kindergarten and first gradeclasses. Two kindergarten classrooms nowinclude morning and afternoon sessions. Thereare about 23 students in each of the four ses-sions. First grade consists of four full dayclassrooms, with approximately 22 studentsper class. Teachers from kindergarten andfirst grade plan together as an early primaryteam, and some activities combine both grades.The late primary team has not altered its orga-nization or instructional approach. An addi-tional change occurred when the school re-ceived recognition and funding under aCarnegie Foundation Grant as a Basic School.
ProceduresThe teachers have decided to maintain a
strong focus on assessment in Year 2. This fall,ea-:h team of teachers (the early primary teamstill consists of kindergarten and first-gradeteachers) met with us to discuss the value ofthe assessment procedures developed andadministered in the spring of Year 1. As eachassessment task was discussed, teachers statedtheir satisfaction with the task and the practi-cal application of the results. The primarytheme that came out of this meeting was thatthe most valued tasks were those that had themost clear implications for instruction. In
10 University of Oregon College of Education

160 Hall & Baker
Table 7. Late Primary Written expression Assessemnet Task:Cohesion Rating on Sentence Flow and Logic
Total Sample Second-Grade Students Third-Grade Students
ft Mean SD Mean SD n Mean SD
Total Number of Students 153 2.5 1.0 73 2.0 0.7 80 2.8 1.0
School-Defined Status
General Education 116 2.6 1.0 54 2.1 0.7 62 3.0 0.9
Chapter 1 25 2.2 0.9 14 1.8 0.7 11 2.5 0.9
Special Education 12 1.6 0.6 5 1.6 0.8 7 1.7 0.4
general, the teachers believed the measuresrepresented what they taught. Overall, theresults were highly valued.
The measures administered in the springof Year 1 could be used only to makesummative decisions. Teachers had a singledata point for each task on each student thatwas collected very close to the end of the year.In planning for Year 2, the teachers discussedseveral issues for decision making such as: (a)individual student performance, (b) instruc-tional /curriculum procedures, (c) group(classwide) performance, (d) school and levelperformance, and (e) communication withparents. Given the nature of the inquiries andthe development of the measures, the teachersdetermined there was value in conductingmultiple assessment activities multiplethroughout the year. For the most part, eachmeasure will be administered at least threetimes during the schcx31 year, at approximatelyequal intervals. A schedule for administra-tion of each measure for the two levels ap-pears in Table 8.Additional Plans
As part of Year 2, teachers targeted stu-dents they believe are at-risk socially, behav-iorally, or academically. Target students willreceive monthly administration of selected
The Oregon Conference Monograph, Vol. 7,1995
measures. Parallel forms of each measurehave been developed for assessment on a fre-quent basis. With parallel forms, the practiceeffect should not influence student perfor-mance. Rather, the datacollected should illus-trate individual progresg or lack of progressover the school year. The measures will bescored in a manner that is sensitive to studentchange. Therefore, monthly monitoring ofstudent performance will provide teacherswith academic information regarding studentprogress. leathers may determine a need forsomehow changing or supplementing the in-structional program.
Teachers may use the data from all mea-sures to undergo program evaluation in anycurriculum area. Additionally, in combina-tion with the measures collected for the entirelevel, teachers will have a local normativecomparison group on identical measures.Teachers can examine an individual student'sperformance in reference to the group, andany movement in relation to relative standingin that group.Early Primary Team
First-grade and kindergarten teachers metcollectively in planning meetings to reviewthe previous year's assessment procedures,and to determine what measures they would
11

School Reform
Table 8. Administration Schedule for Individual Measures
161
MONITORING APPROACII
NORMATIVE INDIVIDUAL
PROGRESS: PROGRESS:
ALL 56 AT-RISK
STUDENTS STUDENTS
EARLY PRIMARY Timesper Year Once per Month
READING
Concepts About Print v v
Letter Names It x V
Letter Sounds 4 N 4 4
Sentence Reading : N N1
Passage Reading v v lf 1
LANGUAGE ARTS
Alphabet Writing 4 Nall
Name Writing 4k 4k vk v k
Sentence Copying 4 4
Sentence Writing 4 4
Sentence Dictation 4 4
Written Express.(Picture) 4 J 4 4
LATE PRIMARY
READING
Passage choice(?) 4 4
Oral Reading Fluency 4 4 J
Oral Retell 4 4 4
LANGUAGE ARTS
Writing Style Sequenced Random
Brainstorm 4 NI 4 4
Writing 4 J 4 4
Editing J 4 4 4
12 University of Oregon College of Education

162 Hall & Baker
use in Year 2 and for Wi IcIL purpose the datawould be used. Additionally, one of the re-source teachers and the speech and languagetherapist attended the early primary team
meetings.Reading. Teachers in both kindergarten
and first grade chose to maintain the readingprocedures developed in Year 1. All students,regardless of age, receive the same measureconsisting of five main tasks (see Year 1 mea-
sure description). Assessment is stopped if orwhen a student "bottoms out." The consider-ation here is for students to demonstrate theirabilities, and teachers do not want to pushstudents into a situation of discomfort.
At this time, the teachers also decided tohave the reading measure administered threetimes during the school year to all students.After analyzing the baseline data in the fall ofYear 2, data from several tasks were informa-tive in terms of student ability or inability tocomplete prereading and reading tasks. Notsurprisingly, students identified as target stu-dents by teachers prior to the assessment gen-erally scored in the lower quarter of the class.
Written Expression. The teachers opted toremove particular tasks from the previousversion of the Written Expression measure.Several tasks had great similarity in skill re-quirements. For the most part, those tasks thatdid not show variance in student performanceand were not useful for diagnostic purposeswere dropped. Tasks that were maintainedthis year also differed between kindergartenand first grade. The types of tasks used in the1994-1995 measures are listed in Table 8.
The teachers decided to have Written Ex-pression measures administered four timesduring the school year to all students. Theteachers were interested in monitoring stu-dent ability to write more independent' andcreatively, using the story starter. Addition-ally, they were interested in observing whenstudent writing skills appeared to changequalitatively (e.g. spacing, alignment, letterformation).
Late Primary TeamTeachers began the decision-making pro-
cess for the 1994-95 school year by reviewingprocedures and results from the previousspring assessment and projects completed incoordination with the grant. The team, con-sisting of six general teachers, one resourcespecialist, and the music specialist began withthe writing measures. Teachers for the mostpart were very satisfied with the format andstructure of t' ^ assessment materials devel-oped and administered in the spring. Twomeetings were scheduled to plan assessmentin reading and written expression for thisschool year. Mathematics measures are still in
the planning stages.Reading. The three reading passages used
in the spring were selected again for fall as-sessment. Teachers found the informationfrom last spring to be very useful, and decidedto maintain the oral reading and oral retellmeasures. They are keeping the same proce-dures as the previous spring, including audiotaping each student. Additionally, the teach-ers decided to have multiple administrationperiods during the year to analyze studentperformance over time rather than having onedata point. The first assessment was adminis-tered in early October, and will bereadministered with parallel form passages in
the winter and late spring. Different readingpassages for winter and spring will be se-lected using the same selection criterion estab-lished in Year 1.
Written Expression. The teachers value writ-ing as an integral part of their curriculum.Writing tasks are interspersed across the in-structional day as component of basic aca-demics and cona,z-nt area instruction. This
year, the teachers have opted to administersimilar writing tasks four times during theyear, approximately once per nine-week quar-ter. In early October, the teachers designed awritten expression task for persuasive writ-ing. Students were to use information theyhad been learning about positivehealth habits
The Oregon Conference Monograph, Vol. 7,1995 13
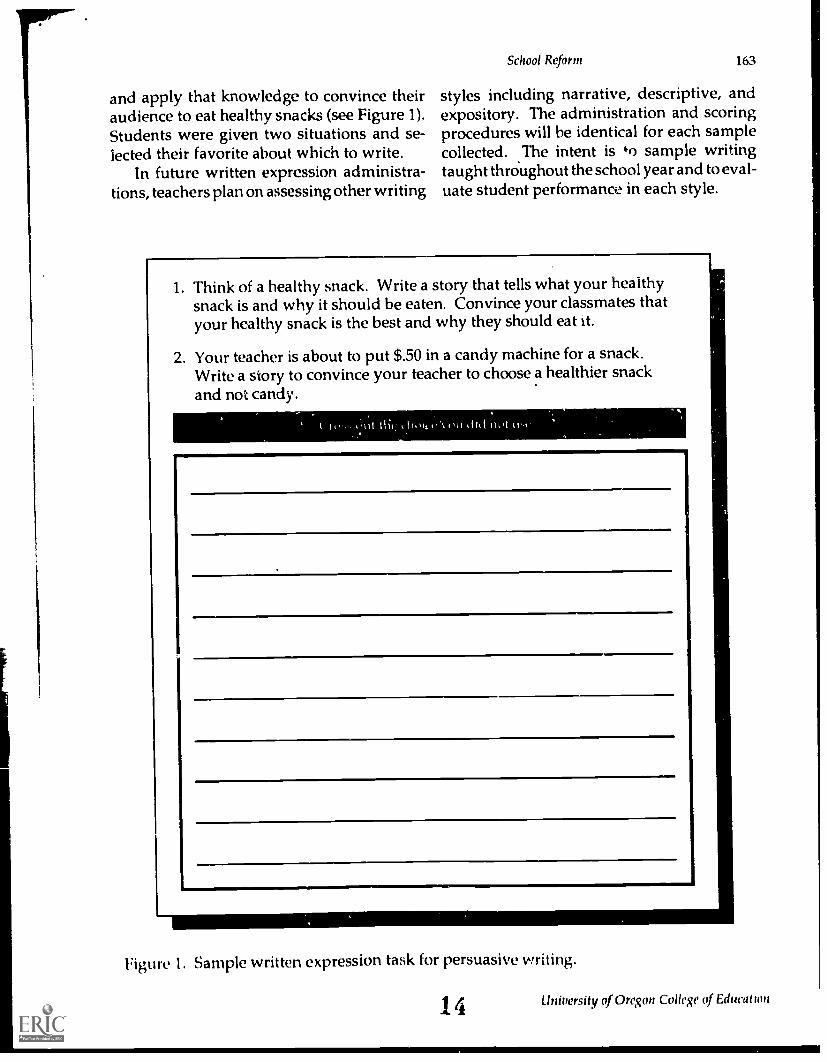
and apply that knowledge to convince theiraudience to eat healthy snacks (see Figure 1).Students were given two situations and se-lected their favorite about which to write.
In future written expression administra-tions, teachers plan on assessing other writing
School Reform 163
styles including narrative, descriptive, andexpository. The administration and scoringprocedures will be identical for each samplecollected. The intent is sample writingtaught throughout the school year and to eval-uate student performance in each style.
1. Think of a healthy snack. Write a story that tells what your healthysnack is and why it should be eaten. Convince your classmates thatyour healthy snack is the best and why they should eat it.
2. Your teacher is about to put $.50 in a candy machine for a snack.Write a story to convince your teacher to choose a healthier snackand not candy.
Figure 1. Sample written expression task for persuasive writing.
14 University of Oregon College of Education

164 Hal! & Baker
Data UtilizationThrough this project, teachers are
transitioning into using more authentic, yettechnically adequate means by which to ob-tain indices of student performance. The in-troduction of classroom-based measures innongraded early and late primary school struc-ture has altered assessment practices for teach-ers in several ways.
In the first project year, we learned currentpractices and student performance. From theinitial assessment information, several tasksin reading and language arts identified stu-dents with differing sic ills. Many studentsclearly demonstrated knowledge on severaltasks. Students' performance was measuredat the same time, yet clear differences in per-formance were evident based on age level andability. Teacher judgments of student perfor-mance were accurate when compared to as-sessment outcomes. This relationship pro-vides us with consequential and social valida-tion of the measures. Additionally, teacherswere able to examine overall level of perfor-mance and evaluate program effectiveness inrelation to the particular curriculum area. Theassessment occurred after the majority of in-struction for the school year was complete.Therefore, as mentioned previously, thesemeasures were summative rather than forma-tive.
In planning for the future, the school con-tinues to work toward systematic restructur-ing, which includes the incorporation of DAPinstruction in a nongraded primary settingthat is inclusive for students with disabilities.Teachers will have direct information for de-cision making on three levels. First, continuedformative evaluation of student performancewill occur in basic academics. Second, datacollection from different contexts will beadded; (a) observations will occur regularly ineach classroom, and (b) the teachers will work
to enhance teacher, school, and parent com-munication concerning student performance
The Oregon Conference Monograph, Vol. 7, 1995
through reports, graphic displays .:nd portfo-lio content.
AssessmentThe measures and procedures developed
in Year I. have contributed to implementationin Year 2. As stated previously, all studentswill receive multiple administrations of eachmeasure, equally distributed across the schoolyear. Administration of parallel forms of thesemeasures 3 to 4 times throughout the schoolyear will serve in the formative evaluationprocess. Teachers will be able to evaluate anyindividual student's performance in compari-son to his previous performance during theschool year anu across multiple years, ratherthan having a single summative report onstudent performance at the end of each schoolyear.
Scoring procedures utilized are sensitiveto small increments of change. By using par-allel forms of each measure multiple timesthroughout the school year, change will bedetected in student performance. Teacherscan use this information to make informedprogram decisions. For example, this fallwhile examining results from an initial mea-sure, teachers could evaluate and /or confirmscores for those students who were behindexpected performance levels. Immediately,the teacher could plan instructional practicesto supplement, or somehow change instruc-tion for that student or group of students.Following the next assessment period, theteachers will be able to evaluate the effect ofthe instructional intervention for an individualor group of students by comparing individualscores from one assessment period to the next.
Additionally, four at-risk target studentsfrom each classroom will be measured monthlyusing parallel forms of selected tasks. By
design, these students were selected by teach-ers for frequent monitoring. Data will bereported to teachers following each assess-ment. Teachers will be able to use this infor-mation from both individually-referenced and
15

r-
norm-referenced view points. They can com-pare the student's performance to previousperformance, noting change as well as indi-vidual performance in relation to relativestanding within the peer group. Teachers canmake informed decisions about a student'sprogress over time and determine if an inter-vention is necessary to best meet the student'seducational needs.
The teachers have a sense of expectationsfor student performance in a DAP setting.Teachers may use these data to judge actualperformance against expectations as well asevaluate the program, curriculum, instruc-tional practices, and individual students.
Observation and ConsultationThe context within which the data are used
is important to the restructuring efforts. Infor-mation collected on student performance isone essential piece within the structure of thenongraded primary setting. Students formthe teacher's classrooms and teachers formthe building structure. Multiple observationshave been randomly scheduled in all non-graded primary classrooms. Our intent ofthese visits is to observe target students andpeers in different classroom contexts. In con-cert with the grant research, observers willattend to the adaptations teachers make in theclassroom structures and instruction for stu-dents with disabilities and students havingdifficulty with classroom academic and be-havioral expectations. Additionally, observ-ers note the inclusiveness of the setting. Inother words, what is the degree to whichstudents with disabilities are involved in in-struction and activities with their peers? Wehope to observe if and when students partici-pate in the classroom setting, and how theteachers adapt instruction to make inclusionsuccessful for all .students in a nongradedprimary classroor.'. with DAP philosophy.
A component implementing the restruc-turing of nongri:J.?d primary classrooms inthis school is the teamwork of teachers. As a
part of team collaboration, teachers will con-
School Reform 165
suit with one another and /or specialists (e.g.,chapter one and resource teachers) regardingstudents for whom they have academic orbehavioral concerns. Recently, the early pri-mary teachers established a schedule of obser-vations in classrooms within their level. Theintent of these visits is to observe teachingpractices, and get procedural information fromone another. But most importantly, the teach-ers wish to discuss areas of concern and col-laborate about the instruction. For example, ateacher asked what the most effective waywas to demonstrate and practice instructionfrom the big books. Rather than merely hear-ing a description of the procedure, this teacherwill observe her colleagues teaching childrenfrom the same level. The teachers will thendiscuss and determine whe.', procedure wouldbe effective in another classroom.
CommunicationAn additional form of decision making
involves communication. Teachers havescheduled assessments to receive studentscores at nine-week grading periods. Graphicdisplays illustrate the performance of eachprimary level group. Scores displayed usingboth a histogram and box plot provide a visualrepresentation of student performance distri-butions (see Figure 2). Teachers also willreceive an individual report on each student,which numerically displays performancescores. Teachers may use the graphs andstudent scores to relate individual performanceto the group.
This year teachers have used results fromthe normative data collection to share withparents the present level of student perfor-mance and relative standing in the group.Teachers and parents were pleased with thisprocedure. Several teachers expressed howeasy it was to demonstrate to parents theacademic expectations of the classroom, andhow their child was doing in relation to class-room expectations, previous performance, andtheir peers,
16thittlersity of Oregon Coll..ege o,. Educrttam

166 Hall & Baker
Oral Reading Fluency forAll Students
Medium Passage(The Lawn)
22.5
20
YE? 17.5
1:115
in
15 12.5
.g) 10z
7.5
5
2.5
00 20 40 60 80 100 120 140
Number of Words Read Correctly per Minute
Descriptive StatisticsM-CWM
Mean 60.336
Std. Dev. 38.733Std. Error 3.206
Count 146
Minimum 0
Maximum 143.000$1 Missing 5
160
140
120
100
80
60
40
20
0
160
Oral Reading Fluency forAll Students
Medium Passage(The Lawn)
MCWM
Figure 2. Correct words per minute tatistics for oral reading fluency tasks.
The Oregon Conference Monograph, Vol. 7, 1995 17

SummaryPlans for data utilization have expanded
during each project year. Teachers will beusing assessment information in numerouscontexts throughout the project. Addition-ally, observations and consultation opportu-nities have been structured to enhance com-munication with other team members andspecialists. Teachers have a much broaderand more accurate base from which to makedecisions about students, curriculum, and pro-gram structure. Finally, reporting proceduresare being developed to share information withparents and the community at large regardingstudent performance in all nongraded pri-mary classrooms.
As the project moves into years threethrough five of imp:ementation, further de-velopment of assessment materials is planned.Teachers are interested in measuring areas ofphilosophic import beyond basic academics.Additionally, the University of Oregon is in-terested in monitoring the methods and pro-cedures the teachers use for adaptation andinclusion of students with special needs in thenongraded primary settings.
ReferencesAdams, M. J. (1990). Beginning to read: Think-
ing and learning about print. Boston, MA:MIT Press.
Baker, S., Hall, T. E., & Tindal, G. ( in review).Assessment views from a nongraded pri-mary school perspective. Diagnostique.
Baker, E. L., O'Neil, H. F., & Linn, R. L. (1993).Policy and validity prospects for perfor-
School Reform 167
mance-based assessment. American Psy-chologist, 48, 1210-1218.
Goodlad, J. I., & Anderson, R. H., (1963). Thenongraded elementary school (rev. ed.). NewYork: Harcourt Brace & Co.
Fuchs, D, and Fuchs, L. S. (1994). Inclusiveschools movement and the radicalizationof special education reform. ExceptionalChildren, 60, (4), 294-309.
Gutierrez, R., and Slavin, R. E., (1992). Achieve-ment effects of the nongraded elementaryschool: A best evidence synthesis. Reviewof Educational Research, 62(4), 333-376.
Linn, R. L., Baker, E. L., & Dunbar, S. B. (1991).Complex, performance-based assessment:Expectations and validation criteria. Edu-cation Researcher, 20, 15-23.
Ogawa, R. T., (1994). The institutional sourcesof educational reform: The case of school-based management. American EducationalResearch Journal, 31(3), 519-548.
Tindal, G. (1993). Curriculum-based mea-surement as an application of learning port-folios. Diagnostique, 18(1), 69-84.
Tindal, G. , Hall, T. E., & Nolet, V. (1993).District-wide performance assessment us-ing curriculum-based measures. Research,Consultation, and Teaching Program, Train-ing Module No. 9. University of Oregon:Behavioral Research and Teaching.
Tindal, G. & Marston, D. (1990). Classroom-based assessment: Evaluating instructionaloutcomes. Columbus, OH: Merrill.
Willis, S. (1991). Breaking down grade barri-ers: Interest in nongraded classrooms onthe rise. ASCD Update, 33(3), 1, 4.
18 I ( iteS011 (III(V (11 I du( i111(01