ED 346 653 EC 301 265 TITLE Development of Science ... · PDF fileIntroduction To Experiment 2...
221
DOCUMNT RESUME ED 346 653 EC 301 265 TITLE Development of Science Simulations for Mildly Mentally Retarded or Learning Disabled Students. Final Report. INSTITUTION Macro Systems, Inc., Silver Spring, Md. SPONS AGENCY Special Education Programs (ED/OSEMS), Washington, DC. PUB DATE Sep 89 CONTRACT G008730289 NOTE 233p. PUB TYPE . Reports - Descriptive (141) -- Guides - Classroom Use - Teaching Guides (For Teacher) (052) EDRS PRICE MF01/PC10 Plus Postage. DESCRIPTORS *Computer Assisted Instruction; *CUrriculum Development; Educational Media; Individualized Instruction; Instructional Materials; Intermediate Grades; Junior High Schools; *Learning Disabilities; Mainstreaming; Material Development; Middle Schools; *Mild Mental Retardation; Science Activities; *Science Instruction; *Simulation ABSTRACT This final report describes the development of eight computer based science simulations designed for use with middle school mainstreamed students having learning disabilities or mild mental retardation. The total program includes software, a teacher's manual, 3 videos, and a set of 30-activity worksheets. Special features of the software for learners with cognitive impairments include an emphasis on graphics rather-than text to present key ideas; the use of a mouse instead of a keyboard for giving commands and manipulating the experiments; the absence of a formal reward/punishment system; the presence Lf simple numeric feedback for confirming measurements; the use of full size scales on the display instruments; voice synthesis of numerical output on demand; a context sensitive help function; and flexible problem solving environments for each simulation. The report lists the project's objectives, results (including field test evaluation and dissemination), and project methodology. The major portion of the document consists of appendices including the teacher's manual and the activity worksheets covering the eight simulations of the following: the physical science laboratory, finding elapsed time, finding length and width, finding area, fiTlding distance using a map, finding seasonal temperatures, and experiments concerned with refrigerators and the pendulum. Teacher and student evaluation forms are also appended. (Nine references) (DB) ******************************ft**************************************** * Reproductions supplied by EDRS are the best that can be mad* * * from the original.document. * ***********************************************************************
Transcript of ED 346 653 EC 301 265 TITLE Development of Science ... · PDF fileIntroduction To Experiment 2...

DOCUMNT RESUME
ED 346 653 EC 301 265
TITLE Development of Science Simulations for MildlyMentally Retarded or Learning Disabled Students.Final Report.
INSTITUTION Macro Systems, Inc., Silver Spring, Md.SPONS AGENCY Special Education Programs (ED/OSEMS), Washington,
DC.
PUB DATE Sep 89CONTRACT G008730289NOTE 233p.PUB TYPE . Reports - Descriptive (141) -- Guides - Classroom Use
- Teaching Guides (For Teacher) (052)
EDRS PRICE MF01/PC10 Plus Postage.DESCRIPTORS *Computer Assisted Instruction; *CUrriculum
Development; Educational Media; IndividualizedInstruction; Instructional Materials; IntermediateGrades; Junior High Schools; *Learning Disabilities;Mainstreaming; Material Development; Middle Schools;*Mild Mental Retardation; Science Activities;*Science Instruction; *Simulation
ABSTRACT
This final report describes the development of eightcomputer based science simulations designed for use with middleschool mainstreamed students having learning disabilities or mildmental retardation. The total program includes software, a teacher'smanual, 3 videos, and a set of 30-activity worksheets. Specialfeatures of the software for learners with cognitive impairmentsinclude an emphasis on graphics rather-than text to present keyideas; the use of a mouse instead of a keyboard for giving commandsand manipulating the experiments; the absence of a formalreward/punishment system; the presence Lf simple numeric feedback forconfirming measurements; the use of full size scales on the displayinstruments; voice synthesis of numerical output on demand; a contextsensitive help function; and flexible problem solving environmentsfor each simulation. The report lists the project's objectives,results (including field test evaluation and dissemination), andproject methodology. The major portion of the document consists ofappendices including the teacher's manual and the activity worksheetscovering the eight simulations of the following: the physical sciencelaboratory, finding elapsed time, finding length and width, findingarea, fiTlding distance using a map, finding seasonal temperatures,and experiments concerned with refrigerators and the pendulum.Teacher and student evaluation forms are also appended. (Ninereferences) (DB)
******************************ft***************************************** Reproductions supplied by EDRS are the best that can be mad* *
* from the original.document. *
***********************************************************************

Final Report
Development of Science Simulationsfor Mildly Mentally Retarded or
Learning Disabled Students
UAL DEPANTEIENT Of EDUCATIONOevoa Ectucatioaai Rafeaarce and improvement
EDUCATIONAL RESOURCES INFORMATIONCENTER ISM)
V4.14 clocumsnI Owl featoducedreceilm0 U1$I fl1 Pariori of ofpanfielliooOvOnaTtag
r Minor chimes Pave Peen mittle to ImploweceProcluchtte muddy
P1:013 of view or opinio0 . stated in dock,.mant 09 not netelearily reovasent otaciaiOEM poplion or policy
CFDA 84.086SImproving Technology Software
Submitted to:
Office of Special Education ProgramsU.S. Department of Education
by:
Macro Systems, Inc.
September 1989
BEST CPPY Pm; ANT

Table of Contents
Abstract
I. Introduction
PageNumber
I- 1
I. Objective 1: To Design the Models Program 1-2IL Objective 2: Prepare Detailed Specifications 1-2III. Objective 3: Write and Debug the Programs 1-2IV. Objective 4: Conduct Field Test at Two Sites 1-2V. Objective 5: To Plan for National Dissemination and 1-3
Distribution
IL Results II-1
I. Instructional Material Produced II- 1
A. The Simulation Software II- 1B. The Activity Worksheet Series 11-9C. The Teacher's Manual II- 1 1D. The Video Introduction II-1 1
IL Field Test Evaluation II- 1 2
A. Overview of the Process II- 1 2B. The Evaluation Instruments 11- 1 3C. Summary of Evaluations II- 1 5
III. Dissemination II-17
Project Methodology III- 1
I. Phase 1: Material Development III- 1
A. Organization of the Design Team III- 1B. Creation of Storyboards III- 1C. Writing and Debugging the Prog:ams 111-4
IL Phase 2: Field Testing 111-4

Table of Contents (cont'd)
Figures
1. Sumir .ry of Evaluations: Teacher Evaluation of Introductory Materials2. Summary of Evaluations: Teacher Evaluation of Experiment3. Summary of Evaluations: Student Evaluation of Experiment
References
Appendices
PageNumber
TEACHER'S MANUAL: Science Simulations For A Physical Science Laboratory
ACTIVITY WORKSHEET SERIES
Experiment 0: The Physical Science LaboratoryIntroduction To Experiment 0Worksheet 0-1: Touring The Physical Science LabWorksheet 0-2: Using The InstrumentsWorksheet 0-3: Using Other InstrumentsTeacher Evaluation Of Experiment 0
Experiment 1: Finding Elapsed TimeIntroduction To Experiment 1Worksheet 1-1: Using The Elapsed Time ClockWorksheet 1-2: Making Time Go Faster Or SlowerWorksheet 1-3: Time Sense
Expetiment 2: Finding Length And WidthIntroduction To Experiment 2Worksheet 2-1: Using The RulerWorksheet 2-2: More Ruler MeasurementsTeacher Evaluation Of Experiment 2
Experiment 1 Finding AreaIntroduction To Experiment 3Worksheet 3-1: Area Of A RectangleWorksheet 3-2: Area Of A CircleWorksheet 3-3: Area Of A Triangle
4

Table of Contents (cont'd)
PageNumber
Experiment 4: Finding Distance Using A MapIntroduction To Experiment 4Worksheet 4-1: Measuring Map DistanceWorksheet 4-2: Measurement IssuesWorksheet 4-3: Ruler With 1/10 Inch Scale DivisionsWorksheet 4-4: Measuring Distances On Paper Maps
Experiment 5: Finding Seasonal TemperaturesIntroduction To Experiment 5Worksheet 5-1: Measuring Air And Water TemperaturesWorksheet 5-2: Temperature ExtremesWorksheet 5-3: Changing TemperaturesWorksheet 5-4: Temperature ScalesWorksheet 5-5: Reading A Circular Thermometer
Experiment 6:Introduction ToWorksheet 6-1:Worksheet 6-2:Worksheet 6-3:Worksheet 6-4:Worksheet 6-5:Worksheet 6-6:Worksheet 6-7:
RefrigeratorExperiment 6Inside Your RefrigeratorTemperatures Inside A RefrigeratorControlling Refrigerator TemperatureKnowing Your Refrigerator ThermostatWhat If The Power Goes OffReading A ThermometerIn Your Own Refrigerator
Experiment 7: PendulumIntroduction To Experiment 7Worksheet 7-1: Working With The PendulumWorksheet 7-2: Observing Pendulum MotionWorksheet 7-3: The Effects Of Mass
EVALUATION FORMS
Instructions For TeachersChecklist For Teacher Evaluation Of CoursewareTeacher Evaluation Of Introductory MaterialsTeacher Evaluation Of ExperimentChecklist For Student Evaluation Of ExperimentsStudent Evaluation Of Experiment
a I

Abstract
Macro Systems, Inc., under a grant from the U.S. Department of Education, Office ofSpecial Education Programs, has developed a series of eight science simulations designedto complement any middle-school physical science curriculum. The simulations arespecifically intended to help learning disabled students who have been mainstreamed into atypical science education environment. The simulations have been carefully constructed toappeal to students with a wide variety of reasoning skills, while maintaining features thatwill be especially helpful to the learning impaired child. The software is accompanied bya Teacher's Manual; threc, videos that can be used to introduce the materials to bothstudents and teachers; and a set of 30 Activity Worksheets to be used with the software.
Special features of the software for cognitively impaired learners include an emphasis ongaphics rather than text to present key ideas; the use of a mouse instead of a keyboard forgiving commands and manipulating the experiments; the absence of a formal reward/punishment system; the presence of easy-to-read numeric feedback for confirmingmeasurements; the use of full-size scales on the display instruments; voice synthesis ofnumerical output on demand; a context-sensitive help function that responds when onepoints at an object or location on the screen in question; flexible problem-solvingenvironments for each simulation that can be approached at different cognitive levels.
tiAbst ract
i

Chapter I
Introduction
;"

Chapter L Introduction
When the Technology, Educational Media and Materials for the Handicapped GrantProgram was first announced in April of 1987, a cover letter written by Dr. JamesJohnson, Chief, Research and Development Projects Branch appeared in the applicationpackage:
This office is committed to improving the education, independent functioning,and employment of handicapped individuals by assuring that the advances oftechnology, educational media, and materials are available, of good quality, andused appropriately. Even with the growing number of new technologiesavailable in the schools today, there exists a need to support planning, research,and development activities to provide for more efficient and ef,fective use ofthese state-of-the-an technological advances. Past research has shown that whentechnology is made available and used knowledgeably it has enormous potentialfor improving the education, independence and employability of individuals withhandicaps. Accordingly, projects will be invited that provide for research,development, and/or dissemination activities related to the use of technology inthe delivery of services to individuals with handicaps.
The impetus behind this solicitation was clear. Few publishers or commercial softwaredevelopers have been willing to risk the capital investment necessary to produce technologyproducts geared to the needs of students with .special learning needs. The special educationmarket is viewed as a "thin" market and stereotypic ideas of what constitutes a specialeducation student preclude mainstream publishers from thinking otherwise.
Macro submitted an application under the priority area "Improving Technology Software."In our proposal to the Office of Special Education Programs, we responded to the languageof the announcement that " Computer simulations of science experiments, and situationsinvolving math and language arts are encouraged."
Key features of the proposal iacluded:
Development of a series of simulation models illustrating scientific principles withspecific features to accommodate the needs of mildly mentally retarded or learningdisabled students to progress in ability-integrated middle school physical sciencecourses.
Software focused on developing skills required in solving many types of problems -classifying, contrasting, hypothesizing, estimating, etc.
A software design consisting of a series of independent simulations that would sharea common user interface. "Point and click" methods to be used to control each ofthe simulations.
Introduction1-1

Cho ter I Introduction
Primary emphasis on the creation of user controls that are as simple and consistent aspossible. Simple methods of starting, stopping, restarting, and changing simulationsto be employed.
Development of the software to be guided by a design team with the approprweexpertise. In addition to the software, a Teacher's Guide and a teacher's utilityprogram to be developed.
Field testing at two sites in the Chittenden South School District in ChittendenCounty, Vermont.
Dissemination either as a commercial product or as free public domain shareware.Commercial publishers to be contacted for the purpose of having them evaluate andpublish the software.
Objectives 1: To Design the Models Program
Activities to include fmalizing members of the design team; reviewing existing simulationsoftware; and convening a mee-ing of the design team.
IL Objective 2: Prepare Detailed Specifications
Create storyboards for the programs; review storyboards with the design team; revisestoryboards as needed; prepare detailed system specifications; prepare detailed modulespecifications; and conduct software quality assurance.
III. Objective 3: Write and Debug the Programs
Assemble and/or acquire the necessary hardware and software; do the programming;prepare a teacher's guide; and conduct subsystem tests.
IV. Objective 4: Conduct Field Test at Two Sites
Finalize field test plan; orient teachers in their schools; and collect formative evaluationdata.
1 Introduction1-2

Chapter I. Introduction 3
V. Objective 5: To Plan for National Dissemination and Distribution
Demonstrate the product to potential publishers; investigate public domain disnibution; andprepare marketing plan component.
introduction1-3

Chapter II
Results
11

IL Results
I. Instructional Material Produced
A. The Simulation Software
1) Characteristics
a) General Description
The series of science simulations we developed, titled "The PhysicalScience Laboratory," has been created to allow students to performphysical science experiments in a completely simulated experimentalenvironment. The software is intended to complement any middle schoolphysical science curriculum. The simulations allow a student to performphysial science experiments using an Apple II/GS or IBM compatiblecomputer system% no external experimental equipment is required. Usinga "mouse," the student manipulates objects on the computer screen toaffect the outcome of each experiment. The simulations are open-endedand experiments may be carried out in a structured or unstructured fashionto suit a particular teaching methodology.
Some of the objects and situations presented on the computer screen aresimilar to those that the student will encounter in the school laboratory;others place the student in familiar environments outside the school; stillothers exploit the computer's potential to create interesting experimentalenvironments that would not normally be available to the student.
Problem sets have been developed (see the Activity Worksheets) for eachsimulation. The skills required to solve the problems start at the level ofsimple observation and advance through levels such as classifying,measuring, generalizing and predicting. A number of simulations aredesigned to help students gain competence in doing basic measurements.A consistent interface is used throughout all of the simulations.
b) Target Audience
The science simulations are suitable for students with a wide variety ofcognitive reasoning skills. Care has been taken to design the software tomeet the needs of middle school-aged learning disabled and mildlymentally rttarded students, particularly those who have been mainstreatned.
The IBM compatible configuration must include VGA or EGA graphics capability, and a COVOX"Speech Thing" attached to the parallel printer port.
12Results
II-1

Chapter IL 'Jesuits
c) Special Features for Learning Impaired Studerts
Special features for learning impaired students incitte an emphasis ongraphics rather than text to present key ideas; the use of a mot= insteadof a keyboard for giving commands and for manipulating the experiments;the presentation of feedback in a non-judgmental manner, i.e., the absenceof a formal reward/punishment system; voice synthesis of experimentaldata when requested by the user; a context sensitive help function thatresponds when the user points (with the mouse) to the object or locationin qi...z.stion; the use of practical, familiar situations to introduce basicconcepts; and a series of problem-solving enviro..ments tkaz can beapproached at different cognitive levels.
d) Technical Objectives Achieved
1 The software provides a simple and common interface to manage thesimulations. The interface is mouse-driven to avoid having to typein commands at the keyboard. The use of a mouse facilitates cursormovement for selecting various options at different positions on thescreen, and for positioning experimental objects.
2. The software maintains technical accuracy in depicting physical:nts. Observations and data obtained during these experiments are
similar to those that would be obtained if the experiment were doneunder the same conditions in a real-world environment. Care hasbeen taken to introduce numbers that reflect physical laws as theyare currently understood.
3. For those experiments that exhibit dynamic behavior, the softwaregives the user control over the rate at which events occur during theexperiments. The simulated laboratory environment includes a clockthat can be used to speed up or slow down dine. Speeding up orslowing down the laboratory clock relative to a real world clock willcause the events occurring in the laboratory to speed up or slowdown accordingly. Time can be stopped altogether to allow criticalmeasurements to be obtained, or to position experimental objects inspace.
1 f'Results
11-2

Cho ter H. Results
2) Modules
a) Experinynt 0: The Physical Science Laboratoq
Objectives
This simulation is designed to point out the important features of thePhysical Science Laboratory that are common to all the experiments. Thenames of the various locations in the simulated laboratory are introduced.Descriptions of the program's features are available using the HELPfacility.
General Description
The Physical Science Laboratory enables the student or teacher to performphysical science experiments in a simulated experimental environment.The experiments take place on the computer screen. All the equipmentand measurement instruments are part of the simulation; no externaldevices are necessary.
Experiments take place on the "lab bench," a rectangular area occupyingthe majority of the screen. The picture displayed in this area varies fordifferent experiments. For instance, it can appear as a table top (thus thelab benclf designation) in one experiment or as an outdoor scene inanother.
At the top of the screen are four "instrument windows" that contain iconsrepresenting various pieces of equipment and measuring tools. (Icons aresmall pictures that can "dragged" about the screen using the mouse.) Oneof the windows is reserved for the elapsed-time clock, which appears inevery experiment. Each instrument window also contains a "value bar"and a "units bar" where numeric and textual information pertaining to theinsmument are displayed.
Using only the mouse as an input device, experimental objects aremanipulated, time is controlled, and measurements are taken. Thenumerical values of the measurements appear in the value bars of thevarious instrument windows as the measurement process is taking place.The data generated from these simulations can be recorded and analyzedin the same fashion as data from any real-world experiment.
1 .1Results
11-3

Chapter II. Results
b) Experiment 1: Finding Elapsed Time
Objectives
This simulation is designed to help students learn how to use the elapsed-time clock in the Physical Science laboratory. Students will learn how tostart, stop and reset the elapsed-time clock. They will learn how to readthe time from the value bar and interpret the units in which time is givenin the units bar. They will also learn how to speed up and slow downtime using the clock speed-control. Students will acquaint themselveswith their own internal sense of time and how it is affected byenvironmental conditions. This experiment can also be used to helpstudents learn to mad the elapsed-time associated with the positions of thehands on a conventional analog clock.
General Description
This environment features a large analog clock resting on the lab bench.The large clock corresponds to the clock icon pictured in the clockinstrument window. The large clock can be started, stopped and reset byclicking (with the mouse) on one of the appropriate "buttons" surroundingit. Hands on the large clockcorresponding to the units selected via theunits barmove when the clock is running. Units of time in hours andminutes, minutes and seconds, or seconds and tenths of seconds areavailable.
In addition to the uaditional analog clock, the student may select fromamong three different sand-in-glass timers for keeping track of time;minute, second, and hoar-glass timers are available. The flow of sandthrough the timers speeds up or slows down as the position of the clockspeed-control is changed.
c) Experiment 2: Finding Length and Width
Objectives
This simulation is designed to help students learn how to read thedifferent scales associated with a ruler, as well as to learn how to use theruler instrument in the Physical Science Laboratory. The student willlearn to read several different scales that show length in units of inchesby tenths, inches by eighths, millimeters, and centimeters.
Re Suits114
Cha er IL Results
General Description
The ruler instniment is used to make length measurements of the objectslocated on the lab bench. As the student makes the measurements usingthe ruler icon, the distance being treasured is displayed in the value barof the ruler instrument window. At the same time a pointer indicates thedistance on a full-sized ruler shown on the screen. The student maychoose to show or hide the number displayed in the value bar. If thevalue is not hidden, then when the measurement is completed it will bespoken by the computer.
Learning to read the different scales of a ruler is a matter of making alength measurement, looking at the ruler scale, and interpreting the results.The program provides constant feedback to the student by showing thescale value while simultaneously displaying the conesponding numericalvalue. Additional reinforcement is accomplished through the use of voicesynthesis.
d) Experiment 3: Finding Area
Objectives
This simulation is designed to help students learn how to read the scalesassociated with a ruler, while at the same time allowing the student toexplore the concept of area measurement. The student will be able tovary and measuit the dimensions of a circle, a rectangle, and a righttriangle. The student will learn how to compute the area of each of thesefigures.
General Description
The ruler instrument is used to make length measurements of thegeometric figures located on the lab bench. As the student makesmeasurements with the ruler icon, the distance being measured isdisplayed in the value bar of the ruler instrument window. At the sametime a pointer depicts the same distance on a full-sized ruler shown onthe screen. The student may choose to show or hide the numberdisplayed in the value bar. If the value bar is not hidden (by havingclicked on it previously) when the measurement is completed, themeasurement will be spoken by the computer.
Three geometric figures appear on the lab bench. The size of eachgeometric figure can be changed by "dragging" the mouse pointer alongthe edge of the figure. The area of the figure being manipulated also
r;Results
11-5

phapter ii Results
appears in the value bar of an instniment window. This number can behidden (or made visible) by simply clicking on the value bar in which itappears.
e) Experiment 4: Finding Distance Using a Map
Objectives
This simulation is designed to help students learn how to read the scalesassociated with a mler. Using the ruler insirument, students will learnhow to measure distances on a map in inches, and convert thesemeasurements into units of miles. (Metric units are also available.) Thissimulation will help the student make the transition from conaete toabstract measurements of spatial dimensions. With computer assistance, ifnecessary, the student will also learn how to measure distances alongroads using a paper map.
General Description
The ruler instrument is used to make distance measurements on a mapshown on the lab bench. The student uses the ruler icon to makemeasurements, and the distance being measured is displayed in the valuebar of the ruler instrument window. At the same time, a pointer showsthe distance being measured on a full-sized ruler at the bottom of the labbench. The student may choose to show or hide numbers displayed inany of the value bars. If a value bar is not hidden, then when ameasurement is completed it measurement will be spoken by thecomputer.
Measurements are made on a map. By clicking on the units bar of theruler, the units of measurement can be changed to inches, centimeters,millimeters, miles, or kilometers. The scale of the map can also beshown in miles or in kilometers. Once distance measurements have beencompleted using the ruler icon, a car icon is available that can be "driven"over the route to provide a rough check on the student's calculations. Thedistance driven, in miles or kilometers, is displayed in the value barassociated with the zar iccn. Clicking on the trip odometer icon resetsthe distance traveled by the car to zero.
17Results

Cha ter H. Results
f) Experiment 5: Finding Seasonal Temperatures
Objectives
This simulation is designed to help students learn how to read the scalesassociated with a circular thermometer, as well as to learn how to use thethermometer instrument in the Physical Science Laboratory. The studentwill also be able to examine the daily variation in air and watertemperature in a typical New England state throughout an entire year.The student will be able to identify days of the year when the averagetemperature is at a maximum or minimum, or months of the year whenthe temperature is changing most rapidly.
General Description
This environment features a thermometer instrument, an icon that can bemoved about the screen to take temperature measurements of the outdoorscene depicted. The average air and water temperature can be measuredin the outdoor scene on a daily basis throughout an entire year. Both themonth and the day of the month can be selected by the student; theoutdoor scene varies to depict the time of year. The temperature read ona given day is equal to the average temperature for that day (the softwarecontains a data base of U.S. Weather Bureau data for the city ofBurlington, Vermont). A large circular analog thermometer appears on thelab bench whose reading always corresponds to the digital readingdisplayed in the thermometer instrument window. The scale can beswitched to show either Fahrenheit or Celsius degrees.
g) Experiment 6: Finding Refrigerator Temperatures
Objectives
This simulation is designed to help students learn how to read the scalesassociated with a linear thermometer, as well as to learn how to use thethermometer instrument in the Physical Science Laboratory. The studentwill also learn about temperature conditions inside a typical tefrigerator:how the temperature inside the refrigerator and freezer compa-tments canbe controlled with the refrigerator thermostat mid how the temperatureswould be affected by a power failure. The student will be able totranslate thermostat settings, normally not shown in degrees, into actualtemperature settings.
Results11-7

Chapter _IL Results
General Description
This environment allows students to measure temperatures in therefrigerator and freezer compartments of a simulated refrigerator. Thestudent can also control the temperatures in the refrigerator by adjustingthe refrigerator thermostat. The thermostat has ten different settingsincluding an OFF position.
The doors of the refrigerator can be opened and closed, and thethermometer icon can be placed inside the refrigerator or the freezercompartment. When the icon is inside a compartment and the door isclosed, the temperature displayed in the thermometer instrument window isthe average temperature of the contents of that compartment. If the dooris opened, the temperature displayed is the temperature of the air in theroom.
The left-hand side of the lab bench exhibits a large analog thermometerwhose scale is readable to the nearest degree. The liquid in the tube ofthis thermometer rises and falls with a change in temperature. Two scalesare available: Fahrenheit and Celsius. Since the Fahrenheit scale hasmore divisions than the Celsius scale, the student can use a "zoomin/zoom out" feature to magnify the image of the Fahrenheit scale toafford a more precise reading.
h) Experiment 7: Pendulum
Objectives
This simulation is designed to help students learn about the factors thatinfluence the behavior of a pendulum.
General Description
The simulation allows students to perform experiments with a pendulum.The student can select any of three different pendulum bobs during anexperiment. The length of the pendulum can be varied by "pulling" onthe cord attached to the pendulum bob. The pendulum experiments canbe performed on the earth or on the moon. Measurement instruments areavailable to measure mass and length as well as elapsed time. A markingpen icon is available to mark the position of the rondulum.
The motion of the pendulum can be stopped at any time. While time isstopped, the pendulum may be positioned at any angular displacementbetween plus or minus 90 degrees. The pendulum will behave in a
Results11-11

Cho ter IL Results
pesiodic manner for small angular displacements and will exhibit non-linear behavior for larger angular displacements. The motion of thependulum is affected by air resistance while on earth, but air resistance isnot a factor on the moon. A small amount of internal friction causesdamping of the pendulum motion both on the earth and the moon.
One of the pendulum bobs (a hollow-looking one) can be used to illustratependulum motion with only the force of gravity affecting the 'motion,regardless of whether the experiment is taking place on the earth or onthe moon. The chief use of the hollow bob is to illustrate thosestatements that begin, "Let us assume the absence of any friction."
B. The Activity Worksheet Serl'es
Each simulation for the Physical Science Laboratory is accompanied by an ActivityWorksheet Series. The first of these documents for each simulation is a detailedintroduction to the simulation environment presented by the computer program. Theremainder of the documents are a series of Activity Worksheets that poseexperimental problems to the student. The worksheets are designed to be filled outwhile solving an experimental problem.
The introductory document for each simulation describes the primary objectives wehad in mind when we created the simulation. It also describes the special featuresassociated with that simulation and provides instructions on how to manipulate eachinstrument or object in the experimental environment. A picture of some phase ofthe simulation always appears on the first page of the introductory document. Thereare a total of eight introductory documents in the series.
Each Activity Worksheet to be filled out by the student is identified by a number anda tet: for example, "Worksheet 5-3: Changing Temperatures." The number 5-3indicates that this worksheet is associated with Experiment 5, and is the third in theseries. Each Activity Worksheet contains several problems designed to be answereddirectly on the worksheet. There are a total of 30 worksheets in the series.
The tides and numbers for the complete Activity Worksheet Series are shown below.
Experiment 0: The Physical Science LaboratoryIntroduction to Experiment 0Worksheet 0-1: Touring the Physical Science LaboratoryWorksheet 0-2: Using the InstrumentsWorksheet 0-3: Using Other Instruments
Results11.8

Eu,Wr IL Results
Experinxnt 1: Finding Elapsed TimeIntroduction to Experiment 1Worksheet 1-1: Using the Elapsed Time ClockWorksheet 1-2: Making Time Go Faster or SlowerWorksheet 1-3: Time Sense
Experiment 2: Finding Length and WidthIntroduction to Experiment 2Worksheet 2-1: Using the RulerWorksheet 2-2: More Ruler Measurements
Experiment 3: Finding AreaIntroduction to Experiment 3Worksheet 3-1: Area of a RectangleWorksheet 3-2: Area of a CircleWorksheet 3-3: Area of a Triangle
Experiment 4: Finding Distance Using a MapIntroduction to Experiment 4Worksheet 4-1: Measuring Map DistanceWorksheet 4-2: Measurement IssuesWorksheet 4-3: Ruler with 1/10 Inch Scale DivisionsWorksheet 4-4: Measuring Distances.on Paper Maps
Experiment 5: Finding Seasonal TemperaturesIntroduction to Experiment 5Worksheet 5-1: '11easuring Air and Water TemperaturesWorksheet 5-2:Worksheet 5-3:Worksheet 5-4:Worksheet 5-5:
temperature ExtremesChanging TemperaturesTemperature ScalesReaiing a Circular Thermometer
Experiment 6: RefrigeratorIntroduction to Experiment 6Worksheet 6-1: Inside Your RefrigeratorWorksheet 6-2: Temperatures Inside a RefrigeratorWorksheet 6-3: Controlling Refrigerator TemperatureWorksheet 6-4: Knowing Your Refrigerator TherinostatWorksheet 6-5: What if the Power Goes OffWorksheet 6-6: Reading a ThermometerWorksheet 6-7: In Your Own Refrigerator
Experiment 7: PendulumIntroduction to Exixriment 10Worksheet 7-1: Working with the PendulumWorksheet 7-2: Observing Pendulum MotionWorksheet 7-3: The Effects of Mass

Chapter Ii Ress lts
C. The Teacher's Manual
Accompanying the software and Activity Worksheets is a 21 page Teacher's Manual.The manual is divided into several sections.
Part I describes the factors that influenced the development of this software. Inaddition, our design goals for the students and teachers who will use this software areclearly stated. Finally, some of the more important educational benefits of computersimulation are presented.
Part II presents important information about the haniware and software required torun the simulation software. Explicit directions are also given for starting up andexiting the simulations.
Part Ill describes the documentation and support materials that accompany thesoftware. The Activity Worksheet Series is introduced. Also, the three methods bywhich users can quickly introduce themselves to the software are described--the videointroduction, the hands-on introduction, and the illustrated text.
Part IV suggests a number of instructional methodologies that teachers may want tofollow while utilizik; this courseware. Methods for using the courseware withlearning disabled children are included. These recommendations are based onclassroom field testing of the courseware. Recommendations for use with children ingeneral are also found here.
The Glossary contains a complete description of all the terms introduced with thissoftware package. For those unfamiliar with _muse" terminology, a separate mouseglossary as provided. The larger glossary contains a description of all the termsassociated with the Physical Science Laboratory.
D. The Video Introduction
Although a video introduction was not one of the original project objectives, it wasfound to be a quick and "natural" way to introduce teachers--and eventually students--to the simulation environment. Videos also served the design team well indocumenting features of the software as it was being developed.
There are three short videos (less than 15 minutes each) accompanying the software.The fust of these, "Using A Mouse," introduces mouse terminology while at the sametime demonstrating the unfamiliar word being described. This video is most suitablefor people who have never used a mouse before.
Results

phepter li. Results
The second video, "Touring The Lab," gives the potential user a detailed look at thefeatures of the Physical Science Laboratory. Watching this video is the quickest wayof learning how the software works.
The third video, "A Sneak Preview," pmviies a look at all the simulations. Teachersget an overview of the capabilities of each of the simulations - making it easier forthem to evaluate the potential usefulness of the software and to familiarize themselveswith its capabilities without having to sit down and use it.
U. Field Test Evaluation
A. Overview of the Process
The formative evaluation of the simulation software and the supporting materials wasdivided into two phases. During the first phase the software was tested in fourschool settings over a period of 2 months. The purpose of the Phase I activities wasto determine whether the software was working in the manner intended. We wereespecially interested in learning what features, were going to be troublesome for thetarget audience. We observed students using the software, and listened carefully toteachers' and students' comments.
During the second phase of the evaluation, the software was tested in three schoolsettings over a period of 3 months. At this time the software was accompanied byall of the supporting materials including the Activity Worksheet Series and the videointroductions. Meetings were held with teachers prior to installation to familiarizethem with the new materials. Three evaluation instruments were prepared for thisstage:
Teacher Evaluation of Introductory MaterialsTeacher Evaluation of ExperimentStudent Evaluation of Experiment
During the second phase of the evaluation, students concentrated on completing theActivity Worksheets either with or without help from their teachers. Teachersworked with or observed students using the software and solving the problems on theActivity Worksheets. Teachers also maintained records of students' progress incompleting the materials using a prepared checklist. We also observed and workeddirectly with students during this phase.
Results4.1#

Chapter IL Results
B. The Evaluation Instruments
1) Teacher Evaluation of Introductory Materials
This evaluation instrument consists of a series of statements about theintroductory materials. For each statement the respondent circles their level ofagreement or disagreement on a scale of 1 to 5. A "I" indicates strongagreement; a "5" indicates strong disagreement. A "3" indicates that therespondent is essentially neutral on that topic. A section for written commentsis provided at the end of each category of statements.
The categories of statements include:
Part I: Video Introduction. Seven statements dealing with the threeintroductory videos.
Part 11: Hands-On Introduction. Four statements concerned specificallywith Experiment 0, which is designed to familiarize users with thePhysical Science Laboratory in a hands-on fashion.
Part III: Written Documentation. Nine statements directed at theTeacher's Manual.
The form containing the actual statements regarding the teacher evaluation ofintroductory materials can be found in the Appendix of this report.
2) Teacher Evaluation of Experiment
This evaluation instrument also consists of a series of statements with which therespondent is asked to agree or disagree. It too is based on a scale of I to 5where a "1" represents "strongly agree"' and a "5" represents "strongly disagree."This same form is used to evaluate each experiment (simulation). To completethis evaluation form each teacher was instructed' as follows:
Familiarize yourself with the Activity Worksheet Series, especially theintroduction to each experiment. Work with or observe students using thecourseware materials. Complete the form Teacher Evaluation ofExperiment after you are thoroughly familiar with the materials andstudent reaction to a given experiment.
2 See the form entitled Instructions for Teachers in the Appendix of this report.
Results

phepter IL Results
The evaluation form contains six categories of statements which are listedbelow. The numbers in parentheses indicate the number of statementsassociated with each category.
Category A: General. (9)Category B: Learning To Use This Program. (6)Category C: Graphics. (3)Cattgory D: Feedback (front the program to user). (8)Category E: Activity Work.lheets. (5)Category F: Instruction. (3)
Several sources were consulted in developing this evaluation form. Theseinclude an in-depth discussion of computer simulation as an educational tool byKistler (1988); a method for student evaluation of software by Ca Bison andHaycock (1988); and an approach by Caffarella (1987).
Doll (1987) was used to provide specific microcomputer criteria and DerekekBlease's book "Evaluating Educational Software" (1986) provided a firmgrounding in educational theory in developing the criteria for evaluation.
Some insights in what to look for while we were testing the software, and theproblems we wanted to avoid in the final product were found in Perry (1986),and consequently some of his criteria found their way into the evaluation form.
Hoffmann's (1985) "Educational Software: Evaluation? No! Utility? Yes!"contains an assertion that supports our decisions about learner contml of thesoftware:
"the important consideration is the user's perceived controlwhich rests on the degree to which the user can manipulate themicrocomputer environment in a purposive, exploratoryfashion."
The need for teachers to watch students using the software being evaluated wasan important consideration given by Test (1985), and influenced ourrecommendations for teachers doing the evaluating.
In the literature that we reviewed, we found no consensus as to what constitutesa definitive software evaluation. Instead, we drew from the literature in aneclectic fashion to establish questions about the factors we identified as beingimportant: both to the teacher and the studenttaking into consideration thespecial needs of the learning disabled student. The Teacher Evaluation ofExperiment form can be found in the Appendix of this report.

Chapter II. ResultsAwiiav Alissimmismommasiou
3) Student Evaluation of Experiment
Students also had the opportunity to evaluate the software and its reatedmaterials. An evaluation form containing 20 statements was created. If thestudent agreed with the statement, they were instructed to circle the "Yes"response, if they did not agree with the statement, they were histructed to circlethe "No" response. If the statement did not apply, they were instructed not tocircle either respense, and continue with the next question. The StudentEvaluation of Experiment form can be found in the Appendix of this report.
C. Summary of Evaluations
1) Participants
Three public schools in Chittenden County, Vermont, participated in theevaluation of the software and the accompanying materials:
1. Shelburne Middle SchoolChittenden South Supervisory School DistrictShelburne, Vermont 05482John Winton, Principal
2. Williston Central SchoolChittenden South Supervisory School DistrictWilliston, Vermont 05495Marion Stroud, Principal
3. Edmunds Middle SchoolBurlington School DistrictBurlington, Vermont 05401Reginald Cross, Principal
Six teachers participated in the evaluation process:
1. Linda KnickerbockerSpecial Educator, Grades 4-8Shelburne Middle School
2. M. Shawn FarleyRegular EducatorSpecial Education Assistant, Grades 4-8Shelburne Middle School

atier II. Results
3. Ellen FarnsworthSpecial Education Tutor, Grades 4-8Shelburne Middle School
4. Scott OrseletSpecial EducatorWilliston Central School
5. Charles WilsonComputer Educator, K-8 Educational Program DevelopmentWilliston Central School
6. John O. McguireRegular Educator/Special EducatorEdmunds Middle School
2) Teacher Evaluation of Introductory Materials
Figure 1 summarizes the responses of the teachers to the introductoty materials.Included are: the statement numbers and statements as they appear in theevaluation instrument; the number of teachers (n) responding to each statement;the MEAN respon3e to each statement on a scale from 1 to 5 (where 1 =strongly agree and 5 = strongly disagree); and the standard deviation (SD) ofthe responses to eaz:h question.
3) Teacher Evaluation of Experiment
Figure 2 summarizes the responses of the teachers to each experiment. Anoverall summary' for each statement is shown in the column labeled ALL. Fora given experiment the following items are included; the statement numbersand statements as they appear on the evaluation instruments; the number ofteachers (n) responding to each statement; the MEAN response on a scale from1 (strongly agree) to 5 (strongly disagree); and the Standard Deviation (SD) ofthe responses.
4) Student Evaluation of Experiment
Figure 3 summarizes the student responses to each experiment. The "number ofrespondents" to each experiment is shown across the top. These studentssuccessfully completed one or more of the Activity Worksheets for a given
The MEAN in the column labeled ALL is a weighted-average of the MEAN responses across all theexperiments for a given statement. Each experiment MEAN is weighted by the number of teachersresponding for that experiment.
Results11-1627

Chapter II. Results
experiment. In most cases, these students had completed all of the ActivityWorksheets for the given experiment before they completed the evaluation forthat experiment.
The students in this group were drawn primarily from the special educationpopulations of their respective schools, i.e., students having learning problemsthat require Individualized Educational Plans (IEPs). Occasiunally, specialeducation students were paired with regular education students and both theirevaluations are included in this summary.
For each experiment, the "number responding" YES or NO to a given statementis shown. The "percent responding" YES or NO is computed by dividing thenumber responding to a given a statement by the number of respondents forthat experiment The percent responding may be less than 100 because studentselected not to respond to some of the statements (which is appropriate forcertain experiments), or circled both the YES and NO responses.
The column labeled TOTAL gives an overall picture of the responses across allof the experiments. The number responding YES or NO to a given statementin the TOTAL column is just the sum of the number responding YES or NOacross all of the experiments. The percent responding is computed by dividingthe number responding by the TOTAL number of respondents. The TOTALcolumn needs to be interpreted carefully in light of the particular evaluationstatement to which it applies.
5) Supplementary Evaluation by a Regular Education Teacher and Her5th Grade Class
Mary Woodruff, a 5th grade teacher at the Williston Central School, utilizedExperiment 5: Finding Seasonal Temperatures to supplement a unit onweather and climate that she was teaching to her regular education class. Herevaluation of that experiment, and the evaluations of her students are shown inFigures 4 and 5, respectively.
III. Dissemination
A major objective of Macro's proposal was the disseminadon of the technology pmductthat is the result of this project. No technology product will be seen and used by thespecial education community unless large numbers of teachers are made aware of itsexistence. Commercial publishing has always represented an important option. although wealso considered distribution of the software as public domain "shareware".
2 LNI
Results11-17

Cho ter H. Results
Durifig the final production of the materials, it became clear that the software andaccompanying materials were too substantial to be a reasonable shareware product. Whenwe demonstrated the software to publishers at TAM and CEC conferences, their enthusiasmfor the product convinced us that it has good commercial potential.
Macro registered its copyright with the U.S. Copyright Office and began the process ofletters, meetings and phone calls that constitutes good marketing. Mindscape, publisher ofthe product "Quest for Files" which resulted from an adaptation of instructional materialfcontract, Was first to review the software and praised it highly. The company isexperiencing a slump in sales and is currently unable to negotiate for new products to addto its existing catalog.
At the invitation of The Learning Company, a prize-winning software company, we sent itfor review to Dr. David Rubin, Director of Development. He was very enthusiastic aboutthe product's commercial potential as an educational software package; however, TheLearning Company has just made a decision to acquire only those software programs thathave home market potential as well as educational potential and this software is definitelydesigned for the classroom. Dr. Rubin suggested that we send it to SunburstCommunications.
Project Director Garrett Hughes spoke with the Director of Development for Focus Mediaat the National Educational Computing Conference and that company requested theopportunity to review the product as well.
At this writing, we are waiting to hear from Sunburst and Focus Media. Both companieshave had the materials for a short time and normal evaluation by a software company forpotential publications takes from 2 te 6 months.
Resufts.1 1
ow 17 11-18

Chapter Iii
Project Methodology

Chapter ill. Project Methodology
I. Phase 1: Material Development
A. Organization of the Design Team
A design team conPistiug of Macro staff and four teachers from three local schooldistricts was organized to formalize the design of the science simulation software.
Two of the teachers who served on this design team are special education teacherswith responsibility for the special education programs in their own schools. Theother two teachers are computer coordinators: one serving the needs of an entireschool district, and the other assigned to a single elementary school while workingwith a district-wide technology committee.
Teachers on design team included:
Allen CurrierComputer CoordinatorBurlington School DistrictBurlington, Vermont
Linda KnickerbockerSpecial EducatorShelburne Middle SchoolChittenden South Supervisory School DistrictShelburne, Vermont
Scott OrseletSpecial EducatorWilliston Central SchoolChittenden South Supervisory School DistrictWilliston, Vermont
Charles WilsonComputer CoordinatorWilliston Central SchoolChittenden South Supervisory School DistrictWilliston, Vermont
B. Creation of Storyboards
The design team held five 3-hour evening meetings over a period of 4 months. Thegoal of these meetings was to specify, as clearly as possible, the design of thescience simulations.
21Project Methodology
III-1

Cha ter Ill. Pro ect Methodolo
After reviewing the criteria established in theproposal, and analyzing the needs ofthe target group, the design team decided to emphasize the following goals in theirdesign efforts: they would design the simulations so that students could learn how to
Do basic measurements
Use these basic measurement skills to solve problems in a physical sciencecontext
The design team then began fleshing out the simulations. These effons werefacilitated by the use of two paper forms (see Appendix). One of these forms wasused to create storyboards, and the other was used for writing out the functionalspecifications of equipment and objects that would appear in a given simulation. The
drawings and functional specifications were presented and discussed by the designteam members at their meetings. After the third meeting of the design team, theprogramming staff and graphic artists at Macro were able to create workingprototypes from the preliminary specifications. These gave the design team a better"look and feel" for how the simulations would actually behave.
During this phase, members of the design team reviewed the current literature andreviewed existing science simulations in the realm of the physical sciences. Only onepiece of published software came close to the design goals of the Physical ScienceLaboratory. This was a set of chemistry simulations known as "Chem Lab,"published by Simon & Schuster.
Chem Lab taught us several valuable lessons in what ma to do when &signingscience simulations. The design team decided not to use the keyboard, at all, toenter instructions: the commands have to be learned and entered - a difficult set ofskills to acquire. In addition, the keyboard severely limits the user's freedom ofmotion in izanipulating objects on the screen. The mouse was selected as the soleinput device.
As a result of trying to decipher the relatively complicated user's manual for ChemLab, the design team decided to produce one or more short, informal videos thatwould introduce the simulation software and demonstrate the basic commands used tocontrol it. As a result, a teacher could use a video to review the software or learn touse the software in a relatively short period of time - independent of the availabilityof the actual hardware or software itself.
At the end of the 4-month design period, the design team had put together a series ofstoryboards and functional specifications that formed the framework for theprogramming effort. Fourteen simulations were proposed. These included thefollowing working numbers and titles;
:3 2
Project MethodologyI11-2

Chapter ilL Project Methodology
0. The Lab1. Finding Elapsed Time2. Finding Length And Width3. Finding Area4. Finding Distance Using A Map5. Finding Seasonal Temperatures6. Finding Refrigerator Temperatures7. Finding Oven And Burner Temperatures8. Finding Mass With A Beam Balance9. Finding Liquid Volume10. Pendulum11. Inclined Plane12. Using A Lever13. Phase Change: Water
The first of these, "The Lab," would be used to introduce the students to thesimulated laboratory environment in which they would find themselves when woridngwith any of the simulations.
The next nine simulations were designed to help students learn basic measurementskills in a variety of experimental, problem-solving environnznts. Each of thesesimulations would display a large instrument with an analog scale. A small,moveable "icon" instrument would control the reading on the large scale.Measurements would be visible on the analog scale as well as in digital format in the"value bar" associated with the measurement instrument. Measurements would alsobe audible through the use of voice synthesis.
The final four simulations were designed to allow the student to apply his or hermeasuremer : skills to solve problems in a more typical physical science laboratoryenvironment.
One of the unique features of this software was to be the flexibility in the way itcould be used by individual teachers. The software itself was not designed toprovide instruction, but to establish learning environments. The teacher would usethese environments for instructional purposes by utilizing Activity Worksheets. Theseworksheets would guide or structure the students interaction with the learningenvironment to produce the desired educational objectives. Preliminary educationalobjectives were formulated for each of the simulations designed.
For learning disabled students, the teacher and student could work together to solvethe problems on the worksheets. The worksheets were to be written for a sixth-pudereading level, so that students could work by themselves or in pairs where that wasdeemed feasible by the teacher. The intent has always been for, the teacher tomaintain control of the instructional process.
ect th ologMe y
111-3
3

Fhapter 111. Project Methodology
C. Writing and Debugging the Programs
In the scheduled time available, the design team decided to concentrate their effortson implementing those simulations which would provide the maximum benefit for thelearning disabled students. These included the simulations which stressed basicmeasurements done in practical, familiar environments.
Once the basic laboratory environment was created (Experiment 0), it was found totake about 5 weeks of programming effort to write and debug each one of thesimulations. Within the scheduled time available, it was possible to createExperiments 1 through 6. Experiment 7 was added to demonstrate the possibilitiesfor a more sophisticated experiment, once the basic nzasurement skills had beenlearned by the student.
II. Phase 2: Field Testing
Field testing was carried out in two phases. The first phase lasted approximately 2months; four different schools were involved in the testing process. An Apple TWOScomputer was supplied to each of the schools in turn for about 2 weeks duration. Duringthis time Macro staff visited the schools and observed the software in use. Preliminaryversions of the Activity Worksheets were supplied for use during this time. Macro staffconsulted frequently with the teachers and students who were using the simulation softwareand the Activity Worksheets. Debugging activities and improvements to the existingsoftware were carried out on a daily basis.
The second phase of the testing period lasted approximately 3 months. Three publicschools in Chittenden County, Vermont, simultaneously participated in this phase. Thenames and addresses of these schools have been given previously in the section titled"Participants." During the second phase of the fieid testing all schools received the finalversions of the simulation software, teacher's manual, video introduction, and evaluationinstruments. Students using the materials were tracked by their teacher(s) using a preparedchecklist. When a student had completed all or most of the Activity Worksheets associatedwith a given experiment, they were asked to fill out an evaluation questionnaire, for thatexperiment. These questionnaires have been described in detail above, along with asummary of both the teachers' and students' evaluations.
In each of the three schools participating in the second phase, teachers sat with the specialeducation students at the computer as they worked through the Activity Worksheets. Inmost cases, two students worked at a computer at the same time. The teacher wouldanswer questions, if asked, about the nature of the assignment. For the most part thestudents took their instructions from the Activity Worksheets.
3.1Project Methodology
111-4

Figure 1(1)
SUMMARY OF EVALUATIONSTEACHER EVALUATION OP INTRODUCTORY MATERIALS
= Number Of Teachers Responding To Each Statement
Mean = Average Of Responses On A Scale From i To 5where 1 = Strongly Agree, 5 = Strongly Disagree
SD = Standard Deviation
No. Statement n Mean SD
01. The Video "Using A Mouseprovides good instruction inlearning how to use a mouse.
6 2.2 1.2
02. I would recommend the video"Using A Mouse" to anotherteacher for use as aninstructional tool.
6 2.8 1.0
03. I would use the video "UsingA Mouse to instruct studentsin how to use a mouse.
6 3.2 1.3
04. The video "Touring the Lab"provides a good overview ofthe basic features of thePhysical Science Laboratory.
6 2.7 0.5
05. I could describe the basicfeatures of the lab to anotherteacher after viewing thevideo "Touring the Lab."
6 2.5 3.3
06. I would use the video "Touringthe Lab" to instruct studentsin the basic features of thePhysical Science Laboratory.
6 3.3 1.2
07. Having a person watch thevideo "A Sneak Preview" is agood way to introduce them tothe simulated environments inthe Physical ScienceLaboratory.
.
6 1.7 0.5
3 5

Figure 1(2)
N . Statement n Mean SD
08. The instructions in theTeacher's Manual for gettingstarted with the hands-onmaterials are clear.
1.2 0.4
09. Starting up Experiment 0 didnot present any significantproblems.
6 1.2 0.4
10. Using the HELP feature is aconvenient way to discover thenames of objects and places inthe Physical ScienceLaboratory.
6
-
1.5 0.8
11. Working through the ActivityWorksheets for Experiment 0 isa good way to familiarizeyourself with the lab'sfeatures.
,
6 2.7 1.2
12.
-
It is easy to find what youare looking for in theTeacher's Manual.
6 1.3 0.5
13. The software's statement ofpurpose is clearly presentedin the Teacher's Manual.
.
6 1.5 0.5
14. The software's intendedaudience is clearly presented.
6 1.7 0.5
15.
4
The software's specialfeatures for the learningimpaired are clearly
_ presented.
6 2.0 0.9
16. The software's intended goalsfor the student are clearlypresented.
6
.
1.7 1.2
17. The software's goals for theteacher are clearly presented.
6 2.0
,
1.1

Figure 1(3)
No. Statement ------ n Mean SD
18 .
.The software' s hardware andsoftware requirements are madeclear.
6
.....
1.3 0.5
,
19 . The glossary of mouse termino-logy is clearly presented.
-6 1.0 0 . 0
.
20.
,
.The glossary of PhysicalScience Laboratory terminologyis clearly presented.
6 1.0 0.0
,

F
SUMMARY OF EVALUATIONSTEACHER EVALUATION OF INTRODUCTORY MATERIALS
ii = Number Of Teachers Responding To Each Statement
Mean = Average of Responses On A Scale From 1 To 5where 1 = Strongly Agree, 5 = Strongly Disagree
SD = Standard Deviation
No. Statement n MEAN SD
01. The Video "Using A Mouse providesgood instruction in learning 1.-Ta toto use a mouse.
6 2.2 1.2
02. I would recommend the video "UsingA Mouse" to another teacher for useas an instructional tool.
6 2.8 1.0
03. I would use the video "Using A Mouseto instruct students in how to usea mouse.
6 3.2 1.3
04. The video "Touring the Lab" providesa good overview of the basicfeatures of the Physical ScienceLaboratory
6 2.7 0.5
05. I could describe the basic featuresof the lab to another teacher afterviewing the video "Touring the Lab"
6 2.5 0.5
06. I would use the video "Touring theLab" to instruct students in thebasic features of the PhysicalScience Laboratory.
5 3.3 1.2
07. Having a person watch the video "ASneak Preview" is a good way tointroduce them to the simulatedenvironments in the Physical ScienceLaboratory.
6 1.7 0.5
08. The instructions in the Teacher'sManual for getting started with thehands-on materials are clear.
6 1.2 0.4
09. Starting up Experiment 0 did notpresent any significant problems.
6 1.2
,
0.4

c,31ww I )
10. Using the HELP feature is aconvenient way to discover the namesof objects and places in thePhysical Science Laboratory.
6 1.5 0.8
11. Working through the Activity Work-sheets for Experiment 0 is a goodway to familiarize yourself withthe lab's features.
6 2.7 1.2
12. It is easy to find what you arelooking for in the Teacher's manual.
6 1.3 0.5
13. The software's statement of purposeis clearly presented in the TeachersManual.
6 1.5 0.5
14. The software's intended audience isclearly presented.
6 1.7,
0.5
15. The software's special features forthe learning impaired are clearlypresented.
6 2.0 0.9
16. The software's intended goals forthe student are clearly presented.
6 1.7 1.2
17. The software's intended goals forthe teacher are clearly presented.
6 2.0 1.1
18. The software's hardware and softwarerequirements are made clear.
6 1.3 0.5
19. The glossary of mouse terminologyis clearly presented.
6 1.0 0.0
20. The glossary ot Physical ScienceLaboratory terminology is clearlypresented.
6 1.0 0.0

Figure 2(1)
SUMMARY OF EVALUATION& TEACHER EVALUATION OF EXPERIMENT
EXPERIMENT NUMBER
n = number of teachers respondingMean - average on scale of 1 to 51=strongly agree, 5=strongly disagreeSD = Standard Deviation
2
Statement
3 4I 5 6 J10 ALL
The Activity Worksheet SeriesIntrodaction to this experi-ment clearly presents theeducational objectives ofthis simulation.
102. The important features of1 this experiment are
thoroughly explained in the1 Activity Worksheet Series
Introduction.
1103. The concepts presented inthis computer simulation are 1
well-suited for learning with1the help of a computer.
5 5 4 3 1 2 1 2 23
2.0
0.7
5
2.0
0.7
1.4 1.3' 1.0
0.5 0.5 0.0
5 4 3
1.4 1.0 1.0
0.5 0.0 0.0
2.0
1
2.0
2.0 1.0 1.0
0.0 0.0
2 1
2.0 1
0.0
1.5
2 23
1.01
1.4
1
0.0
04. Use of this computersimulation aloing with theActivity Worksheets willaccomplish the educationalobjectives stated in theActivity Worksheet SeriesInfornation.
Ii105. This computer simulation
0 provides a needed learninqII tool tor all students.
0
5 5
1.2
0.4
4
3.8 1.7
0.5 0.6
1
1
MI*
2 1 2
1.5
0.7
1 1.0
0.0
2.0 1 1.5
0.8 0.0 0.5 0.6 1 1 1.4
4 1
0.7
23
1.7
1.5
5 4 3 1 2
I 1 41 1.8 1 2.0 3.5 2 1
1 2.0
1 2
1.0
23
2.1
1 0 . 8 1.0 1.0 1.6 0.0 0.0
MEAN
SD
11

EXPERIMENT NUMBER
Figure 2(2)
n = number of teachers respondingMean = average on scale of 1 to 51=strongly agree, 5=strongly disagreeSD = Standard Deviation
i 1 1 I 1-0
I 1 I 2 31 4 5 6 1 10 1 ALL
. 1
IINo.1 Statement1
IC06. This computer simulation
provides a needed learningtool for the special
11 educational student when used11 in a special educationII instructional environment.
5 5I 4 1 3 1 2
1 1 2 23
1.01
2.2.
3.5 3.3 1 1.0 I 1 I 2.3 2.1
0.0 1.1 1.0 2.1 - 0.0 - 1.8
1107. This computer simulationII is particularly wen-n situated to the learningII needs of the mainstreamed11 special education student.
5 5 4 3 1 2 1 2 23
2.4 1.6 3.5 2.7 1 1.0 1 2.5 2.2
1.3 0.5 1.0 1.5 - 0.0 - 2.1
008. This computer simulationprovides a valuable teaching
II tool for teachers to use inan instructional environment.
11
P
5 5 4 3 1 2 1 2 23
1 1.4 2.01 4.0 1 2.3 I 1 J 1.5 I 1 1 1.5 2.1
I 0.5I 1.0 J 1.4 1.2 1 - I 0.7 I - 1* 0.7
1109. This computer simulation111 provides a valuable teaching1 tool for teachers to use in1 a special educationH1 instructional environment.
5 5 4 3 1 2 1 2
I
23
1.4 2.2 3.5 2.7 1 1.0 1 1 2.0 2.1
0.51 1.1 I 1.0
I 1.5 1 -1 0.0
I - . 1 1.4
1110. A teacher with little or no11
1
computer experience could1 operate thts program.
III!
11
5 5 4 3 1 2 1 2
I
23
2.8 2.b 2.8 3.04
2 1 1.5 2 1 1.5
I
I 2.5
0.8 1.1 0.5 1.0 -_1
I
1 0.7 0 7i .
i
MEAN
SD

EXPWIMENT NUMBER
Figure 2(3).
n = number of teachers respondingMean = average on scale of 1 to 51=strongly agree, 5=strongly disagreeSA = Standard Deviation
1
f o1
11
21
31
4I
I 5I
61
101
1 ALL
hNo.j Statement1
C1111. Rased on your observations,H students with little or noH computer experience could11 operate this program.
1
1 5 5 4 3 1 i 2 1 2r
231
1 2.2 1.8 2.3 ". 2.3 21
1 1.5 2 1.0 2.0f
1 o.s 1.1 1.0 1.21
1 0.7 - 0.0
112. The time required to learn1 how to operate just this1 program is less than 151 minutes.1 1
1 5 5 4 3 1 1 2 1 2 231
1 2.2 2.2 2.3 2.3 2 1 1.5 2 1.5
0.8 0.8 1.0 1.2 - 1 0.7 - 0.71P
113. Students not classified11 as special education students}0 had little or no difficulty 1
11 using the mouse to control 1
11 simulation. 1
P
5 5 4 3 1 2 1 2 23
1.81
f 1.81
1 1.81
I 1.71
11
1 1.5 11
1.5 1 1.7
0.41
0.4I
0.5J 0.6
1- 1 0.7 1 -
1 0.7
414. Students classified as11 special education had little 1
11 or no difficulty using the 1
11 mouse to control this1
il
ft simulation. 1
5 5 4 3 1 2 1 2 23
2.0f 1.8
I 1.8I
1.7I
I 21
1 2.0 1 2 1 2.0 1.9
0.0 0.4 0.5 0.6 - 1 0.01 0.0
1115. The measurement instruments
11 in this program were easy1
1
11
to use. I
1/
II I
10 1
5 5
I
4
I
3 1 2 1 2 23
2.4 I 1.0 3.0 2.3 1 2I
1 2.01
21
1 1.0 2.0
1.1 I 0.01
0.8A.
1.2 1 -1
1 0.0 1 0.0i .1
MEAN
SD
-3

EXPERIMENT NUMBER
Rowe 2(4)
n = number of teachers respondingMean = average on scale of 1 to 51=strongly agree, 5=strongly disagreeSD = Standard Deviation
i
1 0 1 2 I 3 I 41
5I
1 6 10 i ALV
No. StatementI
1:
1116. The simulation's graphics,H are appropriate for the
1 intended student audience.
1
1
I
1 5 5 A 1 3 .1 1 A 21
1 1 2 1 23
1
1 1.2 1.4 1.5I
1 1.31
1 2 1 1.51
1 1 1.51
1 1.4
1 0.4 0.5 0.6 1 0.6 1 - 1 0.7 1 -.
0.7 1
117. The simulation's graphics1 are appropriate for the1 task at hand.
1
1
11
1 5
1
5 4 1 3
1
1 1 1 2 1 1
1
2I
1 23
1 1.4
I
1.4
f
2.5 1 1.0
1
1
1 21
1 1.5 1 1
1
1.51
1 1.6
1 0.51 0.5 0.6 1 0.0
1
1 -1
1 0.7 1 0.71
1
i18. The simulation's graphics
11 help focus the student'sH attention on the task atH hand.
11
5
1
5
I
4 3 1 2 1 2 23
1 1.4
1
f1.6
I
I1.8
1
1 1.71
1 2 1 1.0 1
1
1
I
I1.0
I
1 1.5
1 0.94
0.91
f 1.01
1 0.6i
1 -1
1 0.01
1 -I
I 0.01
1
1119. Students can understandH the numeric measurements11 when they are displayed byH the units bars
II
5
1
5
3 3
4 3 1 2 1 2 23
1 1.4f
1.4I 1.0 1
1
1.01
1 1t
1 2.01
1 1
I
3 1.51
1 1.3
1 0.5I 0.5 3 0.0 1 0.0 1 - 1 0.0 1 -
30.7 1
1120. Students can understandH the numeric measurementsH when they are spoken oy theH computer.
II
v
1
1
1
I
5
I
5 4 3 1 2 1 2 23
1.4
I
31.2
I
I1.3
1
1 1.01
1 1
1
1 1.0 1
[
1
I
1 1.01
1 1.2
0.5 0.4I
0.5I
1
,
0.0I
1 - 1 0.0.
1
1 -1
0.0t
1
1
1
MEAN
SD

EXPERIMENT NUMBER
Figure 2(5)
n = number of teachers respondingMean = average on scale of 1 to 51=strong1y agree, 5=strongly disagreeSD = Standard Deviation
1
0 1 2 3 4 5 6 I 10 1 ALL1
NO.I Statement
021. The capability to hide or1 display numeric measurements1 enhances the instructional1 use of this program.
1
5 5 4
I
3 1 24 i
1 2 i 23
1.2 1.2 I 1.3 1.3I
1I
I 1.0I i
11
1.0 1 2.2
0.4 0.4 1 0.5 0.6 -1
0.01 1
- 0.0 1
122. The capability to have the
1 computer speak the numeric1 measurements enhances the
11 instructional use of this
1! program.
5
I
4
5 1 4 3 1 2
i /
11 2 1 23
1.0
4
11.0
1
1 1.0 1.0 1 1.0 1 I 1.0 I 1.0
0.0I
0.0 1 0.0 0.0 - 0.0 -I
I 0.01
1
1123. Students can understand the 5
II HELP I I
5 4
1 I
3
I
1
I
2 1 2 1 23windows whyie using
11 the HELP mode.I 1.4
0
11.6 1 1.3 I 1.0 1 f 2.0
I
1 1
1
1 1.51
1 1.4
II 1 0.5 1
P
0.9 1 0.5 f 0.0 1 - 1.41
- 1 0.7 1
024. Students find the HELP 5
II messages F_____5 4 3 1 2 1 2 1 .3
useful.
II 1 1.4 1
II
1.4 1 1.0 I 1.0 I 1 I 2.0 1 1 1.5 j 1.3
Hi 1 0.9 1 0.9 1 0.0I
0.0 1 -1 1.4 1 - 1 0.7 1
125. Students can understand 5
the HELP they5 4 3 1 2 1 2 23
messages whenll are spoken by the computer. 1 1.6 1
II
1.4 1 1.3 1 1.0 1 1 1 1.5 1 1 1 1.0 1 1.3
I I0.9 1
P 1
0.5 1
1
0_5 1 0.0 1
I
- 1
1
0.7 1
I
- 1
1...
0.0 1
1
MEAN
SD

EXPERIMEWr NUMBER
Figure 2(6)
n = number of teachers respondingMean = average on scale of 1 to 51=strong1y agree, 5=strongly disagreeSD = Standard Deviation
1 --1o 1 1 2 3 I 4 I 5
I 6 I 10 I ALL 1I
No StatementI1
1
26. The absence of value1 5 5 I 4 1 3 1 1 2 1 2 23 1
judgements (by the program i 1 1 I I i
11 to the student) actually 1 1.8 2.0 1 2.0 1 2.3 1 1.5 1 1.5 1.8 1
0 enhances the instructionalH environment created by this 1 1.1 1.0 1 1.2 1 1.2 1 - 0.7 0.0 1
11 program.1 1 1 1 1
027. Students have little 5 1 4 1 3 1 1 1 1 2 22 1
H difficulty understandingI 5
1 1 i i
11 the written instructions 1 3.0 2.8 1 2.8 1 3.0 1 2 2.0 2 2.0 2.7 1
11 on the Activity Worksheets. 1-
H 1 0.7 0.8 1 1.0 1 1.0 1 - - - 0.0 1
128. Students are able to compietsl 41 5 1 4 3 1 . 1 1 1 2 21 I
11 the Activity Worksheets with 11 1 1 I I I 1
I
HI
little or no help from the 1 2.5 2.2 1 2.3 1 2.0 1 2 2.0 2 2.0 2.2 1
teacher.1-
11 0.6 0.8 1 0.5 1 0.0 1 - 1-1-10.01 1
1129. The time required to complete 4 5 4 3 1 1 1 2 21 i
11 any one of the Activity1 I 1 1 I I I I I I
H Worksheets does not exceed I 2.5 1.0 1 2.0 1 2.7 I 21 2.0 2 1 1.5
I 1.9 I
111the student's attention
I-
1 span. 1 0.6I
0.0 1 0.0 1 0.6 I - -I 1 0.7 1 1
11
.g30. The Activity Worksheet 5 4 3 1 2 1 2 22 i
1
11
problems are well correldted 11 1 i 1
1 with the stated objectivet; I 1.0 1.0 I 1.0 I 1.7 I 1 1.5 1 1.0 1.1 1
HI tor this simulation. [ 1 1 1
I 1 0.0 0.0 1 0.0 I 0.6 1 0.7I
-1 0.0
I 1P L 1 1 1 1 1 I 1 1
1
.)
MEAN
SD
51

EXPERIMENT NUMBER
Rowe 2(7)
n = number of teachet respondingMean = average on scale of 1 to 51=strongly agree, 5=strongly disagreeSD = Standard Deviation
0 I 1 I 23 I 4 1 51 6 110 ALL
hNo.1 Statement1K
031. There is a need for more ofII this type of software, whichH allows the teacher to designH the problems tor the student11 to solve.
5 I 5 4 1 3 i 11i I 1 1 2
4 1
23I
2.0 I 2.0F 1
2.5 1 2.3 1 1 1.0 1 1 1.0
1
1.9
1.0 1.01 1
1.0 1 1.2 1 - 0.7 - 1 0.0 .
I
1132. Students are interestedH in the topic addressed byII this simulation.H
II
5 5 4 1 3 1 1 2 1 1
i
1 22
2.8 1.61
2.34
1 2.7 1 1 1.0 1 1 2.0
I
2.1
0.4 0.5 0.51 I
1 0.6 1 - 0.0I 0.0
1133. Students would like to sovleII other problems in physical
11
science using simulation.
2 2 1 1 1 2 1 2 12
2.5 1.0 1.0 1 1.0 1 1 1.0 1 1 1 1.0 1 1.3
0.7I 0.0 1 0.0 1 0.0 1
I 0.0 1 - 1 0.0
11i34. The computer simulation along 5 5 4 3 1 2 1 2
I
231 with the problems posed by
the Activity Worksheets 2.4 2.0i
3.1 1 2.0I
1 1 1.0I
1 1 1 1.0 2.0provide an excellent learning!11111
environment for students. 1 0.9II
1 1.0 I 1.4 1 1.0 1 - 1 0.0 1 1 0.0
MEAN
SD

Figure 3(1)
SUMMARY OF EVALUATION& STUDENT EVAWATION OF IMMANENT
EXPERIMENT NUMBER,
1 0 i 112 i
1 3415i
1
I i
1 6110 ITOTAL 1
I 1 1 I 1 1 1 1 1 1
1Number of Respondents 1 1515 1 413131 1
1 1
1 31616 1 45 1
! ! 1 ! ! 1I 11111111i
1Response 1Yes1No 1Yes1No 1Yes1No 1Yes1No 1Yespo 1YesiNo 1Yespo 1Yespo 1Yespo 1
!Nod Statement I
01. I 44tched the video 9 1 615101 4 101 31013 010 1 3 313 1 213 129 133 1
"Using A Mouse."I tIIIIIIIIIIIIIIII1601 4011001 0 11001 0 11001 0 11001 0 1 0 11001 501 501 331 50164 115 1
102. I watchcl the video 9 6 5 0 4 0 3 0 3 0 0 3 3 3 2 3 29 33"Touring The Lab." l 11111114111111 111
601 4011001 0 11001 0 11001 0 11001 0 1 0 11001 501 501 331 50164 115 1
03. One of my teachersexplained to me how to run 4 1 111 3 1 2 1 1 1 3 1 1 2 1 2 1 1 1 1
1 2 3 3 1 2 4 17 28 1
this experiment before I 11111 I I 1 4 1 1
began doing it myse1f. 271 731 601 401 251 751 33 671 671 33J 33 67 50 50 33 67 38 62 1111111 11 1 1
04. This was the first time 1 111111 11 I 1
used a mouse to move 2 1 13 1 0 1 5 1 0 1 4 1 0 3 1 0 1 3I 0 3 0 6 0 6 2 43 1
things around on the 111111 II I ;
computer screen.1 I 1 1 I 1 1.1 1
131 871 0 11001 0 11 01 0 1 01 0 1100 0 100 0 100 0 100 4 9 1
05. I liked the way theI I I I I I I 1 1
objects were drawn on 141 114 1 1141013 013 1 0 3 0 6 0 6 0 43 2 1
the computer screen.I I 11111 11 1111111 11 1
931 7 1 H01 2011001 0 1100 V 11001 0 1001 0 100 0 100 0 96 4 1
iI I i a 1 1 a a a I a t i i i A a 1 i
Number Responding
Percent Responding

EXPERIMENT NUMBER
1011 1 2 1 3 1 4 1
I I
5 6 1 10 ITOTAL 1
I I1 I I
Numkar of Respondents 115 1 5 I 4 1 3131361611 1 1
1
I
45/ ! I i ! I ! 1
1Response JYesfN o 1Yes1No IYesINo 1YesINo 1YesINo 1YesINo 1YesINo!
1YesiNo 1YesiNo
'No.! StatementI
1I
106. Using the rulerinstrument was easy.
rI 111 2
1
1 2I 0i3i11 3i01310121114101311
4
r
I 311 5 1
I I 1I 1
731 1311 I
401 01 1 1 1
751 2511001 0I 111001 0 1
1 1 1 1 I
671 331 671 0 1 50: ]71 691 111
311 1 i
1
07. Using the thermometerinstrument was easy.
111 1 1 2 0 2101210 [ 2 1 0 1 310 1 5 1 0 4 1 0
73I
7I
1 40 01 1
501 0 1 671 01 I I I
1 671 0 11001 01 1 1
1 831 01
1 671 0 691 2
108. Using the sc.11e (beam
balance) was easy.3
I
I 1 0 1
I t0 1 0 1 0
1
1 0 1 0 1 0 1 2I
I1 0 1 1
1 i
1 01-
1 6 1 0 121 2
20 7 1 0 20 0 1 0 1 0 1 0 0 1 0 67i 0 1 171 0 11001 0 271 4
09. Using the carwas easy.
1 2 1 0 1 0 1 0 1 0 1 012111 1 1
1 0 1 11011
1 1 0
1
1 2
1
3
I
8
7 1311
0 20I
0 1 0I
1 01
1 0 1 671 331 0 1 3311
01
1 171 0 1 33 7 1 18
10.Iunderstood the computerwhen it spoke the numbers.
II 4131
60 3 1 1 1 1 211 1 212 1 1161014 1 1 311
1
13
73 271 2 401
7514
251 3311 1
6711
3311
671 6711
33110011 1
01
1 6711
17 691 29
11. I learned how to gethelp trom the computerwhile doinq the
I-
experiment.
14 115i
f
1
0
0
1
1
3 1113101
1
751
1
1
2511001
1
1 i
1 i
1
1
1 1
11001
1
1
3 101310161015101
1
1
1
0 11
1
01
1
1
1 i
1
0
1 1
1
1
11001
1
11111 1
0
1
1
1 811
1
1
1
0
1
1
421
1
931
1
2
1
4931
7 1100
or,
Rgure3(2)
Number Responding
Percent Responding
rt)

EXPERIMENT NUMBER1 I i I1 0 1 1
I 2 I 31 i 1 1 1
I 4 1 5 I 6 I 0
45
1
1
'Number of Respondents 1 15 5 4 3 I 3 3 6 6
11 1 i 1 I!'Response 1Yes1No YesiNo ,YesiNo 1Yespo 1Yes1No ,YesiNo Ye81N0 Yes1No
t
i1YesINo
INo.1 StatementI
12. I was able to do most ofI this experiment by myself.
10 28 16
1 1 671 271
40 601 751 25 671 33 67 331 67 33 67 33 501 50 621 2I II 1 1 I 1113. I felt like I had control 1 9 I 4 3 2 2 1 2 2 I 1 1 2 2 1 1 1 6 0 5 1 1 301 13
over the experiement.1 I 1 F 11 I 1
1 60 27 60 40 501 50 67 33 33 67 671 33 100 0 831 17 671 29I f 114. I understood the
J I Iinstructions on the 13 2 3 2 4 0 3 0 3 0 3 1 0 1 6 0 5 1 401 5Activity Worksheets.
f 4 1 1 1II I 1
87 13 60 40 100 0 100 0 100 0 1001 0 100 0 83 17 891 111 I I I Ii1 j
15. I liked this programI I I I 1 I I 1better than programs that 11 3 51
0 3 1 3 I 0 3 0 1 2 1 1 5 1 0 5 1 371 6tell me it I'm right or
1I 4wrong.
I I I I I I I 1 I 1
731 20 1001 0 75 25 100 0 100 0 1 671 33 831 0 83 17 821 13
16. I thought the 8 5 5 1 0 2 2 3 0 3 0 1 2 1 1 6 1 0 5 1 341 9experiment wa
11 1 I I I I I 1 I 1interesting.I I I I I I 1 I I 1 1
53 3311001 0 1 50 50 1001 0 100 0 1 671 33 1001 0 83 uI 161 20I I .1 1 1 I t t_ t 1 1 I
Number Responding
Percent Responding

EXPERIMENT NUMBERI
1
I
0i
1 1 2
i
5 1 4I
i 1
3 4 i 5 i 6 110 'TOTAL 1
__i. ,..._41 -1--1 1
3 I 3 1 3 1 6 1 6 1 45 11Number of Respondents
1
1 15I
1Response 1Yes1No IYeslNo 1Yes1No 1Yes1No liesiNo Ives No 1Yes1No fiesiNo 1Yesclki I I I I .A 1 I .1 I
N
No. Statement
117. The questions on the 1 1114 01510 1 41013 01310 3 1 115 0 6 I 2 43activity worksheets were I 11 4 1 1 I 1 Itoo hard for me. ii 11 1 1 1 I I 1 I
7 1 93 0 Ijool 0 11001 0 1100 0 IiooI 0 1001 17 83 0 1001 4 96f 1 1 I 1 1 4 1 1
18. Using this program is agood way to learn about
141 1 4 1 1 2 2 1 3 1 0 3 0 2 1 1 6 0 6 0 1 40 5
this subject.1 1 I 1 1 1
931 7 80 201 50 5011001 0 100 0 67 331100 0 100 0 1 89 11
19. I liked using this1 1 I 1 1 1
program better than 7 1 7 2 3 1 2 2 1 3 1 0 2 1 2 1 1 5 1 3 3 1 26 18using an actual science
1 I 4 1 4 1lab.
1 1 I 1 1 1
471 47 40 601 50 5011001 0 67 33 67 331 83 17 50 501 58 40
20. I'd like to learn more 101 3 4 1 1 3 1 1 3 1 0 3 0 0 2 1 6 0 5 1 1 34 8science using programs
1 i 11 1 1 1 1
like this one.I 671 201 80 201 751 2511001 0 100 0 0 1 671100 0 83 171 76 18
I 1 i I 1 I I i
f ; I
f ;
Figure 3(4)
Number Responding
Percent Responding

References
f; 2

References
Blease, D. 1986. Evaluating Educational Software. Kent, England: Croom Helm, Ltd.
Caffarella, E.P. 1987. "Evaluating the new generation of computer-based instructionalsoftware," Educational Technology April, 19-20.
Ca Bison, D., & G. Haycock. 1988. "A methodology for student evaluation of educationalmicrocomputer software," Educational Technology, January, 25-32.
Doll, C. A. 1987. Evaluating Educational Software. Chicago: American Library Association.
Hofmann, R. "Educational software: Evaluation? No! Utility? Yes!," Journal of LearningDisabilities, June/July, XV111.6: 358-60.
Kistler, J.R. 1988. "Expanding the simulation: An interdisciplinary approach," EducationalTechnology, December, 23-25.
Perry, W.E. 1986. How to Test Software Packages. New York: John Wiley & Sons, Inc.
Test, D. 1985. "Evaluating educational software for the microcomputer," Journal of SpecialEducational Technology, Summer, V11.1: 37-46.
Wallace, J., & R.M. Rose. 1984. "A hard look at software: what to examine and evaluate(with an evaluation form)," Educational Technology, October, 35-39.
References1

SCIENCE SIMULATIONS
PHYSIcAL $CXE.N.CE.1410Qp.14:113
0.$1.-149CRO: syTEms;...r

Science Simulations For A Physical Science Laboratory
Teacher's Manual
(C) Copyright 1989
by
Macro Systems, Inc.
Developed with financial support provided byU.S. Department of Education
Office of Special Education Programs

TABLE OF CONTENTS
Part /: Factors Influencing The Development Of This Software
Statement Of Purpose 1
Intended Audience 1
Special Features For Learning Impaired Students 2Our Goals For The Student 2
Our Goals For The Teacher 3
Technical Objectives Of The Designers 4
Educational Benefits Of Computer Simulation 5
Part Operating The Physical Science Laboratory
Hardware: What You Need 7
Software: What You Weed 7Running The Simulation Programs
Starting Up 7Quitting 8
Part III: Documentation And Support Materials
The Activity Worksheet Series 9Introducing You To The Physical Science Laboratory
Video Introduction - Watch And Listen 9Hands-On Introduction - Try It Yourself 10Text Introduction - Read About It 11
Part IV: Suggested
With ChildrenWith Learning
Glossary
Instructional Methodologies
In General 12Disabled Children 12
Mouse Terminology 13Physical Science Laboratory Terminology 14

PART I: Factors Influencing The Development Of This Software
Statement Of Purpose
This software has been created to allow students to performphysical science experiments in a completely simulated experimentalenvironment. The science simulations developed for this series areintended to complement any middle-school physical sciencecurriculum. The simulations allow a student to perform physicalscience experiments using an Apple II GS computer system; noadditional equipment is required. Using a "mouse," the studentmanipulates objects on the computer screen to affect the outcomeof each experiment. The simulations are open-ended and experimentsmay be carried out in a structured or unstructured fashion to suita particular teaching methodology.
Some of the objects and situations presented on the computerscreen are similar to those that the student will encounter in theschool laboratory; others place the student in familiarenvironments outside the school; still others exploit thecomputer's potential to create interesting experimentalenvironments that would not normally be available to the student.
Problem sets have been developed (see the Activity Worksheets)for each simulation. The skills required to solve the problemsstart at the level of simple obL,ervation and advance through levelssuch as classifying, measuring, generalizing and predicting. Anumber of simulations are designed to help students gain competencein doing basic measurements. A consistent interface is usedthroughout all of the simulations.
Note: The terms simulation and experiment are so closely relatedin the context of this discussion that they are usedinterchangeably.
Intended Audience
The science simulations are suitable for students with a widevariety of cognitive reasoning skills. Care has been taken todesign the software to meet the needs of learning disabled andmildly mentally retarded students: particularly those who have beenmainstreamed into a normal classroom environment.
1
f; ;

Special Features For Learning Impaired Students
Special features !or learning impaired students include anemphasis on graphics rather than text to present key ideas; the useof a mouse instead of a keyboard for giving commands and formanipulating the experiments; the presentation of feedback in anon-judgmental manner/ i.e./ the absence of a formalreward/punishment system; voice synthesis of experimental data whenrequested by the user; a context sensitive help function thatresponds when the user points (with the mouse) to the object orlocation in question; the use of practical/ familiar situations forintroducing basic concepts; and a series of problem-solvingenvironments that can be approached at different cognitive levels.
Our Goals For The Student
1. Allow the student to perform physical science experimentswherever an appropriate computer is available.
2. Give the student greater control over the experimentalenvironment than would be possible in the school laboratory.
3. 1.--wide natural/ unobtrusive and nonjudgmental feedback to'11 student during the course of each experiment.
4. ilaximize he potential for inquiry learning by actively4.he student in the experimental process.
5. Allow for widely differing abilities among the students usingthe same software.
6. Create software that will not be perceived by students asbeing designed just for students with learning disabilities.
7. Provide software that will assist students in learning thebasic competencies associated with physical measurement.
8. Present experimental situations that are fun and interesting:that often take place in familiar environments outside theschool laboratory, but sometimes occur in exotic locations.
9. Create the opportunity to view an experiment under "idealconditions" - those where the simplest assumptions apply - aswell e,s under the more realistic conditions of a physicalscience laboratory.
2

Our Goals For The Teacher
1. Give the teacher control of the instructional process.
The software does not attempt to teach; it allows the studentto learn by establishing problem-solving environments thatenhance learning opportunities. Problems can be posed by theteacher or by the student.
2. Provide feedback to the student in the absence of the teacher.
For example, the experiments dealing with basic measurenentsshow a readable scale for each instrument, as well as adigital display of the value being measured. The digitalreading can be observed at the same time as the scale reading/providing visual feedback to the student who is estimating thenumerical value from the scale reading. The digital readingcan easily be hidden or displayed to facilitate educatedguessing of the scale reading. A synthesized voice can alsobe used to "speak" the displayed numerical value.
3. Minimize the time needed to learn how to use the software.
Three different approaches are taken: video; guided hands-onactivities; and profusely illustrated text. Each of theseprovides an introduction to the Physical Science Laboratoryand its facilities. Refer to the Table Of Contents underIntroducing You To The Physical Science Laboratory forinformation on where to find these materials.
In addition, each program disk/simulation comes with anIntroduction written especially for the teacher. When allelse fails, refer to the appropriate Introduction.
4. Provide the teacher with Activity Worksheets for each of theexperiments.
The Activity Worksheets pose a series of experimental problemsto be solved by the stuvJnt. Space is provided on theWorksheets to write an answer to each question posed.Instructions to help solve the problem are al,o given on thesame Worksheet, but it is often not necessary to read thesebefore attempting a solution. The Worksheets may be duplicatedand distributed to students as needed. The Worksheets arewritten for a Grade 6 reading level.
3
4

5. Encourage the teacher to make instructional videos using thissoftware.
The graphics used in the simulations have been drawn to becompatible with presentation on a standard color televisionset. When individual student use on the computer is notpossible/ the teacher can prepare lessons with voiceaccompaniment and store the results on video tape for use atany time.
Technical Objectives Of The Designers
1. Provide a simple and common interface to manage thesimulations.
The interface is mouse-driven to avoid having to type incommands at the keyboard. Use of a mouse facilitates cursormovement for selecting various options at different positionson the screen/ and for positioning experimental objects.
The Physical Science Laboratory is laid out in a fixed butflexible arrangement. Many of the same screen locations andinstruments can be utilized from one experiment to the next.
2. Maintain technical accuracy in depicting physical events.
Observations and data obtained during these experiments aresimilar to those that would be obtained if the experiment weredone under the same conditions in a real-world environment.Care has been taken to introduce numbers that reflect physicallaw as it is currently understood.
3. Give the user control over the rate at which events occurduring the experiments.
The Physical Science Laboratory comes equipped with a clockthat can be speeded-up or slowed down. Speeding-up or slowingdown the laboratory clock relative to a real world clock willcause the events occurring in the laboratory to sped-up orslow down, accordingly. Time can even be stopped to allowcritical measurements to take place, or to positionexperimental objects in space.
4

4. Produce video images that are compatible with standard colorTV sets to facilitate the production and use of instructionalvideos.
Computer technology is capable of producing very highresolution graphic images on computer video screens.Unfortunately these images can not be reproduced on a standardclassroom or home TV set. Attempting to do so usually resultsin a blurry, sometimes unrecognizable image appearing on theTV screen. Care has been taken in the production of thegraphics for these experiments to assure their viewability ona standard TV set. Teachers can use these images to prepareinstructional videos on a VCR that can be played back on anyhome TV set.
Preparing computer-assisted instructional videos on theApple II/GS computer requires connecting a cable from thecomposite-video-out plug on the back of the computer tothe video-in plug on a standard VCR. The signal from thecomputer is then recorded in the same fashion as youwould record a signal from a TV program or video camera.Some VCR's feature audio dubbing, which will allow therecording of voice over the video image. The videointroductions for these simulations were prepared in thisfashion.
Educational Benefits Of Computer Simulation
1. Computer simulation allc4s the possibility of doingexperiments without requiring the resources normallyassociated with a science lab.
Safety considerations, consumption of resources, andprotection of laboratory equipment preclude the studentfrom doing experiments at school in an unscheduled orunsupervised fashion. Finding time on a school computercan often be easier than gaining access to the schoolscience lab.
2. Computer simulation can be used to illustrate the "ideal"behavior of physical phenomena - the behavior associatedwith the b.mplest assumptions of physical law.
The variables that affect actual behavior can beintroduced and controlled, one at a time, to show howthey modify the simpler behaviors. The differencesbetween an "ideal" environment - for example, one withoutfriction - and a real-world environment can be plainlydemonstrated.
5
71

3. Computer simulation can be used to regulate the time ittakes to do an experiment.
Time can be slowed down or speeded up to suit the needsand temperament of the experimenter. A student with alearning disability can cause the experiment to proceedat a pace that is compatible with his or her skills.
Time can be suspended (like taking a high-speedphotograph) in order to facilitate the taking ofmeasurements or the arrangement of equipment. Forexample/ to position an object for a free-fallexperiment, one need only stop time, move the object toa given height above ground, and then start time to beginthe fall. Time can be slowed down to make the objectappear to .be falling slower, if necessary. Since thetime clock and the events are synchronized, the dataderived from any experiment will always have the properrelationship to real time.
4. Computer simulation coupled with computer graphics canbe used to create problem-solving environments that arenot normally accessible to the student, and at the sametime provide a high degree of scientific interest.
For example/ certain experiments in the Physical ScienceLaboratory series may be moved quickly between the earthand the moon, so that the same experiment can beperformed in both places and the results compared. Whileon the earth, the student views a suburban landscape inthe background, while on the moon he or she ib presentedwith a starlit sky and a craggy lunar surface.
5. Computer simulation coupled with a vCR can be used tocreate video demonstrations of physical phenomena.
The video demonstrations can, of course, be narrated bythe teacher. The teacher can prepare a video library ofready-made demonstrations for instructional purposes.
6

Part II: Operating the Physical Science Laboratory
Hardware: What You Need
The hardware required to run the simulations in the PhysicalScience Laboratory includes an Apple II GS computer, a colormonitor, a mouse (single-button preferred), one or two 3.5-inchdisk drives, and 768K bytes of RAM memory.
Note that 768K bytes of memory represents an increase of 256K overthe standard Apple II GS.
Software: What You Need
Start your computer with the System Disk included with thisteacher's manual. If you have two 3.5-inch disk drives, '.eave thesystem disk in one of the drives while running the simulations.If you only have one 3.5-inch drive, follow the instructions forswapping disks that will appear on the computer screen from timeto time.
Each simulation in the Physical Science Laboratory is suppliedon a separate 3.5-inch program disk. Each program disk is labeledwith an experiment number and title. The program disk, labeledExperiment 0: The Physical Science Laboratory, is supplied withthis teacher's manual to help acquaint you with the Physicalscience Laboratory in a hands-on fashion.
Running The Simulation Programs
Starting Up
Place the System Disk, which accompanies the teacher's manual,into a 3 1/2 inch disk drive. Turn on or reboot the computer. (Toreboot press'and hold the Control, Apple and Reset keys in thatorder, then release them in the reverse order. The reset key isall by itself at the top of the keyboard.)
Place the program disk containing the simulation you wish torun in the other 3 1/2 inch drive (or swap it with the system diskif you have only one drive). A disk icon will appear on the screenwith the same name as that written on the disk label.
A window will emerge from the disk icon. Double click on theicon which appears in that window. The screen will go blank exceptfor the phrase "Launching:" followed by a file name. In about 30seconds the title screen for this disk will appear. The titlescreen contains information about the experiment being run and theregistered user to whom the disk belongs. The title screen will
7

be displayed for a few seconds, followed by the starting screen forthe current experiment.
Using the mouse and the mouse pointer you are now ready tostart the experiment. For best results, look over the Introductionto the current experiment in the Activity Worksheet Series. Forsuggested activities refer to the worksheets, themselves.
Quitting
To quit and return to the operating system:
Normal Exit
First: click on the blue gadget (rectangle) appearing in theClock window in the upper right-hand corner of the screen. Amenu will appear at the top of the screen. You will currentlybe in the menu mode.
Second: click on the QUIT word appearing in the menu.
Third: remove the disk containing the simulation experimentfrom the drive. If you want to get fancy you can drag thedisk icon for this experiment onto the trashcan icon, whichshould be on the screen at this time. The experiment disk willthen eject automatically, and its icon will disappear from thescreen.
Exceptions:
1. If you are already in the menu mode simply click on theQUIT word.
2. If you are in the help mode (the word HELP appears inreverse video (white on black)), then click once or twice onthe CONTINUE word and follow the instructions for a normalexit above.
8

Part III: Documentation And Support Materials
The Activity Worksheet Series
Every program disk for the Physical Science Laboratory isaccompanied by a set of documents known collectively as theActivity Worksheet Series. The first of these documents for eachprogram disk is a detailed introduction to the simulationenvironment presented on that disk. The remainder of the documentsfor each program disk are a series of Activity Worksheets that poseexperimental problems to the student. The worksheets are designedto be filled out while solving an experimental problem.
The introductory document of each simulation describes theobjectives we had in mind when we created the simulation, and alsodescribes the special features associated with that simulation.It is here that you will find a detailed description of how tomanipulate an instrument, or move an object in the experimentalenvironment. A picture of some phase of the simulation alwaysappears on the first page of the introductory document.
For easy identification, each Activity Worksheet in the serieshas a number and a title: for example, Worksheet 1-1: Using TheElapsed Time Clock. The first part of the number indicates theexperiment, and the second part identifies one of a number ofexperimental problem sets associated with this experiment. EachActivity Worksheet contains several problems designed to beanswered directly on the worksheet.
Introducing You To The Physical Science Laboratory
Video Introduction - Watch And Listen
Three short videos appearing on one video tape are packagedwith this teacher's manual. The first video, entitled "Using AMouse", should be considered must viewing for anyone unfamiliarwith mouse terminology. The second video, "Touring The Lab", takesyou through the basic features of the Physical Science Laboratory.Finally, the third video, "A Sneak Preview", gives a brief look atsome of the experiments in this series.
9

Hands-On Introduction - Try It Yourself
After viewing the introductory videos, you're ready for hands-on practice using the Physical Science Laboratory. This hands-onintroduction uses the depiction of the lab on your computer screen,together with the Activity Worksheets for Experiment 0, to acquaintyou with the permanent features of the Physical Science Laboratory.
To begin, get a copy of Worksheet 0-1: Touring The PhysicalScience Laboratory. Find the program disk labeled Experiment 0:The Physical Science Laboratory. You will also need to locate thedisk labeled System.Disk that was supplied with the teacher'smanual.
Note: You must use the system disk that we supply/ otherwise theprograms will not load or function properly.
Follow the instructions on page 7 under the heading StartingUp in order to load the Experiment 0 program disk.
Next, using Worksheet 0-1: complete the exercises found onthis -arksheet. The exercises appear as a series of problems tobe solved. Tha problems appear in shaded boxes on the worksheet.If you can't solve the problem from the information given in theshaded box, read the instructions beneath the problem statement.The activities in Experiment 0 are designed to acquaint studentsand teachers alike with the Physical Science Laboratory.
When you have finished Worksheet 0-1, go on to 0-2.
Note: We strongly recommend that you complete all of the ActivityWorksheets for Experiment 0 before moving on to any of the otherprogram disks.
These activities are designed to familiarize you with thenames and locations of places and things in the lab, as well asgive you practice in using the equipment.
When you are done or want to quit, follow the instructionsunder the heading Quitting, which you can find on page 8.
10

Text Introduction - Read About It
For a written description of the Physical Science Laboratorysee the document titled Introduction To Experiment 0: The PhysicalScience Laboratory, which is part of the Activity Worksheet Series.This document provides a complete introduction to the names andlocations of the permanent features of the lab. This introductioncan be found with the Activity Worksheets accompanying theExperiment 0 program disk.
11

Part IV: Suggested Instructional Methodologies
With Children In General
Video Introduction
Before showing the video Using A Nouse to a student, give themActivity Worksheet 0-1: Touring The Physical Science Lab. They cancheck off the "Mouse Words" on the first page as they watch thevideo.
Worksheet 0-1 also includes a picture of the lab. Beforeshowing the video Touring The Lab give them their copy of Worksheet0-1. As they follow the video they can note the positions in thelab on the Worksheet picture. They won't have time to write thenames in during the video presentation, but the initial associationof place and name can be reinforced if the picture is in front ofthem.
Pretesting Por Basic Measurement Skills
Some of the experiments are designed to help children learnto make measurements of elapsed time, length, and temperature. Inthe real world environment making measurements usually involvesreading the scales of the measurement instruments. To assess theirskill at reading the scale of a ruler and a thermometer, try havingthem solve the problems on the following Worksheets before sittingdown at the computer.
Worksheet 4-3: Ruler With 1/10 Inch Scale Divisions
Worksheet 5-5: Reading A Circular Thermometer
Worksheet 6-6: Reading A Thermometer
With Learning Disabled Children
For learning disabled children who have not acquired the basicmeasurment skills, a one-to-one student teacher ratio works bestwith these materials. The teacher can direct questions at thestudent without having to worry about distractions caused by thepresence of another student or students. Once st,idents havemastered the basic measurement skills, they can work in pairs tocomplete the activities; the presence of a teacher is optional, butoften depends on the personalities and disabilities of theindividual students.
12
'di

Glossary

Glossary: Mouse Terminology
Click To click, tap one of the buttons on the mouse oncewith your finger. Some mice have more than onebutton. Use the left button if your mouse has morethan one.
Click On To click on, move the mouse pointer to the desiredscreen location and click the mouse button once.
Double Click To double click, tap one of the buttons twice inrapid succession. Except for operating systemcommands, double clicks are not required when usingthis software.
Drag
Gadget
To drag an icon to another location on the computerscreen, move your mouse pointer to the icon andpress the mouse button. Move the mouse until theicon is repocitioned on the screen. Release themouse button.
A location on the screen that is associated with aspecific function. For example, clicking on theSTOP gadget in the Physical Science Laboratorycauses the clock to stop.
Icon A representational figure on the computer screenthat you can control with the mouse.
Mouse A hand-held device with one or more buttons thatyou can roll around your desktop. As you move themouse, a figure on the computer screen moves in asimilar direction.
Mouse Pointer An arrow or other directional figure on the computerscreen that moves in conjunction with the mouse.
Press To press, hold the mouse button down until thedesired task on the computer screen has beencompleted.
Release When you release the mouse I..utton, you conclude apress operation. A very fast press and release isa click.
Select/Choose Click on a specified gadget.
13

Physical Science Laboratory Terminology
ActivityWorksheet
ActivityWorksheetSeries
Clock
Clock Gadgets
ClockInstrumentWindow
ClockSpeed-Control
Clock Window
CONTINUE Word
A set of problems designed like a laboratoryworksheet for use with a particular experiment.Experimental problems are posed and apace isprovided to write out each answer. Instructionsfor operating the software and suggestions forsolving the problems are included.
The written materials accompanying the simulationsoftware. For each disk this includes anIntroduction to the experiment and a set of ActivityWorksheets that pose experimental problems for thestudent.
See Elapsed-Time Clock.
The colored rectangles appearing with the Clock iconin the Clock Window. Starting from the upper-leftcorner of the window and proceeding clockwise theyare colored green, red, yellow and blue. They areknow respectively as the START button, STOP Button,RESET Button, and MENU Button or Menu Gadget.
See Clock Window.
See Speed-Control.
Instrument Window number 4. The instrument windowcontaining the Elapsed-time clock.
One of the choices in the Menu Mode. Causes thenext logical activity in the menu mode to occur:either clearing a Help Window from the screen orreturning the user to normal operation of thePhysical Science Laboratory.
14

Elapsed-TimeClock
Help Mode
Pictorially this is the clock icon residing in theClock Window in the upper-right corner of thecomputer screen. The hands on the clock icon donot move. Experimentally the clock is used tomeasure and control the advance of time during anyexperiment. The clock may be started, stopped andreset using the Clock Gadgets. Experimentalactivity takes place when the clock is running andis held in abeyance while the clock is stopped.The current value of the elapsed time is shown inthe Value Bar of the clock window. The selectedunits are snown simultaneously in the clock UnitsBar.
An operating mode in which an active menu is presentin the Menu Bar. Selecting any location on thescreen (except in the Menu Bar itself) will causea Help Window to *pear in the center of the screen.To exit the Help Mode you must click on the CONTINUEWord twice.
Help Window A Window containing text that is used to describea feature of the Phys!.cal ScierIce Laboratory. HelpWindows are normally accessed by clicking on a givenobject err .,ocation while in the Help Mode. The HelpWindow wi....l contain the name of the location or,Ibject that was last selected and a briefdesnription of that location or object. The SPEAKWor/, available in the Menu Bar at this time, canbe selected to cause the L:omputer to voice the wordsappedring in the help Window. To access anotherHe3p Window you must first click on tne COINVINUEWord in the Menu Bar.
HELP Word One of the choices in the Menu Mode. Clicking onthe HELP Word causes the HELP word itself to appearin reverse video. This indicates that the programhas entered the Help Mode.
Lab Bench The area in the Physical Science Laboratory used tcdisplay and perform the current experiment.Comprises most of the display area but does notinclude the Menu Bar, the Instrument Windows, orthe Slide Bar.
15
S,2

InstrumentShelf The upper half of an Instrument Window. Used
primarily to store instruments and lab equipment.These may usually be dragged or moved to otherlocations in the lab for measurement purposes.
InstrumentWindow
Menu
Menu Bar
Menu Gadget
MENU Button
Menu Mode
Next Gadget
A location in the Physical Science Laboratory,always visible on the computer screen, used forstoring measurement instruments, control instrumentsand equipment, and for displaying the numericalvalue and units of measurement associated with aninstrument reading. Occasionally, purelydescriptive information will appear in an instrumentwindow. The window itself is made up of threeparts: the Instrument Shelf, the Value Bar, and theUnits Bar. There are four instrument windows in thelaboratory. The windows are located just below themenu bar at the top of the screen.
A set of words located in the Menu Bar at the topof the computer screen.
Approximately the top 1 centimeter of the computerscreen that is visible when running the simulationsoftware. Normally the title of the currentexperiment is displayed in the menu bar until theMenu Gadget is selected.
The blue rectangle in the lower-left corner of theClock Instrument Shelf. Clicking on the Menu Gadgetwhile operating the experiment c Is allexperimental activity to cease and a Meni appear.
See Menu Gadget.
An operating mode in which an active menu is presentin the Menu Bar. Selecting one of the words in themenu bar will cause the corresponding activity tooccur. The menu mode is attained by selecting theMenu Gadget.
A white rectangle that may appear in any one of thefirst three Instrument Shelves. Used to rummagearound on an instrument shelf for additionalinstruments or equipment that may be stored there.Clicking on the next gadget will cause the currentinstrument to disappear and the next one in line toappear. Continued clicking will allow the user tocycle through the available instruments or equipmentstored on that shelf.
16

Program Disk A 3 1/2 inch disk containing the computer programand graphic displays necessary for simulating agiven experimental environment.
WIT Word One of the choices in the Menu Mode. Causes thesimulation program to stop running and returnscontrol to'the Apple II GS operating system.
RESTART Word One of the choices in the Menu Mode. Causes thecurrent simulation to start over from the verybeginning. Same results as clicking on the diskicon for the experiment disk.
RESET Button The yellow Clock Gadget in the lower-right cLrnerof the Clock Instrument Shelf. Clicking on theRESET button once has the same effect as clickingon the STOP Button. Clicking on the RESET buttona second time before the Clock is restarted causesthe elapsed time on the clock to be set to zero.The experiment remains inactjve until the clock isstarted.
Slide Bar
RPM( Word
Provides the boundaries for movement of the ClockSpeed Control. Appears as a narrow rectangle onthe right-hand side of the computer screen belowthe Clock Instrument Window.
One of the choices in the Help Mode. Clicking onthe SPEAK Word causes the text appearing in thecurrent Help Window to be voiced by the computer.
Speed-Control A device for controlling the rate at which timeadvances in the Physical Science Laboratory relativeto a real-time clock. The speed-control is used tospeed time up, where possible, and to slow it down,when necessary. It appears as a small, whiterectangle in the Slide Bar. Dragging it up, speedsup time; dragging it down, slows time down. Thefactor by whi-h time is affected may be read in theClock Value Bar while adjusting the position of thespeed-control. Note that adjustments by the usercan only be made while the clock is stopped. Whilethe clock is running, the speed-control factor maybe seen momentarily by clicking on the speed-control itself. The amount of adjustment possibledepends on the experiment. If an experiment canonly run more slowly than real-time, the speed-control will adjust its position automatically toindicate the factor at which the experiment isrunning.
17

START Button The green Clock Gadget in the upper-left corner ofthe Clock Window. Clicking on the START buttonstarts the Elapsed-Time Clock and experimentalactivity at the same time.
STOP Button The red Clock Gadget in the upper-right corner ofthe Clock Window. Clicking on the STOP button stopsthe Elapsed-Time Clock and experimental activity atthe same time.
System Disk The disk containing the Apple II GS operatingsystem. You must use this operating system whenrunning the science simulations.
Teacher'sManual A guide to the simulation software. Contains
sections describing the development philosophy,mechanics of operation, documentation and supportmaterial, suggested instructional methodologies,two glossaries - one for mouse terminology, and onefor the Physical Science Laboratory terminology -and an appendix on preparing instructional videos.
ThermometerInstrument One of a number of measurement instruments. This
one is designed to measure the temperature of placesor objects in the Physical Science Laboratory bydragging the thermometer icon to the desiredlocation and releas:.ng it at that point. Thetemperature will be monitored as long as thethermometer icon is on the Lab Bench. The value ofthe temperature may be read in the Value Bar of theInstrument Window from which the thermometer wasobtained. The units of temperature will appear inthe associated Units Bar. The numerical readingwill be voiced by the computer whenever thethermometer is moved to a new location and the valuebar is not in its hidden state. The numerical valuewill also be voiced by the computer whenever theuser clicks on the value bar and causes thenumerical value to reappear from its hidden state.
18

Units Bar The bottom section of an Instrument Window.Normally used to display the units of measurementassociated with the numerical value that is beingdisplayed in the Value Bar. Clicking on the unitsbar causes the unit of measurement to change to someother unit. Continued clicking will allow the userto cycle through the available units of measurement.The value in the Value Bar will change automaticallyto correspond with the current unit of measurement.The value bar may also be used to dis?laydescriptive information about equipment appearingin that window.
Value Bar
Window
The middle section of an Instrument Window.Normally used to display the numerical valueassociated with a measurement or control instrumentthat is active in that window. Active instrumentsare those that have been obtained from theInstrument Shelf of that window and are currentlyvisible. Clicking on the value bar will cause thenumerical information displayed there to be hiddenfrom view. Clicking again will cause it toreappear. Whenever the value bar is in its hiddenstate, voice synthesis of the numerical value willbe suppressed. The value bar may also be used todisplay descriptive information about equipmentappearing in that window.
A rectangular area appearing at some location onthe computer screen. Normally its perimeter isdrawn in a color that contrasts with the backgroundcolor of the screen. The interior of the window isused to display text or graphics. Windows may bea permanent or temporary feature of the experiments.
19

introduction to Experiment 0:
The Physical Science Laboratory
S -l'
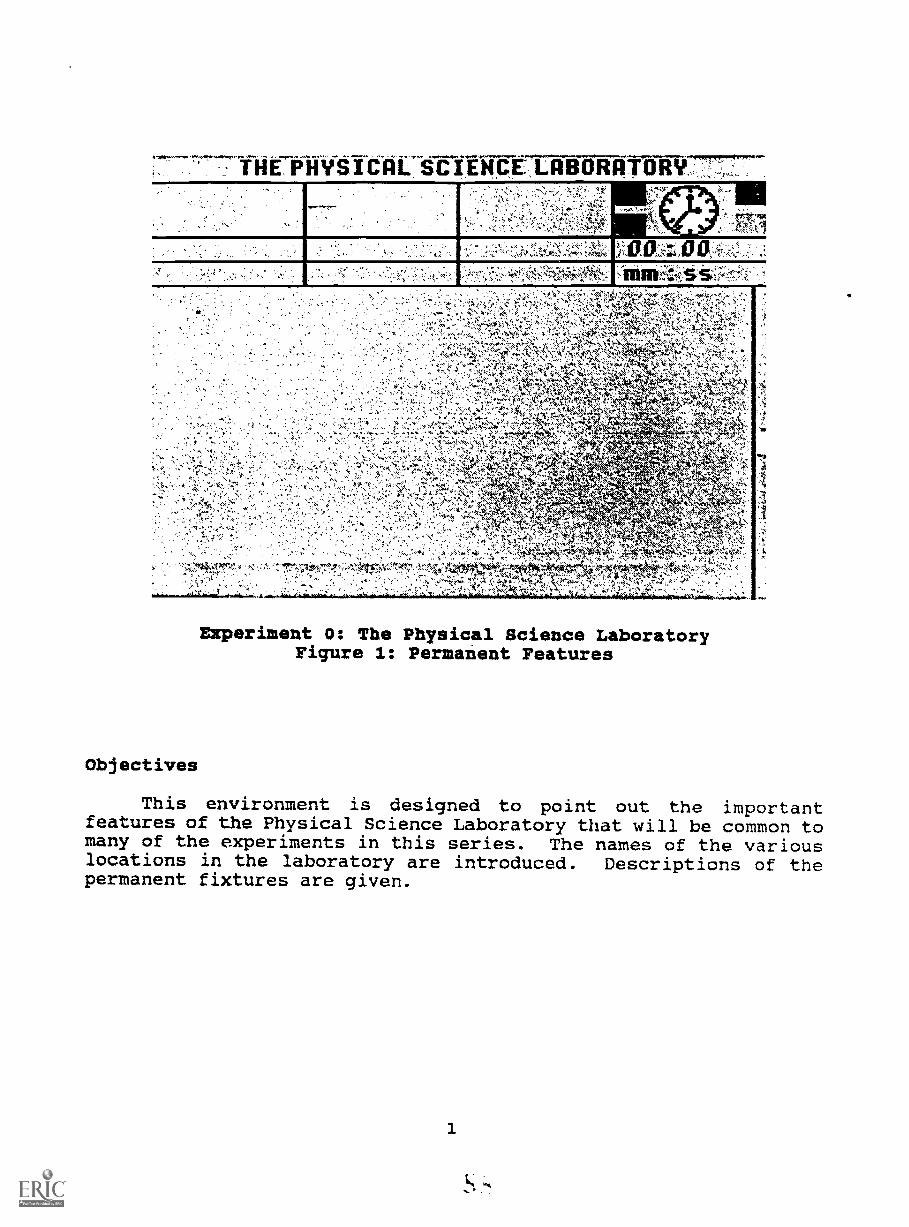
Experiment 0: The Physical Science LaboratoryFigure 1: Permanent Features
Objectives
This environment is designed to point out the importantfeatures of the Physical Science Laboratory that will be common tomany of the experiments in this series. The names of the variouslocations in the laboratory are introduced. Descriptions of thepermanent fixtures are given.
1
S

Features
General Description:
The Physical Science Laboratory enables the student or teacherto perform physical science experiments in a simulated experimentalenvironment. The experiments take place on the computer screen.All the equipment and measurement instruments are part of thesimulation; no external devices are necessary.
The laboratory, as it appears on the computer screen, isdivided into several important locations including the lab bench,the instrument window, the menu bar, and the slide bar for theclock speed-control. Each instrument window is further subdividedinto an instrument shelf, a value bar, and a units bar.
The elapsed-time clock is a permanent fixture of thelaboratory as well as its associated clock speed-control. A nextgadget sometimes appears to enable the experimenter to search aninstrument shelf for other instruments or equipment.
Experiments take place on the lab bench. Depending on theexperiment, various pieces of equipment appear as needed on the labbench. Other equipment and measurement instruments can be obtainedfrom the instrument shelves.
The scene depicted on the lab bench al,so varies for differentexperiments. It can appear as a table top (thus the "lab bench"designation) in one experiment, or a mountainous, outdoor vista inanother.
Using only the mouse as an input device, experimental objectsare manipulated, time is controlled, and measurements are taken.The numerical values of the measurements appear in the value barsof the various instrument windows as the measurement process istaking place. The data generated from these simulations can berecorded and analyzed in the same fashion as data from any real-world experiment.
2

THE PM1 Isni7 CIE CEMWRATARY s,
'art
.
1, 11
LAB BENCHThe experimentstake place here.Drag or moveinstruments tothe LAB BENCH tomake measure-ments,
Experiment 0: The Physical Science LaboratoryFigure 2: The Lab Bench
vesni
The lab bench occupies the lower and major portion of thePhysical Science Laboratory. All experimental activity takes placeon the lab bencn. This activity may include controlling or movingequipment that is located there. It may also involve bringinginstruments to the lab bench, such as thermometers and rulers, inorder to do measurements.
3

,
E'PHYSICAC,SCUNCETKOBIIRATORY 111
Includes:INSTRUMENT SHELFVALUE BARUNITS BAR
Experiment 0: The Physical Science Laboratory
Figure 3: Instrument Window NUmber 1
An instrument window is a location for storing measurement
instruments, control instruments and equipment/ and for displaying
the numerical value and units of measurement associated with an
instrument reading. Occasionally, purely descriptive information
will appear in an instrument window.
Instrument Window Number 1 appears near the top left-hand
portion of the screen, as shown in Figure 3. There are three other
instrument windows in the laboratory numbered 2 through 4,
respectively. Each window is divided into three sections. The
top section is called the instrument shelf, the middle section is
known as the value bar, and the bottom section is called the units
bar.
4

ARTOR47
Look here forinstruments,controls, andequipment.
Experiment 0: The Paysical Science LaboratoryFigure 4: Instrument Shelf In Window Number 1
The instrument shelf is used to store instruments andequipment. A measurement instrument can be removed from the shelfby dragging it with the mouse to the lab bench. A controlinstrument, such as an oven thermostat, may remain on the shelf andbe used to control a piece of equipment, such as an oven that issitting on the lab bench. Other equipment that may prove usefulduring experiments - pencils, erasers, hourglass timers, etc. - canalso be found on the instrument shelves.
Each instrument window interacts with the instruments that arestored on the instrument shelf of that window. When an instrumentis visible and actively measuring experimental data, the numericalvalue associated with that measurement appears in the value bar ofthat instrument window, and the units of that measurement appearin the units bar.
5

SCIENCEXflØURATORYORY
Contains anumber or namebelonging to theobject on theINSTRUMENT SHELF
./.4 .
Experiment 0: The Physical Science LaboratoryFigure S: Value Bar'In Window NUmber 1
The primary use of the value bar is to display the numericalvalue associated with the measurement instrument that is currentlyactive in that window. There may be several instruments or piecesof equipment associated with a window, but only one may be activeat a time. The active instrument is the one that is visible andis residing on the shelf, or is visible and has been moved to alocation on the lab bench.
Another use of the value bar is to display informationassociated with a piece of equipment that is currently active inthat window. The exact nature of the display depends on the itemin question.
Clicking on the value bar causes the number to disappearbehind a white b3r if the value is currently displayed; clickingwhen the number is obscured will cause it to reappear.
6

^
UNITS BARin WINDOW 1
The units ofmeasure (such asinches or seconds),or a descriptionof the quantity inthe VALUE BAR.
Experiment 0: The Physical Science LaboratoryFigure 6: Units Bar In Window Number 1
The primary use of the units bar is to display informationassociated with the units of measurement of the number appearingin the value bar. For example, the units bar may display the terminches, or the abbreviation cm, if the ruler instrument is in use.
Clicking on a units bar will cause the unit of measurementdisplayed there to change to some other unit of measure. Theassociated numerical value in the value bar will change at the sametime. For example, if the unit of measure displayed in the valuebar is inches, clicking on the units bar may change the display tocm. If the value bar originally showed 1.00, it would change to2.54. Continual clicking on the units bar will allow the user tocycle through the available units.
The units bar may also be used to display purely descriptiveinformation at various times.
7
0 4

THEPHYS(C)W-St/E)iCE LABORATORY1111
,
umber2
Includes:INSTRUMENTSHELFVALUE BAR THE! PHYBICAL SCIENCrLABORATORYUNITS BAR
Includes:INSTRUMENT SHELFVALUE BARUNITS BAR
Experiment 0: The Physical Science LaboratoryFigure 7: Instrument Window Numbers 2 And 3
Instrument windows numbers 2 and 3 have the samecharacteristics as instrument window number 1. The differentwindows are sometimes referred to by their numbers, but are oftennamed by the instrument that is active in a particular window. Forexample, if the thermometer instrument is visible in window 3, thatwindow may be referred to as thc thermometer instrument window orthe thermometer window. The value bar in that same window wouldbe called the thermometer value bar. Similarly the units bar wouldbe called the units bar for the thermometer.
8
r

ACTIVITY WORISNEET SERIES DRAFT 11/10/88 3:26pm MACRO GAH
figure
Experiment 3: The Physical Science LaboratoryFigure 8: Example Of A Next Gadget
Occasionally an instrument window or the lab bench willcontain a next gadget. Next gadgets are displayed as small whiterectangles. Next gadgets are used to indicate that otherinstruments or equipment are residing at the same lpcation, but arenot visible. Clicking on the next gadget.will qause the next"item at that location to become visible, replacing the item thatwas currently visible, or fill.Lng the void,,irnothing was there.
INTRODUCTION TO EXPERIMENT 0 9

Click here to seethe next objecton theINSTRUMENT SHELF.
Experiment 0: The Physical Science LaboratoryFigure 8: Example Of A Next Gadget
Occasionally an instrument window or the lab bench willcontain a next gadget. Next gadgets are displayed as small whiterectangles. Next gadgets are used to indicate that otherinstruments or equipment are residing at the same location, but arenot visible. Clicking on the next gadget will cause the "next,'item at that location to become visible, replacing the item thatwas currently visible, or filling the void if nothing was there.
9

r
w-4-11L,,Q1f=,
4.1f, fek 4n, =mu-a-- \T"de , Kse
L9NMA ,..174, .f
ov:V.
INSTRUMENT WINDOWNumber Li
The CLOCK WINDOW
Includes:CLOCK GADGETSVALUE BARUNITS BAR
iutgksiawitmuizzatiaioeraui.ww..
:4 NPZ.
Experiment 0: The Physical Science LaboratoryFigure 9: Instrument Window NUmber 4
The fourth instrument window is also known as the clockinstrument window. Like the first three instrument windows, it iscomprised of a shelf, a value bar, and a units bar. Sitting on theshelf is the measurement instrument known as the elapsed-timeclock. The elapsed time clock, or simply - the clock - is apermanent fixture of the Physical Science Laboratory. Surroundingthe clock are four clock gadgets. These are used to control theclock functions of starting, stopping and resetting the clock, aswell as getting help or quitting the present experiment.
The hands of the clock icon do not move. Instead, the elapsedtime appears as a digital value in the value bar. The units oftime are normally minutes and seconds, abbreviated mm:ss. Otherunits are available, such ac seconds and tenths of seconds, ss.t1and hours and minutes, hh:mm.
10

START BUTTON
Click here tostart theELAPSED-T IMECLOCK.
Experiment 0: The Physical Science LaboratoryFigure 10: The Elapsed-Time Clock Start Button
The green gadget in the upper left-hand corner of the clock
shelf is called the start button. Clicking on the start button
will start the clock. The clock functions like a stop watch with
one important difference. Experimental activity is controlled by
the clock. Whenever the clock is stopped, all experimental
activity ceases, i.e., tim does not advance for the simulated
event on the lab bench. Whenever the clock is started, time
advances and the simulated event proceeds. Clicking on the start
button while time is advancing has no effect.
It is important to note that the function of starting or
stopping the clock is performed only when the mouse button is
released, not when it is first depressed. Do not hold the button
down for any longer than necessary. Click quickly!
11,
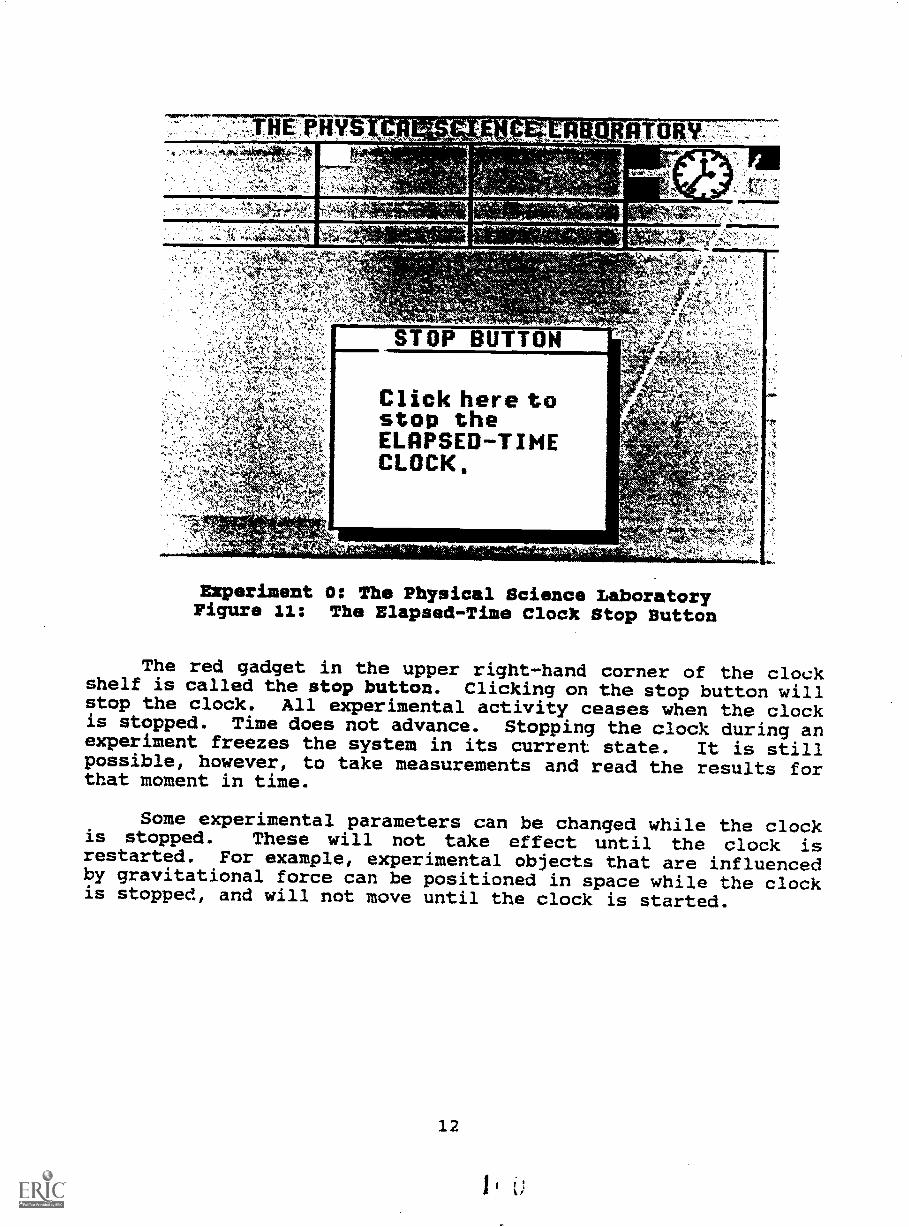
Click here tostop theELAPSED-TIMECLOCK,
Experiment 0: The Physical Science LaboratoryFigure 11: The Elapsed-Time Clock Stop Button
The red gadget in the upper right-hand corner of the clockshelf is called the stop button. Clicking on the stop button willstop the clock. All experimental activity ceases when the clockis stopped. Time does not advance. Stopping the clock during anexperiment freezes the system in its current state. It is stillpossible, however, to take measurements and read the results forthat moment in time.
Some experimental parameters can be changed while the clockis stopped. These will not take effect until the clock isrestarted. For example, experimental objects that are influencedby gravitational force can be positioned in space while the clockis stopped, and will not move until the clock is started.
12

Click here twiceto reset theELAPSEO-TIMECLOCK to zero.
Experiment 0: The Physical Science LaboratoryFigure 12: The Elapsed-Time Clock Reset Button
The yellow gadget in the lower right-hand corner of the clockshelf is known as the reset button. Clicking once on the resetbutton causes the clock to stop and the message reset? to appearin the clock units bar. Clicking once again on the reset buttoncauses the clock, itself, to reset to the zero state. Time in thevalue bar will return to 00:00 if the units are minutes andseconds.
Experimental activity ceases when the reset button is clickedon for the first time. The system behaves as if the stop buttonwere pressed. Clicking on the start button will cancel the resetrequest and start the clock and experiment from where they leftoff.
13
t 1

Click here tocause theMENU to appearin theMENU BI IR
Experiment 0: The Physical Science LaboratoryFigure 13: The Elapsed-Time Clock Menu Button
The blue gadget in the lower left-hand corner of the clockshelf is called the menu button or menu gadget. Clicking on themenu gadget will cause a menu to appear near the top line of thecomputer screen. Clicking on the menu gadget has the same effecton the experiment as clicking on the stop button.
14

HELP CONTINUE RESTART QUIT
MENU BARClick on
HELP - to get help.CONTINUE - to con-tinue experiment.
RESTART - to re-start experiment.QUIT - to quitdoing experiment.
Experiment 0: The Physical Science LaboratoryFigure 14: The Menu Bar
The menu bar is the text line that appears at the top of thecomputer screen. Normally, the title of the current experimentappears in the menu bar. Clicking on the menu button in the clockshelf causes a menu to be displayed in the menu bar.
Four options are available by clicking on the appropriate wordin the menu bar. Clicking on the word HELP will highlight the wordHELP, itself. Now the user may point and click to locations on thescreen to see and hear help messages associated with thoselocations. Clicking on the word CONTINUE returns the laboratoryto its current state with the clock stopped. Clicking on the wordRESTART will restart the experiment from scratch. And clicking onthe word QUIT will return the user to the operating system.
15
I

f"."7"""`'w"mtlig PHYSTCWSCIMMIRRIATORTI-r-,
....1-1.
for the CLOCKDrag up toincrease CLOCKspeed.Drag down todecrease Clockspeed.
''43~
Experiment 0: The Physical Science LaboratoryFigure 15: The Speed-Control For The Clock
On the right-hand side of the screen is a longl vertically-oriented rectangle that provides the boundaries for a smaller,
white rectangle called the speed-control for the clock. The rateat which time advances relative to a real-world clock is controlledby the position of the clock speed-control.
When the elapsed-time clock is stopped/ dragging it upwardscauses time in the Physical Science Laboratory to advance morequickly; dragging it downwards causes time to advance more slowly.The relative speed of the c3ock can be read in the clock value barwhile changing the position of the clock speed-control. Duringthe change the word "speed" appears in the clock units bar.
When the elapsed-time clock is running, the relative speed ofthe clock can be seen momentarily by clicking on the clock speed-control.
16

SLIDE BARfor SPEED-CONTROL
Slide the CLOCKSPEED-CONTROLhere. Up forfaster, down forslower.
- V,%'.- ' 5k .
Experiment 0: The Physical Science LaboratoryFigure 16: The Slide Bar For The Clock Speed-Control
The slide bar for the clock speed-control is the long,vertically-oriented rectangle on the right-hand side cf thecomputer screen. The slide bar provides the boundaries for theclock speed-zontrol while the speed control is being repositioned.
As mentioned elsewhere, the speed-control can be repositionedby the user when the clock is stopped. It can also be repositionedby the simulation program! When the clock is running, andsimulated events are taking longer to run on the computer than thedesired relative speed - as previously set by positioning the speedcontrol - the simulation program will move the speed controldownwards to indicate the actual relative speed at which events arebeing displayed.
17

More About The Elapsed-Time Clock: Technical Notes
The elapsed-time clock in the Physical Science Laboratory isdesigned to mimic the behavior of a a real-world clock. Moreimportantly, however, it is designed to keep track of time as itadvances during a given simulation.
It is quite possible to require more time to compute anddisplay the events taking place on the computer screen, than itwould actually take for the events to occur in real time. In thiscase, the simulation time - as displayed by the elapsed-time clock- will fall behind real time. When this happens, events occurringon the computer screen will appear to be moving more slowly thanthey would in the real world. However, because the clock andevents move together in the Physical Science Laboratory,measurements will still show the same time-dependent behavor as thereal-world measurements they are attempting to duplicate. Ascomputer hardware and computational algorithms get faster, real-time simulation of complex events will get closer to reality.
When the simulation program can display results and computeits next state faster than real-time events, it waits until realtime can catch up before it continues its cycle. If simulationtime falls behind real time, the simulation program trys to catchup by running as fast as it possibly can. Events such as voicingmeasurements while the clock is running tend to slow down thesimulation. As simulation time falls behind, the program computeshow fast the the elapsed-time clock is running relative to realtime and displays the results by repositioning the clock speedcontrol.
Suggestion: if simulation time falls behind, and you want tokeep as close to a real-time display as possible, you can speedthings up by displaying time in hours and minutes, and by turningoff any changing value displays by clicking on the value bars. Ifpossible, remove unnecessary instruments from the lab bench thatare doing continuous monitoring.
18

THE PHYSICAL SCIE-Hte'LlidefilfiTOilY
00 : 00min : ss
Experiment 0: The Physical Science LaboratoryFigure 17: An Example - The Thermometer Instrument
The thermometer instrument enables the user to measuretemperatures on the lab bench. The thermometer instrument, asdepicted, is merely an icon. It is not meant to look realistic,but merely resemble a thermometer. As drawn, the therrometerinstrument measures the temperature of objects and locationsdirectly unaer its bulb - the lower, rounded end.
The thermometer instrument used in the laboratory experimentsis truly remarkable: it will not break if you drop it; it is alwaysaccurate; it is unaffected by extreme heat and pressure; itmeasures temperatures instantaneously; and its range is fromabsolute zero to the highest temperatures known to tankind. Ofcourse, real thermometers have real limitations and these will bediscovered as we pursue the experiments in this series.
To use the thermometer drag it from its location on the shelfand release it over the object or location on the lab bench thatneeds to be measured. While located on the lab bench thethermometer will continuously monitor the temperature and displaythe value in the value bar of the thermometer instrument window.
The units of measure are normally Celsius or Fahrenheitdegrees. The current units are displayed in the units bar and canbe changed by clicking on the units bar, itself.
The Physical Science Laboratory proper is maintained by itsowners at a comfortable 68 degrees Fahrenheit (20 degrees Celsius).Thermometers residing on the instrument shelf or the unadorned labbench will measure this temperature. The degree of precision towhich the thermometer displays a measurement is somewhat dependenton the experiment. In the early experiments temperature is usuallyrounded to the nearest degree.
19

T-HE 'MY'S I CAL SCIER-Ct LR8RRTORY
Experiment 0: The Physical Science LaboratoryFigure 18: Another Example - The Ruler Instrument
The ruler instrument enables the user to measure lengthdirectly on the lab bench. The ruler instrument, as depicted, ismerely an icon. It is not intended to look realistic, that is, itsscale is representational only.
The ruler instrument works by having the simulation programnote the ruler's initial position and final position as specifiedby the user. and then take the difference between these two points.Since the mot.ion is strictly translational, all points on the rulermove the same distance.
The designers of this instrument have selected the upper-leftcorner of this icon as a reference point from which to draw a lineindicating the distance between the initial and final positions.The length of this line is always equal to the distance betweenthese two points. The first-time user will probably want to usethe upper-left corner when doing measurements, but should not feelconstrained to use only this location.
To use the ruler: drag it to its starting location; releaseit to mark the initial position; move it to its final position, andclick the mouse to mark the final position. The distance will bedisplayed in the value bar and the units in the units bar. Theunits can be changed to a variety of measures by clicking on theunits bar. The distance measured will most often depend on theexperiment. In some cases it may be no longer than the actualcomputer screen dimensions; in others, it may be orders ofmagnitude larger.
Return the ruler to its shelf location by dragging it there.It will only go on the shelf from whence it came.

Worksheet 0-1: Touring The Physical Science Lab
What You Should Already Know
If you are going to be using a mouse for the first time, we suggestthat you watch the video called Using A Mouse that comes with theTeacher's Manual. Another video, Touring The Lab, is available tointroduce you to the basic features of the Physical Scie.AceLaboratory. We urge you to watch both of these videos before youbegin this experiment.
You should know the meaning of certain words that are used todescribe what to do with the mouse, as you work in the PhysicalScience Laboratory. Check off the words for which you know themeaning. Look up the definitions of the words that you don't knowin the Glossary on page 4 of this Activity Worksheet.
Mouse PressMouse Pointer ReleaseIcon DragClick GadgetClick On SelectDouble Click Choose
1 of 5

Problem 1 - Getting To Xnaw The Physical Science Laboratory
Make yourself at home in the laboratory by finding out exactlywhere things are and what they are called. Follow theinstructions below to learn the names of the places in the lab.As you learn the names, write them on the picture of the labthat you will find on page 5 of this Activity Worksheet.
Instructions For Problem 1
1) Have your teacher help you get started with loading andrunning the disk called "Experiment 0".
2) When the picture of the Physical Science Laboratory appearson the computer screen, move the mouse pointer over the bluerectangle. Click on the blue rectangle. Four words willappear at the top of the computer screen: HELP CONTINUERESTART QUIT. Taken as a group, these words are called amenu and appear in the menu bar.
3) Click on the word HELP in the menu bar. The word HELP willchange colors when you click on it. This shows that you arein the HELP mode. A help window will pop up in the middle ofthe screen.
4) Select (click on) the CONTINUE word in the menu bar. The helpwindow will disappear. Note: Whenever a help window is on thescreen you must select the CONTINUE word before the programwill respond to your next command.
5) Move the mouse pointer to the middle of the computer screenand click the mouse. Another help window will appear in themiddle of the computer screen. At the top of the help windowyou will find the name of the place or object on which youjust clicked. Write the name of this place on the picture ofthe lab that yca will find on page 5 of this Worksheet.
6 Select the CONTINUE word again. Click on another place orthing in the Physical Science Laboratory. Write the name ofthe new place or thing on the picture of the lab. Continueto click until you have written down the names aces and thingsthat you can find in the lab. Don't forget to select theCONTINUE word before you try to click on something new.
When you want to stop getting help, select the CONTINUE word twice.The menu bar will change to the words "THE PHYSICAL SCIENCELABORATORY" and you can operate things in the lab normally again.
2 of 5

Problem 2 - Now to Quit
Quit doing this experiment altogether and use thecomputer for something else.
Instructions For Problem 2
Click on the blue rectangle. You may know it now as the menugadget. The menu will appear again at the top of the screen.Click on the word QUIT. The Physical Science Laboratory willdisappear and you will be brought back to your operating system.
3 of 5
ill

GLOSSARY NOTE: Please read from top to bottom
Nouse An instrument that you hold in your hand and rollaround on your desk top. It may have one or morebuttons on top and is connected to your computer bya wire. Signals are sent to your computer from themouse by pressing one of the buttons. When you movethe mouse you can make a small picture on thecomputer screen move at the same time.
Nouse Pointer An arrow or other pointy picture that moves acrossthe computer screen when you move the mouse.
Click
Click On
A small picture on the computer screen that lookslike something you know. Sometimes you can make itmove by using the mouse.
(A mouse button) Tap one of the buttons - usuallythe button on the left if there are more than one -with your finger and make it go "click."
(Something on the computer screen) Move the pointyend of the mouse pointer over the place or thing onthe computer screen and click.
Double Click (A mouse button) Two quick clicks. Not used duringthese experiments except to start the program.
Press (A mouse button) Push the mouse button down andhold it there. Don't let up until told.
Release (A mouse button) Stop pressing on the mouse button.Release is the opposite of press.
Drag (An icon) Move the mouse pointer over the icon.Press. While still pressing move the mouse and theicon to the place on the computer screen where youwant it to go. Release.
Gadget A place on the screen that if you click on itsomething will happen. Gadgets are often smallsquares or rectangles.
Select Click on a gadget or some other object.
Choose Same as elect.
4 of 5

INSTRUCTIONS :
Please write in the names of the places and things you can identifyin the Physical Science Laboratory. Use the white space around thepicture when the names will not fit in the picture.
An, ,1 ,, .
5 of 5

Worksheet 0-2: Using The Instruments
Problem 1 - Using The Next Gadget
Use the next gadget to discover how many and what kind ofinstruments are currently on the instrument shelf in the secondinstrument window. Write the names of the instruments in theanswer box below.
Answer 1
Instructions For Problem 1
The next gadget is the small white rectangle that appears in thesecond instrument window near the top of the computer screen.Click on the next gadget to cause the "next" instrument on theinstrument shelf to appear. Keep clicking until you have seen allthe instruments that have been placed on this shelf for thisexperiment.
Problem 2 - Using The Thermometer Instrument
Use the thermometer instrument to determine the temperature ofthe lab bench. Record your findings in the answer box below.
1 of 2

Instructions For Problem 2
Click on the next gadget until the thermometer icon appears on theinstrument shelf. Drag the.thermometer instrument to the lab benchand release it there. (Note: To drag the thermometer -move thepointer over the thermometer, press the mouse button down and holdit down while moving the mouse, release the mouse button when thethermometer is located where you want it.)
When you release the thermometer the computer will speak thecurrent temperature and the numeric value of the temperature willappear in the value bar. However, if the number in the value baris hidden, the voice will remain silent. Click once on the valuebar to get the number to reappear and the computer to speak. Clickon the value bar again to hide the number and silence the computer.
Problem 3 - Changing The Units Of Measurement
Determine the temperature of the lab bench in degrees Celsiusas well as degrees Fahrenheit. Write your answer in the answerbox below.
Answer 3
Instructions For Problem 3
Click on the units bar in the thermometer instrument window.

Worksheet 0-3: Using Other Instruments
Problem 1: Using The Ruler Instrument
There are four steps to making a measurement with the rulerinstrument. You can try to figure them out yourself, or readthem in the instructions below.
Instructions For Problem 1
1) Click the next gadget until the ruler appears on theinstrument shelf. The value bar should read 0. Drag theruler to the lab bench being careful not to release the mousebutton.
Note: If you accidentally release the button while you aredragging it, simply click the mouse button once and then youwill be able to drag the ruler instrument again.
2) Drag the ruler to the left side of the lab bench - that's theside nearest instrument window number 1. Now you are readyto begin a measurement.
3) Release the button and move the ruler across the lab bench -toward your right.
Notice the straight line that is drawn on the lab bench as youmove the ruler. One end of the line is fixed at the pointwhere you started your measurement. The other end extendsfrom the upper-left corner of your ruler.
The length of this line is always equal to the length of yourmeasurement. This length can be read in the value bar of theruler instrument window as you move the ruler.
1 of 2
i r;

4) To finish making a measurement simply click the mouse buttononce. The ruler will no longer move and the pointer willreappear on the screen.
You can now move the pointer wherever you want. To put the rulerback on the shelf you can either drag it there or click on the nextgadget. Try using the ruler until you feel comfortable with theway it works.
Remember these four easy steps:
1) Drag the ruler to the starting point.2) Release the mouse button to start the measuremcnt.3) Move the ruler to the stopping point.4) Click the mouse button to end the measurment.
Problem 2: Changing the units of length
What are the different units of length that you can use forthe ruler instrument? Make a simple length measurement on thelab bench. Find the length for each of the units that youwrote down.
Answer 2
Instructions For Problem 2
Clicking on the units bar in the ruler instrument window willchange the units of measure for the ruler, and also give thecorresponding length for that unit in the value bar.
2 of 2
117

Introduction to Experiment 1:
Finding Elapsed Time
Li:

Experiment 1: Elapsed TimeLarge Clcci. And 1 Minute Timer At The Start
Objectives
This environment is designed to help students learn how touse the elapsed-time clock in the Physical Science Laboratory. Inaddition, it can help students learn to read the time associatedwith the positions of the hands on the face of the elapsed-timeclock.
1
Features
A large clock:
This environment features a large clock on the lab bench.The clock can be started, stopped and reset by clicking on one ofthe appropriate gadgets surrounding the large clock, or by clickingon one of the clock gadgets in the clock instrument window.
The units of time being displayed in the clock value bar canbe changed by clicking on the units box of the clock instrumentwindow. Possible units include hours and minutes (abbreviatedhh:mm), minutes and seconds (0Wmreviatedmm:ss), seconds and tenthsof seconds (abbreviated ss.t). When different units are selectedthe hands on the large clock will change to display the unitsselected. The large clock has three different sets of hands. Oneset displays hours and minutes; another set displays minutes andseconds, and a third set displays just seconds.
If you click on the clock value bar when the time is hidden,the computer will speak the time as the value reappears. If thevalue is being displayed, click on the value bar twice in order tohear the voice. The elapsed time will be given in the unitsdisplayed in the clock units bar.
Sand-in-glass timers:
If the clock is reset to its zero state, a next gadget appearsin the second instrument window. By clicking on the next gadget,when the hour-glass icon appears in the window, it is possible toselect one of three different sand-in-glass timers for keepingtrack of time. A minute, second, and hour timer are available. Afourth click on the same next gadget will leave the lab bench freeof timers. The cycle may be repeated as often as desired. Oncethe clock has been started, however, the next gadget disappears andno further selections are possible until the clock is reset.
2

Worksheet 1-i: Using The Elapsed-Time Clock
Name:
Teacher:
Class:
Arszezir
Date:
Score:
1
Problem 1 - Measuring Time
Put the 1 minute Timer on the lab bench. Use the clock tomeasure how long it takes the sand in the Timer to fall fromthe top to the bottom. Write your measurement in the boxbelow.
AUswer 1.
Instructions For Problem 1
The clock in the Physical Science Laboratory can be used to measurehow long it takes something to happen. For this reason it is calledan elapsed-time clock. It acts just like a stop watch: you canstart it, stop it, and reset it to zero.
You will find some timers on the shelf in instrument window 2.Clicking on the next gadget will let you select the one you want.Start the clock: use the START button on the lab bench or the startbutton in the clock window. Stop the clock when all the sand hasfallen to the bottom: use the STOP button on the lab bench or inthe clock window.
You may have noticed that the sand began falling as soon as youstarted the clock. That's because the elapsed-time clock in thislaboratory is special; it actually controls time. With it you canstop time and start it up again whenever you want.
1 of 2

Problem 2 - Stopping Time!
Make sure that the 1 minute Timer Is on the lab bench. Usethe elapsed-time clock to start and stop the flaw of time in'the Physical Science Laboratory. How can you tell that timehas stopped and not just the clock?
Answer 2
Instructions For Problem 2
Reset the clock to 00:00; youbutton twice. Make sure thatbench. START the clock. AfterSTOP the clock. Once the clocknot happening in the lab.
do this by clicking on the RESETthe 1 minute Timer is on the lab20 seconds ave gone by (elapsed),has stopped, observe what is or is
Problem 3 - Telling Tine
Get the clock to tell you how much time has elapsed. It willactually speak the time in a slightly accented voice. Explainhow you got the clock to tell.
Answer 3
Instructions For Problem 3
Stop the clock. You can see how much time has gone by since youfirst started the clock by reading the minutes and seconds fromthe value bar of the clock, or by looking at the hands on the largeclock. Now click on the value bar of the clock: the number willdisappear. Click on the value bar of the clock again.
2 of 2

Worksheet 1-2: Waking Time Go Paster Or Slower
vara0
Problem I - Making Time Go Paster
Normally, it takes exactly 1 minute for the sand in a 1 minutetimer to flow from the top to the bottom. Make the sand in the1 minute Timer in the Physical Science Laboratory flow fasterso that it takes less than 1 minute for the sand to move fromtop to bottom. If you can do it, how do you know that it istaking less than a full minute?
Answer 1
Instructions For Problem 1
Click on the RESET button until the next gadget appears in one ofthe instrument windows. Click on the next gadget until the 1minute Timer appears on the lab bench. Ordinarily, it would takeone minute for the sand to empty out of the top of the Timer onceyou started the elapsed-time clock. Before starting the clock,however, drag the clock speed-control as high as you can in theslide bar. (Note: The clock speed control is the small whiterectangle on the right-hand side of the laboratory.) Start theelapsed-time clock.
1 of 3

Problem 2 - Making Time Go More Slowly
Place the 1 second Timer on the lab bench. Make the sand flowto the bottom in more than 1 second. How do you know that itis taking more than 1 second for this to happen? Can you tellhow long it actually takes?
Answer 2
Instructions For Problem 2
Click on the RESET button to display the next gadget in one of theinstrument windows. Click on the next gadget until the 1 secondTimer appears. Slide the clock speed-control all the way to thebottom of the slide bar. Start the elapsed time clock.
Problem 3 - Counting Out A Minute
Without watching the seconds tick off on a clock/ start at thenumber 1 and count (1/ 2/ 3..0 until exactly 1 minute goes by.What number did you reach when the minute was up? Do it E,second time. What number did you reach on the second try? Howdifferent are the two numbers? Do you think that you have somesort of a clock inside your body?
Answer 3
2 of 3

Instructions For Problem 3
You can use the elapsed-time clock for this experiment. Move thespeed-control to the normal postion (it should completely cover theblack rectangle). Click on the clock RESET button until the nextgadget appears. Click on the next gadget until there are no timerson the lab bench. Set the clock units to hours and minutes (hh:mm)by clicking on the clock units bar. Start the clock and startcounting. When the time changes from 00:00 to 00:01 in the valuebar stop counting. Write down the number you reach.
3 of 3

Worksheet 1.-3: Tine Sense
The activities on this worksheet were suggested by theautobiography of Richard Feynman, physicist (1).
Problem ls Speeding up Your Internal Clock?
Does your sense of time change when your body is moving faster?Try counting until 1 minute goes by while you are walkingquickly in place (While standing, lift your legs up and down,but don't actually walk forward). Write dawn the number youreach. Do it a second time. Record the number.
Answer 1
Instructions For Problem 1
Use the elapsed-time clock to keep track of time.clock is running at normal speed. Put the clock inminutes mode so that you can't see the seconds tick
Make sure thethe hours andby.
Problem 2: Slowing Down Your Internal Clock
Does your sense of time changeslowly? Try counting until 1resting comfortably in a chairtell you when a minute is upnumber you reach. Do it again.
when your body is moving moreminute goes by while you areor on the floor. Have someoneif necessary. Write down theWrite down the second number.
1 of 2

Answer 2
Instructions For Problem 2
Follow the instructions for Problem 1.
Problem 3: Cgmparing The Results
Find the average of the two sets of numbers. Are theydifferent? How much different?
Answer 3
Instructions For Problem 3
To find the average of two numbers add them up and divide by 2.
For example, suppose the two numbers were 87 and 92. First add 87and 92.
87 + 92 = 179
Then divide 179 by 2.
179= 89.5
2
The average is 89.5.
Compute the averages for Problem 1 and Problem 2. Then compare thetwo averages. Which is bigger or are they about the same?
1. For more information see "What Do You Care What Other PeopleThink? - Further Adventures Of A Curious Character", by Richard P.Feynam, as told to Ralph Leighton, pp. 55-59, Norton, 1988.
2 of 2

Introduction to Experiment 2:
Finding Length and Width

Experiment 2: Finding Length And WidthStarting Screen, Ruler With 1/8 Inch Divisions
Objectives
This environment is designed to help students learn how toread the scales associated with a ruler, as well as learn how touse the ruler instrument of the Physical Science Laboratory.Several different scales are available that show units of inches,millimeters, or centimeters.
1.

Features
General Description:
The ruler instrument is used to make length measurements ofthe objects located on the lab bench. As the student makes themeasurements, the distance being measured is displayed in the valuebar of the ruler instrument. At the same time a pointer points outthe distance on a full-sized ruler shown on the screen. Thestudent may choose to show or hide the number displayed in thevalue bar. If the value bar is not hidden when the measurement iscompleted, the measurement will be spoken by the computer.
Learning to read the different scales of a ruler is a matterof making a length measurement, looking at the ruler scale, andinterpreting the results. The program provides constant feedbackto the student by pointing out the scale value while simultaneouslydisplaying the corresponding numerical value. Additionalreinforcement is accomplished through the use of voice synthesis.
The Ruler Instrument:
The ruler instrument appears on the shelf in instrument windowtwo at the start of the experiment. A length measurement is madewith the ruler by using it to identify the beginning and endingpoint of a measurement.
Positioning the ruler to begin a Measurement
Drag the ruler to its starting location. (Move the mousepointer over the ruler and press the Mouse button. While pressingthe mouse button, move the mouse - and consequently the ruler - tothe desired starting location.)
Beginning the measurement
Release the mouse button. (After dragging the ruler to thestarting location, let up on the mouse button.)
When making horizontal measurements you can align the leftedge of the ruler with the starting location on the object beingmeasured. When making vertical measurements you can use the topedge of the ruler. See what happens when you start from otherlocations on the ruler.
Marking off the distance
Move the mouse to the ending location. A line will be drawnon the screen as you move the mouse. The length of that line isthe current distance you will have moved from the beginningposition.
2

Ending the measurement
Click when you have reached the ending location. (Press andrelease the mouse button quickly.)
The mouse pointer will reappear. You are free to display themeasurement in different units at this time. If the value bar isnot hidden the computer will also "speak" the number shown in thevalue bar. The measurement is the length of the colored line thathas been drawn on the screen.
The Large Ruler:
The large ruler appears in the lower half of the computerscreen. The scale on the large ruler corresponds to the unitsappearing in the units bar of the ruler instrument window. Theunits of measurement and, correspondingly, the scale on the largeruler can be changed by clicking on the units bar, itself.
Four different units of measurement are available.
inches by 1/8 inch divisions - distance is reported to thenearest 1/16 inch.
inches by 1/10 inch divisions - distance is reported to thenearest 0.05 inches.
centimeters by 1/2 centimeter divisions - distance is reportedto the nearest 0.1 centimeters.
millimeters by 5 millimeter divisions - distance is reportedto the nearest millimeter.
3
131

Worksheet 2-1: Using The Ruler
Problem 1: Learn Row To Use The Ruler To Measure Length
Learn how to use the ruler to measure the length of the pencilby carefully following the instructions below.
Instructions For Problem 1
1) Make sure the value bar in the ruler instrument window is nothidden. If it is hidden by a white bar, click on it to makeit appear.
2) Look at the large ruler at the bottom of the lab bench. Theword inch should appear on one side of the ruler and thefraction 1/8 should appear on the other. Click on the unitsbar in the ruler instrument window until they do.
3) Move the pointer over the ruler instrument. You will normallyfind the ruler instrument on the Jhelf in the ruler instrumentwindow.
4) Drag the ruler instrument from the shelf and line up the leftedge of the ruler instrument with the left edge of the eraseron the pencil. When the edges are lined up release the mcusebutton.
5) Move the ruler instrument across the lab bench until the leftedge of the ruler is lined up with the very tip of the pencil.
6) Now click the mouse. The distance you measured will appearin the value bar, and the computer will speak the measurement.
1 of 2

You should have measured 5 and 7/16 inches. As you are making ameasurement a line is drawn on the lab bench from the point whereyou start to the point where you stop. The length of this coloredline is always the same as the length of your measurement.
Remember these steps to make it easy to use the ruler:
1) Drag the ruler to the starting point.
2) Release the mouse button to start the measurement.
3) Move the ruler to the stopping point.
4) Click the mouse button to end the measurement. Your pointerwill reappear. If the value bar is not hidden, the finalmeasurement will be displ,...yed in the value bar, and thecomputer will speak the measurement.
Problem 2; Measure The Length Of The Paperclip
What is the length of the paperclip? Measure across the labbench, not up and down.
INgempel,
Answer 2
2 of 2

Worksheet 2-2: More Ruler Measurements
Name: Date:
Teacher:
Class: Score:
Problem 1: Measuring Width
Measure the width of the pencil and the width of the paperclip.Make sure the large ruler with the fraction 1/6 printed on itis present on the lab bench.
0.10.110.
Answer 1
Instructions For Problem 1
First, remember the four easy steps for using the ruler.
1) Drag the ruler to the starting point.2) Release the mouse button to start the measurement.3) Move the ruler to the stopping point.4) Click the mouse button to end the measurement.
To measure the width of the pencil, use the top edge of the ruler.
1) Drag the ruler until the top edge of the ruler lines up withthe top edge of the pencil.
2) Release the mouse button.3) Move the ruler instrument straight down until the top edge of
the ruler lines up with the bottom edge of the pencil.4) Click the mouse button. Read the width in the value bar.
Follow the same steps to measure the width of the paperclip.
1 of 2

Problem 211 Measuring Diagonally
Measure the distance from the upper left corner of the labbench to the tip of the key.
Answer 2
Instructions For Problem 2
You can use the ruler instrument to make diagonal measurements aswell. Use the upper left corner of the ruler while making yourmeasurements.
To measure the distance from the upper left corner of the lab benchto the tip of the key:
1) Drag the ruler until the upper left corner of the ruler is inthe upper left corner of the lab bench.
2) Release the mouse button when the ruler is in the corner.3) Move the ruler so that its upper left corner just touches the
tip of the key.4) Click the mouse button and read the measurement in the value
bar.
2 of 2
.1 ;

Introduction to Experiment 3:
Finding Area

a
iPec1,
a.
,.*.tott4,=it
,
,,d'haduki.digatauloo_tast.=4;1.1ii."
r- r -1 rl 1 7 rtri 'C r4-7i
)X
t -A
--), L 1,1; (.. r 4 : .4' a X
"
,17
,
*tt.
S.I I I

Features
General Description:
The ruler instrument is used to make length measurements ofthe objects located on the lab bench. As the student makes themeasurements, the distance being measured is displayed in the valuebar of the ruler instrument. At the same time a pointer points outthe distance on a full-sized ruler shown on the screen. Thestudent may choose to show or hide the number displayed in thevalue bar. If the value bar is not hidden when the measurement iscompleted, the measurement will be spoken by the computer.
Three geometric figures appear on the lab bench along with thelarge ruler. The size of each geometric figure can be changed bydragging one of the sizing gadgets in the appropriate direction.For example, dragging the gadget labeled W to the left or rightwill cause the width of the rectangle to change. The area of thefigure being manipulated alzo appears in the value bar ofinstrument window one. The picture on page 1 shows that thenumerical value of the area has been hidden by the user.
The Ruler Instrument:
The ruler instrument appears on the shelf in instrument windowtwo at the start of the experiment. A length measurement is madewith the ruler by using it to identify the beginning and endingpoint of a measurement.
Positioning the ruler to begin a Measurement
Drag the ruler to its starting location. (Move the mousepointer over the ruler and press the mouse button. While pressingthe mouse button, move the mouse - and consequently the ruler - tothe desired starting location.)
Beginning the measurement
Release the mouse button. (After dragging the ruler to thestarting location, let up on the mouse button.)
When making horizontal measurements you can align the leftedge of the ruler with the starting location on the object beingmeasured. When making vertical measurements you can use the topedge of the ruler. See what happens when you start from otherlocations on the ruler.

Marking off the distance
Move the mouse to the ending location. A line will be drawnon the screen as you move the mouse. The length of that line isthe current distance you will have moved from the beginningposition.
Ending the measurement
Click when you have reached the ending location. (Press andrelease the mouse button quickly.)
The mouse pointer will reappear. You are free to display themeasurement in different units at this time. If the value bar isnot hidden the computer will also "speak" the number shown in thevalue bar. The measurement is the length of the colored line thathas been drawn on the screen.
The Large Ruler:
The large ruler appears in the lower half of the computerscreen. The scale on the large ruler corresponds to the unitsappearing in the units bar of the ruler instrument window. Theunits of measurement and, correspondingly, the scale on the largeruler can be changed by clicking on the units bar, itself.
Four different units of measurement are available.
inches by 1/8 inch divisionsnearest 1/16 inch.
inches by 1/10 inch divisionsnearest 0.05 inches.
- distance is reported to the
- distance is reported to the
centimeters by 1/2 centimeter divisionsto the nearest 0.1 centimeters.
millimeters by 5 millimeter divisionsto the nearest millimeter.
The Geometric Figures:
- distance is reported
- distance is reported
Three geometric figures - a circle, a rectangle and a righttriangle - appear on the lab bench. The size of these figures canbe changed by moving the sizing gadgets associated with eachfigure.
3
1.3,j

The Circle
Select the sizing gadget labeled R and drag it to the left orright to change the radius of the circle. Once selected, a circlewill appear on the spelf in window one, and the area of the circlewill be continuousily displayed in the value bar. The unitsdisplayed in the value bar will be the same as those selected forthe ruler instrument.
The area of the circle is computed from the radius shown withthe circle. The radius includes the border or perimeter of thecircle.
The Rectangle
Select either the length or width sizing gadget ( L and W,respectively) to change the size of the rectangle. The areadisplayed includes the borders of the figure.
The Right Triangle
Select either the height or base gadget (H or /3) to change thesize of the right triangle.
When measuring the length of the base, extend your measurementfrom the lower right corner of the triangle to the left edge of thebase sizing gadget. When measuring the height, use the lower rightcorner and the top edge of the height sizing gadget. You will haveto use the right edge of the ruler instrument to do thesemeasurements.
4
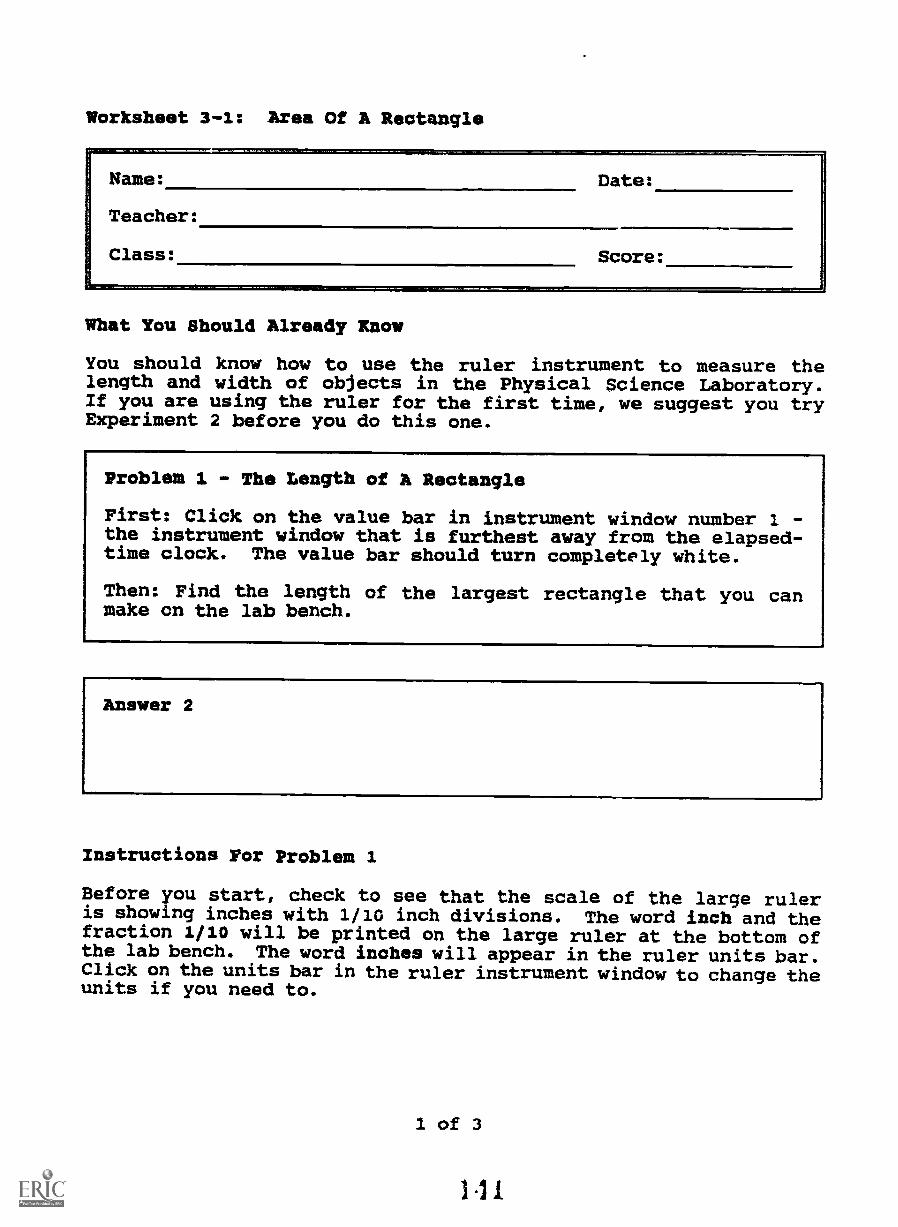
Worksheet 3-1: Area Of A Rectangle
What You Should Already Know
You should know how to use the ruler instrument to measure thelength and width of objects in the Physical Science Laboratory.If you are using the ruler for the first time, we suggest you tryExperiment 2 before you do this one.
Problem 1 - The Length of A Rectangle
First: Click on the value bar in instrument window number 1 -the instrument window that is furthest away from the elapsed-time clock. The value bar should turn completely white.
Then: Find the length of the largest rectangle that you canmake cn the lab bench.
Answer 2
Instructions For Problem 1
Before you start, check to see that the scale of the large ruleris showing inches with 1/10 inch divisions. The word inch and thefraction 1/10 will be printed on the large ruler at the bottom ofthe lab bench. The word inches will appear in the ruler units bar.Click on the units bar in the ruler instrument window to change theunits if you need to.
1 of 3

The length of the rectangle is controlled by the length gadget.The length gadget has the letter L printed in the center. Drag thelength gadget up and down to get a feeling for how it works. Makethe length of the rectangle as long as possible.
Measure the length of the rectangle using the ruler instrument.Measure from the top (as seen on the computer screen) to the bottomto get the length. Be sure your measurement includes the borderof the figure.
Problem 2 - The Width Of A Rectangle
Find the width of the largest rectangle that you can make onthe lab bench.
Answer 2
Instructions For Problem 2
The width of the rectangle is controlled by the width gadget. Thewidth gadget has the letter W printed in the center. Drag thewidth gadget back and forth to get a feeling for how it works.Make the width of the rectangle as wide as possible.
Measure the width of the rectangle using the ruler instrument.Measure from side to side (as seen on the computer screen) to getthe width. Be sure to include the border of the rectangle in yourmeasurement.
2 of 3
1

Problem 3 - Finding The Area (Length z Width)
Find the area of the largest rectangle that you can make on thelab bench.
Answer 3
Instructions For Problem 3
Make sure the length and width of the rectangle are as large asthey can be. They should be the same size as the length and widthyou found in problems 1 and 2. You might want to check them withthe ruler just to be sure.
To find the area of the rectangle multiply the length times thewidth. For example, if the length were 4.5 inches and the widthwere 3.6 inches, then the area is
4.5 x 3.6 = 16.2 square inches
To find out how close you were to the actual area click on thevalue bar in the first instrument window - the window with thepicture of a rectangle in it. The area of the rectangle willappear in the value bar and the computer will speak the number.
3 of 3
I

Worksheet 3-2: Area Of A Circle
Name: Date:
Teacher:
Class: Score:
What You Should Already Know
You should know how to use the ruler instrument to make lengthmeasurements. If you are using the ruler for the first time, otherthan Experiment 0, we suggest you try Experiment 2 before you dothis one.
Problem 1: Finding The Radius Of A Circle
First: Click on the value bar in instrument window 1 - theinstrument window that is furthest away from the elapsed-timeclock. The value bar should turn completely white.
Then: Find the iadius of the largest circle that you can makeon the lab bench.
Answer 1
Instructions For Problem 1
Before you start, check to see that the scale of the large ruleris showing inches with 1/10 inch divisions. The word inches shouldappear in the units bar of the ruler window, and the value bar willshow the number zero as 0.00. Click the units har to change theunits if you have to.
The radius of the circle is controlled by the radius gadget. Theradius gadget has the letter R printed in the center. Drag theradius gadget back and forth to get a feeling for how it works.Make the radius as large as possible.
1 of 2
3 ;

Measure the radius of the circle using the ruler instrument. Besure to include the perimeter of the circle in your measurement.
Problem 2: Finding The Area (3.14 x radius x radius)
Find the area of the largest circle that you can make on thelab bendh.
Answer 2
Instructions For Problem 2
Make sure that the radius of the circle is as large as it can be.It should be the same size as the radius you found in Problem 1.You may want to check it using the ruler.
To find the area of a circle you multiply
3.14 x radius x radius
For example, if the radius of your circle were 2.0 inches, than thearea would be
3.14 x 2.0 x 2.0 = 12.56 square inches
To find out how close you were to the actual area, click on thevalue bar in the first instrument window - the one with the pictureof the circle in it. The area of the circle will appear there.
Note: If you use a calculator to compute the area and you want tobe more accurate, than use the number 3.14159 instead of 3.14.This number is called Pi (pronounced pie) and on some calculatorsis shown as the symbol
2 of 2

Worksheet 3-3: Area Of A Triangle
What You Should Already Know
You should know how to use the ruler to make length measurements.If you are using the ruler for the first time we strongly recommendthat you do Experiment 2 first.
Problem 1 - The Height Of A Triangle
First: Click on the value bar in instrument window 1 - theinstrument window that is furthest away from the elapsed-timeclock - until the number is covered by a white bar.
Then: Find the height of the largest triangle that you can makeon the lab bench.
Answer 1
Instructions For Problem 1
Before you start, check to see that the scale of the large ruleris showing inches with 1/10 inch divisions. The word inches shouldappear in the units bar of the ruler window, and the value bar willshow the number zero as 0.00. Click the units bar to change unitsif you have to.
The height of the triangle is controlled by the height gadget. Theheight gadget has the letter If printed in the center. Drag theheight gadget up and down to get the feel of how it works. Makethe height as large as possible.
1 of 3
I i;

Measure the height of the triangle using the ruler instrument. Inthis experiment you will be using the ruler in a slightly differentway.
1) Drag the ruler to the triangle - don't release yet - and lineup the top edge of the ruler with the top edge of the heightgadget.
2) Now release the mouse button to start the measurement.
3) Move the ruler down until the top edge of the ruler restsalong the bottom edge of the triangle. Move the ruler alongthe bottom edge of the triangle until the line drawn by theruler is straight up and down (vertical).
4 Now click the mouse button to end the measurement. Write downthe number for the height.
Problem 2 - The Base Of The Triangle
Find the base of the largest triangle that you can make on thelab bench.
Answer 2
AMP
Instructions For Problem 2
The size of the base of the triangle is controlled by the basegadget. The base gadget has the letter B printed in the center.Drag the base gadget back and forth to get an idea of how it works.Make the base of the triangle as large as possible.
Measure the base of the triangle using the ruler instrument. Againyou will use the ruler in a slightly different way.
2 of 3

1) Drag the ruler to the triangle - don't release yet - and lineup the right edge of the ruler with the right side (outside)of the triangle. Keep the ruler near the bottom of thetriangle.
2) Now release the mouse button to start the measurement.
3) Move the ruler until the right edge of the ruler just touchesthe left edge of the base gadget. Slide the ruler along theedge of the base gadget until the line drawn by the ruler isstraight (horizontal).
4) Now click the mouse button to end the measurement. Write downthe size of the base.
Problem 3 - Finding The Area ( 1/2 x Base x Height )
Find the area of the largest triangle that you can make onthe lab bench.
Answer 3
Instructions For Problem 3
Make sure the base and height of your triangle are as large as theycan be. They should be the same base and height as you found inProblems 1 and 2. Check them to be sure.
To find the area of a triangle you multiply 1/2times the height (you can use 0.5 instead of 1/2)if your base is 2.0 inches and your height is 3.0area of the triangle would be
1/2 x base x height = area
times the base. For example,inches then the
1/2 x 2.0 x 3.0 = 3.0 square inches.
Click on the value bar in instrument window 1 to see the actualarea for your triangle. The triangle icon should be on the shelf.
3 of 3

Introduction to Experiment 4:
Finding Distance Using a Map

I
114 r.,1`421
41.1=1=1!=0/010MMIMM-at ilk
11:11
-111111P'
117111-7---
MI
1 1 1 1
14,1)13 LL14 1J-1,1!, t..?4. &JAI:A ti III 11,1 14, -
4!.
4r1
?rt.-treat n r n-rti crryi ni ri cs riTti" .
4",
It
. I
1
"
11.5.
S

Features
General Description:
The ruler instrument is used to make length measurements ofthe objects located on the lab bench. As the student makes themeasurements, the distance being measured is displayed in the valuebar of the ruler instrument. At the same time a pointer points outthe distance on a full-sized ruler shown on the screen. Thestudent may choose to show or hide the numbers displayed in any ofthe value bars. If the value bar is not hidden when a measurementis completed, the measurement will be spoken by the computer.
Measurements are made on a map. By clicking on the units barof the ruler the units of measurement can be changed to inches,centimeters, millimeters, miles or kilometers. The scale of themap can also be changed to miles or kilometers. Once distancemeasurements have been completed using a ruler, the car shown ininstrument window 3 can be driven over the route to provide a checkon the student's calculations. Distance driven in miles orkilometers is shown in the car value bar. Clicking on the tripodometer resets the d.Lstance traveled to zero.
The Ruler Instrument:
The ruler instrument appears on the shelf in instrument windowtwo at the start of the experiment. A length measurement is madewith the ruler by using it to identify the beginning and endingpoint of a measurement.
Positioning the ruler to begin a Measurement
Drag the ruler to its starting location. (Move the mousepointer over the ruler and press the mouse button. While pressingthe mouse button, move the mouse - and consequently the ruler - tothe desired starting location.)
Beginning the measurement
Release the mouse button. (After dragging the ruler to thestarting location, let up on the mouse button.)
When making horizontal measurements you can align the leftedge of the ruler with the starting location on the object beingmeasured. When making vertical measurements you can use the topedge of the ruler. See what happens when you start from otherlocations on the ruler.
2
1 5 1

Marking off the distance
Move the mouse to the ending location. A line will be drawnon the screen as you move the mouse. The length of that line isthe current distance you will have moved from the beginningposition.
Ending the measurement
Click when you have reached the ending location. (Press andrelease the mouse button quickly.)
The mouse pointer will rePppear. You are free to display themeasurement in different units at this time. If the value bar isnot hidden the computer will also "speak" the number shown in thevalue bar. The measurement is the length of the colored line thathas bsen drawn on the screen.
The Large Ruler:
The large ruler appears in the lower half of the computerscreen. The scale on the large ruler corresponds to the unitsappearing in the units bar of the ruler instrument window. Theunits of measurement and, correspondingly, the scale on tne largeruler can be changed by clicking on the units bar, itself.
Six different units of measurement are available.
inches by 1/8 inch divisions - distance is reported to thenearest 1/16 inch.
inches by 1/10 inch divisions - distance is reported to thenearest 0.05 inches.
centimeters by 1/2 centimeter divisions -to the nearest 0.1 centimeters.
millimeters by 5 millimeter divisions -to the nearest millimeter.
distance is reported
distance is reported
miles by 0.1 mile divisions - distance is reported to thenearest 0.05 miles.
kilometers by 0.2 kilometer divisions - distance is reportedto the nearest 0.1 kilometer.
3
$
I )

The Car:
A movable car is parked in instrument window 3. As the caris moved across the map, the distance traveled appears in the valuebar of *the car instrument window. By clicking on thespeedometer/odometer icon in window 31 the mileage can be reset tozero. Clicking on the units bar in instument window 3 causes theunits of distance to toggle between miles and kilometers.
The car is controlled by the mouse in much the same fashionas the ruler (see above). Drag the car to its starting location.Release the mouse button and move it so that the car travels overthe route desired. Any movement of the car in this mode - backwardsor forwards - causes the distance traveled to increase. Click themouse button at the end of your trip. The mouse pointer willreappear and the car will no longer be under mouse control.
The Map:
The scale of the map is shown in the map legend. It is fixedat 1 inch = 1 mile. The legend can be changed to show the samescale in kilometers where 1 inch = 1.6 kilometers. Clicking on theunits bar in instrument window 3 causes the scale display to togglebetween miles and kilometers. Consequently/ the units of distancetraveled by the car Will always agree with the units on the mapscale.
4
j
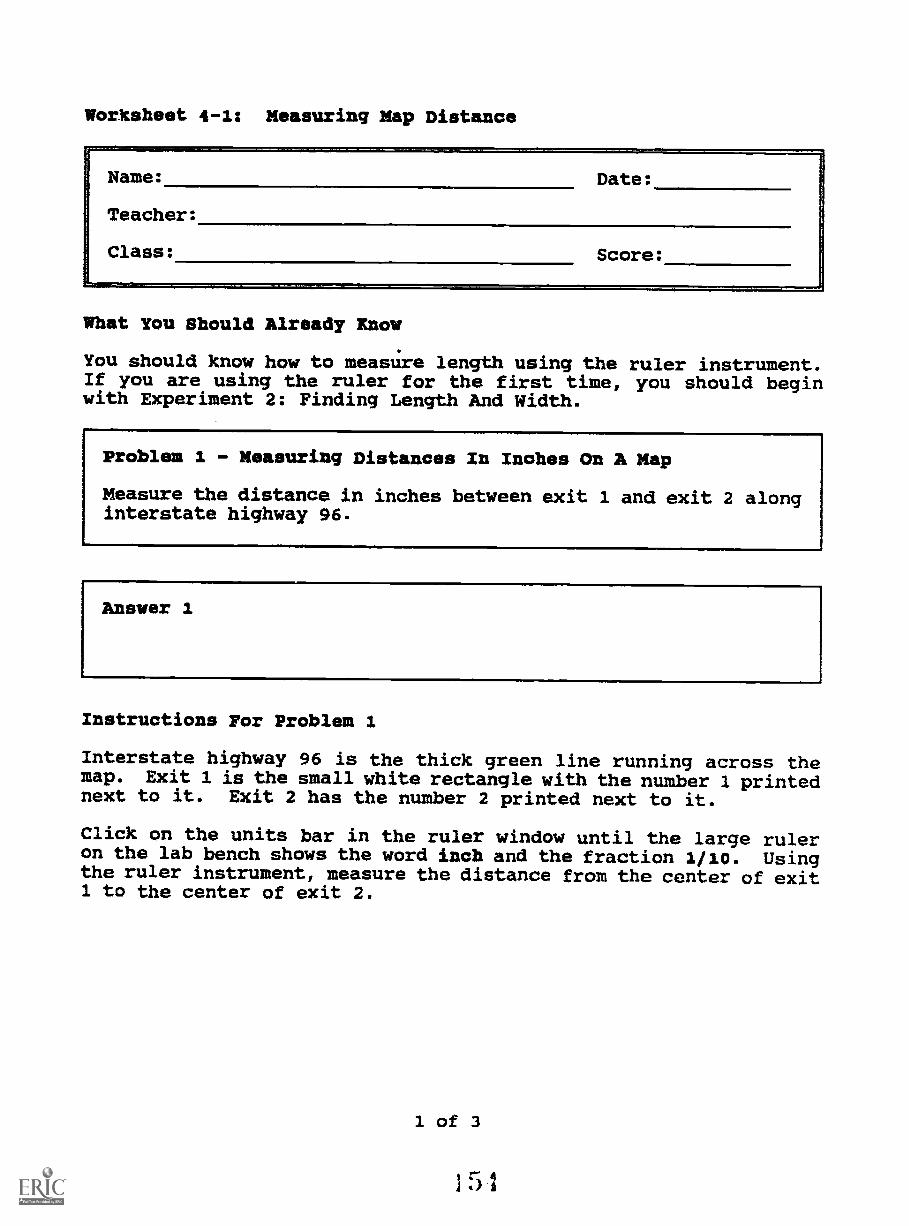
Worksheet 4-1: Measuring Nap Distance
What You Should Already Know
You should know how to measure length using the ruler instrument.If you are using the ruler for the first timer you should beginwith Experiment 2: Finding Length And Width.
Problem 1 - Measuring Distances In Inches On A Map
Measure the distance in inches between exit 1 and exit 2 alonginterstate highway 96.
Answer 1
Instructions For Problem 1
Interstate highway 96 is the thick green line running across themap. Exit 1 is the small white rectangle with the number 1 printednext to it. Exit 2 has the number 2 printed next to it.
Click on the units bar in the ruler window until the large ruleron the lab bench shows the word inch and the fraction 1/10. Usingthe ruler instrument, measure the distance from the center of exit1 to the center of exit 2.
1 of 3

Problem 2 - Changing Inches To Miles
Using the map scale, find out how many miles you must travelfor each inch of distance on the map.
Answer 2
Instructions For Problem 2
Find the map scale. It has the words Scale:miles printed below it.The scale is marked with numbers from 0 to 2. These numbers showthe distance in miles on the map.
Using the mouse, drag the ruler to the 0 mark on the scale andrelease. Move the ruler exactly 1 inch along the scale then click.Write down the number of miles you traveled along the scale byreading the numbers on the scale. This is the number of miles youtravel for each inch of distance on the map.
Problem 3 - Calculating Distances In Miles
How far is it in miles from exit 1 to exit 2 along interstate967
Answer 3
Instructions For Problem 3
You know the distance in inches from exit 1 to exit 2 (the answerto problem 1). You also know how many miles you travel for eachinch of distance along the map (the answer to problem 2).
Multiply the distance in inches times the number of miles per inchto give you the correct answer.
2 of 3

Problem 4 - Distance In Miles
How many miles is it between exit 2 and exit 3 along theinterstate highway?
Answer 4
Instructions For Problem 4
Follow the instructions given in problems 1 through 3.

Worksheet 4-2: Measurement Issues
What You Should Already Know
You should know how to measure length using the ruler instrument.
If you are using the ruler for the first time, you should begin
with Experiment 2. If you are working with the map experiment for
the first time you should begin with Worksheet 4-1: Measuring Map
Distance.
Problem 3, - Finding The Distance Between Two Towns
Find the distance along the road (red) in miles from the town
of Gap to the town of Fair Harbor.
Answer 1
Instructions For Problem 1
Use the ruler instrument to measure the distance along the road.
Since the ruler doesn't bend, you will need to measure a series of
short, straight-line distances, and then add them up after you
reach your destination.
The following technique will help make the measurements easy.
Drag the ruler to the town of Gapupper-left corner of the ruler inruler down the road until the lineoff the road. Carefully click thesame spot on the road. Record the
and release the mouse with thethe center of town. Move thedrawn by the ruler begins to gomouse leaving the ruler in thedistance traveled in inches.
1 of 2
157

If the ruler is in the same spot, just click the mouse to start thenext measurement; move it until the ruler line goes off the road,and click it again. Record the distance moved in inches.
If you accidentally move the ruler away from the last spot on yourway, simply drag it back to that spot and release the mouse tostart the measurement; move it to the next point; and click tostop. Record the distance moved in inches.
Repeat the process of clicking to start, moving the ruler until theruler line goes off the road, and clicking to stop, as you measureyour way to Fair Harbor.
When you reach your destination, add up all the distances ininches. Then multiply this sum by the number of miles per inchthat you found in problem 2 on Worksheet 4-1.
AN'
Problem 2 - Differences In Measurements
Find the distance from Gap to Fair Harbor again. Use the samemethod you used for problem 1. Is the result the same? If itis different can you explain why?
Answer 2
Instructions For Problem 2
Follow the same instructions given for problem 1.
2 of 2
5

Worksheet 4-3: Ruler With 1/10 Inch Scale Divisions
What You Should Already Know
It would be helpful to have already completed Worksheets 4-1 and4-2 in this series.
Problem 1 - Reading The Scale Marks On The Ruler
Find and circle the scale marks on the ruler shown below thatmean: "a distance of 3.10 inches from the left edge of theruler."
Answer 1
Instructions For Problem 1
Make sure that the value bar in the ruler instrument window is nothidden. Click on the value bar if the number there is hidden.
Click on the units bar until the large ruler on the lab bench hasthe word inch on one side and the fraction 1/10 on the other. Itshould look like the picture in answer box 1.
Drag the ruler instrument to the lab bench, and release the mousewhen the upper-left corner of the ruler rests on exit 1 ofinterstate highway 96.

Move the ruler slowly toward the other side of the map. As youmove the ruler the distance moved is shown in inches in the valuebar. Also, a moving white pointer points to the same distance onthe scale of the large ruler.
When the number in the value bar reaches 3.10, click the mouse.Look at the white pointer next to the large ruler. The s,:ale marknearest the white pointer also means 3.10 inches. Circle the marknearest the white pointer and the mark directly above it.
Problem 2 - Identifying All The Scale Marks Along 1 Inch
In the space provided, write the numbers that match the scalemarks between the 4.00 and 5.00 inch marks on the ruler.
Instructions For Problem 2
Follow the instructions for problem 11 but this time watch thescale on the large ruler as you move the ruler instrument. Whenthe white pointer is next to one of the marks that you mustidentify for this problem, read its value in the value bar.
Problem 3 - Finding The Values Between The Scale Marks
In the spaces provided below, write the numbers that match thelocation where each line is pointing on the ruler scale. Thelines are all pointing between the scale marks.

Instructions For Problem 3
Follow the instructions for Problem 1, but move the ruler so thatthe white pointer rests between the scale marks. Read the matchingnumber in the value bar.
Problem 4.- Scale Divisions
What is the length of the smallest scale division on the rulershown in answer box 1. State your answer in inches.
Answer 4
Instructions For Problem 4
A scale division is the distance between two scale marks of thesame length on the ruler scale. The length of the smallest scaledivision is the distance between two of the scale marks that areclosest together. Usually they are also the shortest scale markson the scale.
Using the ruler instrument, measure the distance between any twoof the scale marks that are closest together on the large ru)er.Be careful to measure from the same point on each mark.
3 of 4

Discussion Questions
1. What is the smallest distance that you can measureruler shown in answer box 1?
with the
2. What is the largest scale division shown onanswer box 1?
the ruler in
3. Which is smaller: a 1/2 inch scale division or ascale division?
1/8 inch
4. When a ruler has 1/10 inch scale divisions/parts is each inch on the ruler divided?
into how many
4 of 4

Worksheet 4-4: Measuring Distances On Paper Maps
Name: Date:
Teacher:
Class: Score:
What You Should Already Inow
You should have done Worksheets 4-1 and 4-2. You should know howto read the scale on a ruler with ten divisions to the inch.
Problem 1 - Finding The Distance In Inches
Use the map on Page 4: and a 3 inch by 5 inch card, to findthe distance in inches from the town of Gap to the town of FairHarbor. Check your answer using the results you got fromWorksheet 4-2.
Answer 1
Instructions For Problem 1
For this experiment you will need a pencil and a stiff piece ofpaper - a 3 inch by 5 inch card would be perfect. Ask yourteacher if he or she will give you one. Use the map on Page 4 ofthis Worksheet.
Place the corner of the card in the center of the town of Gap.Hold the card so that the long edge is heading down the road inthe direction of Hollis.
Put a mark on the card where the road bends and the edge of thecard leaves the road.
Leave your pencil on the map at the same spot where you marked thecard. Make sure the last mark on the card is next to the pencilpoint. Turn the card until the edge of the card near the mark isback on the road.
1 of 4

Put another mark on the card where the edge of the card leaves theroad.
Ccntinue to turn the card and mark it until you reach the town ofFair Harbor, where you put your last mark on the card. Thedistance from the corner of the card to the last mark is the totaldistance from Gap to Fair Harbor.
Use the large ruler shown on Page 3 to measure the total distancein inches marked on your card.
Problem 2
Using theare for a
- Changing Inches TO Miles
map scale on Page 4, find out how many miles theredistance of 1 inch on the map.
Answer 2
IsW..ractions vor Problem 2
Using the ruler on Page 4, mark off exactly one inch on aclean edge of your 3 by 5 card.
Find the map scale on Page 4. Place one end of your inch at thebeginning of the map scale. Read the number of miles at the otherend of the inch Write down the number of miles per inch for thismap.
Problem 3 - Changing Inches To Miles
Change the number of inches you measured along the road tomiles.
Answer 3
2 of 4

Instructions For Problem 3
Multiply the distance in inches found in problem 1 by the numberof miles per inch found in problem 2. Check your work using theresults you got on Worksheet 2.
Suggestions Por Other Activities
Find a map of the state in which you live. Locate two towns onthe map that you know and measure the distance in miles between.You will probably find that the map scale will be different fromthe one used here.
3 of 4
I 65

sk-kl,,3..*A*-KANNt.%
1.1. 111:1:1 .7.J1.111S.
, --= ..
7.%
<
a 1 2 4
I
\N r 51,
um
1
k 3 tt 455.5 \
'INE1"I
-.OM= Ciln1. .1.
le."11.trL'iSW:V.1r
}:
, fS.,',A.:71..:7MSTSSZW`r
4
,
.10rinkl\71` ;`,,;,,s,
C::-.-rxPNrrI7S'"ZM7.7-"`"
...N.:. ;N.
\v"' \-rvC"`"':
4,;ks\k."..t,
Sc
So
'
1sr% -

Introduction to Experiment 5:
Finding Seasonal Temperatures

Experiment 5: Finding Seasonal TemperaturesMonth Of January, Fahrenheit Thermometer Still On Shelf
Objectives
This environment is designedread the scales associated withaddition, the student will be ableand water temperature in a typicalentire year.
to help students learn how toa circular thermometer. Into examine the variation in airNew England state throughout an

Features
General Description:
This environment features a thermometer instrument that canbe used to measure temperature inside and outside the PhysicalScience Laboratory. Air and water temperatures can be measuredoutside the lab throughout an entire year. Both the month and theday of the month can be varied. The temperature read will beapproximately equal to the average temperature for that day. Thetemperature inside the lab remains at a constant 68 degreesfahrenheit (20 degree celsius). The circular thermometer can showeither a celsius or fahrenheit scale.
The Thermometer Instrument:
The thermometer instrument resides on the shelf in instrumentwindow 1. To use the thermometer, drag it to the desire locationand release it. The thermometer will read the temperature airectlyunder its bulb. Placing the bulb in the water will cause the watertemperature to be read; placing the bulb anywhere else causes theair temperature to be read. As long as the thermometer is not onthe shelf, it will register changes in temperature.
Each time the thermometer is released, the temperature at thecurrent location will be voiced by the computer. Temperatures readby the thermometer instrument are registered in the value bar ofthe thermometer instrument window. The units are displayed in theunits bar below. Clicking on the units bar will cause the valueand units displayed to switch between fahrenheit and celsiusdegrees. Clicking on the value bar will either show or hide thecurrent temperature value.
The Large Circular Thermometer:
The large circular thermometer displays the temperaturecurrently being sensed by the thermometer instrument. It isdesigned to give students practice in reading a circular scale byinterpolation.
To switch the scale between celsius and fahrenheit on thelarge circular thermometer, click on the units bar in thethermometer instrument window.
The Calendar:
The calendar appearing in instrument window 3 can be used tochange tY month of the year or the day of a particular month.Clicking the units bar will cause either the word "Month" or
2
7: I

"Day" to appear in the units bar. Clicking on the plus gadget inthe calendar window will cause either the month or day to advanceby 1. The name of the month, or the day number, will appear in thevalue bar. Clicking on the minus gadget in the calendar windowwill cause the month or day to decrease by 1.
Attempting to advance the day number beyond the last day ofthe month, causes the day numbers to begin anew at day 1 for thatsame month. Attempting to decrease the day number below day 1,causes the day number to wrap to the last day for that month.
Note that it is possible to change the month or day while timeis stopped (clock not running): neither the scene nor thetemperature will change, however.
Outside The Lab:
The scene outside the lab changes to reflect the monthcurrently selected. Changing the day number has no effect on thevisual scene. Both the temperature of the lake and the air can bemeasured on a daily basis. The temperatures are typical for theNew England region of the United States. The temperature of theair is the average temperature for a given day.
To cause the scene or temperature to change, time must beadvancing, i.e., the elapsed-time clock must be running. If theclock were stopped, it would be possible to show January in thevalue bar, while the scene displayed is the month of June. Bystopping the clock, you can quickly advance through a number ofmonths, without waiting for a scene change.
If the lake is frozen over, than the temperature of thesurface of the lake will be the same as the air temperature.
The Elapsed-Time Clock:
While the elapsed time clock is running, any changes made tothe month or day via the calendar window will cause an appropriatechange of scene or temperature. If the clock is not running, itis still possible to advance the month or day via the calendarwindow, but neither the scene iit the temperature will change.
3
171

Worksheet 5-1: Measuring Air And Water Temperatures
Problem 1 - Measuring The Air Temperature
Measure the outdoor air temperature in degrees Fahrenheit onthe first day of January.
Answer 1
Instructions Por Problem 1
The lab bench is divided into two sections. On the left is a largethermometer that shows the same temperature as the thermometerinstrument. On the right is the scene outside the Physical ScienceLaboratory. To measure outdoor temperature you will place thethermometer instrument outside.
First: Set the month and day using the calendar window.
1) Stop the elapsed-time clock by clicking on the STOP gadget.
2) Click on the units bar in the calendar window until the wordmonth appears in the units bar. Click on the plus gadget (+)or minus gadget (-) until January appears in the value bar.
3) Click .3n the units bar in the same window until the word dayappe-zs. Click on the plus or minus gadget until the number 1app.lars in the value bar.

IN/
Second: Use the thermometer instrument to measure the outsidetemperature.
1) Click on the units bar in the thermometer instrument windowuntil the words degrees P (degrees Fahrenheit) are showingthere.
2) If the value bar in the thermometer window is hidden, click onit once to make the number appear.
3) Drag the thermometer instrument from its shelf or any otherlocation and release it in the outdoors. The temperature of thecurrent scene will be announced by the comp:ter.
4) Start the elapsed-time clock by clicking on the START gadget.
If necessary, the scene will change to January and the temperaturein the value bar will show the average temperature for the firstday of January.
Problem 2 - Measuring Water Temperature
Find the temperature of the lake in degrees Fahrenheit on Julyfirst.
Answer 2
Instructions For Problem 2
Set the month and day to July 1 in the calendar window. Follow theinstructions given in problem 1. Don't forget to STOP the clockbefore you begin; START it again when you are done.
Use the thermometer instrument to measure the temperature of thewater. Drag the thermometer into the lake. Make sure that thethermometer bulb - the rounded, bottom portion - is in contact withthe water. Release the mouse button to measure the temperature.

Worksheet 5-2: Temperature Extremes
Name: Date:
Teacher:
Class: Score:
What You Should Already !Mow
We recommend that you do Worksheet 5-1: Measuring Air And WaterTemperatures, before you try the problems on this worksheet.
Remember that the air temperature for a given day in thisexperiment is the average temperature for that day. The high andlow temperatures could easily be twenty degrees higher or lower.
Problem 1 - Coldest Part Of The Year
What are the dates of the coldest part of the year as measuredby the air temperatures. Give the months and days w)len it iscoldest.
Answer 1
Instructions For Problem 1
Use the thermometer instrument and explore the temperaturesthroughout the months and days of the year. Use the calendarwindow to change the months and days.
of 2
171

Problem 2 - Warmest Part Of Tbe Year
What are the dates of the warmest part of the year as measuredby the air temperatures? Give the months and days.
Answer 2
Problem 3 - A Frozen Lake
During what months is the lake frozen over? What temperaturedo you measure for the lake when it is frozen over? What areyou actually measuring?
Answer 3
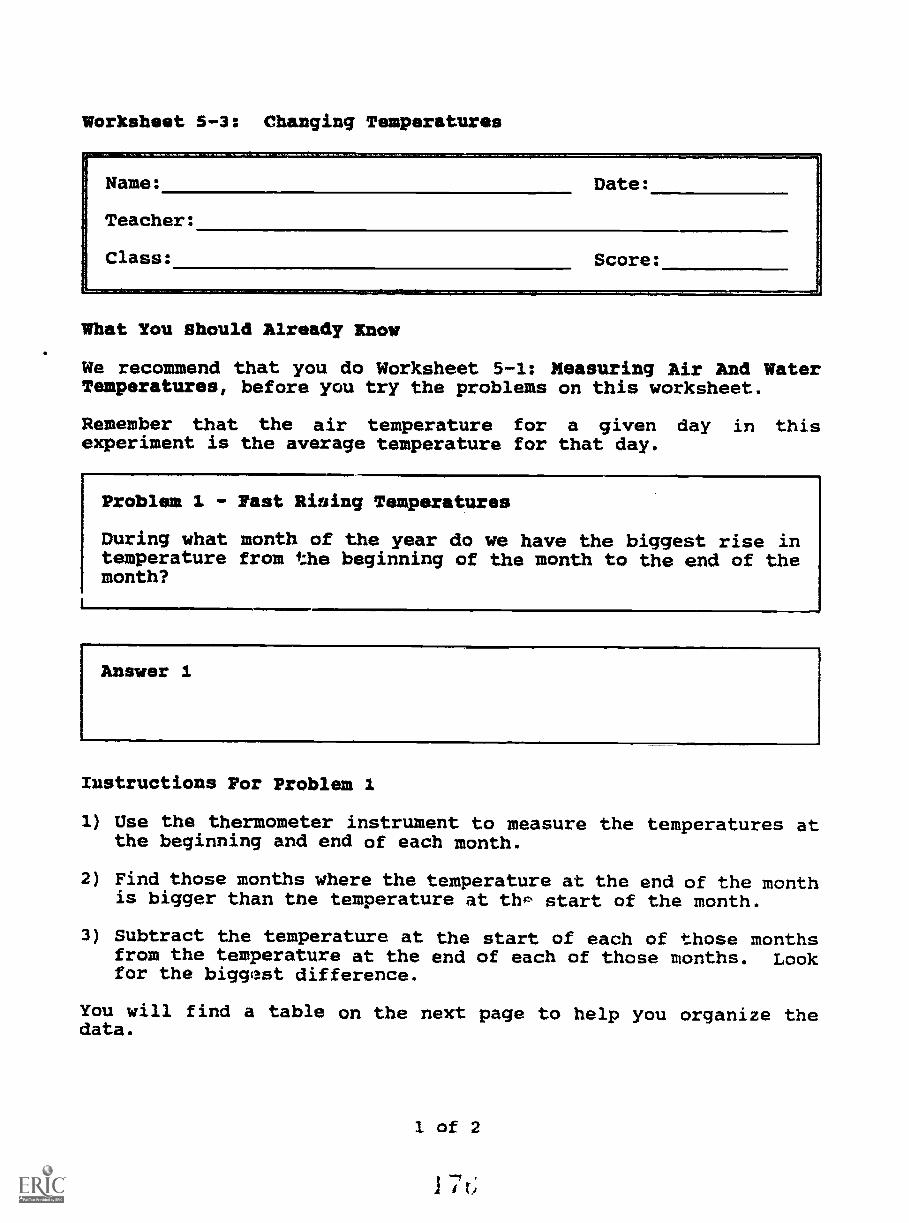
Worksheet 5-3: Changing Temperatures
Name:
Teacher:
Class:
What You Should Already Know
We recommend that you do Worksheet 5-1: Measuring Air And WaterTemperatures, before you try the problems on this worksheet.
Remember that the air temperature for a given day in thisexperiment is the average temperature for that day.
Problem 1 - Fast Rising Temperatures
During what month of the year do we have the biggest rise intemperature from the beginning of the month to the end of themonth?
Answer 1
Instructions For Problem 1
1) Use the thermometer instrument to measure the temperatures atthe beginning and end of each month.
2) Find those months where the temperature at the end of the monthis bigger than the temperature at thP start of the month.
3) Subtract the temperature at the start of each of those monthsfrom the temperature at the end of each of those months. Lookfor the biggest difference.
You will find a table on the next page to help you organize thedata.
1 of 2

Month
JAN
FEB
MAR
APR
MAY
JUN
JUL
AUG
SEP
OCT
NOV
DEC
Temperature Data And CalculationsTo Find The Biggest Rise In Temperature
Temperature Temperature PositiveBegin End Ditference
(End - Begin)
(units) (units) (units)
2 of 2
141

Worksheet 5-4: Temperature Scales
Name:
leacher:
Class:
Date:
Score:
Problem 1 - Find The Miss4ng NUmbers
Complete the following table by filling in the temperatures indegrees Celsius that match the temperatures in degreesFahrenheit.
Temperatura TableChanging From Fahrenheit To Celsius Degrees
Dejrttes DegreesFabranheit Celsius
5
14
23
32
41
50
59
68
77
R6
1 of 2
I 7
0_

Instructions For Problem 1
1) Click on the units bar in the thermometer window until the unitsare degrees F.
2) Find a day during the year when the temperature in degreesFahrenheit is equal to one of the numbers in the table.
3) Click on the units bar to convert the temperature in degreesFahrenheit to the temperature in degrees Celsius. Read theCelsius value in the value bar. Write it in the table.
Repeat steps 1 through 3 (don't forget 1, it's easy to forget)until you have found all the numbers you can.
Problem 2 - Using Patterns In MUmbers
Use the way the numbers are changing in the table to help youfill in the missing numbers.
Problem 3 - Making Up Rules
Finish the following rule about the way the rumbers arerelated:
Whenever the Fahrenheit temperature changes bythe Celsius temperature changes by degrees.
2 of 2

Worksheet 5-5: Reading A Circular Thermometer
Name:
Teacher:
Class:
Date:
What You Should Already Know
Score:
We recommend that you do Worksheet 5-1: Measuring Air And WaterTemperatures, before you try the problems on this worksheet.
Problem 1 - Reading The Seale Marks On The Thermometer
On the circular thermometer shown below, draw a pointer fromthe center to the Scale mark that means "45 degreesFahrenheit".
2E1 120
1 of 3

Instructions For Problem 1
1) Make sure that the value bar in the thermometer window is nothidden. Click on the value bar if it is hidden until the numberappears.
2) Click on the units bar until the words degrees F (degreesFahrenheit) appear there.
3) Using the calendar window, select a day during the year thathas an average temperature of 45 degrees Fahrenheit. When thevalue bar displays 45, note the position of the red pointer onthe large thermometer; the end of the pointer will be next tothe 45 degree Fahrenheit scale mark.
Problem 2 - Reading Between The Lines: Interpolation
Fill in the values that match the points on the temperaturescale shown below.
2 of 3
I S 1

Instructions For Problem 2
Follow the instructions for problem 1 except that you will need tofind temperatures that match the points shown in answer box 2.
Problem 3 - Testing Yourself
Write down the temperature values pointed to by the pointers.Use the nearest space provided outside the thermometer.
3 of 3

110100 -
g013070B050
302010
-10
Experiment 5: RefrigeratorRefrigerator Door Open To Room Temperature
Objectives
This environment is designed to help students learn how toread the scales associated with a thermometer, as well as learn howto use the thermometer instrument in the Physical ScienceLaboratory. In addition, the student can learn about temperatureconditions in the family refrigerator and can learn to controlthose conditions.
1
I )

Features
General Description
This simulation allows students to measure temperatures in therefrigerator and freezer compartments of a typical familyrefrigerator. The student can also control the rate of cooling inthe refrigerator by adjusting the refrigerator thermostat. Thethermostat has 10, different settings including an OFF position.
The doors of the refrigerator open and close. The thermometerinstrument can be placed inside the refrigerator and the door(s)closed. When the refrigerator or freezer door is closed, thetemperature given is the average temperature of the contents ofthat compartment of the refrigerator. When the door is opened, thetemperature given is the temperature of the air in the room.
The left-hand side of the lab bench exhibits a largethermometer whose scale is readable as the liquid in the tube risesand falls with a change in temperature. Two scales are available:fahrenheit and celsius. The fahrenheit scale includes a magnifyinggadget that increases the size of the scale to give a more precisereading.
The Refrigerator
The Doors:
Click on the door handles to open the refrigerator doors."Push" an open door closed by clicking on it.
The Thermostat:
The temperatures in the refrigerator and freezer compartmentsare controlled by a single thermostat (the lead designer for thisproject owns an old refrigerator!). Once the thermostat is set,the refrigerator and freezer temperatures will each rise or fallto a particular value (but not the same value). Freezertemperatures range from -4 to 12 degrees F0 while the refrigeratorcompartment ranges from just above 32 to 40 degrees F.Refrigeration can be turned off by setting the thermostat to theOFF position.
The thermostat control can be found in instrument windownumber 3. Clicking on the plus gadget will increase the settingwhile clicking on the minus gadget will decrease the setting. Thecurrent setting is shown in the value bar of the thermostat window.
2

The abbreviation "Refriger" appears in the units bar. Thenumerical value of the thermostat is not the actual temperaturesetting (as is the case for most refrigerators).
Selecting the thermostat control instrument, or the thermostatinside the refrigerator, will cause a large thermostat to appearin place of the large thermometer on the left-hand side of the labbench. The scale can be easily read to show the current setting.It will, of course, agree with the numerical value showm in thevalue bar of the thermostat window. Selecting the thermometerinstrument will cause the large thermometer to replace the largethermostat on the lab bench.
Inside The Refrigerator:
Because outside air rapidly infiltrates a refrigeratorcompartment (like those simulated here) when a door is opened, thetemperature measured will always be the room temperature when adoor is open. When a door is closed, the small amount of airinside cools rapidly to the temperature of the contents, thus thetemperature of the contents determines the temperature measuredwhen the door is closed with the thermometer inside.
If a door is left open, the temperature of the contents willgradually rise (and the refrigerator will run constantly). Closethe door to measure the resulting rise in temperature.
The Large Thermometer:
The large thermometer appears on the lab bench whenever thethermometer instrument is selected. The liquid level changes toreflect changes in temperature being measured by the thermometerinstrument. Both fahrenheit and celsius scales are available.Clicking on the units bar in the thermometer instrument window willchange the scale depicted.
To toggle the magnification of the fahrenheit scale of thelarge thermometer, click on the magnifying gadget shown in thelower left-hand corner of the lab bench. Individual degrees canbe read quite easily on high magnification.
The Thermometer Instrument:
The thermometer instrument resides on the shelf in instrumentwindow 1. To use the thermometer, drag it to the desired locationand release it. The thermometer 1#/ill read the temperature directlyunder its bulb.
3
J41

Each time the thermometer is released/ the temperature at thecurrent location will be voiced by the computer. Temperatures readby the thermometer instrument are registered in the value bar ofthe thermometer instrument window. The units are displayed in theunits bar below. Clicking on the units bar will cause the valueand units displayed to switch between fahrenheit and celsiusdegrees. Clicking on the value bar will either show or hide thecurrent temperature value.
To read the average temperature of the contents of therefrigerator or freezer/ place the thermometer instrument insidethe refrigerator and close the door of the refrigerator or freezer.
You will probably want to speed time up quite a bit to observechanges in the temperature readings while manipulating theenvironment.

Worksheet 6-1: Inside Your Refrigerator
Name: Date:
Class: Score:
Problem 1: Look Inside The Refrigerator And Freezer
You are very hot and thirsty and need something cold to drink.See if you can find what it is you need in the refrigerator.You might want to put ice in your drink. Open up the freezerand see what is in there. What did you find in therefrigerator to drink? What did you find in the freezer?
Answer 1
Instructions For Problem 1
To open up a refrigerator you normally pull on the door handle.In this experiment you can open the refrigerator door by clickingon the door handle with the mouse. Try it.
To open up the freezer door click on the freezer door handle. Tryit.
Take a look inside both the reftigerator and the freezer to answerthe questions in Problem 1.
1 of 2

Problem 2: Opening And Closing
Mow that you have the doors open see if you can close them.What else can you find in the refrigerator that opens andcloses?
Answer 2
Instructions For Problem 2
Hardly anyone uses the handle to close the door on a refrigerator.Becides, you can't reach it very easily because it's always on theother side when the door is open. Most of us just grab the doorand push it closed. You can do the same thing with the mouse byjust clicking anywhere on the open door. Try it.
Problem 3: The Refrigerator Door Won't Close
While opening and closing things belonging to the refrigerator;you can get into a situation where the door on the refrigeratorwill not close. Why won't the door of the refrigerator closeand what do you have to do to fix the problem?
Answer 3
2 of 2
5:5

AM,
Worksheet 6-2: Temperatures Inside A Refrigerator
Problem I - Temperature Inside Refrigerator Compartment
What is the temperature in degrees Fahrenheit inside therefrigerator?
Answer I
Instructions For Problem I
1) Make sure that the value bar in the thermometer instrumentwindow is not hidden, and change the units to degrees F in theunits bar, if necessary.
2) Open the refrigera'Por door (not the freezer door). Drag thethermometer from the shelf and place it in the refrigerator.Notice that the temperature is 68 degrees F. This is becauseroom air has entered the refrigerator.
3) Close the refrigerator door Read the temperature in the valuebar. Unless the refrigerator has been OFF for a long time thetemperature should be less than 68 degrees F.
Problem 2 - Temperature Inside Freezer Compartment
What is the temperature in degrees Fahrenheit inside thefreezer?
1 of 2

Answer 2
Instructions For Problem 2
Follow the instructions for problem 1 only this time place thethermometer inside the freezer rather than the refrigerator.
Problem 3 - The Temperature Controller
Find the temperature control instrument inside therefrigerator. Click on it. What is the current setting on thedial?
Answer 3
Instructions For Problem 3
The temperature control instrument, also called a thermostat, ison the back wall of the refrigerator compartment. Click on it tosee the dial settings. The blue dot is positioned next to thecurrent setting. Read the setting from the dial.
2 of 2

Worksheet 6-3: Controlling Refrigerator Temperature
What You Should Already Rnow
We recommend that you do Worksheet 6-2: Temperatures Inside ARefrigerator before you begir this Worksheet.
Problem 1 - Changing The Thermostat Setting
Change the thermostat setting of the refrigerator to 5.
Instructions For Problem 1
Use the thermostat control instrument in window 3. The units barhas the abbreviation Refrig. displayed in it. The thermostatsetting controls the temperature inside the refrigerator. Tochange the setting click on the plus (+) or minus (-) gadget in thethermostat window. The current setting will appear in the valuebar. Click on the plus or minus gadgets until the number 5 appearsin the value bar.
If you click on the thermostat icon on the instrument shelf, alarge thermostat dial will appear on the left-hand side of the labbench. The setting on the dial should be the same as the one inthe value bar.
Problem 2 - What Will Be The Refrigerator Temperature
What temperature does the refrigerator reach when thethermostat is set to 5?
1 of 2

Answer 2
Instructions For Problem 2
1) Place the thermometer inside the refrigerator and close thedoor.
2) Make sure that the elapsed-time clock is turned off by clickingon the STOP button.
3) Adjust the clock speed-control to a factor of about 10. Youonly have to move it up very slightly.
4) Turn on the elapsed-time clock. Watch the value bar for theclock. A minute should click by in 6 seconds.
5) Watch the temperature in the value bar. It may change for awhile, and then change hardly at all. You can speed up theclock even more if you like (Don't forget to stop the clock todo so). When the temperature seems to have reached a fixedvalue, record that number.
Problem 3 - What Will Be The Freezer Temperature
What temperature does the freezer reach when the thermos,.at isset to 5?
Answer 3
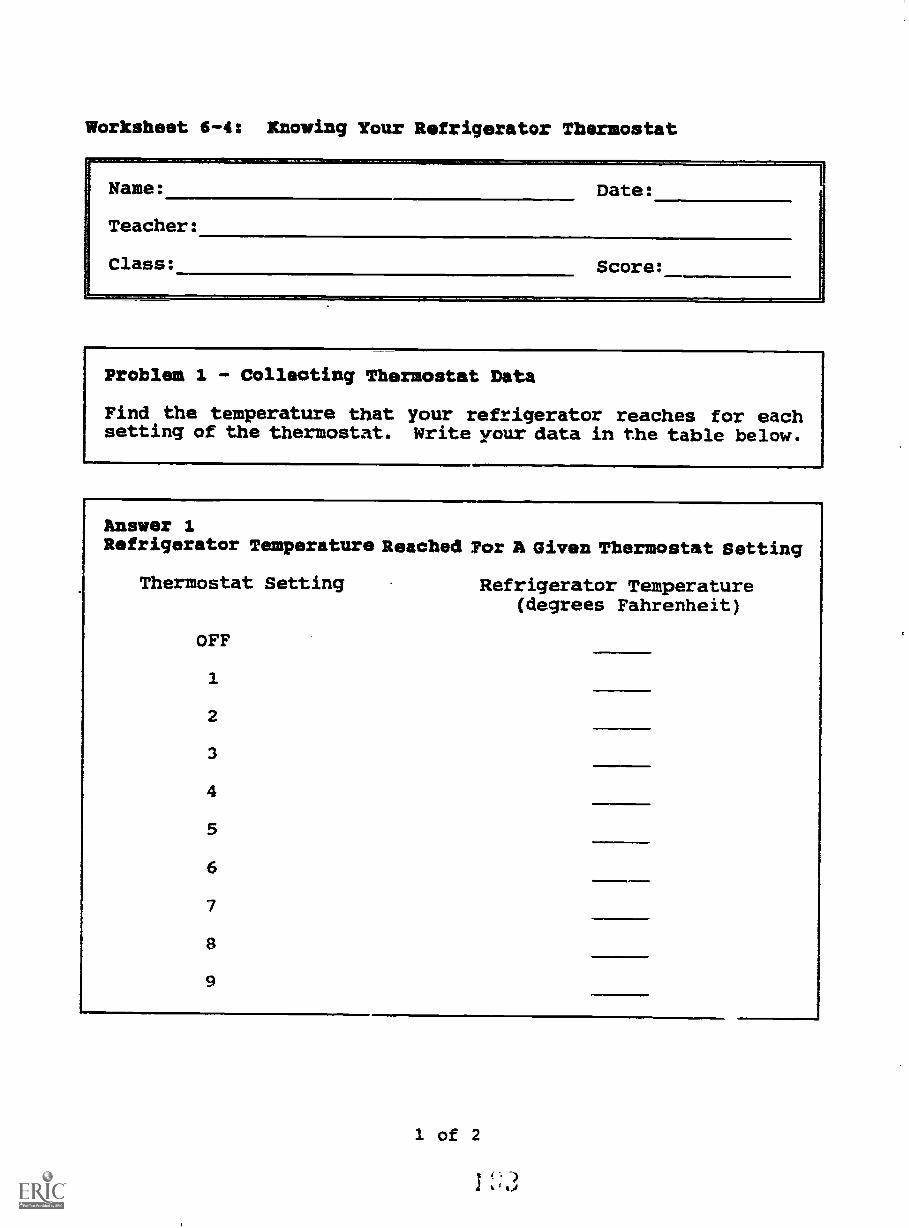
Worksheet 6-4: Knowing Your Refrigerator Thermostat
Name: Date:
Teacher:
Class: Score:
Problem 1 - Collecting Thermostat Data
Find the temperature that your refrigerator reaches for eachsetting of the thermostat. Write your data in the table below.
Answer 1Refrigerator Temperature Reached Por A Given Thermostat Setting
Thermostat Setting Refrigerator Temperature(degrees Fahrenheit)
OFF
1
2
3
4
5
6
7
8
9
1 of 2
1 zIA

Instructions For Problem 1
Follow the instructions given in Activity Worksheet 6-3:Controlling Refrigerator Temperature to set the thermostat to oneof the values shown below. Wait until the temperature is no longerchanging. Then enter the value in the table. You will have tospeed time up to do this experiment.
Problem 2 - Make A Graph Of Your Data
Plot your data on the graph below.
40 -
T39
38
37A
36
35
AMI111
4
p.
34DEGREES
33
32 4
31
30
4
1 2 3 4 5 6 7 8 9
THERMOSTAT SETTING
2 of 2

Worksheet 6-5: What If The Power Goes Off
Problem 1 - Collecting Temperature Data
Simulate a power failure to your refrigerator by turning thethermostat OFF. Measure the temperature in the refrigeratorevery two hours for 24 hours. Write your data below.
Answer 2Refrigerator Temperatures With Thermostat OFF
Elapsed Time Refrigerator(Hours) Temperature
(Degrees F)
02468
1012141618202224
,ImImmg.
,1 of 2

Instructions For Problem I
Cool your refrigerator down to 32 degrees F. Use the informationyou collected in Activity Worksheet 6-4: Knowing Your RefrigeratorThermostat in order to do this. TUrn the thermostat to the OFFposition. Stop the clock every two hours to record thetemperature. You may want to speed time up to do this activity.
Problem 2 - Make A Graph Of Your Time And Temperature Data
Plot your data on the graph below.
70
65 -
M60
55A
50
45
40DEGREES
35
30
0
-41r -4
/Pr
-4111
2 4 6 8 10 12 14 16 18 20 22 24
ELAPSED TIME (HOURS)
2 of 2

Worksheet 6-6: Reading A Thermometer
Problem 1 - Reading The ScaleMarks On A Thermometer
Draw an arrow to the scalemark on the thermometer thatmeans: "a temperature of 32degrees Fahrenheit."
Instructions For Problem 1
See the next page.
Problem 2 - Reading TheTemperature At The LiquidLevel Of A Thermometer
Read the temperature indicatedby the liquid level in thethermometer. Write the numbernext to the top of the liquid.
Instructions For Problem 2
See the next page.
1 of 4
;17

Instructions For Problem I
1) Place the thermometer instrument in the refrigerator and closethe door.
2) Bring the temperature in the refrigerator down to 32 degreesFahrenheit. Use the thermostat setting you found in Worksheet6-4: to do this.
2) When the value bar reaches 32, click on the magnifying gadget(it looks like a big magnifying glass) on the lower left sideof the lab bench. A portion of a large thermometer willappear on the lab bench. It will be similar to the one on theWorksheet.
3) Look carefully at the liquid level of the thermometer on thelab bench. The scale mark nearest the liquid level is the 32degree Fahrenheit mark. Draw an arrow pointing to the samescale mark on the Worksheet thermometer.
Instructions For Problem 2
1) Leave the thermometer instrument in the refrigerator. STOPthe elapsed-time clock and use the speed-control to speed timeup. START the clock again.
2) TUrn the thermostat to the OFF position. Watch the liquidlevel until it climbs to the one in the drawing. You can stopthe clock every now and then to make a closer check.
3) When the liquid levels are the same read the temperature inthe value bar. If you go past the scale mark you can alwayscool the refrigerator to make the temperature go back down.
Problem 3 - Naming All The Scale Marks Along 10 Degrees
See the thermometer drawing on the next page. In the spaceprovided, write ths temperature that matches each of the scalemarks.
2 of 4

Instructions For Problem 3
Place the thermometer instrument in the freezer to see temperaturesin this range. If they are too low you can turn the thermostat toOFF. If they are too high you can cool the freezer down.
3 of 4
I '

IProblem 4 - Interpolation Of Temperature Readings
Enter the temperatures to which the lines are pointing.
-........,
Answer 4
Instructions For Problem 4
Some thermometers do not have scale marks for each degree oftemperature. By looking carefully at the scale you can oftenguess, within one or two degrees, what the actual temperature is.
In this problem you can help yourself by switching back and forthbetween the two Fahrenheit thermometers on the lab bench by usingthe magnifying gadget. Just click on it to switch from one to theother.
4 of 4

Worksheet 6-7: In Your Own Refrigerator
What You Should Already Know
We recommend that you complete Worksheet 6-6: Reading A Thermometerbefore you do this Activity Worksheet.
Problem 1 - The Temperature of Your Own Refrigerator
Using a special thermometer that your teacher will lend youuntil the next school day, measure the temperature of yourrefrigerator at home. Please ask permission from your folks athome before you try this.
Answer 1
Instructions For Problem 1
Your teacher will lend you a thermometer that you can safely placein your home refrigerator. It is made of plastic and it is verystrong. Nordic skiers often wear this kind of thermometer on theirjackets so they can tell what kind of wax to put on their skis.
Place the thermometer where it can be reached easily. It will takea while for the thermometer to reach the refrigerator temperature.Leave it in until the temperature stops changing. If you leave itin for 10 minutes that should be enough.
When you take it out to read it, be quick about it because thetemperature will begin to rise almost as soon as you take it outof the refrigerator.
I of 1

Objectives
,
IS
Experiment 7: PendulumPendulum In Earth-Lab Environment
AEs.
This environment is designed to help students learn how apendulum behaves under different experimental conditions, and inparticular to learn how a pendulum can be used to measure thegravitational acceleration of the earth and the moon
1
s "1

Features
General Description
This simulation allows students to perform experiments witha pendulum. The student can change to one of three differentpendulum bobs during an experiment. The length of the pendulum canbe varied by "pulling" on the cord attached to the pendulum bob.The pendulum experiments can be moved quickly between the earth andthe moon. Measurement instruments are available to measure massand length as well as elapsed time. A marker is available to markthe position of the pendulum.
The motion of the pendulum can be stopped at any time. Whiletime is stopped, the pendulum may be positioned at any angulardisplacement between 0 and plus or minus 90 degrees. The pendulumwill behave in a periodic manner for small angular displacementsand will exhibit non-linear behavior for larger angulardisplacements. The motion of the pendulum is affected by airresistance whi:e on earth, but air resistance is not a factor onthe surface of the moon. A small amount of internal frictioncauses damping of the pendulum motion both on the earth and themoon.
One of the pendulum bobs (the hollow looking one) can be usedto illustrate pendulum motion with only the force of gravityaffecting the motion regardless of where the experiment is takingplace: be it the earth or the moon. The chief use of the hollowbob is to illustrate those statements that begin, "Let us assumethe absence of any friction...".
The Pendulum
The pendulum is made up of two parts: the pendulum bob and thecord from which the pendulum bob is suspended.
The Bobs:
Three pendulum bobs are available during the simulation. Thebobs may be interchanged by dragging one of the free bobs andreleasing it on top of the suspended bob. When a bob is releasedor exchanged it automatically returns to one of the resting placeson the lab floor. The mass of a pendulum bob can be measured byusing the beam balance measurement instrument.
The hollow bob is special; when it is used as the pendulumbob no other forceu other than the force of gravity are acting onthe pendulum, i.e., internal friction and air resistance areabsent. The other two bobs are assumed to be spherical in shape
2

with the horizontal diameter being the closest to the intendeddiameter of the sphere.
The Cord:
The pendulum cord is held in position by a support extandingfrom the lab wall. The length of the pendulum cord may Le changedby pulling or pushing (actually dragging) the "ring" attached tothe other end of the cord that passes through the support. Thering is the triangular shaped object at the other end of the cord.The length ox the cord can be varied between 0.3 and 2.3 metersapproximately. We have made the mass of the cord negligiblerelative to the mass of the pendulum bobs.
Positioning The Pendulum:
In order to manipulate the pendulum time must be stopped.Clicking on the STOP button will halt the pendulum's motion if itis moving. To position the pendulum simply Orag the pendulum bobto the desired location. The available starting positions are ofcourse constrained by the length of the cord. As long as time isstopped the pendulum will remain suspended in space where it waslast placed. The angular displacement may vary between plus orminus ninety .egrees.
The Lab
Window Shade And Door:
The lab itself is designed to aid the experimenter in severalways. Of course there is the nice view, but if this interfereswith taking data on the position of the pendulum, both the windowshade and the door may be closed. To close (or open) the shadeclick on the lower end of the shade. To close or open the door,click on the door handle. The large white surface area availablewhen the shade and door are closed may be used for marking theposition of the pendulum with the marker instrument.
Location:
The lab may be transported to the surface of the moon fordoing experiments. Simply click on the quarter moor that is barelyvisible in the earthan sky. If you want to return to earth whenon the moon then click on the earth, which is visible from thewindow of the lunar lab.
Air affects the motion of the pendulum while on the earth, butthere is no air in the lunar lab. Internal friction of thependulum is present on both the earth 1%d the moon (except when thehollow bob is used).
3
'

The Beam Balance:
The beam balance may be used to measure the mass of thependulum bobs. Drag the beam balance from the instrument shelf andposition the platform of the beam balance directly under the bobbeing measured. The mass of the bob will be read when the buttonon the mouse is released. The top of the platform and the bottomof the bob must be closely aligned in order to obtain a readingother than zero. Return the balance to the instrument shelf whenyou are done using it.
The Marker:
The marker can be used to mark the position of the pendulumwhen time is stopped. A next gadget appears in the marker window.Clicking on the next gadget flips the marker so that it becomes aneraser. The current mode is indicated in the value bar of themarker window.
To acquire the marker/ make sure that time is stopped andclick on the marker. Your pointer will disappear and the markerwill now be attached to the mouse. Move the marker to where youwant to write - don't drag it, just move it - and press the mousebutton. A mark will appear just below the tip. Release the mousebutton when you have finished marking.
To replace the mouse button on the shelf, move the marker tothe shelf and click the mouse. Your pointer will reappear and themarker will be back on the shelf.
The Ruler Instrument
The ruler instrument appears on the shelf in instrument windowtwo at the start of the experiment. A length measurement is madewith the ruler by using it to identify thy beginning and endingpoint of a measurement.
Positioning the ruler to begin a Measurement:
Drag the ruler to its starting location. (Move the mousepointer over the ruler and press the mouse button. While pressingthe mouse button, move the mouse - and consequently the ruler - tothe desired starting location.)
4

Beginning the measurement:
Release the mouse button. (After dragging the ruler to thestarting location, let up on the mouse button.)
When naking horizontal measurements you can align the leftedge of the ruler with the starting location on the object beingmeasured. When making vertical measurements you can use the topedge of the ruler.
Narking off the distance:
Move the mouse to the ending location. A line will be drawnon the screen as you move the mouse. The length of that line isthe current distance you will have moved from the beginningposition.
Ending the measurement:
Click when you have reached the ending location. (Press andrelease the mouse button quickly.)
The mouse pointer will reappear. You are free to display themeasurement in different units at this time. If the value bar isnot hidden the computer will also "speak" the number shown in thevalue bar. The measurement is the sane as the length of thecolored line that was drawn on the screen when you positioned theruler.
5
r

Worksheet 7-1: Working With The Pendulum
Problem 1: "Close The Door, Close The Shade..."
It's hard to get any work done with the shade and the dooropen. Close the door and the shade at least for now; you don'thave to keep them closed. Where must you click with the mouseto close the door; to close the shade? How can you open themagain?
Answer 1
Problem 2: Bobbing Around
Pick up one of the pendulum bobs on the lab floor and exchangeit with the one that is hanging from the end of the cord. Whathappens during the exchange?
Answer 2
Instructions For Problem 2
Using the mouse: drag the pendulum bob that is on the floor overthe pendulum bob that is on the end of the cord. Release. Seewhat happens.
1 of 2
"4.7

Problem 3: Changing The Length Of The Pendulum
Make the length of the cord between the support arm and thependulum bob longer or shorter. Is it possible to have thependulum bob touch the floor while it is still attached to thecord?
Answer 3
Instructions For Problem 3
There is a small handle attached to the other end of the pendulumcord after it passes through the support arm. You can pull or pushon that handle to lengthen or shorten the distance that thependulum bob is suspended. Using the mouse, drag the handle - alsocalled fthe ring" - up and down. Try it.
2 of 2

Worksheet 7-2: Observing Pendulum Motion
Name:
Teacher:
Class:
Date:
Score:
What You Should Already Know
You should know how to change things around in the lab, especiallythe parts of the pendulum. Do Worksheet 7-1: Working With ThePendulum to learn how.
ftoblem 1 - Simple Observation
Put the red bob on the end of the pendulum cord. Make thependulum cord as long as possible. Pull the pendulum bob ashigh as it will go. Start the clock. Watch what happens.Describe what happens in a sentence or two.
Answer 1
Instructions For PrOblem I
STOP the elapsed-time clock if it isthe end of the cord it is not alreadyas high as it will go toward the labbob as high as it will go towardhorizontal when you are done. Start
1 of 3
running. Put the red bob onthere. Push the cord handleceiling. Move the pendulumthe ceiling. It should bethe elapsed-time clock.

Problem 2 - Simple Hypothesis
How will the motion of the pendulum Change if we shorten thependulum cord? Will the pendulum swing back and forth at aslower pace or at a faster pace? Write your gueos below. Atthe same time give a short explanation of why you think it willswing faster or slower with a shorter cord.
SPECIAL NOTE: It doesn't matter if your guess is right orwrong, so don't worry about getting it "right". What counts isthat you make the guess and try to back it up with informationthat you already know Scientists often gmess wrong, but thatjust makes them more curious, and leads them to learning newinformation about the behavior of objects. A scientific guessis called an hypothesis (HI - PO= - EH - SIS). Now make yourhypothesis.
Answer 2
Instructions For Problem 2
DON'T do the experiment before you make your hypothesis. Try tocome up with just one reason why you think it will behave the wayyou described.
2 of 3

Problem 3 - Testing Your Hypothesis
OK, now do the experiment. Shorten the pendulum cord as muchas you can and observe the behavior of the pendulum. Describewhat happens. Does it swing faster or slower when the pendulumcord is shorter?
SPEC/AL NOTE: Although you may have guessed correctly yourreason may be wrong! Later an we will do more experiments todetermine the reasons why a pendulum does what it does.
Answer 3
Instructions Par Problem 3
STOP the elapsed-time clock. Pull the cord handlethe floor; the red pendulum bob should rise.almostarm. Mave the bob up as far as it will go;horizontal. START the elapsed-time clock.observation.
3 of 3
all the way toto the supportit should beRecord your

Worksheet 7-3: The Effects Of Mass
Name: Date:
Teacher:
Class: Score:
Wbat You Should Already Know
You should know how to move things around in the lab. You shouldknow how to make an hypothesis. See Worksheets 7-1: and 7-2: forhelpful activities.
Problem I - Mass of the pendulum bobs
Measure the mass of the red and blue pendulum bobs in grams.Write the results balow.
Answer 1
Instructions For Problem 1
Drag the beam balance onto the lab bench. Put the pan (it lookslike a dark black line on the icon) under the object whose mass youare going to measure. Don't get too far above or below the objector the mass will read 0.
1 of 3

Problem 2 - Make An Hypothesis
Which pendulum bob will swing faster? How much faster? Giveat least one reason why you think this is going to happen.
Answer 2
Ar
Instructions For Problem 2
Try to figure out in your own mind if one of the pendulum bobs willswing faster than the other. Try to predict how much faster. It'smuch more useful to be able to say something like "eight tiresfaster" then simply "faster." Write down a reason for yourprediction.
Problem 3 - Describing An Experiment To Test Your Hypothesis
Make up a simple experiment to test your hypothesis. Describethe experiment that you plan to do in the answer box below.
Answer 3
2 of 3
13

Instructions For Problem 3
Think up a simple experiment to test your hypothesis that one ofthe pendulum bobs will swing faster than the other because....
Don't do the experiment just yet. Just write a couple of sentencesabout what you plan to do.
Problem 4 - Doing The Experiment To Vest Your Hypothesis
Do the experiment that you described in your last answer. Whatdid you get for a result? If you didn't get the results youexpected, do any more questions come to mind?
Answer 3
Instructions For Problem 4
Write down the results you got, especially if they were not whatyou expected. In scientific experiments, one experiment usuallyleads to the next. Good experiments usually raise a lot ofimportant questions.
3 of 3
I 1

Instructions For Teachers
I) With Regard To Teacher Participation
Thank you for helping Macro test and evaluate this courseware. Thefollowing information will show you how to proceed.
Guiding You Through The Process
1) Mark the Checklist For Teacher Evaluation Of Courseware asyou go. Each teacher is provided with a Checklist to helporganize his or her activities.
2) Examine the introductory materials and complete the formentitled Teacher Evaluation Of Introductpry Materials.
3) Familiarize yourseli with the Activity Worksheet Series,especially the Introduction to each experiment. Work with oxobserve students using the courseware materials. Complete theform Teacher Evaluation Of Experiment after you are thoroughlyfamiliar with the materials and student reaction to a givenexperiment.
II) With Regard To Student Participation
Guiding Them Through The Process
1) A Checklist For Student Evaluation Of Experiments is providedfor each student who will be using the courseware materials.Check off the items on this list as the student completesthem.
2) After a student completes the Activity Worksheets associatedwith a given experiment, have them complete the form StudentEvaluation Of Experiment. Please have them do as manyActivity Worksheets for each experiment as their abilityallows.
III) With Regard To Materials Organisation
Two portable, hard-plastic file boxes are provided for storing thepaperwork described above. Folders containing the relevantmaterials for 20 students are stored in the large file box, andmaterials for 5 teachers are located in the smaller file box. Theteacher's file box should also contain a video tape labeled VideosFor The Physical Science Laboratory, a plastic thermometer, andabout 30 three by five cards.
1 of 2

The other half of this package is a large white three-ring binderlabeled TEWEER'S MANUAL on the spine. It contains the software,Teacher's Manual itself, and the Activity Worksheet Series. Thereare nine 34 inch disks tucked into labeled sleeves in the binder.
Please check to see that all the materials are intact when youreceive them.
ANT QUESTIONS ???????
Please contact: Garrett A. HughesProject CoordinatorMacro Systems, Inc.126 College StreetBurlington, Vermont 05401Telephone: (802) -863-9600

Instructions For Teachers
I) With Regard To Teacher Participation
Thank you for helping Macro test and evaluate this courseware. Thefollowing information will show you how proceed.
Guiding You Through The Process
1) Mark the Checklist For Teacher Evaluation Of Courseware asyou go. Each teacher is provided with a Checklist to helporganize his or her activities.
2) Examine the introductory materials and complete the formentitled Teacher Evaluation Of Introductory Materials.
3) Familiarize yourself with the Activity Worksheet Series,especially the Introduction to each experiment. Work with orobserve students using the courseware materials. Complete theform Teacher Evaluation Of Experiment after you are thoroughlyfamiliar with the materials and student reaction to a givenexperiment.
II) With Regard TO Stadent Participation
Guiding Them Through The Process
1) A Checklist For Student Evaluation Of Experiments is providedfor each student who will be using the courseware materials.Check off the items on this list as the student completesthem.
2 After a student completes the Activity Worksheets associatedwith a given experiment, have them complete the form StudentEvaluation Of Experiment. Please have them do as manyActivity Worksheets for each experiment as their abilityallows.
III) With Regard To Materials Organization
Two portable, hard-plastic file boxes are provided for storing thepaperwork described above. Folders containing the relevantmaterials for 20 students are stored in the large file box, andmaterials for 5 teachers are located in the smaller file box. Theteacher's file box should also contain a video tape labeled VideosFor The Physical Science Laboratory/ a plastic thermometer, andabout 30 three by five cards.
1 of 2
'42 1 7
The other half of this package is a large white three-ring binderlabeled TRACKER'S MANUAL on the spine. It contains the software,Teacher's Manual itself, and the Activity Worksheet Series. Thereare nine 3i inch disks tucked into labe.Led sleeves in the binder.
Please check to see that all the materials are intact when youreceive them.
ANY QUESTIONS ?TM??
Please contact: Garrett A. HughesProject CoordinatorMacro Systems, Inc.126 College StreetBurlington, Vermont 05401Telephone: (802)-863-9600
2 of 2

Checklist For Teacher Evaluation Of Courseware
Student Name:
School: Grade:
INSTRUCTIONS FOR THE TEACNZR:
Please put a check mark on the appropriate line when you completecomplete each of the items listed below.
Video Introduction
Using MouseTouring The LabA Sneak Preview
Teacher's Manual
Part I: Factors Influencing The DevelopmentPart II: Operating The Physical Science LaboratoryPart III: Documentation And Support MaterialsPart IV: Suggested Instructional Methodologies
Experiment 0: The Physical Science Laboratory
Introduction To Experiment 0:Worksheet 0-1: Touring The Physical Science LabWorksheet 0-2: Using The InstrumentsWorksheet 0-3: Using Other InstrumentsTeacher Evaluation Of Experiment 0:
Experiment 1: Finding Elapsed Time
Introduction To Experiment 1:Worksheet 1-1: Using The Elapsed Time ClockWorksheet 1-2: Making Time Go Faster Or SlowerWorksheet 1-3: Time SenseTeacher Evaluation Of Experiment 1:
Experiment 2: Finding Length And Width
Introduction To Experiment 2:Worksheet 2-1: Using The RulerWorksheet 2-2: More Ruler MeasurementsTeacher Evaluation Of Experiment 2:
1 of 2
21

Experiment 3: Finding Area
Introduction To Experiment 3:Worksheet 3-1: Area Of A RectangleWorksheet 3-2: Area Of A CircleWorksheet 3-3: Area Of A TriangleTeacher Evaluation Of Experiment 3:
Experiment 4: Finding Distance Using A Map
Introduction To Experiment 4:Worksheet 4-1: Measuring Map DistanceWorksheet 4-2: Measurement IssuesWorksheet 4-3: Ruler With 1/10 Inch Scale DivisionsWorksheet 4-4: Measuring Distances On Paper MapsTeacher Evaluation Of Experiment 4:
Experiment 5: Finding Seasonal Temperatures
Introduction To Experiment 5:Worksheet 5-1: Measuring Air And Water TemperaturesWorksheet 5-2: Temperature ExtremesWorksheet 5-3: Changing TemperaturesWorksheet 5-4: Temperature ScalesWorksheet 5-5: Reading A Circular ThermometerTeacher Evaluation Of Experiment 5:
Experiment 6: Refrigerator
Introduction To Experiment 6:Worksheet 6-1: Inside Your RefrigeratorWorksheet 6-2: Temperatures Inside A RefrigeratorWorksheet 6-3: Controlling Refrigerator TemperatureWorksheet 6-4: Knowing Your Refrigerator ThermostatWorksheet 6-5: What If The Power Goes OffWorksheet 6-6: Reading A ThermometerWorksheet 6-7: In Your Own RefrigeratorTeacher Evaluatjon Of Experiment 6:
Experiment 7: Pendulum
Introduction To Experiment 7:Worksheet 7-1: Working With The PendulumWorksheet 7-2: Observing Pendulum MotionWorksheet 7-3: The Effects Of MassTeacher Evaluation Of Experiment 7:

Teacher Evaluation of Introductory Katerials
Name: Date:
School:
Normal Teaching/Administrative Assignments:
(In the space above, please give us an idea of what your current duties are. Include subjects, gradelevels, or special assignments when appropriate.)
INSTRUCTIONS:
This evaluation will constitute your response to the introductorymaterials provided with the Physical Science Laboratory. Pleasefamiliarize yourself with those materials. Complete each Part ofthis form after you have become acquainted with the introductorymaterials discussed in each Part.
This evaluation consists of a series of statements about theintroductory materials. For each statement, circle your level ofagreement or disagreement on a scale of 1 to 5. A "1" indicatesstrong agreement, whereas a "5" indicates strong disagreement. A"3" indicates that you are essentially neutral on that topicr Asection for your written comments is provided at the end of eachcategory of questions. Thank you for your help in evaluating thesematerials.
Part I: Video Introduction Strongly StronglyAgree Disagree
1. The video "Using A Mouse" provides 1 2 3 4 5good instruction in learning how touse a mouse.
2. I would recommend the video "Using 1 2 3 4 5A Mouse" to another teacher for useas an instructional tool.
3. I would use the video "Using A 1 2 3 4 5Mouse" to instruct students in howto use a mouse.
1 of 4
2

4. The video "Touring The Lab" providesa good overview of the basicfeatures of the Physical ScienceLaboratory.
5. I could describe the basic featuresof the lab to another teacher afterviewing the video "Touring The Lab."
6. I would use the.: video "Touring TheLab" to instruct students in thebasic features of the PhysicalScience Laboratory.
7. Having a person watch the video "ASneak Preview" is a good way tointroduce them to the simulatedenvironments in the Physical ScienceLaboratory.
1 2 3 4 5
1 2 3 4 5
1 2 3 4 5
1 2 3 4 5
Additional comments on the video introduction:
(Use additional space on back if necessary.)
Part II: Rands-On Introduction
8. The instructions in the Teacher'sManual for getting started with thehands-on materials are clear.
9. Starting up Experiment 0 did notpresent any significant problems.
10. Using the HELP feature is aconvenient way to discover the namesof objects and places in thePhysical Science Laboratory.
2 of 4
41 )
StronglyAgree
StronglyDisagree
1 2 3 4 5
1 2 3 4 5
1 2 3 4 5

11. Working through the Activity 1 2 3 4 5
Worksheets for Experiment 0 is agood way to familiarize yourselfwith the lab's features.
Additional comments on the hands-on introduction:
(Use additional space on back if necessary.)
Part III: Written Documentation
12. It is easy to find what you arelooking for in the Teacher's Manual.
13. The software's statement of purposeis clearly presented in theTeacher's Manual.
14. The software's intended audience isclearly presented.
15. The software's special features forthe learning impaired are clearlypresented.
16. The software'sthe student are
17. The software'sthe teacher are
intended goals forclearly presented.
intended goals forclearly presented.
18. The software's hardware and softwarerequirements are made clear.
19. The glossary of mouse terminology isclearly presented.
20. The glossary of Physical ScienceLaboratory terminology is clearlypresented.
3 of 4
StronglyAgree
StronglyDisagree
1 2 3 4 5
1 2 3 4 5
1 2 3 4 5
1 2 3 4 5
1 2 3 4 5
1 2 3 4 5
1 2 3 4 5
1 2 3 4 5
1 2 3 4 5

Additional comments on the hands-on introduction:

Teacher Evaluation of Experiment
Name: Date:
School:
Normal Teaching/Administrative Assignments:
(In the space above, please give us an idea of what your current duties are. Include subjects, gradelevels, or special assignments when appropriate.)
Special Education Certification:
(In the space above, please list any certification that you have earned for instructing special educationstudents)
Evablatell For Use With:(In the space above, please indicate how you intend to use the software. Possible entries might be:
group instruction in a computer lab; special education students receiving individual instruction; orresource .4om tool availablE on demand. Use back of this page to provide additional information)
Experiment Number: Title:
INSTRUCTIONS:
You are evaluating the experiment listed above. This includes thecomputer simulation program, and the associated ActivityWorksheets. Please be sure you have already completed thequestionnaire entitled Teacher Evaluation Of IntroductoryMaterials.
This evaluation consists of a series of statements about theinstructional materials. Please respond to all of the statementsthat your training and experience qualify you to answer. For eachstatement, circle your level of agreement or disagreement on ascale of 1 to 5. A "1" indicates strong agreement, whereas a "5"indicates strong disagreement. A "3" indicates that you areessentially neutral on that topic. A section for your writtencomments is provided at the end of each category of questions.Thank you for your help in evaluating these materials.
1 of 6

Category A: General
1. The Activity Worksheet SeriesIntroduction to this experimentclearly presents the educationalobjectives of this simulation.
2. The important features of thisexperiment are thoroughly explainedin the Activity Worksheet SeriesIntroduction.
3. The concepts presented in thiscomputer simulation are well-suitedfor learning with the help of acomputer.
4. Use of this computer simulation alongwith the Activity Worksheets willaccomplish the educational objectivesstated in the Activity WorksheetSeries Introduction.
5. This computer simulation provides aneeded learning tool for allstudents.
6. This computer simulation provides aneeded learning tool for the specialeducation student when used in aspecial education instructionalenvironment.
7. This computer simulation isparticularly well-suited to thelearning needs of the mainstreamedspecial education student.
8. This computer simulation provides avaluable teaching tool for teachersto use in an instructionalenvironment.
9. This computer simulation provides avaluable teaching tool for teachersto use in a special educationinstructional environment.
2 of 6
Strongly StronglyDisagreeAgree
1 2 3 4 5
1 2 3 4 5
1 2 3 4 5
1 2 3 4 5
1 2 3 4 5
1 2 3 4 5
1 2 3 4 5
1 2 3 4 5
1 2 3 4 5
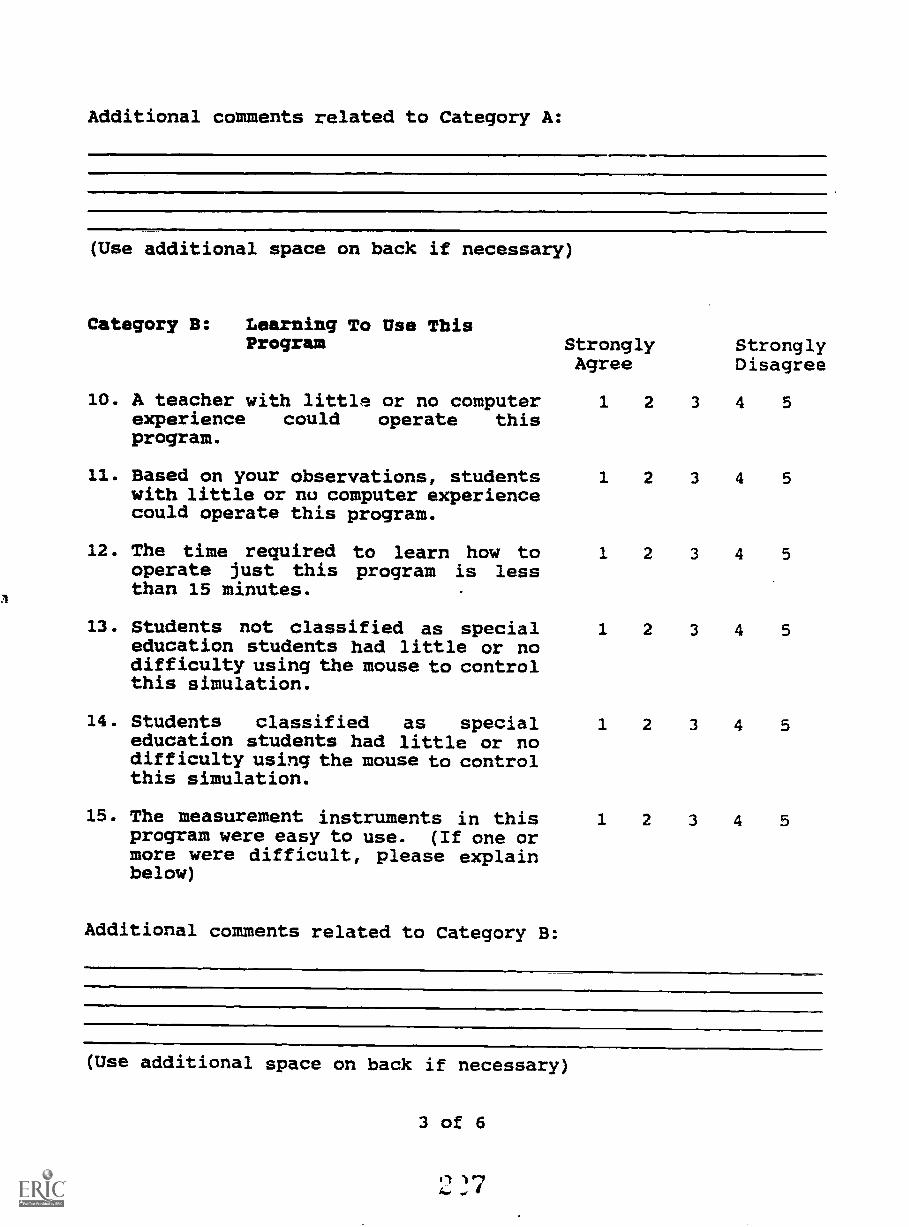
Additional comments related to Category A:
(Use additional space on back if necessary)
Category B: Learning To Use ThisProgram Strongly
AgreeStronglyDisagree
10. A teacher with little or no computerexperience could operate thisprogram.
1 2 3 4 5
11. Based on your observations, studentswith little or nu computer experiencecould operate this program.
1 2 3 4 5
12. The time required to learn how tooperate just this program is lessthan 15 minutes.
1 2 3 4 5
13. Students not classified as specialeducation students had little or nodifficulty using the mouse to controlthis simulation.
1 2 3 4 5
14. Students classified as specialeducation students had little or nodifficulty using the mouse to controlthis simulation.
1 2 3 4 5
15. The measurement instruments in this 1 2 3 4 5program were easy to use. (If one ormore were difficult, please explainbelow)
Additional comments related to Category B:
(Use additional space on back if necessary)
3 of 6

Category C: Graphics Strongly StronglyAgree Disagree
16. The simulation's graphics are 1 2 3 4 5appropriate for the intended studentaudience.
17. The simulation's graphics are 1 2 3 4 5appropriate'for the task at hand.
18. The simulation's graphics help focus 1 2 3 4 5
the student's attention on the taskat hand.
Additional comments related to Category C:
(Use additional space on back if necessary)
Category D: Feedback StronglyAgree
StronglyDisagree
19. Students can understand the numericmeasurements when they are displayedby the program in the value and unitsbars.
1 2 3 4 5
20. Students can understand the numericmeasurements when they are spoken bythe computer.
1 2 3 4 5
21. The capability to hide or displaynumeric measurements enhances theinstructional use of this program.
1 2 3 4 5
22. The capability to have the computer 1 2 3 4 5speak the numeric measurementsenhances the instructional use ofthis program.
4 of 6

23. Students can understand the HELPmessages when they are displayed bythe program in the HELP windows whileusing the HELP mode.
1 2 3 4 5
24. Students find the HELP messagesuseful.
1 2 3 4 5
25. Students can understand the HELPmessages when they are spoken by thecomputer.
1 2 3 4 5
26. The absence of value judgments (bythe program to the student) actually
1 2 3 4 5
enhances the instructionalenvironment created by this program.
Additional comments related to Category D:
(Use additional space on back if necessary)
Category E: Activity Worksheets StronglyAgree
StronglyDisagree
27. Students have little difficultyunderstanding the writteninstructions on the Activity
1 2 3 4 5
Worksheets.
28. Students are able to complete the 1 2 3 4 5Activity Worksheets with little or nohelp from the teacher.
29. The time required to complete any oneof the Activity Worksheets does notexceed the student's attention span.
1 2 3 4 5
30. The Activity Worksheet problems arewell correlated with the statedobjectives for this simulation.
1 2 3 4 5
31. There is a need for more of this typeof software, which allows the teacher
1 2 3 4 5
to design the problems for thestudent to solve.
5 of 6

Additional comments related to Category E:
(Use additional space on back if necessary)
Category F: Instruction StronglyAgree
StronglyDisagree
32. Students are interested in the topicaddressed by this simulation.
1 2 3 4 5
33. Students would like to solve otherproblems in physical science usingsimulation.
1 2 3 4 5
34. The computer simulation along withthe problems posed by the Activity
1 2 3 4 5
Worksheets provide an excellentlearning environment for students.
Additional comments related to Category F:
(Use additional space on back if necessary)
6 of 6

Checklist For Student Evaluation Of Experiments
Student Name :
School: Grade:
INSTRUCTIONS FOR THZ TEACHER:
Please put a check mark on the appropriate line when the studentcompletes each of the items listed below. When the student hascompleted ALL of tne worksheets for a given Experiment, please havethe student do the student evaluation of that experiment.
Video Introduction
Using A MouseTouring The Lab
Experiment 0: The Physical Science Laboratory
Worksheet 0-1: Touring The Physical Science LabWorksheet 0-2: Using The InstrumentsWorksheet 0-3: Using Other InstrumentsStudent Evaluation Of Experiment 0:
Experiment l: Finding Elapsed Time
Worksheet 1-1: Using The Elapsed Time ClockWorksheet 1-2: Making Time Go Faster Or SlowerWorksheet 1-3: Time SenseStudent Evaluation Of Experiment 1:
Experiment 2: Finding Length And Width
Worksheet 2-1: Using The RulerWorksheet 2-2: More Ruler MeasurementsStudent Evaluation Of Experiment 2:
Experiment 3: Finding Area
Worksheet 3-1: Area Of A RectangleWorksheet 3-2: Area Of A CircleWorksheet 3-3: Area Of A TriangleStudent Evaluation Of Experiment 3:
1 of 2
:2.11
..,.

Experiment 4: Finding Distance Using A Map
Worksheet 4-1: Measuring Map DistanceWorksheet 4-2: Measurement IssuesWorksheet 4-3: Ruler With 1/10 Inch Scale DivisionsWorksheet 4-4: Measuring Distances On Paper MapsStudent EValuation Of Experiment 4:
Experiment 5: Finding Seasonal Temperaturei
Worksheet 5-1: Measuring Air And Water TemperaturesWorksheet 5-2: Temperature ExtremesWorksheet 5-3: Changing TemperaturesWorksheet 5-4: Temperature ScalesWorksheet 5-5: Reading A Circular ThermometerStudent Evaluation Of Experiment 5:
Experiment 6: aefrigerator
Worksheet 6-1: Tnside Your RefrigeratorWorksheet 6-2: Temperatures Inside A RefrigeratorWorksheet 6-3: Controlling Refrigerator TemperatureWorksheet 6-4: Knowing Your Refrigerator ThermostatWorksheet 6-5: What If The Power Goes OffWorksheet 6-6: Reading A ThermometerWorksheet 6-7: In Your Own RefrigeratorStudent EValuation Of Experiment 6:
Experiment 7: Pendulum
Worksheet 7-1: Working With The PendulumWorksheet 7-2: Observing Pendulum MotionWorksheet 7-3: The Effects Of MassStudent Evaluation Of Experiment 7:

Student Evaluation of Experiment
Name:
School:
Teacher:
Class:
Date:
Grade:,I
(In the space above wilte the name of the class in which you are using this Experiment. For example:
"General Science", 'Physical Science", or "Ms. Worthy's class")
Experiment Number: Title:
INSTRUCTIONS:
We would like you to tell us a few things about the experimentwhomio number and title you wrote in the space above. Before youdo, however, please complete one or more of the Activity Worksheetsthat go with this experiment.
Please read each sentence listed below. If you agree with thesentence, circle Yes, if you do not agree, circle No. If youcannot answer Yes or No, don't circle either one and go on to thenext sentence. Thanks for taking the time to fill out this form.
1. I watched the video "Using A Mouse." Yes No
2. I watched the video "Touring The Lab." Yes No
3 One of my teachers explained to me how torun this experiment before I began doing itmyself.
Yes No
4. This was the first time I used a mouse tomove things around on the computer screen.
Yes No
5. I liked the way the objects were drawn onthe computer screen.
Yes No
6. Using the ruler instrument was easy. Yes No
7. Using the thermometer instrument was easy. Yes No
8. Using the scale (beam balance) was easy. Yes No
9. Using the car was easy. Yes No
1 of 2