ED 10631 - ERICED 10631 AUTHOR TITLE DOCUNENT RESUIRE SE 023 468-Babco, Eleanor L. Salaries.,of...
131
ED 10631 AUTHOR TITLE DOCUNENT RESUIRE SE 023 468 - Babco, Eleanor L. Salaries.,of Scientists, Engineers and Technicians: A J . Summary of Salary-SUrveys. Eighth Edition. INSTITUTION- Scientific Manpower Commission, Washington, D.C. `-: PUB DATE Oct 77 . NOTE .. 155p.; For earlier edition; see ED 139 626; Not 'available in hard copy due \\to copyright restrictions' , ,AVAILABLE FROM, Scientific ' Manpower Commission, 1776 Massachusetts Ave., N.W., Washington, D.C.., 20036 ($15.00) e EDRS PRICE - MF-$0.83 Plus Postage. H Not Available from EDRS. 'DESCRIPTORS° C011eg(N Teachers; *Efiginetrs; Paraprofessional . , . Personnel; *Salaries; Science Education; *Scientific 1-/ Manpower; *Scientists; Sex Discrimination; Surveys; *Tables (Data) ) ABSTRACT This report brings together data on salaries of scientists, engineerS, and technicians. The salary surveys were conducted by agencies and departments'of the federal government, professional scientific and engineering societies, educational associations, magazine Tublishers, and other professional. organizations..M6st of the surveys were originally published in 1975-77. Data are repqrted in 138 tables organized under the following headings: starting salaries, salaries of experienced scientific and technical personnel, salaries of engineers, salaries ' of engineering technicians and tedhnologists, federal salaries, and. academic salaries. Statistical variables inOlude occupation, degree level, sex, years of experience; geographic region, type of employer, and aqe. The base and -time period of each table is noted, and a_brief analysis of each group.of tables is presented. No attempt has been made to evaluate the ,reliability of the samples. (BB) or. ti *******************************************************t************** Documents acquired by ERIC include many informal ,unpublished ' * * materials not available from other sources. ERIC makes every effort * * to obtain the best copy available. Nevertheless, items, of marginal * * remoducibility are often encountered and this affects the quality *. * Of the microfiche apd hardcopy reproductions ERIC makes' available * * via the ERIC Document Reproduction Service (EDRS).,BDRS is not * responsible for the quality of the original & ument. Reproductions * * supplied by EDRS are the best that can be mad from the original. ******************************************** *44**********#********** v- a
Transcript of ED 10631 - ERICED 10631 AUTHOR TITLE DOCUNENT RESUIRE SE 023 468-Babco, Eleanor L. Salaries.,of...

ED 10631
AUTHORTITLE
DOCUNENT RESUIRE
SE 023 468-
Babco, Eleanor L.Salaries.,of Scientists, Engineers and Technicians: A
J .Summary of Salary-SUrveys. Eighth Edition.
INSTITUTION- Scientific Manpower Commission, Washington, D.C. `-:
PUB DATE Oct 77 .
NOTE..
155p.; For earlier edition; see ED 139 626; Not'available in hard copy due \\to copyrightrestrictions' ,
,AVAILABLE FROM, Scientific ' Manpower Commission, 1776 MassachusettsAve., N.W., Washington, D.C.., 20036 ($15.00)e
EDRS PRICE - MF-$0.83 Plus Postage. H Not Available from EDRS.'DESCRIPTORS° C011eg(N Teachers; *Efiginetrs; Paraprofessional
. ,
. Personnel; *Salaries; Science Education; *Scientific
1-/Manpower; *Scientists; Sex Discrimination; Surveys;*Tables (Data))
ABSTRACTThis report brings together data on salaries of
scientists, engineerS, and technicians. The salary surveys wereconducted by agencies and departments'of the federal government,professional scientific and engineering societies, educationalassociations, magazine Tublishers, and other professional.organizations..M6st of the surveys were originally published in1975-77. Data are repqrted in 138 tables organized under thefollowing headings: starting salaries, salaries of experiencedscientific and technical personnel, salaries of engineers, salaries '
of engineering technicians and tedhnologists, federal salaries, and.academic salaries. Statistical variables inOlude occupation, degreelevel, sex, years of experience; geographic region, type of employer,and aqe. The base and -time period of each table is noted, and a_briefanalysis of each group.of tables is presented. No attempt has beenmade to evaluate the ,reliability of the samples. (BB)
or. ti
*******************************************************t**************Documents acquired by ERIC include many informal ,unpublished ' *
* materials not available from other sources. ERIC makes every effort ** to obtain the best copy available. Nevertheless, items, of marginal *
* remoducibility are often encountered and this affects the quality *.
* Of the microfiche apd hardcopy reproductions ERIC makes' available *
* via the ERIC Document Reproduction Service (EDRS).,BDRS is not* responsible for the quality of the original & ument. Reproductions ** supplied by EDRS are the best that can be mad from the original.******************************************** *44**********#**********
v-
a

SALARIES'OF
SCIJEINTISTS ENGINEERS..AND T CHNICIANS
T.
A U S DEPARTMENT OF HEALTHEDUCATION S. WELFARENATIONAL INSTITUTE OF
EDUCATION
Th S 00(l)Mt NI HAS BF f Pr, ft( PAOOUCEO EXACft. AS 64t FrvFO IAOMTHE PERSON OR OPt.AN ZA, SON 044,1.1ATING iT POINTS s.r,Fr4 OktSTATED 00 NOT NE( F 55AA t v fr1f PPiSENT OF F r(i At NA11(SP.A1 Nr` r F it IIE OW( ATOly POST F 10410H PO. rAr
A Summary Of Salary SurveVe :
$
AA
4
Prepared by
1
611( HOF I( 11f ON( V
I El eanor a.1060.4 _
r I
SCIENTIFIC K/Ii\NPOWER COMMISSION1776 Massachusetts Avenue, NW, Washington, D.C. 20036
October 1977

f.
.. ..
t . ,N
l.. ,,,,..,., ... ,
, . The Scientific Manpower Commissidn, A Participating Organization, ofthe American Association for the Advancement of Science, is'a nonprofit I,
corporation Whose Commissioffers represent its sponsoring scientific societies.
.The Commission is charged with the Cbllection,analysis 'and dissemination
\\P
of reliable information pertaining to the manpower resources of the Unit d Statesin the fields of science and tedlnology, promotiop of the, best possible programs of .
education and training to poteptial scien ists-and,technicians; and'dev lopmentof policies of utilization of scientific and technologica manpower by/educationalnstitutiont., industry and government for optilipm benefit to the nation.
/
MEMBER SOCIETIES
American Anthropological Association \,
American Association for the Advancement of Science
American Astronomical Society
;American Chemical Society. .
American Institute'of Biological Sciences.
American Institute of Chemists
American Institute of Physics'
-. American Psychological Association
American Statistical Association
Cbnference Board of the Mathematical Sciences
Federation of American Societies for. Experimental Biology
0 A>s
Betty M. Vetter - Executive Director
Eleanor.L. Babco -- Administrative Assistant
Judith E. McIntire'- Research Assistant
dig
Cheryl R. Jones - Secretary/Dir. of Publication Sale
PRICE: ..$1.00
I
L Eighth Edition - Oco ber 1977
3

INTRODUCTION ,
TABLE OF CONTENTS
PAGE
STARTNIG SALARIES . . . . . .' .
" 14,TABLE-, 1 -. Number and Average Starting Monthly 50try Offers
to Bachelor's DegreeCandidates by,Curriculum, 197,6-77 and 19.75-76 ,. .i.i:
. 4,
. .
TABLE 2 - Average Starting Monthly Salary Offert to bachelor's Degree, Candidates by Cur'Ticulymand Sex, 197.6 -77 and 1975-76
.
5TABLE 3 - National Average Monthly Salary Offers to Bachelor's. Degree Candidates by FunctiOnal
area and Sex, 1976-77 and 1975-76';.
. ... , 6,
....
.\ TABLE 4 - Number and Average Monthly Salary Offers to Bachelor's Degree Candidates in Non-.....
.
Technical Curricula by Type of Employer and Sex, 1976-77 .I
7TABLE 5- Umber and Average Monthly Salary Offers tb,Bachelor's Degree Candidat in Technical
Curricula by Type of Employer and Sex, 1976-77 . .' . 7TABLE 6 - )lumber and Average Monthly Starting Salary Offers to Master's Degree Candidates by
Curriculum, 1976-77 and 1975-76 . . . . . . 8TABLE 7 - Number and Average MonthlyStartingSaldy
Offers to Doctoral Degree Candidates byCurriculum, 1976-77 and 1975-76 . .
. . . 9TABLE 8 - Number and 19/6 Median Monthly Salary of Graduates Employed Five Years 'Ago (Class `of
1971) and Employed Ten Years Ago (Class of 1966) .- . . . . . 9TABLE g - Number and Average'Stai:ting Monthly Salaries for New,traduates by Field and Degree,1976 and 1974
. . . . . . 10.
,CHART 1 - Overall Median Annual Starting Salaries for Chemists by Degree Level, 19,66-1976. .10
CHART 2 - Median Annual Starting Salaries for Chemists in Industry,by Degree Level, 1966-1976 10CHART 3 - Median Annual Starting Salaries for Chemists in Colleges & Universities by Degree .Level, 1966-1976 . /
. -10.TABLE 10 / Number and Median-Annual Starting Salaries of Chemistsend Chemical Engineers by
.. . 1111 - Median Monthly Starting Salaries for Men and Women Chemists, Bachelor's Level, 1`961-1976 .
. 11 .
.
TABLE
-TABLE
TABLE
TABLE
TABLE
TABLE
TABLE
TABLE
'Highest Degree Earned and Sex, 1976
12 - Number, MediaY, and Mean Annual Starting Salaries of Graduate Chemists by Chemical.
a.Specialty, 1976. ,.
13 - Number and Median Starting Saler s of Chemists by Degree, Type of Employer and Sex, ,1976 . ,.. 12
14 - Number ana Median Starting Sal\a-Hes of Chemists and Chemical ErNneers by Degree'revel and Region, 1976 . . . . . . '. 13
,15 - Nieber and Median Starting Salaries of Chemists and Chemical Engineers UY.Degree, -1:04e1 and Type of Employer, 1976
. . . .
) .
13'
16 - Number and Median Starting Salaries of Chemical Engineers by Degree, Type of Employer ,'and Sex, 1976_
,' . 14..
17 - Number and Median Annual Starting Salaries of Minority Cftemists and Chemital E..ngineers'14
. .
by Highest*Degree Earned, 1976 .
%f
18 - Distribution and Median Monthly Starting Salaries of Physics Bachelor's Degree, 'Recipients by Type of Employer and Sex, 1975-76 .
Median Monthly Starting Salaries of Graduate Physicists, 1975 and 19,76 . . :, ..k 1165
- .
Median Beginning Salaries in Mathematics
,
ethematics forvPH.D.'S by Type of Employer.and Sex,1975 and 1976 - . . . : .- '., . / 16
Median Beginning Salaries in Mathematics for PH.D.'s by Type of,Emlfoyer,(1972-1976 16'
.
Number and Mean Monthly Starting Salaries of Nonsupervisorit,EmplOyees Engaged. in '''R & D Activities by Field of Degree andDegree Level,1976 . . . . . 17
TABLE 19 -
TABLE 20 -
TABLE 21 -
TABLE 22
4 .

z_ .
PAGE\.
TABLE 23 - Number and Mean Starting Salaries of Nonsupervisory Engineering,Bachelor's,Degree\
EmplOyees engaged in R & D Activities by Working -As- Occupation 1976 . ' . . 17 ,
TABLE 24 - Starting Salaries of Scientists by Field, Type ofiEmployei.;add :ghestDegree
.
' Attained, 1974 .J. ..-.. . 18.
. .i.,
TABLE 25 - Number and Mean Monthly Starting Salaries of Bachelor's Degree Technology Graduate
by Curriculum, 1976 . .. 19
TABLE 26 - Number and Mean Monthly Starting Salarles of Associate Degree TeChnolo6y Graddates
by Curriculum, 197§ . . . ... 1 ,, . ,1,9
TABLE 27 -,S;Arting Salary Offers to Graduates of Two-Year Colleges by Curriculum11975-1976 . 20
TABLE 28, - Starting Salary Offers to Graduates of Two-Year Colleges by Type of imployer6 1975-76 21
TABLE 29 - Number and Mean-Monthly Starting laries for 1976 Graduates in Fodd Science and .
Technology by. Degree Level and E oymerit Area .22
'SALARIES OF EXPERIENCEIISCIENTIFIC ANDJECHNJCA PERSONNEL . . . . 23
TABLE '30 r Median Annual Salaries of Scientists and Engineers ly Field d Sex, 1974 . . 27
. TABLE 31 - Median mnual Salaries of Scientists and Engineers by Field ,nd Degree Level, 1974 . 28
TABLE 32 r Median Annual Salaries of Scientits and Engineers by Field and Type of Employer,
1974 .. .29
TABLE 33 - Median Annual Salaries of Scientists and Engineers byField and Primary Work
Activity, 1974 . . .. 36
TABLE 34 - Number and Median Annual Salary of Doctoral Scientists and Engineers by Sex and Age
in 1975 . % .. 31
TABLE 35 - Median Annual Salaries of Doctoral Scientists and Engineers by Field and Type of
Employer, 1975, . . - . . ---- . . . 32
TABLE 36 - Number and Salaries of Doctoral Scientists and Engineers Employed in Educational
Institutions by Field: 1973 and,1975 . . 33. , .
TABLE 37 - Numbers and Salaries of Doctoral Scientists and Engineers Employed in'Business and
Industry by Field: 1973 nd 1975 .- .. 34
TABLE 38 - Numbers and Salaries of Doctoral Scientists and Engineers EmplOYetriii the Federal
Government by Field: 1973 and 1975 . s. 35
t---
TABLE 39 - Median Annual Salaries of Doctoral Sclentists end Engineers by Field and Primary Work
Activity, 1975 . ° , . . . . 36.t
/ ,TABLE 40 = M1'ian Annual Salaries of Doctoral Scientists and JEngineers by Field and Geographice
Area, 1975 . % 37.*
TABLE 41 - Median Annual Salaries of Doctoral Scientists and Engineers by Field and Years of
Professional Experience, 1975 . 38
TABLE 42 - Median Annual Salaries of Doctoral Scien tists and,Engineers by Field and Age, 1975 . 39
TABLE 43 - Median Annual Salaries of Doctoral Scientists and Engineers by Field, Sex, and Race,
1975 .. 40
TABLE 44 - Number and.Mean Monthly Sala ries of Bachelor's Degree Nonsupervisory Scientists andEngineers by Working-As-OccUpation and Selected Years Since Degree', 1976 . - . 41
, '
TABLE 45 - Number and Mean Monthly Salaries of Master's Degree Nonsupervisory Scientists and
, Engineers by Working -As- Occupation and Selected Years Since Degree, 1976 . . 42 .
TABLE 46 - Number. and Mean Monthly Salaries of Doctorate Degree Nonsupervisory Scientists Ind
Engineers by Working-As-Occupation and Selected Years Since Degrfte, 1976 . . 43( 4
.
TABLE 47 - Number and Mean Monthly Salaries of Nionsupervisory Scientists and Engineers by D gree
,Level, Type of Establishment and Selected Years After First Degree, 1976 . 441
VI
TABLE 48 - Number and Mean MOnthly Salaries of Nonsupervisory Scientists and Engineers b Highest
Degree Field and Selected Years SinCe Degree, 1976 . . . 45
TABLE 49 - Number and Mean Monthly Salaries o Bachelor's Degree Nonsupervi ory Scientists andEngineers by Working-As:Occupation, Sex, and Selected Years Since Degree, 1976 : 46
CHART 4 Salailes of Scientists. and Engineers Employed in Research and Dev lopment byProfession, 1975 -1977 f > ' 47
f

A
PAGECHART 5 - Salaries of Scientists and Engineers Employed in Research and Development by Years of
EmployMent, 1975-1977 .
47CHART 6 - Salaries of A1.1 Scientists and Engineers Employed in Research and Development,
1975-1977 . . . . . . . . . . ' 48. . . . .
CHART 7 - 'Salaries of Scientists and'Engineers Employed in Research and Development by DegreeLevel, 1975-1977
. -48TABLE 50 - Number and Average Sa.laries4or Selected Professional, Admipistrative,echnical and
Clerical Occupations in Private Industry, March 1977 .. 49
TABLE 51 - Number and Average Salaries-forSelected Professional, Administrative, Technical and
Clerical Occupations in Wvate Industry, March 1976 . 50i TABLE 52 - Median Annual Salaries for Chemists and Chefilical 6gineers of All Experience Levels by
qgree, 1973977 (Weighted Average). 51
TABLE 53 '- Median Annual)Salaries of Chemistsby Type of Employer, Degree Level and Sex, 1977 . 52,
T BLE 53 - Median Annual Salaries...of Chemists
T BLE 55 - Median Annual Salaries of Chemists
TABLE 56 - tledian piripal Salaries of Chemists
TABLE 57 - Median Annual Salaries of Chemists-----,
TABLE 58 - Median Salaries and Perc ntage Dis
by Work Activity, Degree Level:and Sex, 1977. 52
by Type of Employer, ,gree Level and Sex, 1976 . 53
by Work Activity, Deg ee Level and Sex, 1976. 53
by Degree, Specialty, and Sex 1977 . . 54
tribution of Chemists by Geographical Region andDegree Level, 1977 .
. 54
TABLE 59 - Median Annual Salaries, of he sts by Degree, Specialty, and Sex, 1976 . . 55'TABLE 50 Median Salaries and Percent ge istribution of Chemists by Geographical Region and
..
Degree Level, 1976 . . 55
TABLE 61 - 1977 Median Sararfes of Industria.1 Chemists and AllChemists,by Degree Level andA years of Experience.
. . , .. 56
TABLE 62 - Median Salaries of Chemists by Degree Level, Sex' and Years of Experience, 1977. 56
TABLE 63 - 1976 Median Salary of Industrial Chemists and All Chemists by DegreeLevel:and Yearsdf Experience . / .
. 57
TABLE 64 - Median Sa.laries of Chemists by Degree Level, Sex and Years of Experience, 1976. 57
TABLE 65 - 077 Median Salary and 1976-Income of Chemists by Degree Level and Years ofxperience ,
. 4 .. 58
TABLE 66 - 1977 Median Salary and 1976 Incbme oflhemical Engineers by Degree Level and Years of. .
. 58TABLE 67 - 1976 Mean Salary and 1975 Income ofChemists by Degree Level and Years of Experience 59TABLE 68 -.1976 Mean Salary and J975 Income of Chemical Engineers by Degree Level and Years of
Experience .
59.,
TABLE 69 - Numb4444,Salary of AIB1 Biologists by Type of Employer and Age; 1975. 60 .
TABLE 70 1 Mean Annual Salary of AIBS BiolOgists by Age, Sex and Degree Level, 1976 . . 60
TABLEJF - Average Nationaj'Weekly Salaries in Data Processing by Job Description; 1976.and 1977 61
TABLE 72 - Average Weekly Salaries of Data Processing Personnel by Job Description and Geographic
Experience .
Area, 1977 . ., 62
TABLE 73 7'Average Annual Salaries for Selected Positions in State and Territorial Public Health,
. . . . 63. ,.
TABLE 74 - Average Annual Salaries of Selected Positions in State and Territorial Public HealthA0i - ,,e-eboratories, 1972 and 1975 .
,.
. . . . 64SALARIES OF ENGINEERS
,. . , .. . 65
Laboratories by State, 1975
TABLE 75 - Number andMedian Annual Salaries of Engineers by Type of *Industry and Selected Years
68Sinte Baccalaureate, 1976 .
TABLE 75.- Number and Median Annual Salaries of Engineers by Type of Employment Group andSelected YpaYs Since Baccalaureate, 1976 . . . .
TABLE 77 - Median and Meg41'Salaries Of Engineers by Type of Employment Group, 1976
, 0
,F4
69
70

PAGE
TABCC78 - Median and Mean Salaries of Engineers in, Industry and Government by Geographical
Region, 1976 . . ..--'. . . , . - . - . 70
TABLE 79 - Number and Median Annual Salaries of Engineers by Highest Degree Held'and Selected
Years 'Nnce Baccalaureate,, 1976 (Weighted National Average) . . . 71'.
TABLE 80 - Number and Median Annual Salarfes..of Engineers by Geographic.Area and Sdle5ted Years
ince Baccalaureate, 1976 1 -. 71
CHART 8 - Vends in Median Salaries of Engineers, 1953-1976 . . .
.
. ., . 72
TABLE 81 - Median Income of Professional Engineers 'by Employment Status and Year of Entry Into
Profession, 1975 .I
72
4 0, TABLE 82 - Median. Income of Professional Engineers According.to Field of Employment and Year,of
Entry Into Profession, 1975 . . . , . . . . .... , 73
TABLE 83 - Median Income of Professional Engineers According to Type of Work and Year of Entry
Into Profession, 1975 . . . . ' . . . 73
TABLE 84 - Median Income of Professional Engineers by Field of Employment and Yep-s of t.
.
Expeilence, 1975 . 74'
TABLE 85 - MediaA Income of Professional.Engineers by Branch of Engineering, 1971-1975 . . 74
TABLE 86 - Median Income of Professional Engineer's by Level/ of Education, 1971-1975 . . 74
TABLE 87 - Median Income of grofessiOnal Engineers by Branch of Engineering and Year of ,Entry
Into Profession, 1975 ,. . . . . . , . ) . 75
TABLE 88 - Median Income of Professional Engineers by Region, 1971-1975 . . ' . 75
TABLE 89 - Median IncOirie of Professional Engineers by Field of Employment,1971 -1975 . 75
TABLE 90 - Median Income -of Professional Engineers by Type of Work Performed, 1971-1975 . . 76
TABLE 91 - Median Income of Professional Engineers by Level of Education and Year of Entry Into -Q'
Wofession, 1975 , .,
4 ,. , , ,- . 76
TABLE 92 - Median Entrance and Maximum Salaries for All Grades of Civil\tngftyiel.s by Class of
Employment and Geographical Region, 1975 . 77
TABLE 93 - Annual Salaries of Civil Engineers by Equivalent ASCE Grade-Level, )973 andNk975 % 78
. ...
TABLE 94 - Average Total Compensation of Civil Engineers Including Fringe Benefits by ASCEGrades, Equivalent Federal Grades and Class of Employment, 1975 . . ... . 78
TABLE 95 - Average of Median Entrance Rates for All Grades of Civil Engineers by Class of Employ-
ment, 1973 and 1975 . . .. . 79!,
TABLE 9'6 -, Number and Total Annual 'Income of Manufacturing Engineers by Type of Employer, 1976 79 .
TABLE 97 - Number and Total Annual 'Income of Manufacturing Engineers by Education Level, 1976 . 80
TABLE 98 - Number and Total Annual Income of Manufacturing Engineers by Years of Experience,
1976 ' '. . . . . . . . . . . . - . 80.
TABLE 99 - Number and Total Annual Iticome of Manufacturing Engineers by Geographic Area, 1976 80
TABLE 100 Number and Total Annual Compensation of Manufacturing Engineers by Type of Job
Function, 1976 . , . . . . . 81
. TABLE 101 Number and TotalApnugi;Come of Industrial Engineers by Degree Level, A977 : ;. 82
TABLE 102 Number and'Total Annual Income of,Industrial.Engineers by Years of Experience, 1977 82
TABLE 103 Number and Total Annual Income oenndustrial Eigineers by Geographic Area, 1977 82
TABLE 104 Number and Total Annual-Income of Indstrial Engineers by Type of Employer, 1977 ! '83
, . ',
SALARIES OF ENGINEERING TECHNICIANS AND TECHNOLOGISTS , . 84
TABLE
.
105 Number-, Median and Mean Annual. ,Salanies of Engineering Technicians by Years Since-..
Graduation, f977 . .. .85 c
CHART 9 - Annual Salary of All Engineering Technicians by Years Since Graduation, 1977 85
TABLE 106 Number' and Mediah Salaries of Engineering Technicitns by Type 'of Employment'and
Selected Years Since Graduation, 1975 . . 86
. STABLE 107 Number.and Median Salaries of Engineering Technitians in Industry by Geographic Arel
and Selected Years Since Graduation, 1975 . 87
iv

TABLE 108 Number and Median Salaries of Engineering Technicians by Type, of Employment and2'1 Selected tears Since Graduation, 1975. . . .- . . .4TABLE 109 ,Number and Medan Salaries of Engineering Technologists by Type of Employment and
Selected Years Since Graduation, 1975. . . . . . .
FEDERAL SALARIES
TABLE 110 Annual Salaries of Federal Workers u er the General Schedule. by Grade and Step1,evels, October 1, 1977 . .
TABLE 111 Annual Salaries of Federal Worked,u er the General Schedule qy Grade and StepLevels, October.1976 . .
PAGE
. 87
88
. 89
90
TABLE 11? Number, Median Grade. and Average Salary of-Federal White Collac,Workers Sex, and',Occupational Series,. All 'Areas, October, 1976 . ' .. 92
TABLE 113 .Comparison of Federaland Private Average Salaries .in Selected Jobs, 197 and 1976 . 96
TABLE 114 Comparisornof Average Annual Salaries in'Private Industry with Salary Rates for. Federal EmplOyees under the General Schedule, March 1976 . : .e . 97
ACApEMIC SALARIES .
'. 98 °`TABLE 115 Weighted Average Salaries of Faculty by Academic Rank, Institutional Category, Typeof Affiliation' and Sex, 1976- 77
. , .
, , i ,
. 101TABLE 116 Weighted Average Faculty Compensation by Academic Rank, Institutional Category, - ,Type of Affiliation and Sex, 1976-77 (Standard Academic Year Basis)
. 102 ,STABLE 117 Weighted Average Faculty Salaries by)tgion, Category, and Academic Rank, 1976-77
. 103TABLE 11'8 Number, Average Salary, Fringe Benefits and Compensation of Full-Time Faculty Members''in Institutions of Higher Education by Rank,t1976-77
. . . . . / . 104TABLE 119 Weighted Average Faculty Salaries and Compensation in Preclinidal pepartments of
Medical Sdhools by Type of Affiliation and Academic Rank, 197,6-77.
. 104TABLE 120 Number, Average Salary, Fringe Benefits and Compensation of Full Time Faculty.Memdersin Preclinical Departments of Medical Schools by Academic Rank, 1976-77 .
. 104-TABLE 121 Mean Faculty Salaries by Type of Institution, Rank and Sex, 1976-77
. . . 105TABLE 122 Mean Salaries of Full-Time
Instructional-Faculty in Higher Education by Academic Rank,Length of Contract and Sex1974-75 evol 1975-76 .. 106
TABLE 123 Mean Compensation of Full-Time Insquctional Faculty in Higher Education by Institutional Control, Length of Contract and Academic1ank, 1972-73 and 1975-76 . , 107
''', TABLE 424 Mean Salaries of Full-Time Instructional .FacultS, (All Ranks Combined on 9-10 MonthContractt) in Institutions of Higher Education by Sex of Faculty Members and State,1975-76 . . . . .
. . . . 108TABLE 125 Median Annual Salaries of Doctoral Scientists and Engineers Who Are University or
4-Year4olleget=Teacher-s by FieTd,Salalry Base and Academic Rank, 1975 . . . 109TABLE 126 Number and Median Salary 11Sn6-etMr Doctoral Degree Mathematics Teachers by Rank andType;Of Institution, 1975-76, eld 1976-77 .
.. 1111
TABLE 127 Number And Median Salary Ranges for Non-Doctoral Degree Mathematics Teachers by Rankand l'Oe of Institution, 1975-76 and 1976-77 e .
'.' . . 112
.TABLE 128 Number and Average Calendar Year Salaries of Fadulty in Colleges of Pharmacy by Yearsin Rank and Academic Rank, 1976-77 , \ . . . . . . . 113
TABLE 129 Average Calendar Year Salaries of Faculty in Colleges of Pharmacy by Discipline andAcademic Rank, 1976 -77 . . . . . . . . . . .' 1`13-
--
. )
TABLE 130 Number and MediartSalaries of Engineefing Faculty by Rank, Type of Institution and' Months on Contract, 1976
.. .
. . 114TABLE 131 Number and Median Annual Salaries of Faculty in all Engineering Schools by Nine -Month -71\Contract, Rank a elected Years Since Baccalaureate, 1976 . , . . 114TABLE 132 Number and,Median Ann al Salaries of Faculty in all Engineering Schools by 12-Month
Contract, Rank and Selected Years Since Baccalaureate, 1976 . . .$ . 115
TABLE 133 Number and Mean Salaries of Administrative Officers in Higher Education Institutions_Ay POsitign, 1976-77.
. 1T5
'it

41,
I \-/ 1 PAGE
TABLE 134 Ntimber and Salaries.Paid to 6ministrative Officers in Higher Education Institu,
'tions, 1975-76 . . . . . . .
). . 116
..
TABLE 135 Average of Median Salaries Paid Administrators .at Public and Private Institutions
by Sex and Minbri.try Status, 1975-76 (White Coeducational Institutions) . 117
TOLE 136 Number and Median Salary.of Administrators in All Private White Coeducational-4Higher
Education Lnstitutions by Position, .Sex and Minority Status, 1975-76.. . 118
TABLE 137 'Number. and Median Salary of Adminis ators in All Public White Coeducational Higher
. ,Educational ,Instittttions by Positio .Sex and Minority Status, 1975-76 . . )19
TABLE 138 EstimatedAverage Annual Salary of To aq Instructional Staff in'Full-Time Public
, Elementary and SecOndary Day Schools by State,.1974-75- . .120
.
$ ..INTRODUCTION
J.
..
. .
,
Sdiary Surveys are conducted by a number of brganizations - agencies and departments,
of the federal government, professional scientific and engineering societies, educational asso-
ciations; magazine publishers, and other professional organizations. Some surveys deal directly
with salaries of scientists and engineers while others are concerned With much broader occupa-
tional area. When broader occupational groups are i luded in the surveys, selected categories
are used in this report for comparative purpoSes., '
.
Although most of the.statistital info mation,in this report istavailable from its
1 original source, this compilation brings together summary information'on salaries in the special'
areasof science and engineering, both for purposes of comparison and for readier accessibility.
In general; exact correlation of results of different surveys is not possible without
access to the original data first because the bases used in various surveys for presenting sta-
tistical resultsinclude medians, means and percentiles; and second because the time periods
include calendar year, fiscal year, academic year and quarterly segments, starting at various
points in the year. The base and time period for-each table is noted with the table and/or in the
introductory statement for the section in/Which it appears.
Where parisons of similar data are possible; some apparent discrepancies appear.
No-attempt has be n made to evaluate,the relative reliability of the samples, but the number of
people in the sample is given when it is available. In many cases, the number of respondents
listgd within the able will not match totals for all fields or all groups, because some areas
not applicable to science and engineering havR been omi,tted, or because only selected years since
first degree or selected age groups have been included.
The source is given at the beginning ofi each to e. Full bibliographic entries for all
sources of information begin do page 121.
I
/ la
4
This report was prepared by Eleanor Babcd, Administr'ative Assistant of the Scientific
Manpower Commission. Special thanks are extended to Judith McIntire'and Cheryl Jones for their
invaluable assistance.
vi 9
r

Thce. CoZteg P.e.a.cemevit CounciZ' A'STUDV OF 1976-77 BEGIPNING OIFFERS; FINALREPORT provides beginning salary data based an job offers (not acceptances) made to.college students in selected curricula and graduate programs during the normal recruitingperiod, September to June. Data are submitted on an ongoing basis by 160 colleges, Nid'uniVersities throughout the United States. The survey, covering job openings in a broad,range of functional areas, withth employing organizations in business, industry,government and nonprofit and educational' institutions, is issued three times each year - vin,January, March .and July. Teaching offers are not'included.
.
STARTING:SALARIES
In the final report of the 1975-77'recruitin9-year, CPC reports that employersmade 41% more job offers than 'the preceeding year at the bachelor's level,,43% more atthe mast ;s level and 33% more at the doctpral leyel. The greatest increases in job
. offers were for graduate's engineering,and the sciences.
Offers to bachelor's in petroleum engineering averaged $1,512 per month -higher even than the top avera.ge for master's degree candidates, followed by chemicalengineering at $1,389. The greatest pe'rcentage gain wasregistered by industrialengineering; which rose le to $1,2.57. Most"of the sciences experienced dollar increasesof seven percent to just under nine percent, with biological sciences having the top gain(8.9%).to $882, while'computer science attracted the hilhest average, $1,12.3. Humanitiesfinished last iri dollar. average at $810 a month (Table 1).
4 Beginning salary offers to,women show a mixed picture. TReir dollar averageswere higher than those for men in all bachelor's engineering disciplines. except aero-nautical, but were lower in all other disciplines, in most cases, considerably lower
ble-2).
By functional 'area, about 50% ofthe offers.were for pgineering'jobS. The'engin ring average of $1,283 was also highest. The engfrieering and accounting/auditingcategories combineckattracqd 66% of all the affers"reported al the bathelor's level(Table 3).
Tables 4 and 5 shovi.num6erand average, monthly salary offers to men and,women. .
bachelor's degree candidates-rby type of employer. Bachelor's degree, candidates in tech-nical curricula had higher average dollar offers from all types of employers; and offersto men were_hlgher in all cases than those made to women:
At the master's level, 55% of the offers were to business majors, 33%engineers; 9% toscientists and 2% to humanities and social science graduates.' MA'swith'a non-teihnical undergraduate degree received the most offers, followed by /
electrical engineers and MBA's with a technical background. Women accountedfor 16%of the total* master's volume,*compared with4.14% in44975-76'and,12% two years ago.! Womenmaster's'candidates received 49% more offers'than 'a year ago, while men received 37%,more - a reversal of the offer situation at the baChelar's level. The three leaders inmaster's dollar averages were chemical engineering,.$1,509 a month; MBA-tpchnical, $1,503;and mechanical engineers, $1,438 (Table 6).
4 , ,
At the doctoral level, the leading averages were $1 ,882. for chemical engineers,and $1,811 for electrical engineers. Chemistry accounted for not only theimost doctoraloffers, but also was the top. percentage gainer, increasing 9% to $1,725 (Table 7).
THE ENDICOTT REPORT 1977 is the 31st annual suavey.of well-known business andindustrial firms concerning employment trends for college graduates. Statistics from215 large or medium-sized corporations in.26 states and Washington D. C., representingall major regions of the nation, indicate that companies planned to hire.16% more
1O

2
college grates at the bachelor's level in 1977 than were employed from-1976 clases:
At the master's level, the increase is also 16%. In greatest demand will be graduates
in engineering, accounting, business administratiii, and sales.
These companies indicate a raise in starting salaries from four to sevenperCent.. Predicted averages for 1977 indicate that bachelor's degree graduates inegrneering 0911 be, offered about $1,242 per month, accountants about $1,067; graduatesin business administration about $887, and liberat arts graduates about $866,per month. ,
Masten's degree graduates In engineering. will receive ,average monthly sararies of $1,430,followed by, those in accounting at $1,267, and those with the MBA with a technicalundergrOuate deg0e about $1,476 (Table 9). .
4
Althodgh engineers show the highest starting salaries, an exaMination.of theavrageponthly earnings of college graduate's employed five-years.ago (class of 1971) and
. 4r-1-years ago (class of 1966) found accounting graduates earning higher monthly salariesthan those in engineering (Table,8).
rJ
Starting salaries for chemists were up at'all degree levels according tothe Ametican Chemicat Society'4 1976 SURVEY REPORT OF STARTING SALARIES AND EMPLOYMENT
STATUS OF CHEMISTRY AND CHEMICAL ENGINEERING GRADUATES. Although chemical engineers
receive much higher starting salaries than do chemists, in 1976 the percent gains weresmaller for chemical engineers than for chemists at the bachelor's and Ph.D. levels.
Industry paid inexperienced chemists the highest starting salaries at all
degree levels. New-B.S. chemists in industry earn $11,700 compared to 59,000 for thosewho begari work.for the federal government and $8,400 Tor those emplOyed in colleges and
universities. The same held true for chemical engineers, with B.S. graduates employedin industry earning $15,480 per year (Table 1.5and Charts 1, 2 and 3).
Starting/salaries for men and women of the same level of education are,nearingequality with the female-to-m4le ratio at the master's and Ph.D. levels 0.96 and Or98respectiyely. At the bachelor's level, starting salaries for women chemists, are 1%
higher than for men (Table 10),. Table 11 gives trend data for ben and women chemists'"
salaries at the B.S. level.
By type of emp loyer, B.S.Asiomenchemists working in'ind.:1?N-y, state and local
governments, and hospitals and independent labs earned more than their male counterparts
/(Table 13). Momen Chemical engineers at the bachelor's level had higher starting
salaries at all.types of employers(Table 16).
By chemical specialty, master's degree analytical chemists,earned the most,'followed by physical chemists.. At the doctoral level, general chemists had the highest
starting salaries (Table 12). .° .
stBy geographic regidh, B.S. chemists, earned most in.t
io
he mountain area; M.S. .
chemists in the east north central and 'Ph.D. chemists in the west south central. B.S..
chemical engineers working in the west south centraitearned the most, while M.S. chemical
engineers in the west south central and the middle Atlantic regions had the highest
earnings (Table 14).
Median annual starting salaries of minority chemists and chemical engineers
are shown in Table 17. They are below the average for meli at all degree levels for
chemists (Table 13),, but very close to those for male chpmicpl engineers (Table i6).
The Ametican In4titute PhtgiCis reports that industry was not only the
largest employer of new physics' bachelor's degree recipients, but also paid'the higheststarting salaries. Meneafned higher starting salaries than did their women counter-:
4

a
parts with every type:Of employer except industry, Where women received $1100 per monthand men ,$1,036; and government, where they received the same'salary of $1,000 per month .
(Table 18).
, Industry again paid the highest starting' salary to graduate phyStdistt in1975-76 - $1,130 for master's degree recipients and $1,590 for doctoraldegteerecipients.' It is particularly interesting to note that the overall monthly startingsalary of $1,100 for master's degree recipients did not change from 1974-75 tO 1975-,76.Salariet offered by secondary schools remained constant,-those industry rose only. $5per monthydropped $150 per month in the "other" category, but.rose substantially it thefederal government - from $1,125 to $1,350. For doctorate recipients, theoverall -
salary figure rose from $1,250 to $1,300 between 1,974-75 and 1975-76, with governmentsalary offers again experienc^ing the highest percentalgeidcrease (Table 19).
'The annual starting salary survey for 1975-76 doctoral recipients by the - -
Ametican 'fathernatcat Society found that'80% were employed in academic positions,-11%held posltions in business and induftry and 9% in government, including, federal, state',and prvincial governments. Business'and industry paid the highest Salariv4 to mathe-matics P.D.'s (Table 20 ),. Table21 presentS median beginning salaries iemathem4ics
.
for Ph.D.'s by type of employer for the period 1972 through 1976.
The ninth annual NATIONAL SURVEY Of COMPENSATION PAID SCIENTISTS AND ZNGINTERSENGAGED IN RESEARCH AND DEVELOPMENT ACTIVITIES', conducted.by the Batteeto Cotumbuz .
Labotatni.es, reports that engineers led other disciplines' in highest starting salariesfor all degree levels in 1976 (Table 22). Of the variou's engineering disciplines thatwere.studied: chemical engineering graduates were paid the highest starting salaries -$1 ,277,_followed by materials engineering graduates at$1,237 (Table 23).
The U.S. Depattment o.6 Laboe4 OCCUPATIONAL OUT606K HANDBOOK includes startingsalary informdtion and estimates the number of personnel employed'in various fields. ASelected list of scientific and engiceering personnel data aid summarized tn Table 24.
< . Starting salaries of bachelor's degree and associate degree technalvgygraduates,are reported by the Engineeting Manpoweir. Commi)S4ion (Tables 25, and 26),Bachelor's degree technology graduates who received their degree in.aerospace technologyreceived the higheststartig salary ($1,121 per month), while associate degree tech-nology graduates in environmental technology, had the highest starting 'salaries among thewo-year graduates - $913 per month.
The In6t.i.tute oti Food Technotogi4tz repOrts that industry Wed most of thenew graduates in food technoliogy, but government paid the highest starting salaries(Table. 29). - s - " .
..
Starting salary offers for graduates of two-year-colleges are collected byL
'...
the Middee Attantic,Cateet Coumeting Azsocatim In the 1975-76 academiE year,, .
graduates of secretarial science and nunsing,,received the highest number of offers.However, graduates.of X-Ray technology received the highest annual salary, $10,400(Table 27), Starting sallry offers by type of employer'for graduates of two-yearcolleges, are shown in Table-28: ,
,c,
12

4
SOURCE: The College Placement CouRcil , A Study of 1976-77 Beginning Offers, FinalReport, July 1977.
0NUMBER AND AVERAGE STARTING-MONTHLY.SALARY OFFERS TO-BACHELOR'S
DEGREE CANDIDATES Br CURRICULUM, 1976-77
?. , ,
CURRICULUM
4
AVERAGE $ OFFER1976 -77
Total Change.from 1975-76Total' (=100)
No. Offers1976-77Total
1976-77Total
1975-76Total ,,j
BUI S
. 6,320 $1,062 . $1,018 ,
-
164.3 '
.
cceunting ''
Busilie5-General- (includes ManagemOnt) 3,649 927 872 106.3 .
Marketing & Distribution , 1,586 896' 840' 106.7 '
ENGINEERING
' 509 1,226 1,153 TO.5 3..
AeronaUtical '
Chenitical 4,626 1,389 1,279
,
108.6
l...
Civil" 2;178 1;185 '1,108 106.9. .-1,,,A,
Electri call - -- 6,106 '40645 1,155 10.8.' A .
". Ihtlut tri al f itt 1,066 1k257 1,139 -110.4 ,
4 \Mechanical u.:..'' 5,446 1 :t86 1,197 107.4
- ,. - . cF ,.;, .,,r,,,
MeOlriical.:(ilicl AST,Metal &,
Engineering Cera lt
.4
J.
512 1,315
.
_ .
1,212
-
. .
- 108.5
Petroleum 4-:: "4
't. .
506 1;512 1,398 108.2. - ",t 1..e. , : I-4,
IITech6ology-. .
,
876 1,177 1,083 .
,'-
108t01,r4
104.5 °
"'HUMANITIES 41,17SOthAL S'6Ittiqs",440.
.-' '4.10048 ''
1
81C 775if....14.:e
Humaiitties-- - ' '''
Social 5c41Ce .7 ,.
-c _
. 1= ,275 863 820 105.2-,- -
-SCIENCES10, * 0.
. .
. '',
652 924
\
852
..
108.5, , .. ,
griculpgal
,1*Bio100,iRia,,i--. ,
.., S - .238 882 1 810 108.9- ",,e4:,,,,/ . \. ,,- /
Chemi4.try 4.. .,,:t,
.
.4,33133,1_ 1,1021,102 '1,0284,401
, 1,3214.' 1,123 1,038' 108.2
Health. (Medical) ProfesSiohs,' 355 894 , 833 107.3
.,Mahemati-cs -:. 1,073'.
986.
10843
, Other Physical *Earth ''giehees-'7'" 171 1,068,1
1050 )01.7
hr

---.
.
4.,.
5...
.
,
;.,
0 : The College Placement Council., A Study of 1976-77 Beginning Offers, Final%Report, July 1977.
,
TABLE 2 4..
..
AVERAGE STARTING MONTHLY SALARY 'OFFERS TO BACHELOR'S DEGREECANDIDATES BY CURRICULUM AND SEX:1976-77 AND 197546
s'`\'CURRICULUM
No. Offers
1976-77 TotalAverage $ Offers
1976-77 Total
No. Offers
1975-76 Total
Average $ Offers}'1975-76 Total
. Men Women Men -WoMen Men Wom Men Women
BUSINESS 4
4,728 1,592" '$1,062 $1,061 '3,964
,
'1,177 $1,017' $1,021,Accounting
'Business-General
(inc. Management) 2,805
. ,
844 -935 908) 2,154 551, -H--.876t, 860
Marketing &Distribution 1,064 522 915
4
858 838 407.
.
853 % '814..
ENGINEERING .
480
.
29 1,227 . 1,222" 181
.
11 1;152
.
1,178...Aeronautical
,
CheTical 3,299. 727 1,386 1,401 2,535 447 1,278 1,283
Civil 1,942 236 1,178 1,246 1,552 130 1,104 1,153 1
Electrical 5,789 '317 1,244 1,262 ,3,488 189 1,154, 1,1
Industrial 950 116 1,255 1,280 658, 56 1,137. 1,1 4 .
Mechanical 5,117 329 '1,284. 7'419 3,255 229 1,195 1,226
Metallurgical* 451 61 1,313 1,324 : .229 , 32 1,212 1,210
Petroleum 485 21 1,511 ., 1,517 331 .17 1,399 1,388
Technology 830' 46 1,175 1,209 .540' 19 1,083 1,093
HUMANITIES &SOCIAL SCIENCES
507 511 866
.
-754
.
291 375' 816, 743Humanities
Social Sciences 667 608 904 819 '638 587 866 770
SCIENCES. :.',
550 102
,...
929 897 420. 59' 856
.
826Age9 cultura]
Biologfeal 156 82 892 863 125 87 820 795
Chemistry 205. , 126 1,103 1,101 82 124 1,011 1;052
Computer , , 950 375' 1,127 1,114 490 169 1,035 1,045
Health (MedicalProfessions) 55 300. 961 881 52 312 883' 825
Mathematics 252 302 1,081 , 1,066 211 310 992 982
Other Physidal &Earth Sciences 131 40
.
1;'069 1,067
.,
70 3 1,053
.
1,043
*Includes Metallurgy & Engineertng-teoramics. .
. . 111i.
,.
14 .. .
, , --,-..

6
SOURCE: The College Placement Council, A Study of 1976-77 Beginning Offers, FinalReport, July 1977.
. TABLE 3
NATIONAL AVERAGE MONTHLY SALARY OFFERS TO BACHELOR'S DEGREE CANDIDATESBY FUNCTIONAL AREA AND SEX, 1976-77 AND 1975-76
FUNCTIONAL AREA
No. Offers1976-77 Total
Average $ Offers1976-77 Total
No. Offers1975-76 Total
Average $ Offers1975-76 Total
Men' Women- Men Women' Men! Women Men . Women
Accounting/Auditing 4,679 1,618 $1,065 $1,060 3,910.. -1,198' $1,018 $1,019
Business Administration 1,161 446 940 849 800 308 885 780
Communications 145 108 829 721 112 82 816 674
Community andServiceOrganizations Work 92 97 747 702 82 82' 784
,
689
EDP - Programming/Systems 1,094 536 1,115 1:090 579 279 1,019 '998
Engineering 17,531 1,741; 1,279 1,328 11,171 984 1.,.194 1',228
Farm and Natural
Resources Management,\Y./
. 168 25 895
,
941 132 14 856
.
759
Finance and Economics 519 208' 936 927 362 155 883 . 890
Health (Medical) Services :'81 333 937 864 ,,27 341 847 °811
Home Economics andDietetics 6 34 853
.
685 16 44 .824 - 710.)
Law Enforcement Services 45 11 933 .798 64'. ' 17 896 796
Libjary and Related Work 9 10 742 598. 4 16 705 613
Manufacturing and/orIndustrial Operations 956 122 1,212 1;122 785 118 1,113 1,684
Marketing - Consumer'Product /Services 1,019 359 931 890 760 ,264 . 870 835
Marketing - IndustrialProduct/Services 531 126
.
1,055
.
1,029 487 115 1,016 996
Mathethatics/StatistiCs . 198 149 1,016 1,016 113 147 954 955
Merchandising /SalesProthotion . 801 519 883
.
.
812 61'..
382'.
820 - 756
Personnel/Employee _
Relations, '
.
143 91 973' 869 86
.-
-60 917 822
Public Administration. 78 33
A
; 879 762 53 21 847 790
Research -Noll-Scientific 88 451 990
,
789 74, 50 953-' 919
Research - Scientific 506 192 1,119 1,062 341 7 155 1,070 :1,010
1,089'
Rotational `Training -Technical 756 102
.
. 1,241
_ .
1,195 764 145 , 1,128
Rotational, Training -Non-Technical 805, 373 911 866 742 344 852 839
.15

7
SOURCE: The College Placement Council, A Study of 1976-77 Beginning Offers; FinalReport, July 1977.
. NUMBER AND AVERAGE-MONTHLY SALARY OFFERS TO BACHELOR'S DEGREE "CANDIDATESIN NON-TECHNICAL CURKICULA BY TYPE OF EMPLOYER AND SEX, 1976-77-
TYPE OF EMPLOYERNo. Offers
1976-77 Total,: Average $ Offers
Total 'Men 'Women Overall Men WomenBusiness , ,A
8,769 6,153 2,616 $ '965 $-983 $ 921Federal nvernment 209 165 44 868 871 857'State & Local Government . 352- ' 22T 131 859 903 787
,Manufacturing/Industrial 4,211 3,102 1,109 1,014 1,017 1',004
'Non-Profit & EducationalOr'anizations 307 130 177 732 789 '691
5,.
TABLE 5
NUMBER AND AVERAGE-MONTHLY SALARY OFFERS TO BACHELOR'S DEGREE CANDIDATES, IN TECHNICAL CURRICULA BY TYPE OF EMPLOYER AND SEX, 1976-77
...
. TYPE OF EMPLOYERNo.'Offers
. -
1976 -77 Total Average S.:Offers.
Total Men Wren Uverall Men WomenBilsiness 666 - 498 \68 $ 993 $ 450Federal GovernmOnt 567 508 59
,$98$
3,029 1,033- 9§4',.,
State& Local Government 384 ''344 40 982 998 846
Manufacturing/Industrial 22,784 20,172 2;612 1,271 1,271\.1,266
Non-Profit .EEducationel,
LOrganizations 448 , - 120 328 890
.
943 871
t.
1e- .....

,
6
SOURCE: The College Placement Cduncil, A Study of 1976-77 Beginning Offers, Final
Report, July 1977:
4. JAILja .
NUMBER AND AVERAGE MONTHLY STARTING SALARY OFFERS TO MASTER'S DECREECANDIDATES. BY CURRICULUM, 1976-77 AND 1975-76
.
: CURRICULUM
No. Offers11976-77
Total
AVERAGE $ OFFERS1976-77
Total ChangefroM 1975-76Total (=100)
1976-77Tofal
1975-76
Total
ENGINEERING v,.
837 * $1,509 . $1,407 . 107.2Chemical
Civil % ) 345 1,342 1,251 -107.3
Electrital . 1,470 1,410 1,319 106.9
Industrial . 231', 1:413 1,288 109.7
Mechanical , 1,016 1,438 1,341 107.2
Nuclear includingEngineering Phsics) 133 1,362 1,294 105.3.
'SCIENCES
23 1,416 1,313 107.8Geology & related .
Deological Sciences,.
,, Chemistry . / 111 - 1,321 :1,234 107.1
Computer 544 1,386\K 11,262 109:4
Mathematics . 118 1,285 1,305 98.5
MetalTurgy (includingMetallurgical Engineering,.Materials EnginaeringliScience and Ceramics) 125 1,405 . 1,339 104.9'
'
BUSINESS
751 1,247 1,201 ,103.8
-,
Accounting
Business; Administration,Industrial Management (MBA)
.
4,709
.1
..
1,410
.
1,323
.
-.
106.6
,
.
After Non-Technical... Undergraduate Degree
After'TechnicagUndergraduate Degree 1-- 1;256 1,503 1,385 108.5
.HUMANITIES AND SOCIAL SCIENCES
''i 134
,
1,004 ' 96-3 '104.3Humanities. .
Social Sciences / 160 1,036 :1,009 102.7
a
17
4

SOURCE: The College Placement Council, A Study of 1976-77 Beginning Offers, Final ,
Report, July 1977.TABLE 7 .
NUMBER AND AVERAGE MONTHLY STARTING SALARY OFFERS TO DOCTORAL DEGREECAbIDATES BY CURRICULUM, 1976-77 AND 1975 -76
. 4..
.CURRICULUM Offers
976-77Total
AVERAGE ,.$ OFFERS',
1976-77- Total Change,
from 1975-76.Total (=100)
1976-77Total
1975-76Total
ENGINEERING
180 $1,882'
-
1,793 105.0Chemiscal. \
'-tivil. 13 1,625 1,597 101.8
'Electrical , 170 1,811. 1,693 ---. 101.0
Mechanical , 49 1,777 ,687 105.3
SCIENCES .
.
263 1,725 1,582 109.0
.
.
Chemistry
Mathematics'(incl4dingOpeNtions, Research,Statilstics & ActuarialScience) 4 56
,
1,704 1,569
.
. 108.6
Metallurgy (includingMetallurgical Engineering,Materials Engineering &Science & Geeamics)
.
39
,.
4.
,
1,749 1,695 103.2
Physics.IvJ1 1,698
_
1,639 103.6
SOURCE: Trends in EmOoyment'of College and University Graduates in BusinessIndustry, 1977, Thirty First AnnUal Report, By Frank S. Endicott
TABLE 8'" NUMBER AND.1976 MEDIAN MONTHLY SALARY OF GRADUATES EMPLOYED FIVE
'
YEARS AGO (CLASS OF 19.7, AND EMPLOYED TENT YEARS AGO,(Class of 1956)
F I El D. Employed 5 Years AO
Salary
EmP\loyed
Number
JO Years Ago
SalaryNumber
Engineering 4., 1,083. $1,658. ' 595 $2,045
Accounting 4 1,197 1;720 4. 2,27&
Sals 426 1,37 s.- 30 ,1,939
General Business .. 1,203' 1,448 44 1,942
18
OP

10
O
r-
SOURCE: Trends in Employment of'College and University Gradyates in Business andIndustry, 1977, Thirty First Annual Report, by Frank S. Enditott.
TABLE 9
NUMBER AND AVERAGE STARTING MONTHLY SALARIES FOR NEW .
GRADUATES BY FIELD, AND DEGREE, 1976 AND 1977
FIELD
V
BACHELOR'S DEGREE4 MASTER'S DEGREE
# to behiredin 1977 1977 1976
,
Percentincrease
# to behired
in A1977 1977. 1976
Percentincrease
'Engineering (121) . 3,745 $1,242 $1,165 6.6 597 $1,430 $1,353 5.7
Accounting (113) 3,791 1,0'67 1',033 3.3 1,184 1,267 1,224 '3.5
Sales-Marketing4'(69) 1,087 978 943 3.7 .
Business Adm. (82) 1,648 887 852 4.1,.'
Liberal Arts (43) 876 866 835 3.7
Chemistry (30) 165 1,108 1,032 7.3) ,
Math - Statistics (45) 354 ,1,045 994. 5.1N
Economics-Finance.(31) 202 943 887 6.3 , ,
Other Field (50) 854 1,032 985 4.8 16 1,255 1,217 3.1.
Other Technical' Fields . 196 1,315 1,239 6.1
MBA with Technical BS , 284 1,476 1,388 6.3
MBA with Non-frechnical-BA
.
695
4
1,385 1,315 5.3
Note: Number'of hiring companies for 1977 at bachelor's level in parenthesis.
SOURCE: CHEMICAL AND ENGINEERING NEWS, October 25, 1976
CHART 1 - OVERALL MEDIANANNUAL STARTING SALARIESFOR CHEMISTS BY DEGREE
LEVEL., 1966-1976
CHART 2 - MEDIAN ANNUALSTARTING SALARIESRCHEMISTS IN INDUSTRY BYDEGREE LEVEL, 1966-1976'
'Chernrsts' median anjual tartina salaries (S )hour nds)
20
CHART 5 - MEDIAN ANNUALSTART 7Nt SALARIES FORCHEMISTS IN COLLEGES &UNIVERSITIES BY DEGREE
LEVEL,'r66,,,,)976
19611
IMP 19 4,1
L

\
3
SOURCE: American Chemia Society; 1976 Survey Report - Starting Salaries andEmployment Status ofChemistry and Chemical Engineering Graduates,November 1976.
TABLE 10
NUMBERAWMEDIAN ANNUAL STARTING SALARIES QF CHEMISTS AND,
r. 'CHEMICAL alGINEERS BY HIGHEST DEGREE EARNED AND SEX, 1q7A._
HIGHEST DEGREEEARNED
CHEMISTS CHEMICAL ENGINEERSMen Women Men- Women(291) (145) (455) ( 68)
Bachelor's $10,800 $10,900 p$15,360 $15,600( 67) ( 231 4 ( 86) ( 4)
Master's 12,500 12,000 16,620 16,100°(131) -( 19) ( 41) ( 1)
Doctorate 18,300 18,000 20,700 20,100
11
....SOURCE: CHEMICAL AND ENGINEERING NEWS; American Chemical Society, November 5, 1962;
October 28, 1963; Npvember 9, 1964; October 18, 1965; October 23, 1967;October 21, 1968; November 23, 1970; October-2,41972; 1973:, 1974, 1975 and
1976 Survey Reports, Starting Salariet and Employment Status of Chemistryand Chemical Engineering Graduates. -,
TABL'E' 11 '44MEDIAN MONTHLY STARTING SALARIES FOR MEN AND WOMEN'
CHEMISTS % BACHELOR'S LEVEL, 1961 -1976
YEAR MEN WOMEN % BELOW.MEN
1961 4 $500 '$433 13.4
1962 525 450 14.2. .
1963 550 473 14'.0
-196`4 560 4$0 / 14.2
1965 590 499 )\ A, . 15.4
1966 625_ 550 '\,,,.._, 12.0
1967" 660 600 10.0
1968 712 625 12.8
'1969 750 702 6.9
1970. . 758 644 17.7
1971 691 5.9
1972 708
,650
,, '650 8.2
1973 750 708 5.9
1974. 816 . 833 +2.1
1975 833 B01 3.8'
1976 900. 908 1. \+1.0 '
20

ti
4SOURCE: American Chemical Society, 1976 Survey Report Starting Salaries and
Employment Status'of Chemistry and Chemical Engineering, Graduates,November. 1976.
TABLE 12
NUMBER, MEDIAN, AND MEAN ANNUAL STARTING SALARIES OF GRADUATE CHEMISTSBY CHEMICAL SPECIALTY, 1976 .
CHEMICAL SP'ECIALI.Y.-/-1------- No.
M. S...
. PH. D. s . .
Median Mean No. Median )lean
-Arolytical.: 19 $14,300 $14,265 20 $18,000 ,$17,396
Biochemistry..t.,
....
6 , 9,500 )0;640 12,000 , -. 124700
:Inorganic . 9 12,000 . 11,532- 30 16,500 154915,.
Organic Ap s 29,
.
12,000 12,225 46 18,500 17,790
Physicai,.Theoiet. 6 12;800 ' 12,333 35 .18,500 . 17,314
POlymer,'Macromol. * * * 5 :18(000 18M0
K180tChemistrys, General 12 10,500..-
11,990
.,
3 20,W00
Pharma.; Med., Cln. - 2 9,713 4. * °-.`. ,
Other ,7 . 10,922
\11;357
. '"'lt,658 16,t00 16,393
,All Specialties 90 12,400 ,r.. 12;34 150 18,300' 17,119
**Data not a vailable
r;
NUMBER AND MEDIAN STARTING SALARIES 0F.DIEMISTSBY DEGREE,TYPE OF EMPLOYER'AND SEX, 1976'
SO
TYPE OF EMPLOYERMEN .* WOMEN,
B. S. , M. S,14' PH.D. B. S. M. S. PH.D.fk
, (215)' -4 (31;);;; . (91). (98) (15) ? (41)
Industry, Private $11,500 $14,100 $18,900. $12,000 $14,000' $18,760
(1T) .(7) . (9) (4) (1) *
Government, Federal 9,000. 11,046 '. 17,008 9,000,k 13,482 , *,, 4
,(10) (3) * =
(5)*
*.
Government, State & Local 9,604 10,922 * 10,524 * *-
(16) (9) (29.) $ (13) 1 (2) . (7)
College/University 8,400 10,600 12,000 8,200' ° 8,400 11,500. . , r
(15) (4) r *. (9) (1)High School _ 8,800 MOO 1 * 4 8,700 8,200 :
- -..
(21) (6) .1 , (15) (2) * .
Hospital/Independent Lab. 9,500 9,600 '. * .9,600 9,713 *
. (3) (1) (1) (1) (-2) (1)Non Profit Research. Inst. 9,000 9,024 20,700' 8000 9,000 17,200
, (291) (67), / (131) (145) (23) (19)
All Employers 10,800 12,500 .18,300 10,900 12,000 ..18,000
* Data not available.

SOURCE: American Chemical Society, 1576 Survey:,Report - Startin ,Salaries and r 13Em2i2yment Status of Chethistry and Chemical Engineering Graduates,November 1976. t
NUMBER AND MEDIAN STARTING SALARIES OF CHEMISTS AND CHEM4L ENGINEERSBY 41EGREE LEVEL AND GEOGRAPHIC REGION, 1976
TABLE J4
GEOGRAPHIC ,4EGION CHEMISTS eHEMJALa.:5..-
ENGINEERS', M. . Ph.D.B. -S. M. S. PH.D.
PacifiC(29)
$11,000( IT
-$10,500
(13)
$14,500(41)
$1/5,30(f8)
.$16000,{ 7)
$20;n0'(13) ( 3) ( 7) (18) : ( 1). .-( 1)
Mountain 0 11,700 11,200 16,667 15,600 15,000 21,220(36) ( 3) ( 7) (30) ( 31 *
West North Central. 9,700 12,600 19,100 15,000 :15,70Q,
(37) .(16) HO) , (100) (11) ( 9)West South Central 11,000 13,478 19 200 .15,800. , 16,800 421,000
- .
(118) (12) (2 ) (102) (23)East North Cehtl-al 11,400 13,500 18,300 15,300 16,500 20,1e3
(14) ( 4) ..( 4) (21) ( 2), ,
East Sobth Central 9,528 9,000 15,600 15,300 15;000(114) (26) (50) ,(106) 0 -(25) q 8)
Middle Atl'aptic 10,920 12,000 18,200 15,$00. 16,800 20,700(49k (1`5) (21) (84) -=4 (131 ( 6)
South Atlantit
)9,800 12,800 18,500 .1,400 16,620 20,700
. (26) ( 6) C13) 6). 'T 41 ( 1)New England 10,400 11,500 18,000 "-14,506 ' 15,600 c, )3,900
* 6ata not available.
TABLE 15 k
NUMBER AND MEDIAN STARTING SALARIES or CHEMISTS AND NEMICAL/ENGINEERSUl ULV,LL LLIIL. Villa, fl., W. ....r.y.... .,,y__
CHEMISTS CHEMICAL ENGINEERSTYPE OF EMPLOYER A I
IB/75. M. S. PH.D/ B'S, 1) M. S. PH.D.
(313) (52) (102) (`515) i (86),', (33)Industry, Private '$11,700 $14,000 $18,780 $15,480 $16,00 $21,000
r- ,-
.05) (8) (9) (6)..
(1) (T)Goveinment, Federal 9,000 11,046 17,000 12,886 '15,000 20,200
,
(15) (3) * * * *t
Government, State & Lo al 9,800 10,922 : * * *
'.' (29) (.11) (36) (2) , (7)College/University 8,400 10,500 12,000 _ 16,500 16,600.
(24) (5) * * *High School 8,700 9,000 '* * -* *
(36) (8) * * * *
Hospital/Independent Lab. 9,500' 9,713 * : 4 *1
(4) . (3). (2) (2) (1) (1)Nonprofit Research Inst. 8,400 9,024 17,200 14,700' 16,000 .146,800
(436) (90) * 450) (523).. (90) (42)/7'll Employers , 10,800 12,400 18,300 15,420 16,620 20,700
* Data not aveailable.4- 22 E

14
SOURCE: American Chemical Society, 1976 Survey Report - Starting Salaries andEmployment Status of Chemistry and Chemical- Engineering Graduates,November 1976.
'TABLE 16
(/ NUMBER AND MEDIAN STARTING SALARIES OF CHEMICAL ENGINEERS BY DEGREE,TYPE OF EMPLOYER AND SEX, 1976
TYPE OF '
EMPLOYER1
ME N WOMENB. S. M. S. PH.b. B. S. M. S. PH.Y.(448) (83) T82) (66) 13) l)
Industry, Private $15,360 $16,800 $21,000 $15,600 $17,200 $20,700
(394) (60) (23) r (58) (3) (1)Manufacturing Industry '15,400 16,800 21,000 1 15,600 17,200 20,700
. . ....
Non-manufacturing ..e(54) (!' . (9) (8)* *
Industry' 15,200 16, 20,700 15,300 *-
*
,,
* *2) (7) * * : *College/University * 16,500 16,600 * ' * ik-
..---''(5) * (1) (1) ' (1) *
Government 12,886 20,200 14,700 15,000 *rderal
(1) (1) (1) (1) * *
,Ndqprofit Research Inst. '14,700. 16,000 16,800 15,-600 * . *!
. (455) *(86) (41) (68) (4) '(1)All Employers
. 15,360 16,620 20,700 15,600 16,100 2!3,700
I
* Data not available
TABLE. 17
NUMBER AND MEDIAN ANNUAL STARTING SALARIES OF MINORITY. CHEMISTS. AND CHEMICAL ENGINEERS BY HIGHEST DECREE EARNED, 1976
r
HIGHEST DEGREE.
EARNED"ItHEMISTS CHEMICAL ENGINEERS
k :
Bachelor's $ 9,648' .$15,300.
( 8) . C 9) .'
Master's . 9,500 16,380
Doctorate 16,000 20,400 '
23

SOURCE: Arierican Institute of Physics, Survey .of 1975-76 Physics and AstBachelor's Degree Recipients, AIP Pub. R-211.8,,February 1977.
TABLE 18
DISTRIsUTION AND MEDIAN MONTHLY STARTING SALARIES OF PHYSICS BACHELOR'SDEGREE RECIPIENTS BY TYPE OF EMPLOYER AND SEX, 1975-76
15
TYPE. OF
_EMPLOYER
.
MEN
(411 Reported
Salaries)
140MEN*
(81 ReportedSalaries)
TOTALf- .
(492 ReportedSalaries).
Distribut?ohby Employer Median
DistributionBy Employer' Median
DistributionBy Employer
.
Median_._
Industry - Mfg. 28% $1,036 39 %\ $1000 30% 1 $1,047Industry - Service - 19' ,. 960 lic- 867 19 938?- .
High School 10 ' 771 TT, . 750 11 765
College or University 4 843 4
.
700 4 .. 813
Governtent** '26 900 875 '23 900
Research Institute 3 1,000 6'"' 1,t00 3 :1,000
Other 1 10 750 10:, ioo ,*',10 714
TOTAL 100 $915' 100 $880 lOO $905
* Include accepted and continuing Employment** Career military salaries are included.
SOURCE: American Institute of Physics, 1974-75 Graduate Studnt Survey, AIP Pub.No. R-207.8, September 1976 and 1975-76 Graduate Student Survey, AIP Pub,No. R-207.9, July 1977.
TABLE 19
MEDIAN MONTHLY STARTING SALARIES OF GRADUATE PHYSICISTS, 1975 AND 1976
EMPLOYER
TERMINAL MASTER'SRECIPIENTS
_
-
DOCTORATE RECIPIENTS.% -
AcceptingPositions
,.., .
Salary
%AcceptingPostdocs.
'' ProbablePermanentPositions
Postdoc.
Fellowshies
!'
'
Salary
1975 1976 1975- 1976 1975 1976 1978/ 1976 1975 1976 1975 19764-Year
College - - ** 1 %. * - 4% 5% * * $1,060 $1,040
University 8% 12% * $ 900 35 '33% 23 18 $ 955 $1,005 1,050.
1,070SecondarySchool 15 11 $ 860 860 - - 1 r * -
Industry 38 38 1,125 1,130 } * 16 18 * * 1;630 1,590Government . 31 24 1,15 1,350 2 4 5 6 1,050 'r',244 1,290 1,625FFRC° 4 5 * - 3. 4 4 6 1,050 1,100 1;480 1,530Other 4 10, 1,050 900 1 3 - 4 3 * 1,050 * 1;100All Employers 100 100 $1,100 $1,110 100 1,010 1,250 1,300
° *Fewer than 20 graduates, reported salaries..
.Federally-fUded Research Centers
24

16,
SOURCE: Arne Kan MathematicaY'Society, NOTICES, Vol. 23, No. 6, Issue No. 172Oct er 1976
, MEDI N BEGINNING SALARIES IN MATHEMATICS FOR PH.D.'S BY
TYPE OF EMPLOYER AND SEX, 1975 AND 1976
;
. )
ti
t
-
a
I
AMM111===1
TYPE OF EMPLOYER MEN WOMEN1976 1975 976, 1975
Teaching or Teaching .
& Research (9 months)(223)
$13,400. $13,40D----
( 33)
$12,500 $12,600
(,. 4)11 ___
Research months) 8,000 - -
Teaching or Teaching ,( 53) ( .9)
t Reserch (12 months) 15,000 14,500 17,400'4.2A
. ( 8) ( 1)
'Research (12 month) 12,100 11,900 19,500,.'( 45) ( 2)
Business & Industry (12 months). 20,600 18,9000 -- 17,500
( 24) ( 2)Government (12 months) 19,4p0 18,500 19,400 10,000
TABLE 2rMEDIAN BEGINNING SALARIES IN MATHEMATICS'FOR PH.D.'S
BY TYPE OF EMPLOYER, 1972-1976
TYPE OF EMPLOYER 1976 \....
1972 1973 1974 1975.
Teaching* (9 months) .. -p- $11,500 $11,600 - _
Teaching'& Research* (9 montJ) -- 11,500 11,700 _Teaching ,or" Teaching . -
& Research * (9 months) $13,300 - $12,100.
$12,800
Re'sea,40 (9 months) -- 8,000 11,100 11,100 8,000 .):-,
Teaching* (12months) 12,400 12,700' - -
Teaching &,Research (12 Months). /
_ 12,500 15,. 900
Az,
Teaching or Teachingt Research* (12 months) 15,500 -
Ar13,800
,
'14,500
11,900Research (12 months) 13,000 12,500 15,000 9,500
Busines's & Industry.(12 months)' 20,500 .18,100 18,000 19,000 18,700
Government (12 months) 19,400 15,500 16,800 19,700 18,20Q
* Figures in the TeaChing and the Teaching and Research categories compiled fir r1474are not comparable to those for prior years; the two categories were combined in1974.
.%4o ; ,
NOTE: Dashes indicate that-fibt enough returns were received to warrant includingthe figures.
25

.
SOURCE:' Battelle, Columbus Laboratories, National Survey'of Compensatjon.PaidScientists-and Engineers Euaged in Research and Development Activities,November 1976;
TAB E 22
NUMBER AND-MEAN MONTHLY,STARTING,SALARIES OF NONSUPERVISORY. EMPLOYEESENGAGU IN R & D ACTIVITIES 'BY FIELD OF DEGREE AND DEGREE LEVEL, 1976
FIELD OF DEGREE
, 'DEGREE LEVEL
. Bachelor's Master's -Doctorate
No. Salary No.. Salary No. Salary
Engineering 318 $1041 :53 $1;287 14 -$1,728
Chemistry ry ,
975 1 1,225 11: 11393
1,665Physics c 10 9904!, 2 1,075 ' 5
Lift Sciences 15 831 . - - , 6 1,141
Math & Statistics 66 . 1,,018 5 1;185 3. 1,675
Social Sciences , 4 '925 1 1,175 2 1,675
t .
TABLE.23
-r
NeMBEAND MEAN STARTING SALARIES OF NONSUPERVISORY ENGINEERING BACHELOR'S DEGREEEMPLOYEES ENGAGED IN R &.D ACTIVITIES BYWDIKING=AS-OCCUPATION, 1976
.Working-As-Occupation -Number. I
Salary
Aeronautical Engineering\4 23
,....-N,
$1;070
l',277 1Chemical Engineering 41
Electrical Engineering 166 'D1,159
Materials Engineering , 4 , 1,237
Mechanical Engineering 32 1,168
1,175,
1,082
Metallurgical Engineering . 2 f
Nuclear Engineering. 7 .
T.
+7,
J
17

Department -644
sTABLE 24
STAtIfING SALARIES OF SCIENTISTS BY FIELD, tyPE 0 EMPLOYER:ANDflIGNEST DEGREE ATTAINED; 1'974
'
. . ,..,
r, Occupational Outlook Handbook, 1976 Edition,'
F I L.,-41,,v1A
4-
EstimatedWilber
4-,. ,
rillo oytd,,
.'",irf 1974'
- "- k.'"*.TYPE OF
Industry
EMPLOYER
Fdderal. Go nmentPrivate4.' fr:4?)8 M. S. ' PH.D. 13,1"'S. M. -- PH.D.
$15;481
18,4635,481
18,463
Eftain-64 .-- 44'-: 1,100,000 $11940
10,300
'`"
$13,700;-$18,000
12,5004,
t
10,000
$ 8-,500
10;5208,50010,520
$10,520
12,841
:,
15,481Mathe6ticians 40,000
Statisticians , . 2 4 , 0 0 0 t 1 0 , 0 0 0 12;500 16,000
,8,500
10,520
12,841
15,481
15,481
18,463
Life Sciences 490;000 442iWO;., .-
8,500
16,520
10,52012,841
15,481
18,463.
Agricultural , 50;00 9,420
,;/..
,Biological . 75;0605-7
.
8; 40
,,.-0.
Biochemists..-
.
12,400.
15,000
.
.
15,10004,500
Foresters . 24,000-
- , .,,,,. .
8,500
-
10,50012,841
15,46,3
.
Geologists 23;006- ' 10,500 2 200'?..;
16,000
8,500
10,520
10,520,
12,841
15,481
18,463
Geophysicists
,
8;206,
.
5;600
10,500- 12,200.-- .., , .......
,-
.
,000,
8,500
10,5208,50010,520.
10,520
12 841
1,520
1.:41
15,481
18,46,
,481
18,463-;.q&orolopists
Chemists
.
'135,0001 ,,--,
lo ,200 12,000,
"16 ,8b0,
8,50010,520 12,841
158118,463
.
Physic* .418,000
2,000'
10,100 12,800,,.45
17,800
8,5m.10,5208,500lo ,am
0,52012-,84.1
10,512,841
15,481
18,46315,481
18,463
1
As tronomei's
-
Oceanographers
,
.2,500'
8,5Q010420
0,62012,244.
15,481
18k463-s.--.,:,
VtyctIologists .-
,
75,000 . 11,000 13;000 .4E-i
1543118463
.
AnthropologIsts-
3,800.
13,000
8;500"10-,620 12,841 15;481
EconOmisti - ,71,000 13,0008,50010,520 14841' 15,481
. ,
.Poliii dal Scientist 11 -56, . -
-,- A ,5CIP'
10,520-'I t
:12! 841;
15,481
%
Sociologists ,14,000
. , 8,50010,520 12,841 15,481
, .
,
ProgramMers.
200000.
*6.-
"$170 - $24Q* ,
..
_
* Weekly SalaeY.c
V41.
111..,
s. 6

r-)
SOURCE: Engineering Manpower Commission, Prospects of Engineering and TechnologyGraduates 1976, January 1977
ti
TABLE 25
NUMBER AND MEAN MONTHLY. STARTING SALARIES OF BACHELOR'S DEGREE'TECHNOLOGY GRADUATES BY CURRICULUM, 1976
CURRICUrUM -,
. No.,ofSchools'
NO. ofSalaries
MeanNon-ECPDSchools*
Mean'
ECPDSchools*
OVERALLMean
Aerospace .2 22 $1,121 $T,121
'Civil & Related 26 '366 $ 992 985 986
Computer . "3 ., 26 - 972 972
Electrical & Electronic 28 419 1,067 1,058 1,060
Industrial 15 212 .920 1,031 991
Mechanical 25....
265 1,080 1,031 1,041
General & Other 20 223 1;103 1,049 1,070
All Curricula 48 1,485 1,034 1,029 1,030
TABLENUMBER AND MEAN MONTHLY STARTING SALARIES OF ASSOCIATE DEGREE
TECHNOLOGY GRADUATES BY CURRICULUM, 1976
cuRRICLI 7-1.1M,.
No. of.
Schools
.
No. ofSalaries
MeanNon-ECPDSchools*
MeanFECPD
Schools*Overall
Mean
'Aerospace - 2 6 $633 ,.
Air Conditioning . 11 75 $ 731 $936 772
Architectural 17 66 727 701 712
Automotive 12 , 74 761 775 763
Chemical 9. 33 723 8268 792
Civil 36 . 203 721 734 744,
Computer 19- 238 712 777 724i .
Construction ''.
8 . 46 947 762 790
Drafting 29.. 227 710 751 713
5leceda -,.' 61 367- 822 842 833
53 . - 647, 753 804 770.Electronics //-.
Electromechanical' 3 18 769 . 769
Environments:1J 6 , 19. 1,019 766 913
Industrial 19 177 905 828 . 876
Mechanical 40 217 819 812 - 815
Other - 32 . 245. 777 81& . 785
All Curricula . 102'. 2.658 768 708 . 779
'Certificate Programs 4 318 719
* ECPD schools are those ha'ving at least one engineering technology curriculum accreditedby the,Engineers Council for Professional Development (ECPD). Specific curricula forthese schools may or may not be accredit d.
.2 8
t..

204
SOURCE: Middle Atlantic Career Counselidg Association
TABLE 27
STARTING SALARY OFFERS TO GRADUATES OF TWO-YEAR COLLEGES BY CURRICULUM,' 975-1976
8y Curriculum for allTypes of Employers
s
. No. Offers
1975-76 Total
Average Weekly Offers 1975-76 Aver.'
Weekly SalaryAnnualized
1975-76Total
1974-75Total
Business
136
' 77
58
-320-r-- 20)
$148152
146139
163
°.$148
,156
164
134
152
$7,696
7,904,7,5927,228
, 8,4Y6
Accounting .
Business, General. .
'. MarketingSecretarial Science t
Other .
$pcial Science, `
4 18
: 20
16
5
. 102 c'
192
134
kLl66
. 129
196
133
131
--)
.
5,3049,9846,9688,632'
Child Care '
Police ScienceSocial ScienceOther
Health Professsion40
8
40227
24
10 -7
Th 4
10
170
132
146
184
138
140
133
200
151\
143
---.
136
174
---
-,---,
173
159
8,8406,864
.:7,592
9,5687,1767,280
6,91610,400
7;852
' .
Dental Technology .-.
Inhalation TherapyMedical Technology,'NursingOccupational TherapyPhysical TherapyRecreatiOnal TherapyX-Ray TechnologyOther
Technology .
58
10
. 13 ,
4811
.-
81
.16
6P' qp
3865
11 ,
23
.
147
123
157
180
16Q ",-
168.
156'
. 188
::140," 163
156
168
182
...
' 128---
150
, 177,
185
,1611'57
165.
.160-
---
175
.146
180
.
..
.
..
'
,,
7,644e
6,968,1649,3608,320
8,7368,1129,776
,7 ,280
8,4768,112
.8,7369,464
Agricultural #
Animal Science TechnicianBiology' .
Chemistry
Civil Engineering -, .
-Computer Science and
Data processing.DraftingElectrical and ElectronicsEnvironmental ScienceFoodsMeckanical
Mechanical DesignOther
,
Liberal Arts '\,6
12
19:
19c,
_
131
135
141
128
---
---
6,8127,0207,332
Commercial ArtGeneral Degree'Other
..
Total ,566 . ,
,..
29

SOURCE: Middle Atlantic Career Counseling Association-
'TABLE28
STARTING SALARY OFFERS TO GRADUATES OF TWO-YEAR COLLEGES BY TYPE OF EMPLOYER, 1975-76
21
..
.
TYPE OF EMPLOYER, -
No. Offers.1975-76 Total
.,
Average Weekly Offers.
1975-76 Aver..
WeeYly SalaryAnnualized
1975-76fofal
1974-75Total
Accounting 24 . _146 139 7,592Aerospace and Components 6 . . _187 142 9,724Automotive & Mechanical'
Equipment '54. 151 150 7,852Banking, Finance, Insurance 108 -141 148 7,332 -
Buildings Materials Mfg. andConstruction 34 162 168 8,424
Chemicals, Drugs and AlliedProducts 92
.
172 161 8,944Dentists 40 170 --- . 8,840Electrical Mathinery and
Equipment 47 '168 163 8,736Electronics and Instruments 62 176 173 9,152Food & Beverage Processing - 67 455 152 8,060Glass, Paper, Packaging andAllied Products 16 179
.
152 9,308Hotel/Resturant 12 146 --- 7,592Hospitals 350 ' 168 172 8,736 .
Lawyers 58 143 --- 7,436Merchandising and Retail ",
Services . 132 - 135 (-- 151 7,020Metals and Metal Products 23 169 163 _ 8,788Nursing Homes . 12 r 163 --v- 8,476
8,,112
,Petroleum and-AlliedProducts
' 19 .2156.
171.
Physicians '- 36 141 --- 7,332Research and /or ConsultingOrganizations 40 162 182
,
.8,424Text1le Industry 15 155 , ---- 80160Utilitie - Public
(Including Transportation) "37 176 161
.
9,152Government - Federal . 17 164 180 , 8,528Government - Local and State 69 . 158 154 8,216Non-Profit OrganilatiOns andEducational InStitutions 68
.
130145
130
152
.
6,7607,540Other 128
Total , '1,566
30

22
SOURCE:. Institute ,or.food Technoloaists:Food Technoloay, Januarii.1977.
TABLE 29
NUMBER AND 4DIAN MONTHLY STARTING SALARIES FOR 197 GRADUATES -IN
FOOD SCIENCB AND TECHNOLOGY BY DEGREE LEVEL AND EMPLOYMENT AREA
(
EMPLOYMENTAREA
DEGREE LEVEL.
B.S. M.S. . PH.D.
(93) (45) AzuOverall $ 940 $1,126,1' $1,450
(58) (30) . (20)Men 950 1,137 1,425
(35) (15) . ( 6)Women 925 1,000 ' 1,480
(84) (30) (14)
Industry 950 1;091 1,500 4.
( 2) ( 6) ( 2)
GovernMent 1,370 1,162 1,610( 2) ( 5) ( 9)
Education 736 , 1,000 1,166
( 5) ( 3) '( 1)
Research Institute 800 1,025 1.,458
31
P
a

23ar
SALARIES OF ',EXPERIENCED SCIENTIFIC AND TECHNICAL PERSONNEL
Three subsAtems make up the Panpoweit Chaliacte4i4tic4 Sy4tem (MCS) of the,.4ationat S,cience.Fouudation, This system produces estimates for the total U.S. sciEriceand engineering population. The National Sample of almost 1.1 million scientists andengineers, limited to persons who were in the labor force by 1970, is surveyed by the&Luau oirthe Censuz for the NSF, ands forms one part of the MCS. The other two sub-systems include inputof new doctoral sciepttsp and engineers since 1970 from datacollected and analyzed by the'vationa,CAcademy Science4/Nationat Re4ealtch Councitand other scientists and engineers belOwhe doctorate who have graduated in scienceand engineering since 1970.
, .,
The median annual salary for all scientists and engineers in th4 National Samplein 1974 was $19,300. Atmospheric soientists and economists reported the highest, $22,300,and agricultural scientists the lowest, $17;100. Chemists, computer specialists, bio-logical scientists, agricultural scientists, socioldgists/anthropologists, and other .°
social scientists all repoi-tedkmedian salaries below the overall median (Table 28).
\There were 53,900 (5.0%) women scientists and engineers in the National Samplein 1974. These women had considerably loWer median annual salaries than did their malecounterparts. WOMen earth scientists had the highest median salary and women biologiststhe lowest (Table 30).
..
....%l .Annual salaries in 1974 by field and-degree .level for scientists and engineers
in the National Sample are shown in Table 31.
Business and industry empToYed 56% of the scientists and engineers in theNational Sample.in 1974,'as well as the highest propOrtion of physical scientists,computer specialists, engineers, and environmental scientists. With the exception ofcomputer specialists, these fields were predominantly male - over 90%. Educationalintitutioqi emplded the highest proportion of mathematical scientists, life scientists,psychologists, and social scientists - all of whom have a higher,proporOon of women.Business and industry paid a median annual salary slightly less than the overall median.Tlk federal goverhment paid the highest median salaries of all types of employers, withmedical scientists reporting the highest of any field, $25,000 (Table 32).. _
Nearly three fifths of the National Sample were engaged in either research anddevelopment, or in manageMent or administration., Scientists and engineers engaged inmanagement or administOticip as their primary work activity earned the higheft annualsalaries', except for economists-who were engaged in consulting (Table 33).
There were approximately 265,500 doctoral scientists and engineers'in the'labor force in 1975, according to data collected by the Nationat Academy Science46/Nati.onat Re4eakch Council for the Manpowet ChahacteALstic4 System of the National ScienceFoundation. In DOCTORAL SCIENTISTS AND ENGINEERS IM THE UNITED STATE 1975 PROFILE,NRC reports a median annual salary for all doctoral scientists and engineers of $23,100,up 11% since 1973. Women Ph.D.'s earned substantially less than their male counterparts- $19,N0 versus $23,000, and the discrepancy between the salaries of,males ansl femalestended to increase with age resulting in a difference of between $6,p00 and $7,000 forolder cohorts (Table 34). Further, the salary gap betr n median salaries of men andwomen increased from 17%'in 1.973 to .19% -in 1975.
,further analysis of the NRt data in CHARACTERISTICS OF DOCTORAL SCIENTISTS ANDENGINEE IN-THE UNITED "TATES, 1975 shows that the federal' government and privateindustry continued to provide the highest salaries - $26:000 - about113%,greater thanthe overall median'of $23,100'per year. Salaries paid by state and local governments
32

24
i
were abobt 10% lower than the median level, nd salaries paid to individuals employedby two-year colleges were lowest of all, app oximately 17% below the (Aral' median.The highest median salltry of $33,000 was reported by economists' working in,nonprofitorganizations (Table 35). Detailed bata'on salaries k doctoral scientists andengineers employed in education, business and industry and the federal government
, .
are shown in Tables 36-38.
.
Teaching, the dominant work activitye doctoral scientists andengineers,continued to provide the lowest annual salaries. Iri 1975, the median annual salary ofPh.D's who reported teaching as their primary work activity was $20,600 - $2,500 peryear below the overall median. Highest salaries were reported by manage.rs, while thoseindividuals engaged primarily in management or administration of research and develop-ment reported higher salaries then their peers in other activities. Again, economistsengaged in management or administration earned the highest median salary - $36,400(Table,39).
- By geogaphic area, se scientists and engineers working in the MiddleAtlantic region earned the highest salaries, with economists working in the MiddleAtlantic reported the highest median salary (Table 40).
Median annual_ salaries by, years of professional experience and by age fordoctoral scientists and engineers in 1975 are presented in Tables 41 and 42.
In 1975, members of racial minority groups accounted for about 6% of thedoctoral scientific and engineering population in the U. S. Asians were approximatelyfour fifths of the racial minorities inc1975the same proportion as in 1973. Blackengineers reported the highest median salaries ($25,100), followed by black chemists(Table 43). White doctoral scientists and engineers( earned Kigher median salaries than4any minority group.t
1
6-The,1976 NATIONAL SURVEY OF COMPENSATION PAID SCIENTISTS AND ENGINEERS
ENGAGED IN RESEARCH AND DEVELOPMENT ACTIVITIES, conducted by the Cotumbuz Labotatoltiersthe Battette Memotiae 1114,ti,tute for? the Enekgy Roeateh and'Devetopment Adminat/Lation,
presents, salary data from 7,617 establi ents covering 72,735 scientists and engineersspending more lan 50% of their time in,re arch and development activities.
For bachelor's. degree nonsupervi ory scientists and engineers, by working-as-occupation, aeronautical and astronautical e gineens reported the highest mean monthlysalary, $1,930; followed by by physicists at $1,860. Agricultural and biological .
scientists had the lowest mean monthly salary, $1,292,(Table 44). For mastei.'s degree.no6supervisory scientists and engineers, aeronautical and astronautical engineers againhad the highest monthly salary of $2,030 and physicists were second at'12,005. Agri-cultural and Biological scientists again earned the lowest monthly salaries of $1,565(Table 45). At the doctorate level, chemical engineers reported the highest meanmonthly salary of $2,369 and agricultural and biological scientists the lowest at $1,907(Table 46):
By type of establishment, bachelor's degree scientists and engineers earnedthe most at federal establis mentS, master's degree personnel at contract researchcenters and doctorates i ndustry (Table 47).
By highest degree held, physicists earned the highest slarils and life
Scientists the lowest at all three degree levels (Table 48).Nor
Women with comparable education and work experience earn substantially lowersalaries than their male cohorts in all fields reported (Table
3
33

Sa aries have continued to climb, and fn many instances ubstantially, con-cludes vey by INDUSTRIAL RESEARCH of salaries paid scientists, and engineersemployed in research and development. Thirteen percent of respondents to the.survey ireported laries in the "over $31,000" category, with an average salary in ease from1976 of sl ghily Dver,9% (Chart 6).
, . .. ?
,Salary gains for the individua profeSsions averaged over $2,000 above 1976,with mathematician's receiving the small4st increase (probably because they made the
.
..., highest gain last year): Highest average income continues t go to aeronauticalengineers, who averaged some $5,000 per year more than.the ii ustrial engineerS, stillin the bottom rank r the third straight year. Bi.oldlgists, ho had been the lowest,then next to the st, edged out chemists and moved into t third rank from thebottom in 1977 (Cha 4). (
_
25
fr
' Increase in salary with years of experience is shown 'in Chart 5.*,
The aveage.salary'for R & D scientists and engineers without a bachelor'sdegree has increased more than $1,500 since 1\976. The'spread in the educational levelin 1977 shows the scientist/engineer with an MS degree avIraging $1,617' per-year morethan the person with a BS; and the Ph.D. averaging $2,25 ,imore than the aYerage MS(Chart,7).
Average salaries for selected white- collar occupations in,
private industryrpse 6.9% in the year ended March 1977, according to preliminary data from the annualsurvey by the U. S. DepaAtment oti Labor. The'increase is the third largest recordedin the 17-year history of the survey. For clerical jobs, increases averaged 6.6%,while professional, 'administrative and technical occupations rose 7.1% (Table 50).For comparison,' Table 51 presents similar data for the March 1976 period.
The 1977 study of salaries of experie eitchewists and chemical engineers,condUcted annually by the Ametican Chemicat S 'ety, sMws that the overall median
. annual salary of chemists inEreased,6% betwe March 1976 and March 1977. For B.S. -
chemists, the median salary is $21,000, up 69;- for master's, $22,000, up 7%; and forPh.D.'s, $26,000, up 5%. Median salaries chemical engineers'increased 7% overall,with bachelor's degree engineers up 8% to $28,000; master's degrees up 11% to $.30,000;and Ph.D.'s up only 3% to $3o,p00 (Table 52).
By and large, industry continues to pay more than other employers of chemists.The median salary for Ph.D.'s in manufas_turing.industq is $29,500 and for' B.S. chemists,$22,000.i Government is not far behind', however, paying a median of $28,000 fbr Ph.D.chemists and $21,006 for 8.5,1s. Hbwever, the highest of all salaries reported were.from the relative handful of self-employed chemists, with the median for B.S. and M.S..'s%at $26,000 and for Ph.D.'s, $30,000. On the low end of the salary scale are thosechemists who work in educatiOnal organizations (Table 53). ,Table 55 presents comparisondata for 1976.
1 )
The best paying jo b for a chemist is in management or administration. ForP,11.0.'s in such activities, the median, salary is $35,000 a year; for M.S.'s $29,000 andfor B.S.'s, $27,000 (Table 54).' Table 56 presents 1976 data for comparison.
Inorganic chemists earn the highest salaries at the B.S. level; polymerchemist's at the master's and Ph.D. levels (Table 57). .1976 comparative data are shownin Table 59.
B.S. chemists working in the Middle, Atlantic region earned the highestsalaries - $22,500, followed6Y-Illose working in the West South Central and South
4 Pfge

26
Atlaritic at $22,000! M.S. and Ph.D. chemists also e n most in the Middle Atlantic area
- $23,000 and $27,000 respectively (Table 58). Tabl 6Npresents comparakve, data for
1976.
A comparison of salaries of chemists working in industry with'all chemistsfinds that inddstrial,cheMists earn more at all degree levels and at all years of
experience (Table 61). ,Table 63 presents comparable data for 1976.
The salaries of women chemists continue to be lower than men, no matter wherethey work (-Table 53), what they do (Table 54), 'what specialty they chose .(Table 57),their.4gree level.or years of experience (Table 62). Part of the average differentiail
results from men being generally older, tending to work more in industry and`1ess.iflacademic institutions, and impoqantly having management or administrativ'e positions.However, the,salary difference between Men and women does not disappear when these
factors are- filtered out: .
Table 65 presents 1977 median' salary and 1976. income of chemists, while Table67'p esents similar data for 1976 median salary and 1975 income. Tables 66 and =68 show
salaries and income for chemical engineers:
, ! A first attempt at a census of biologists by the Arne/Licari InAtitate o66iaogicai Sciences showed great, diversity in "disciplinary specialty" of respondents;wide variation.in age, specialty and degree level among the 43 of 2,069 respondentswhb indicated that they;were unemployed and see ing employment; and a wide variation in'salaries among these whb were employed. By ty of employer, those biologists working
in the federal government earn the most money Table 69).
Women biologists earn lets than their male cohorts at al-1 degree levels'. _Among
the respondents tothe AIBS survey, women bachelor's biologists in the 20-29 age groupearned $1,000 less than thegmen, but the same'at the master's level,'and $1,700 more
at the Ph.D. level. However, as the age of the respondents rise, the-salary differentialwidens (Table.70).
The 19th annual survey by INFOSVSTEMS of data processing salaries shows a
leveling off of wages in data processing. 'The net gain for all 28 positions include
in the 1977 survey was just 3.6% compared to a 6.8% increase in 1976. The survey
results are based n returns from 2;015 computer sites and cover 23,047 employees as
of March 1, 1977.
By type of job, junior computer systems analysts experienced the highest,increase from 1976 in average ,salary - a 12r5in to $309 per week, while manaprs4supervisors of computer operations had a 3.9% decrease in averag4 weekly earnings
t
(Table 71).
Data procesing'personnel earn more working in the New England area than -lin
other geographic regions (Table 72).
Average annual salaries for selected positions in state and territorial public
health laboratories ate collected by-the U.S. Department o6 HEW, NIA& Heath Sekvice.
As in previous years, Alaska -"tads all antes in salaries paid to all positions studied
in 1975- (Table 73)-
\:
,
Average salaries in 1975 range from $6,145 for lab aide I to $25,139 for lab
directors. Medium level microbiologists averaged $14,260 while medium levq] chemists'
earned\$14,395 (Table'74).
351

6.0
SOURCE: National,Science Foundation, Characteristics of. the National 'Sample ofScientists and Engineers, 1974, Part '2: Employment, NSF 76-323
0.
TABLE '30'
MEDIAN ANNUAL SALARIES OF SCIENTISTS AND,ENGIN1ERS BY FIELD-AND SEX, 1974
F JJ L Dt . )
TOTAL MALE FEMALE c,
PHYSICAL SCIENTISTS 4 $,9,500 $20,000 $15,000. Chemists 18, 0 19,400' 14,400
Physicists/Astronomers 21,300 21,700 *". Other Physical Scientists ). 21,700 21,100 -.*
MATHEMATICAL SCIENTISTS 19,800 20,100 15,600
15,400Mathematicians 19,766 . ,20,000
Statisticians 20,000 20,100 16,100
'COMPUTER SPECIALISTS 18,400 18,600 1t,300
ENVIR0tMENTAL SCIENTISTS 20,100. 0,100 14,400 ,
Earth' Scientists 19,7.00 .19,700 .20,700
Clcearer 14,300 . J20,800
- - 22,360
- *
.' *Atmospheric Sc4entists 22,300
ENGINEERS 19',400 % '.19,500 .15,600
LIFE SCIENTISTS 17,800. 18,100 13,500
Biological Scientists 17,900, : 18,500 13,500
Agricultural Scientists 17,100- 17,200 ,*.
Medical Scientists 3 1.9,700 21,000 1'5,200 ..4'
PSYCHOLOGISTS 19,400 19,900 17,200
SOCIAL SCIENTISTS _20,2.00 ! 20,900 16,100
Economists 22,300, 22,800: :.717,300.
SociologisWAnth'ropOlogists 1,9,000 19,700 16,800
Other Social Scientist's 44N ft- '18,600 . 19,400
,,
13,900
TOTAL ALL'FIELDS : 194515--- 19,400 15,700
.44*Less than 20 sample cases reported.
-36
O
27
1

28
0
SOURCE: National Science Foundation, Characteristics of the National Sample ofScientists and Engineers 1974, Part 2: Employment, NSF 76423
h
TABLE' 31
MEDIAN ANNUAL SALARIES OF SCIENTISTS AND ENGINEERS BY FIELD AND DEGREE LEVEL, 1974
FIELD .LEVEL.DEGRE
Bachelor' Master's Doctorates
PHYSICAL SCIENTISTS . $17,100 $1.9,0000. $21,800
Chemists. 16,500 17,900 21,500
Physicists /Astronomers 19,400 21,100 -' 22,100
Other Physical Scientists 20,200 20,50'o )2,800
MATHEMATICAL SCIENTISTS 19,400 18,100 21,200
-MathemAicians 20,400 17,500* 1 20,800
Statistic fans - 17,100 " 19,700 s' 23,400
COMPUTER,SPECIALISTS 18,000 19,000 22,200
ENVIRONMENTAL SCIENTISTS 19,600 . 22,000r--.....19f60
Earth Scientists 18,700 1.9,300 21,700
Oceanographers . * 191600 21:500.
Atmospheric ScientiSts 21,900 21,100,
26,900
ENGINEERS . 19,100 20,100. 23,200
LIFE SCIENTISTS 15,800 15,500' 20,300
'Biological Scientists 14,600 14,400 19,900
Agricultural Scientists 16,300 16,600 - Q,600'
Medical.:ftientists 14,000 16,900 t ,-41,000
PSYCHOLOGISTS 15,800 17,100 21,100
SOCIAL SCIENTISTS, ' 17,800 17,900 22,300
Economists 19,900 20,800 24,200
Sociologists/Anthropologists 17,500 . 15,700 20,9000Other Social Scientists 16,100 1 16,900 *22,,000
TOTAL ALL FIELDS 18,800 1 -19,400 ,21,900 -
* Less ,than 20 sample cases reportq....-
r
I
^- SP.
I
7
409

_r e-
iF
t . _SOURCE: National Science Foundation, Characteristics of the National Sample of Scientists and Engineers 1974 Part 2; Employment, NSF 76-333.
TABLE 32.
. ,. ./
. . AMP .,.
ADIAN ANNUAL SALARIES OF SCIENTISTS AND ENGINEERS BY FIELD AND TYPE OF EMPLOYER, 1974,
.
.. ,.,
,
FIELD
.-i,
TYPE OF EMPLOYER
,
,
Business
&
Industry
4-year
College/University
2-yearCollege
OtherEd. Inst.
Hospital/Clinic
Non-ProfitOrgani-zation
federalGovern-ment
StateGovern-ment'
Local
Govern-ment
OtherGovern-ment Other
Physical Scientists $19,700 $18,700 $17,600 * $18,300 $21,400 $21,700 $15,600. $18,200 $19,500
18,400Chemists 19,000 18,700 17,700 * 17,700 18,300 20,300 14,300
,.,48,200
16,500 18,300
Physicist/
Astronomers 22,300 4 18,500 17,400 * * 23,500 22,600 18,900 * * 21,9000&r Physical
Scientists 21,600 18,000 * * 1' -* 23,900 * 20,000 * 22,600Mathematical scientis'ts 20,700 .19,400
..
16,000 * * 23,100 21,700 15,000 17,000 * 20171)ON
Mathematicians 21,800 19,200 .. 16,000 * * 23,900 20,900 --.* 16,800 * 20,200
Statisticians 20,200 20,200 * * * *ir
23,200 14,200 17,400 * 21,800Computer Specialists . 18,200 17,040 * * * 17,800
-,..i
20,900 15,700 18,300 19,500 19,300.L.-
Environmental Scientists 20,200 19,300 18,100 *4
* * 21,400 14,900 19,600 _20,800 19,300
Earth Scientists 20,200 18,800 18,100 * * * 20,600 14,700 18,900 20,800 18,800
Oceanographers * 21,400 * * * * -22,100 * * * *
AtmosphericScientists , * 20,900 . * * * * 22;800 * * * *
Engineers 19,000 20,800 18,500 19,700 * 20,700 22,300 17,400 19,400 19,400 19,700LifeSicientists 18,300 19,200 16,500 13,600 15,200 , 15.7600 17,700 13,900 15,000 * 17,000
BiologicalScientists 1e,900 .19,000 15,700 213,400 * 11, 16,000 14310 14,100 15,406 * 16,800
Agricultural
Scientists 17,900 18,600 * a* * * 17,100 13,400 14;700 * 20,.100
Medical Scientists * 20,700 * * 15,700 * 25,000 * * * 17,600
Psychologists 19,600 19,300 18,300 19,400 18,300 21,300 22,700 17,700 18,400 ,* 25,700
Social Scientists 24,300 20,100 18,200 1e700 16,400 17,500 24,600 14,100 17,900 25,500 20,800
23,700Economists 24,500 21,100 * * 23,400 24,600 16,700 21,400 *
--- Sociologists/AnIhropologists *
.
19,400 * * * * * * - * 0!
Other SocialScientists 23,600 19,900 Iv * * 16,700 24,700 12,700 17,500 t
Total All Fields . 19,000 19,400 17,400 19,000 17,500 20,100 21,700 16,400. 148,900 19,400 19,6400.N)
1.3!2.
kr)
6* Les, nthat,20 sample cases reported.
3 , 39. .,,.....) ...
_

SOUikEE: National Science Foundation; Chlaracteristics orne,National Sample of Scientist; and Engineers, 1974, Part 2: Employment, NSF 76-323-
41.14: TABLE 33 .
.
,hI ANNUAL'-ALAkIES OF SCIENTISANOSNOIEERS--BY fIELD1AND PRIMARY WORK ACTIVITY, 1974
.
.F I L D 4'. .
P,RIMARY WORK ACTIVITY. ,
.RESEARCH
AND
DEVELOPMENT ,cResearch
, H 11 TE svi NM
MANA-MENTORADMINIS-TRATION
ilt v I
.9.,,R,^ADMINI TION
T.
...,TEACiniG
PRODUCTION/ICONSUL-INSPECTION .,TING
I.- -
OTHER -'ACTIVITIES
r
*Basic *-
AppliedResearch
Develvp-,ment/Design ,
OfR & D
Oth_er
ThanR & D
PHYICACSCIENTISTS "° $19,000- $18,800'"418,600 118,500 $24,506 $25,600 $21,700 $19,000 ' $15,500 $20,000 $17,600' Chemists 18,200 ,18,-,009,000 174,4,00 23,800 25,000 21,04' 19,200 15,200 20,600 16,900
Physicists/Astronomers 20,900kob.,ir.,
21,300 21,100 ,20,500 27,100r 28,900 22,700 18,800 "i":1-.!.'..1.9,200 21,200 17,900Other Physical" --.
Scientists ... J2,400 :;-'2;500 22,700 21,700
e. -,
26,100 27,200 21,700..
.18,600 * 18,800MATHEMATICAL SCIENTISTS -.21,400 -42,:4,00 '"21,700 19,400 24,200 25,600 23,000 18,000 18,300 23,700 18,500
Mathematicians 21.300 22,100 22,000 19,300 24,100' 25,700 22,700.
17,800 16,800 23,900 19,200 ,Stati stiCians . 21,800 * * 6-4., 4,600 25,500 23,600 19,900 * .* ' 18,000
COMPUTER SPECIALISTS 19,100 * * . 18,800 20,700 23,300 20,100 18.,9f0 ,_ 19,300 20,000 17,700ENVIRONMENTAL SCIENTISTS 20,100 20,200 20,200 18;701. 22,900 25,0001.,800 18,9.00 19,200 20,100 18,700
Earth Scientists 19'700 20i300 19,500 17,900 22,600 24,500 21,1100 18,800 -18,700 20,100,
18,500Oceanographers-
.
19,600 * * * r, * * * * * *AtmosphericScientists 22,800 * 22,800 23,800 "* 22,100' * 23,200 * 19,800
ENGINEERS 18,300 19,400 20,400 18,100 22,600 24,600 21,600 ., 20,400 ''417,800 ' 20,000 ;8,300LIFE SCIENTISTS 17,900 17,10C(''^ "18,000 18,200 19,000. 22,400 17,700 18,500 15,900 16,000 15,200
Biological tists, 17,300 16,800 17,700 18,700 - 21,300 22,500 19,500 18,200 14,900 14,700 14,400i;`Agricultural`Scientists 18,000 ' 18,600 18,100 16,800 17,800 21,100 17,100 18;200 16,500 16,400 _ 15,100
...;Medical Scientists 18,800 ,18,900 18,800 . * 24,300 25,000 20,700 . 20,100 * 15,700 . *.,..,"-ISXHOLOGISTS 500 . 19',400 19,400 * 22,200 25,400 20,700 18,700 * 19,100, 17,700
SOCIAL SCIENTISTS 20,200 :,'Il 21,100 * 23100 24,900 21,200 19,800 20,800 17,700° 17,900Economists . 22,000 20,700 25,400 28,100 24,500 20,800 * 32,200 20,900Sociologists/Anthropologists 18,400,'' `r
4.22,700
* *, V21,100 17,900 - 21900: .18,900 * * 16,100
Other SocialScieritteiles .
4.4, N.,181160'
-1,.
16;606% *.
t..
19,900 20,600 19,300 19;800 * 14,200 14,400TOTAL, 'ALL FIELDS .18,400 e- 18,900 19,800 18,100 22,600 24,700.-
.._,_
21,200 19;200, 17,600 19,600 18,000* Less than 20 sample cases Aportedtz,
CA)0
. 41. -
^ $

31
SOURCE: National Research Council, Doctoral Scientists and Engineers in the UnitedStates - 1975 Profile, 1976.
.TABLE 34
NUMBER AND MEDIAN ANNUAL SALARY,OF DOCTORAL SCIENTISTS AND ENGINEERS. BY SEX AND AGE IN 1975
AGE IN 1975 TOTAL LABOR FORCE MALE FEMALE_}SalaryNumber Salary Number Salary Number
Total*.
265,534 $23,126 242 346, $23,509 23,188. $19035-Under 30 9,848 16,929 8,246 '17,224. 1,602 '15,91630 - 34 57,099 , 18,811- 51,816 .,, 18,967
i
5,283 16,82935 - 39. 55;628 21,532, 51,377 .10,794 4,251 - 18,327'40,- 44 41,729 24,226 38,824 . 24,455 2,905 19,94745 ?. 49 34,948 26,156 31,886 26,552 1,062 21,27650 - 54 29,491 28,068 26 992 28 614 2,499 22 25755 - 69 18,863 28,151 17,342 28,588 -1,521
60 - 64 11,493 28,532 10,296 29,20'0 1,197
.21,627'
. 22,677Over'64 6,156 27,713 5,357 28,478 740 22,374
*Includes those not reportpg,age.°ItNote: Medians were computed for full-time employed civilians only.
salaries were mutliplied by 11/9 to adjust to a full=year scale:a
A
0
Academic

F
43
SOURCE: National Science Foundation, Characteristics of Doctoral Scientists nd Engineers in the United States, 1975, NSF 77-309.
TAB.
'MEDIAN ANNUAL SALARIES or DOCTORAL SCIENTISTS AND ENGINEERS BY FIELD AN6\TYPE OF EMPLOYER, 1975
F I E L.D
. TYP-E OF EMPLOYER.
TOTAL.
EDUCATIONAL INSTITUTION90111, ' '"' " ..
Business
Industry
and Total 4-YearColleges
2-Year
Colleges
Elem.
Sec.School
Hospital/Clinic
Non-ProfitOrganl- ...,
zationFederal
GovernmentState
GoVernment
ALL FIELDS $23,100 $26,000 $21,400 $21,400 $19,200 t20,600 $21,800 $24,400 $26,200 $20,900
PHYSICAL SCIENTISTS.
23,900. 25,900 21,000 21,400 18,500 13,,700 ' 22,300' 23,900 26,000 18,200
Chemists 24,000 25,900 20,500 20,700 18,800 14,000 21,300 ~ 23,600 26,300 17,800
Physicists/Astronomers .23,600 25,900 22,000 22,200 18,000 * * \. 24,300 25,700 *
MATHEMATICAL SCIENTISTS 21,200 ' 25,600 20,500 20,500 18,300 * 4,- \26,200 27,509 *Mathematicians 20,900 25,100 20,300 20,400 18,200 * * 26,800 26,000 *
Statisticians 23,100 24,400 22,200 22,200 * * *,
* 3b,200 *
COMPUTER SPECIALTSTS . 23,400 23,900 22,700,
22,700 . * * -' * * 24,800
ENVIRQNMENTAL SCIENTISTS 23,400 26,100r
20,900., 21,100 18,300#' *.
* 23,500 27,400 20,400
Earth Scientists 23,500 '' 26,400 20,800 20,900 * * * 24,000 27,600 20,200
Oceanographers 22,10b * '19,700 20,000 * * * * 28,500 *
AtmosphericScientists 4 24,100 , 22,600 23,000 23,100 * * * 24,300 27,100 *.
ENG
,INEERS 25,200 26,000 23,600 26,600 21,000 * * 25,800 26,60b 19,500
LIFE SCIENTISTS 22,200 .25,500 20,900 21,000 18,000 fr'-
17;600 24,000
_
22,890 25,400 20,600
Biological. Scientists 21,300 24,900 20,300 20,400 17,800 18,000 21,900 20,900 25,200 20,400
-Agricultural
ScientistsI
22,000 23,200 20,800 20,800 * * * * 24,900 19,100
Medical Scientists -, Ns25,00 29,900 24,100 24,100 * * 26,300 25,600 2 ,900 26,300
PSYCHOLOGISTS 22,100 30,500 21,000 20,800 23,000 22,300 21,300 24,200 - 26;700 -21,800
SOCIAL SCIENTISTS 22,100 28,300 21,200 , 21,200 20,900 * ' * 6,200 28,900 22,300
Economists 24,600 30,800 22,800 22,800 * * * 33,000 27,700 *
Sociologists/ -
`Anthropologists 20,700 *.
20,500 20,600 *,
_
* 18,700 * 47.`
Other SocialScientists 21,200 22,900
,
20,500
.
20,500 ' 22,100 * * 22,500 30,800 21,500
NO REPORT . 25,900 * * * * 1 * * *' * *
NOTE: Median salaries <computed only for full-time employed civilians.* No median was computed for groups with fewer than 20 individuals reporting salary. 44

SOURCE: National Science,Foundation, Characteristics of Doctoral Scientists andEngineers in the United States, 1975, NSF/77=3D
TABLE 36
NUMBER AND SALARIES OF DOCT IEhTISTS AND E EERSEIROLOYED.IN -EDUCATIONAL INSTITUTIONS BY FIELD: 1973 AND 1975
I
Field
1973 1975
Number
Percentdistri-bution
Percentof total
employed
Medianannualsalary Number
Percentdistri-bution
Percent, of totalemployed
Medianannualsalary %
Total employed, .... 132,692 100.0 58,5 19,300 15,3249 100 0 58 4 521,400
Physical scientists . .. . 22,035r 16.6 44.9 18,700 ' 26,141 17.1 47.1 21,000Chemists . . . 11,870 8 9 .. 38.5 18,390 , 14,402 9 4 39.8 20,500Phyiicists/astronomers 10,165 7.7 55.6 19,100 11,739 7 7 61 0 22,000
Mathematical scientists . . 10,700 8.1 84.9 113,700 12,006 7.8 861 ci 20,500Mathematicians . . 9,596 7.2 86.4 18,600 10,655 7.0 87 7 20,300Statisticiags . 1,104 8 73 8 19,800 1,351 .9 75.4 32,200
Computer specialists .. 1,506 1.1 51.7 21,700 1,765 1.2 48 3 22,700Erwironmerval scientists ,,i . 4 5,314 4 0 50.4 18,900 6,170 4.0 49.6 20,900Earth scientists . 4,306 3.2 49.6 18,800 4,754 3.1 48 6 20,800Oceanographers .. . 693 .5 59.4 18,900, 840 .5 63 6 19,700Atmospheric scientists
, 315 .2 46.1 21,500 576 .4 43.0 23,000
Engineers . " . 13,022 s'-'-/-9f' 36.0 20,900 15,306 10.0 35.3 23,600Life scientists . . 39,798 ' 30,0 67.1 19,000 45,115 29.4 67.2 20,900Biological scientistil .. .. . 26,933 20.3 71.9 1'8,800 29,632. 19 3 7A:0 20,300Agricultural scientists . 6,885 5.2 61 9 18,800 8,263 5.4 60.5 20,800Medical scientists . .. . . . .
a5,980 4 ' 55.4 21,500 7,220 4.7 53.6 24,100
15,956 12.0 61.3 19,300 . 17,328 11.6 58.8 21,000Psychologists . .. 1 ... . r.Social scientists .. .. °..., 24,260 18.3 81Q 19,600 28,858 18.8 80.2 21,200
Economists .. .... 6,283 4.7 71.9 20,900 7,2044 4.7 70.0 22,800Sociologists /anthropologists .. 6,187 4.7 91.2 19,400 7,586 5'.0 92.7. 20,500Other social scientists I, 4 11,790 s m 82.2 19,200 14,068 9.2 80.5 20,500
101 .1 70.6 (1) 60 (2) 638 (1)reportreport . ... ..
NOTE Medians computed only for fulltime emp dyed civilians Percents may not' No median computed for grow s with fewer than 20 individuals reporting salary add.to WO because of roundingLess than 005 percent I SOURCE National Science Foundation
45 Q.
33

34
.SOURCE: National. Science Foundation, Characteristics of Doctoral Scientists and
Engineers in the United States, 1975, NSF 77-309
4
gib
14EILLL7
NUMBERS AND SALARIES OF DOCTORAL SCIENTISTS AND ENGINEERSEMPLOYEDA BUSINESS AND_INDUSTRY BY'FIELD: 1973 AND 1975
t.
' field
1973 1975 ,
*
Number
Percentdistri-bution
Percentof total
- employed
Medianannualsalary Number
Percent, distri-bution
.
Percentof total
employed
Medianannual /salary
Total employed 50;022 100 0 :22.1 $23,400 65,876 100.0 25.1 526,000..
Physical scientists . 19,213 384 .39.1 23,000 22,385 34.0' 40.4 25,900
Chemists ' 15,294 30.6 49.6 22,800 18,278 27 7 .50.5 25,960
Physicists/astronomers 3,919 7 8 21.5 _ 23,800 , 4,107 6.2 1.3 25,900
Mathematical scientists 850 1.7 ,6 7 24,200 1,066 1.6 7.6 25,600
Mathematicians 686 14 62 . 24,000 847' 1.3 7.0 26,100
Statisticians 164 3 11 0 25,300 219 3 . 12.2 24,400
Computer'specialists 1,050 2.1 36 0 22,Q0 1,474 2 2 40.3 . 23,900,
Environmental scientists 2,030 41 19 3 23,100 2,978 4 5 23'9 '26,100 ,
Earth scientistsOceanographers .
, 1,933
74
-.. , 3.9.1
22.26.3
23,100
(2)
2,730
_ 76
4 1
.1
27.95.8
26400(1)''
Atmospheric scientists 23 el 3.8 (2) 172 .3 12.8' 22,600
Engineers . . . . . 17,348 34.7 47.9 23,500 22,535 34.2 52.0 26,060
Life scientists 6,821 ..13 6 11 5, 23,500 9,129 13.9 13.6 25,500
Biological scientists . . . . .. 1175 6 3 8.5 23,100 3,568 , 5 4 8.9 24,900
Agricultural scientists 1,828 1 3.7 16 4 22,300 2,687 4.1 19.7 23,200
tviediCal scientists N 1,818. ,3.6 16.8 25,400 7,874 4.4 21.4 29,900
Psychologists 454 2.9 5.6 28,300 4,187 ' 6.4 13.8 30,500
Social scientists 1,246 2,5 4.2 28,000 2,108 3.2 5.9 28,300
Economists .' . . " . , 7831 1.6 9.0 30,700 1,266 1.9 12.3 30,800
Sociologists/anthropologists 63 1 $ .9 (z) 97 .1 1.2 (2)
Other social scientists 400 .8 2.8 25,900 745 1.1 4.3 22,900
No report . 10 el 7.0 (2)4.
14 (1) 14.9 (2)
. .
NOTE Medians computed only for fulltome employed civilians, Percents may not
' less than 005 percent L add to 100 because of rounding .r, No median computed for groups with fewer than 20 individuals reporting salary SOUkCE National Science foundation
.
4b
11/4
1

rr -7
.
SOOCE:,,National Science Foundation, Characteristics of Doctoral Scientists and-Engineers in the'United States, 1975, NSF 77-309
ri TABLE 38
NUMBERS AND SALARIES OF DOCTORAL SCIENTISTS AND ENGINEERSEMPLOYED IN THE FEDERAL GOVERNMENT' BY FIELD: 1973 AND 1975
35
Field '
1973 1975
.
Number
Percenfdistri-bution
Percentof total
employed
Medianannualsalary
.
Number
- Percentdistri-bution
Percentof total
employed
Medianannualsalary
Total employed 17,640 100.0 7 8 $23,700. 19,452 100.0 7.4 $26;200
Physical scientists 4,124 23.4 8.4 23,500 3,787 19.5 6.8 26,000
Chemists . 1,635 9.3 5.3 23,800 1,697 8.7 4.7 26,300Physicists/astronomeis 2,489 1.4.1 13.6 23,300 2,09e 10.7 10.9 25,700
Mathematical scientists 505 2.9 4.0 23,900 572 2.9 4.1 , 27,500
Mathematicians 383 2,2 3.4 23,800 381 2.0 31 *.26,000Statisticians 122 .7 8.2 (2) 191 10 10.7 30,200
Computer specialists 120 .7 4.1 (1) , 211 1.1 5.8 24,800Environmental scientists ' 1,967 11.2 18.7 23,900 2,230. 11.5 17.9 27,400
1,5042 8.7 17 7..-
24,100 11577 8.1 16.1_
27,600Earth scientists .
Oceanographers 174 1.0 . 14.9 23,000 239 1.2 18.1 28,500Atmospheric scientists 251 .1.4 36.7 23,800 414 2.1 --,'1 30.9 27,100
Engineers . 2,679 15 2 7.4 23,500 3,079 15.h 7.1k 26,600Life'scientists . . 5,844 33.1 , 9.8 Zj,200 6,496 33.4 9.7 25,400
4
3,315 18.8 8.9 22,900.
3,535.
18.2 8.8 25,200Biological scientists 0.
Agricultural scientists,,.
1,801 10 2 16.2 22,700 2,144 . 11.0 15.7 24,900Medical scientists . 728 4.1
grt.6.7 26,500
0817 4.2- 6 1 28,900
Psychologists . 960 5 4 p3.7 24,800 979 5.0 3.2 26,700Social scientists . 1,441 8.2 4 8 27,300 2,098 10.8 5.8 28,900
Economists 650 3.7 7.4 ' 26,800 965 5.0 9.4 27,700Sociologists/santhro- .1.)/
pologtsts 79 .4 1.2 (2) 157 (0 1.9 (1)Other social scientists 712 4.0 5 0 27,900 976 5.0 5.6- 30,800
' C,vihan employees only
No median computed for groups with fewer than 20 mdivtduals reporting salary
47
NOTE Median computed only for tullurne employed Percent may not aid toX100 because of ipundIng
SOURCE National Science foundation
04.

SOURCE: National Science Foundation, Characteristics of Doctoral Scientists rand Engineers in the United States, 1975, NSF 10609
TABLE 39
MEDIAN ANNUAL SALARIES OF DOCTORAL SCIENT AOD ENGINEERS 'AFIELD AND PRIM RY WORK ACTIVITY, 1975
.
FIELDTotal
Research & Development I Management or Administration
Teach-ing
Consult-ing
Sales
Prof.
Serv. Other
. ,
No
ReportTotal '
BasicRes.
AppliedRes.
Devel-opment
'
TotalOf
R&DOther'
than R&DOf
BothALL FIELDS $23,100 $23,000 $22,200 $23,300 $23,600 $29,500 $30,100 $27,800 $30,2001 $20,600 $25,400 1V100 $22,100 $23,700Physical ientists
ChemistsPhysicists & e
23,900
24,00023,600.
23,60023,50024,000
23,20623,60022,600
24,10023,50025,000
23,30022,90024,200
30,20030,10031,100
30,400 28,90030,2\00 29,10032,000 27,900
29,900 20,30028,800 19,90032,000 20400
27,601(24,00028,2001* i
24,900*
22,10022,00022,600
25,10026,30023,100
Mathematical ScientistsMathematiciahsStatisticians
21,20020,900
23,100
22,70022,500
23,500
21,20020,90022,600
24,90025,20024;200
21,30021,400
*
29,00028,30029,300
\31,20 27°,300
32,30 26,400* . *'2.
25,400 19,90024,500 19,800°* 21,000
25,60U*
*
*
*
*
*
*
20,90022,600
*Computer Specialists 23,400 22,900 23,900 -23,100 22,500 :30,000 30,800 28,000 26,300' 22,000 * * * *Environmental ScientistsEarth ScientistsOceanographers /Atmospheric Scientists
23,40023,500
22,10022 ,
24,100
23,20023,70020 ,70023,400
22,80023;2002020,300,
23,800
23,90024,100
. *
'23,000
23,4Q0*
**
29,20029,20028,60030,200
29,400 28,20029,400 28,300027,900 *30,900 *.
32,000,1120,200
32,200 -20,200* 19,000* 21,800
24,30025,000' *
t
*
*** ,
121,50021,700*.*
23,50023,100
**
Engineers 25,200 23,800 23,100 23,800 23,900 30,400 30,300 29,800 32,500 22,900 25,500
21,4002070022,600
*
23,900
$3,100
24,50024,10018,30034,900
21,300
23,600
20,20020,60019,30021;600
21,800
25,900
23,10020,80023,90026,500
23,400
Life Scientists
Biological ScientistsAgricultural ScientistsMedical Scientists
22,20021,30022,00025,700
22,100
21,60021,50021,20022,900
22,400
21,50021,30021,50022,100
21,900
.
21,700
22,000,22,00021,100
24,900
22,700
-
22,000
21,700
22,900
24,500
29,30027,60029,10031,600
25,600
30,000 27,20028',600 25,40029,000 27,70032,800* 29,400
26,700 25,200
30,000 20,30027,500 19,70030,100 20,50030,800 23,600
26,200 20,200Psychologists
Social ScientistsEconomistsSociologists/
AnthropologistsOther Sbcial,Scientists
224400. 24,600
20,70021,200
22,90025,000
22;10021,200
22,10026,600
22,10020,300
24,10024;700
22,30022,600
***
**-
,29,80032,700
26,20028,000
28,100 29,80031,3004 34;t001
25,6 25,90027,300 7,700
32,000 20,400
36,400 21,900
* 19,80031,000 19,700
30,40D
33,600,
*
26,400
21,300-*
*
19,500
23,700
30,400
* *
21,700
22,200.25,100
20,60021)800
*No Report 25,900 * * * /.---
------
*-,
* * * * * * *
NOTE: All median salaries were-computed on y for full-time employed civilians,` * No median was computed for groups with fewer than 20 individuals reporting salary.'
p
48
(A)01
49

1
SOURCE: National Science Foundation, Characteri
.1
icsof Doctoral Scientists and Engineers in the United States, 1975,NSF
1 BILL-La
MEDIAN'ANN L SALARIES OF DOC ORAL SCIENTISTS AND ENGINEERS BY FIELD AND GEOGRAPHIC AREA, 1975
N'\'TIELD
. 1 GEOGRAPHIC AREA '
.
Total
New
EnglandAMtl cal
ltec East North West NorthCentral
SouthAtlantic
East `South
Central
,West SouthCentral Mountain Pacific
ALL FIELDS $23,100 $22,t00 $24,600 $22,600 $T,500 $24,100 $20,900 - $22,600fe
$21,900 $23,50D
PHYSICAL SCIENTISTS 23,900 23,600 2 ,900 23,500 22,/000 24,500 21,300 23,200 23,500 . 23,700
Chemists 24,000 23,200 2 ,000 24,100 22,100 ,,24,500 21,500 24,100 21,400 23,400
Physicists"/Astronomers 23,600 24,100 2 ,500 21,900 18,700 244004Z 21,000 20,800 24,700 24,000
MATHEMATICAL SCIENTISTS 21,200 21,400 2 ,400 20,800 . 18,700 22,300 19,400 19,900 20;800 . 22,000
Mathematicians 20,900 21,000 23,300 20,500 18,700 21,600 18,900 19,900 21,0000
21,500
Statisticians 23;100-- * = 23,900 22,300 19,100 25,200 '* * -* ' 24,900 -
COMPUTER SPECIALISTS 23,400 22,300 24,600', 22,300 23,100 -24,000 i * 22,100 25,400 23,400
ENVIRONMENTAL SCIENTISTS 23,400 21,600 44,400 21,700 22,700 24,500 22,000 24,600 22,500 23,600
Earth Scientists 23,500 22,500 '4,300 .21,500 22,000 '4' 24,800 24,200 24,800 22,000.
24,500
Oceanogrlaphers 22,100 16,600 '2,800 * * 24,600 * .* 21,500
AtmosphericScientists 24,100 * * * * 23,400 * *
.,
23,900 23,500
ENGINEERS 25,200 25,000 26,400 23,700. 23,900 25,600 24,000 25,200 24,100 25,800
LIFE SCIENTISTS 22,200 21,400 23,800 22,609 21,100 23,200 20,500 21,200 20,400 22,400
Biological Scientists 21,300 20,700 22,400 21,600 20,500 22,200 19,300 ' 20,200 19,800 21,700
Agricultural
Scientists 22,000 21,000 24,500 22,500 21,000 "6'23,100,' . 20,900 21,400 21,000 22,500
Medical Scientists' 25,700 24,900 27,700 26,100 24,300 27,100 22,600 24,500 21,400 26,200
PSYCHOLOGISTS 22,100. 20,600 23,760 21,200 , 21;200 22,400 20,000 21,100 20,700 22,700
SOCIAL SCIENTISTS 22,100 21,600 '23,400 21,500 20,700 24:300 19,400 20,600 19,800 22',000
Economists 24,600 23,100 28,100 23,600 24,200 26,800 20,800 23,500 20,600 24,400
SocioloTistsAnthropologists 20,700 '20,500 22,200 20,400 19,300 21%500 21,000 18,900 20,200!
-
19,800
Other SocialScientists 21,200
25,900
21,001
*
22,600
*
-
20,6t0
*
19,700
*
- 22,900
*
..r
%--
18,800
*
0,
19,900
,,. *
19,000
*
21,560
*NO REPORT
NOTE: All median salaries were comput d only for full-time employed civilians.
* No median was computed for groups with fewer than 2d individuals reporting salary.
4

. .
..
- .
..
.
coSOURCE: National Science'ioundation, Characteristics of Doctoral Scientists and Enigneers in the United States, 1975, NSF 77-309 co
..
TABLE 41
MEDIAN ANNUAL SALARIES OF DOCTORAL SCIENTISTS AND ENGINEERS BY FIELD AND YEARS OF PROFESSIONAL EXPERIENCE, 1975LA
.
,.
.
.
_.
-
'*
FIELO.
r Total
.YEARS'.-, OF PROFESSIONAL 'EXPERIENCE1 or
less 2-4 5-9 10-14 15-19' 20-24 25-29 30-34 35-3940 or
ormoremNo
Report
ALL FIELDS $23,100 $16,200 $17,400 $194,800 $2E,900 $25,000 $27,500 $29,100 $29,200 $30,200 $29,400 $22,800Physical ScientistsChemists -
Physicists & Astronomers
23,90024,00023,600
17,70017,900
*
18,00017,90018,100
20,30020,60019,900
18,700
18,50120,400
23,40023,400"23,300
20,700
20,60021,500
25,60025,400
26,000
24,20023,80027,100
29.10028,80029,600
26,200
25,80029,500
'29,000
28,800
291600
29,760.-'
29,70029,500
29,80029,50030,710
28,50028,2b0310000'
30,30030,00Q
30,800
31,50030,500
*
27;700.25,900
30,100
28,70028,100
*
23,80024,20022,000
20,60020,100
*
Mathematical ScientistsMathematicians
Statisticians
21,20020,900
. 23,100
13,20012,800
*
16,10016,00016,400
Computer Scientists 23,400
23,40023,50022,10024,100
*
*
, *
*
*
17,400
17,100. 17,500
*
*
21,500
20,00019,90018,90022,200
23,400
22,40022,100
. 22,600
22,900
26,700
25,00025,00024,500"
30,100"
27,80027,300'**
33,600
29,10028,700
*
*
*
28,20027,900
*
*
*
30,90030,500
, *
*
*
30,80030,700
*
*
*
*
**
*
Environmental ScienitstsEarth ScientistsOcvnographersAtmospheric Scientists
Edgineers 25,200 18400 19,700 22,900 24,800 26,800 28,900 31,400
.
31,300 31,400 30,900.
25,300r.Lif Scientists
Biological ScientistsAgricultural ScientistsMedical Scientists
22,20021,30022,00025,700
15,40015,300
*
16,500
16,900
16,40017,000
18,600
,18,900
'18s400
18,800
22,000
22,00021,40021,800
25,500
24,20023,80023,00028,300
26,20026,00024,900.
30,100
27,90027,200
' 26,300
31,500
27,70026,90025,90633,200
29,200'29,50026,60033,000
29,30028,40027,80035,200
23,30022,600
*
24,600PsychOlogists 22,100 15,400 16,700 19,000, 22,400 23,900 $.-26,900 26,500 27,100 28,000 27,700 20,500Social Scientists
EconomistsSociologists/.AnthropologistsOther Social Scientists
22,10024,600
20,70021,200
*
*
*
*
16,500
18,300
16,30015,900
.18,700
20,900
18,00018,200
22,00023,900
20,70Q,
21,200
24,00026,300
23,60023,000
26,20028,200
25,30025,900
28,80030,600
26,60027,800'.28,800-
28,90030,500
27,400
30,10032,000
30,80029,200
30,20031,000
-*
29,600
20,300*
*
20,400No Report 25,900 * , *
*.
* -,
* * * * * ,*I .. NOTE: All median salariei were computed only for full-time employed civilians.* No median was computed for groups with fewer than 20 individuals reporting salary,
. . i
.. ,
... .
51.. .52 . ,.
. .
...
4. . .. ... .
.N . .
.\,.. k-..
.

SOURCE: National Science Foundation, Characteristics.ofDoctoral Scientists and Engineers in the United States, 1975, NSF 77-309
.
TABLE 42
MEDIAN ANNUAL SALARIES OF DOCTORAL SCIENTISTS AND ENGINEERS BY F!ELD AND*, 1975
rJ.
FIELD.-
AGE24 & - ' . 70 &
Total Under 25-29 30-34 " 35-39 40-44 45-49 50-54 . 55-59 60-64 65-69 Over...
ALL FIELDS $23,100 * $16,900 $18,800 $21,500 $24,200 $28,100 $28,200 $28,500, $28;000 $22,900
Physical Scientists 23,900 * 18,000 19;300 22,100 25,200
,$26,200
2;000 28,8Q0 29,300 29,400 25,800 *Chemists 24,000 * 18,200 19,200 22,300 25,100 27,300 280 28,500 29,400 4 25,100 *Physicists & Astronomers 23,600 * 17,400 19,300 21,700 25400 27,200 30,1300 30,800 29,300 27,200
Mathematical Scjpntists-
21,200 *
_
15,400 18,100 20,300 23,100 26,300 28,900 27,900 28;800 '29,800' *Mathematicians 20,900 * 15,400 18,000 20,100 22,900 25,700 28,600 27,600 28,200 30,000 *Statisticians 23,100 * * 18,600 22,100 24,700 28,300 30,200 29,200 * * * '
Computer Specialists 23,400' * 17,500 20,60 23,200 25,200 33,700 29,000 * * *. *
Environmental Scientists 23,400 * 17,000' 18,500 21,600 23,900 26,300 27,800 29,300 27,800 30,600 *Earth Scientists 23M0 * 16,300. 18,700 21,300 23,300 '26,500 27,600 28,600 27,400 30,500 *
. Oceanographers ' 22,100 * * 17,300 20,100 23,700 26,600 * * * * *Atmospheric Scientists 24,100 * * 18,70 23,000 27,600 * 27,800 *. . * .* . *
Engineers 25,200 * 20,100 21,700 24,500 25,900 29,000 30,700 30,800 31,500 29,900 *
Life Scientists 22,200 * 15,900 41;7,800 20)00 23,100 25,100., 26,800 26',700 27,800 28,500, 26,100Biological Scientists 11,300 * 15,400 17,400 19,700 22,300' 25,000' 26,000 26,400 27,400 28,000 * ,
Agricultural Scientists 22,600 * * 17,800 20,200 22,400 24,000 25,700 25,400 25,500 '27,700Medical Scientists 25,700 * 17,100 19,600 22,800 26,800 30,000 30,200 31,300 34,500 32,300 *
Psychologists' .22,100 * 16,000 18,100 20,700 23,200 25,400 26,000 26,700 25:800 25,600 *
Social Scientists 22,100 * 16,0 18,60.0 19,800 22,500 24,400 26;700 27,200 28,400 30,100 *Economists 24,600 * 18; 0 20,500 22,600 25,000 25,700 29,700 30,300 29,700 * *Sociologists/Anthropologists 2Q,700 * 16,100 17,300 18,600 21,200 23,500 24,600 264600 28,000 ' * *Other Social' Scientists 21,200 16,100 - 17,200 18,900 22,000' 24,400 26,600 25,600 27,100 30,100 *
No Report 25,900 * * * * * * ' * * *
I
NOTE: All median salaries were computed only for full-Me employed civilians.* No Median was computed for groups with fewer than 20 jridividtals reporting salary.
54
4

. , .,
.4.
.'SOURCE: National Science Foundation, Characteristics of Doctoral Stientists,and Engineers in the United States, 1975, NSF 77-3090e tat, TABLE 43
,
MEDIAN ANNUAL SALARIES OF DOCTORALVENTISTS AND ENGINEERS BY FIELD, SEX, AND RACE, 197511
.
,
6
FIELDTOTAL
S E X 1 RACE.
,
.
.
.
.
MenWhite/
Women 1 CaucasianBlatk/
NegroAmerican
Indian
,
Asian OtherNo
ReportALL FIELDS $23,100 $23,500 $19,000 I $23,200 $22,800 $20,800 $21,500 $20,600 $23,100PHYSICAL SCIENTISTS 23,900 24,100 . 19,100 I 24,700 22,900 * 20,800 * 23,400
Chemists 24,000 24,200 19,000 24,200 23,800 * 21,300 * 23,000Physicists/Astronomers 23,600 23,700 19,300 23,900' * . * 20,400 * 23,900
MATHEMATICAL SCIENTISTS 21,200 21,400 18,300 21200 21,700 * 20,300 . * 21,900Mathematicians 20,900 21,100 18,100 20,900 21,600 .* 20,800 * 21,100Statisticians' 23,100 23,200 , 22,100 23,300 * * * * *
COMPUTER SPECIALISTS 23,400 23,600. 18,000 23,500 * *, 19,200 * 26,000ENVIRONMENTAL SCIENTISTS 23,400 6,500 19,000 23,300 *( --' ,22,500 * 24,500
, Earth Scientists 23,500 23,600 18,200 23,500 * * 22,100 ' * 24,4Q0Oceanographers 22,100 22,200 * 22,000' ,o6
* * * *AtmosphericScientists 24,100 24,200 * 23,900
,.
* * ,;\ * *ENGINEERS 25,200 > 25,200 20,800 . .25,500 25,100 22,300 * 24:200LIFE SCIENTISTS 22,200 22,600 18;900 22,300 '22,100 * 20,700 * 22,600
Biological Scientists - 21,300 21,800 18,400 21,300 21,600 * / 20,400 . * 20,700Agricultural
Scientists -' 22,000 22,000 20,000 22,000
_
* 18,000 - * 23,600Medical §cientists 25,700. 26,300 20600 25,900 22,900 *-,,,, ' 231,400 * 25,900
PSYCHOLOGISTS 22,100 , 22,760 19,600 22,000 23,400 21;700 * 22,700SOCIAL SCIENTISTS 22,100 22,500 lmoo 22,100 22,100 , 20;800 * 23,200
etionomists a 24,600 24,700 21;400 24,500 * *r 23,300 * 26,100'Satiologsts/
i.--4
AdthropolOgists 20,700\
21,600 18,500 20,800,
23,300 '18,500 * - 21,100Other SocialSci"entist"s 21,200 21,600, 18,200 21,100 21,800 4, 20,700 . * 22,000
NO REPORT 25,900 * * * * *NOTE: Ail median salries were computed oily for full-time employed civilians. ,
.
,'No median was computeefor groups with fewer than 20'individual5 reporting 5alary. . 5756.
.. . . .,..
.,.. ., . .
. .. _

'41
SOURCE: Battelle, Columbus Laboratories, National Survey of Compensation Paid Scientistsand Engineers Engaged in Research and Development Activities, November 1, 1976
t,'TABLE' 44
NUMBER AND MEAN MONTHLYSALARIES OF BACHELOR'S DEGREE NONSUPERVISORYSCIENTISTS AND ENGINEERS BY WORKING-AS- OCCUPATION AND SELECTED YEARS SINCE DEGREE, 1976
WORKING -AS-
OCCUPATIONSELECTED YEARS SINCE FIRST DEGREE
2 4 7 10 13 15 20-21 24-) 25 30-31 Total*Aeronautical andAstronautical. (70) (76) (63) (100) (121) (124) (146) (143) (21 (2,618)Engineering $1,198 $1,353 $1,561 $1,812 $1,992 $2,083 $2,171 $2,172 $2,091 $1,930Chemical (64) (65), (43) , (29) (31) (34) (53) (97) (121) (1,289)Engineering 1,325 '1,415 1,540 1,671 1,838 1,967 2,048 2,065 2,287 1,794Electrical andElectronic (509) .(524) (490) (344) (295) (309) .(415) (515) (40) (9,934)Engineering 1,211 1,357 1,551 1,74 1,875' 1,969 2,072 2,147 2,189 1,742Industrial (11) ( 9) ( 7) ( 3) ( 5) ( 4) ( 5) (12) .( 1) 067)Engineering 1 388, 1,380, 1,546 1,491 1,795 1,725 2,115 2,031 1,775 1,672'Materials. (15) (1.3) (12) ( 8) (10) ' ( .5) (181 ¶24) ( 3) (350)Ehgineering- 1,201 1,290 1,533 1,668 1,695 1,835 2,112 1,918 2,241 1,779Mechanical (132) (118) (94) (84) 156) (71) (96) (1821 (26) (2,474)Engineering 1,235 1,355 1,543 1,707 1,816 1,922 2,057 2,026 2,034 1,758Metallurgical (121 (11) ( 8) ( 7) ( 4) ( 5) (, 8) (20) ( 2) (248)Engineering 1,208 1,338 1;418 1,653 1,637 1,755 2,128 2,012 1,725 1,712Nuclear andReactor (113) (87) ,(36) (25) (25) (18) (52) (50) ( 8) (1,109)Engineering 1,265 1,419 1,650 1,727 1,903 2,123 2,217 2,206 2,212 1,771 .Total (958) (929) (780), (630) (566) (580) (819) (1,093) (1161 (18,840)Engineering 1,229 1,364 1,553 1,737 1,885 1,987 2,097 2;115 2,152 1,777AgricutturalfandBiological (60') (59), (36) (14) (28) (.19)' (32) (27) *( 3) (841)Sciences % 890 996 '1,175 1,210 1,533 1,580 .1,701, 1,750 1,308 1,292Atmospheric,Earth, Marine& (10) ( 7) ( 5) ( 2) ( 6) ( 2) ( 5) (120)space Sciences 1,055 1,153 1,255 1,750 0 1,875 2,050 2,085 1,518
(113) (86) (90). (67) (53). (51) (90) (108) (21) (2,061)Chemistry 1,013 1,140 1,288 1,488 1,495 1,612 1,707 1,723 1,757 1,476Computer (159) (133) (97) (64) .(52) (69) (52) (44) ( 5) (1,812)Sciences 1,141 1,259 1,458 1,629 1,829 1,907 1,894 1_,933 2,015 1,521Mathematics and (20) (31) .(28) (36) (32) . (34)° (30) (30) ( 6) (686),Statistics 1,077 1,226 1,494 1,811 1,848 1,985 2,105 1,935 1,883 1,755
(22) (21), (40) (21) (29) '(36) (461 (53) (11) (751)Physics 1,122 ,255 1,523 1,705 1,802 1,856 2,139 2,162 2,279 1,860
( 1) ( 8) ( 5) ( 2) ( 7) ( 2)- ( 2) (71)Psychology 1,025 1,068 1,265 1,550 1,917 1,975 1,925 1,477
( 81 ( 7) ( 1) ( .3) ( 2) .( 1) ( 5) ' ( 7) ( 3) (101)Economics . 1,075 1,267 1,675 1,258 1,775 1,575 1,595. 2,096 1,525 1,636
Total includes all years since first degree.
58

a
. 42.e
SOURCE: Battelle, Coluilibus Laboratories, National Survey if Comsensation Paid Scientistsand Engineers Engaged in Research and. - Development , November. 1, 1976.
4.
TABLE 45
. _NUMBER-AND MEAN MONTHLY SALARIES .OF MASTER' DEGREE' NONSUPERVISORYSCIENTISTS AND ENGINEERS BY WORKING-ASACCUPAYION AND SELECTED YEARS- SINCE DEGREE, 1976
'WORKING-AS-OCCUPATION
N
. SELECTED YEARS SIVE FIRST DEGREE'2 4 10 13 r 15 20-21 24-25 30-31 Total*
Aeronautical andAstronautical ( 5) (14) (32) (43) (66) (57) (51) (65). (11) (1,024)
Engineering . $1,205 $1,396 $1,659 $1,818 $2,038 $2,067 $2,182 $2,239 $2,070 $2,030
Chemical (17) (36) (22) (30) (26) (16) (29) (26) (10) (696)
Engineering 1,386 1,509 1,645 1,865 2,005 2,042 2.,187 2,443 2,740 1,979
Electrical and,Electronic (69) (149) (179) (207) (193) (164)' (184) "(212) (43) (4,187)
Engineering 1,309 1,41.7 1,603 1,824 1,960. 2,079 2,189 2,236 2,280 1,937
Industrial ( 6) ( 5) ( 4) ( 1) 5) . ( 2) ( 2) ( 89)
Engineering 1,283 1,305 ,1,525 1,625 2,055 1,775 2,275 1,871
Materials ( 3) ( 3) ( 2) ( 8) (.1) ( 7) (11) (14) ( 1) (157)
Engineering 1,291 1,541 1,425 1,550 1,875 2,110 2,047 1,932 2;575 1,888
Mechanical (32) - (50) (36) (44) (30) (32) (29) (42) ( 7) (972)
Engineering 1,335 1,471' 1,584 1,782 1,888 1,957,, 2,056 2,186 2,039 1,852
Metallurgical ( 3) (11) ( 7) (10) ( 8) -( 4) (.8), ( 8) ( 2) (152tEngineering 1,241 ,1,356 1,546 1;575 1,887 1,962 *2,143 2,175 2,812 1,857
Nuclear . (16) (35) (38) (29) (31) (29) (23) ( 7) (651)
Engineering 1,403 1,417 1;618 1,892 2,016 2,119,(26)
2,247 2,282 2,632 1,900
Total (158) (3'33) (385) (374) (316) (357) (416) (84) (8,269)
Engineering 1,325,(320)1,429 1,611, 1,809 1,974 2,060 2,172 2,230 2,313 1,933
Agricultural and , .
Biological 7( 1) (28) (30) (21) '(17) (16). (10) (16) ( 3) (501)'Sciences 925 1,166 1,330 1,453 1,477 1,675 1,810 2,078 1,558 1,565
Atmospheric;. -
Earth, Marine & r 2) ,( 4) )(,9) ( 4) ( 1) \24) ( 5) ( 4) ( 1) (123).
`Space Sciences 1,000 1,250 1,275 1,512 2,075 ,000 1,985 1,850 1,225 1,692
- ( 6) (22) (37) (26) . (24) (31) (39) (56) (10) (854)
Chemistry ',133 1,211 1,368 1,538 1,539 1,729 1,816 1,94 1 1,970 1,711
( 4) ( 7) ( 8) ( 9) ( 3) ( 7) ( 4) (12) ( n (168)
Economics 1,262 1,289 ' 1,500 1,730 1,941 1,982 2,025 2,262 1,750 1,955
Computer (12.1_ (44) (56). (55) (41) (27) (30) (22) ( 5) _(125),
Sciences 1,166 1,297 1,496 1,735 1,898 1,945 2,076 2,151 1;785' 1,698
Mathematics and' ( 8) (10)' (1§) (36) (24Y (28) (22) (19) ...( 2) (507)
Statistics 1,231 1,305 1,532 1,748 1,920 2,041 2,218 2,253 2,250 1,898 ,
( 2) (10) (22) (23) (31) 126) (36). (28) (v 7) (649)
Physics 1,250 1,310 1,615 1,701 1,858 1,930 2,210 2,224 2,332 2,005
( 1)` ( 4) ( 2-) ( 6) ' ( 1) ( 4) (10) ( 4) (113)
Psychology 875 1,212 1,325 1,500_,1,925 1,762 1,860 1,912 1,784
*Total includes all years since first degree:
.5J

a
t .
43
. .
SOURCE: Battelle, Columbus Laboratoriess National Survey of Compensation Paid Scientistsand Engineers Engaged in Research and Development Activities, November 1, 1976.
TABLE 46 .
NUMBER AND MEAN MONTHLY.SALAgIES OF DOCTORATE DEGREE NONSUPERVISORYSCIENTISTS AND ENGINEERS BY!WORKING-AS-OCCUPATION AND SELECTED YEARS SINCE DEGREE, 1976
,WORKING-AS-
OCCUPATIONSELECTED YEARS SINCE FIRST DEGREE
.
-
7-,
. '
,
, ,;-:`
.0
,5 7 10 13 15 18 22. 26 -17 30-31 Total*Aeronautical andAstronauticalEngineering,
( 2)
$1,672-$1,791
( 3) (11) ,
$2,097(22)
$2,129(12)
$2,208(13)
$2,278( 4)
$2,325( 5) ,
$2,675( 2)
$2,000(225)
$2,182Chemical
Engineering(14).
1,771.
(31)
1,841..2,090(42) (37)'
2,64(34) ,
2,357(19)
2,455(22)
2,70100)2,751
( 6)
3,104(753)
2,369Electrical andElectronic /
Engineering(11)
1,643(25)
1,803(88)
1,915(75)
2,126
i(
46}2,141
(4)2,430
(23)
2,283(34)
2,444(16)
2,562(1,010)2,185
MaterialsEngineering
( 1)
1,675
('4)(
1,712( 2)
1,850(10)
2,045(10)
2,080( 2)
11,400
( 4)
2,162( 7)
2,389(110)
2,116MechanicalEngineering
( 4)
1,737(12)
1,787(29)
1,900
(22)
2,072(20)
2,222(15)
2,371
( 8)
2,237( 7')
2,650( 1)
2,375-(329)
2,138MetallurgicAlEngineering
_ (11)
1,693( 9)
1,897( 9)
2,075(131
2,221( 5)
2,075( 8)
2,368( 4)
2,437-
(161)..,
2,087Nuclear ;
Engineering( 1)
1,475
( 7)
1,703'.
(21)
1;210
(23) ,
2,108(21)_,
2,336( 8)2293
( 6)
2:591
,( 6)
2,512(.2)
2,550'(260) ...
2,175Total
Engineering(34)
1,700(99)
1,784(215)
1,951
(215)
2,161(171)
4.2,240
(106)
2,368(80)
2,438(100)
2,592(30)
2,635(3,068)
2,218Agricultural andBiologicalSciences
(11)
1,315
(19)
1,451(35)
1,643(41).
1,834(26)
2,005(17)
2,130(12)
2,312r31)2,294
( 9)
2,547(594)
1,907AtmosphericEarth, Marine 8,Space Sciences 1
( 4)
1,525(17)
1,680(10)
1,900
(14)
1,817'
( 9)
2,036( 3)
2,208( 4)
2362( 1)
2,325(159)
11912
Chemistry(11)
1,575
(48)
1,604(87)
1,765(86)
1,941(69) ,(33)2,041 "2,099
(39)
2,326(9'2)
2,431(14)
2,408(1,429)
2,079 eComputerSciences
( 1)
1,625
( 5)
1,525(15)
1,811
(15)
2,055( 6)
1,933( 3)
1,725( 1)
2,625( 2)
2,250( 2)
2,800(157)
1,943
Economics( 1)
1,775( 2)
1,700
( 5)
1,765( 8)
1,812
( 5)
2,025(12)
1 875
( 7)
2,025(16)
1,968
5)
2,315(13)
2,130
( 2)
2,575(13)
2,76
( 4)
.,2,287
( 3)
2,491
( 1)
3,550( 7)
2,496
( 1)
2,425( 4)
2,8 5
(88)
2,229(254) 0
2,163
Mathematics andStatistics
Physics( 1)
1,525(12)
1,67976)
1,767(72)
2,002(62)
2,179(49)
2,237(34)'
2,361(7412,587
(142,641
(1;128)2,)73
Psychology .
( 1)
1,375(12J1,491
( 8)
1,756
( 7)
1,946( 811,862
( 3)
1,958( 21
2,125(14)
2,339( 2)
2,075(152,)
1,896
*Total includes all years since first degree.'
4k
.
.
/.
'
.
,
4,,
0

44 4
o
SOURCE: Battelle, Columbus Laboratories, National Survey of CorTensation'Paid Scientists_And Engineers Engaged in Research and Development_Activlties, November 1, 1976.
TABLE 47
NUMBER AND MEAN MONTHLY SALARIES OF NONSUPERVISORY SCIENTISTS ANDENGINEERS BY DEGREE LEVEL, TYPE OF ESTABLISHMENT AND SELECTED YEARS AFTER FIRST DEGREE,
1976
TYPE OFESTABLISHMENT& DEGREE LEVEL
.
,
)1
SELECTED YEARS SINCE,FIRSf DEGREE
.
Toial+1 3 5 7 10 13 15 20-21 .24-25 30-31
BACHELOR'SDEGREENon-ProfitResearch Inst.
(103)
$ 877
(128)
$ 975
(119)
$1,10678)
$1,268(53)
$1,305
(45)
$1,591
'(50)
$1,521
(51)
$1,660
(63)
$1,746
(18.)
$,619(1,749)
$1,364
EducationalInstitutions
(26)
/ 961
(91)
1,166
(21)
1,051
(149)
1;311
(1-7)
1,160
(72)
1,421
(14).
1,13901,400
(92)
1,598i
(10)
(84)
1,732
(11)
1,393
(86)
1,822
( 4)
1,956
(97)
1,937
( 5)1,835
.....-,
(178)
2,131
(11)
1,511
(218)
2,166
( 5)
1,895
(40)
2,210
(320)
1,336
(3,201)
1,864(4764)1,939(17,115)
1,683
ContractResearchCentersFederal Estab-lishments
(98)
1,042(772)
1,150.
(116)
1;206(1,026)
1,272
(137)
1,373645)1,394
.(149)1,537(849)
1,521
(169)
1,828
(581)
1,697
(211)
1,966(454)
1,806
(240)
2,1261470)
1,890
125T)2,167(672)
2,012
(263)
2,234(926)
2,034
(33)
2,e38(95)
2,029TotalIndustry
MASTER'SDEGREENon-ProfitResearch Inst.
.
( '3).
1,158
.
(36)1,229
(63)1,286
(57)1,412
.
(55)
1,639
.
(i3)1,706
(44)
1,797
e
1% 8)
1,921
.
(55)2,077
.
( 9)1,552
e ,.
(1,221)1,698
EducationalInstitutions
( 2)
1,225-,
(. 8)
1;181
(- 71
1,189'
(22)
1,338( 8)
1,262
( 5)
1;545
( 4)
1,550
( 7)
2,003
( 4)
1,625
( 3)
1,508
(205)
.1,538
ContractResearchCenters
( 3)
1,275
( 6)
T,275
(56)
1,351
' (43)
1,170
(114)
1,462
': (681
1,400
(93)
1,612
(85)
1,521
(126)
1,854
(104)
1,719
(108)
1,955-023)1,964
(104)
2,073,
(1-10r
2,065
(127)2,184
(92)
2,157
(148)
2,2.95
(83)
2,178
,
(t).
2;237(16)
2,117
(2,813)
1,979(2,121)
.1,936Federal,Estab-lishmentsTotalIndustry
(34)
1,302
(213)-1,372
(26411,454
(329)-
1,586(358
1,7,
'(303)1,945
(253r2,020
(28.9)-
2,146(360)
2,192
(71)
2,333
(7,156)
1,889
DOCTORATEDEGREENon-ProfitResearch Inst. , ,
(3)**1,325
(11)
1,329
(40)
1,551
(63)
1 ,701
(7,3)
1,904
(45) ',(30)*1,907
r
2,125(22)*2,225
(13)
2,251
'
(1,020)
1;932
Educational'Institutions
11)**1,325
C3)'1,758
(15)1,348
427)1,637
(14)1,592
(13)'
1,886
(7)*2,010
(1)*2,525
( 3)
2,241
(258)1,796
',Contract
ResearchCenters
_ (8)**
1,693
(21)
1,686
(60)
1,755
, S
(184)
1,871
(131)
2,090
(152)
2,228
(83)*
2,373
-
(36)*
2,437
(29)
2,554(2,563)2,196
Federal Estab-lishments
(4)**
1,775
* 5)
1,545
(25)
1,563(72)
1,761
(96)1,978
(76)
2,048(213)
2,225
(42)*2,339(121)*2,388
(33)*2;338(109)*2,522
(16)
'2,762(41)
2,598
(1,322)
2,119(4,b62)2,197 '
TotalIndustry
_ (44)**'1,450
(53)
1,655
(138)
1,743(258)
1,947
(25212,137
+ Includes all yeirs since first degree. *Includes only the first year listed in the set.
** Figures for 3-4 years since first degree.
61 to

..
.,,J, 'y ..
.. . '
. 45.
.. .
SOURCE: Battelle, Columbus Laboratories, National Survey of Compensation Paid Scientists andEngineers Engaged in Research and Development Activities,.November 1, 1976.
TABLE 48 .
milimmimmdiNUMBER AND MEAN MONTHLY SALARIES OF NONSUPERVISORY SCIENTISTS AND ENGINEERS
Y HIGHEST DEGREUIELD AND SELECTED YEARS SINCE DEGREE, 1976
!
/ SELECTED YEARS SINCE DEGREE,
1
.
.
HIGHEST DEGREEFIELD 2 4 7 10 13 15 20-21 24-25 30-31 Total°
Engineering'(842)
$1,230(824)
$1 363.(713)
$1 553(561)
$1 749(484)*
$1 888(500)
$1,992(682)
$2,108(864)
$2,122(101)
$2,126(16,267)
$1,775(103)
Chemistry 1 1,048(89)
1157(95)
'1348(63)
1543154)
1637-(61).
1,684
(112)
1,816(163)
1,875(31)'
2,065(2;38611,614
(37)Physics' 1,206
'' (57)
1,309(96)
1561(65)
1731(87)
1867(86)
2,004(86)
2,149(101)
2086(23)
2,226(1,817)
1,876Othei Physical- (41)
Sciences' 1115(24)
1,283(9)
1458(4)
1512(8)
1,662(7)
1,939(8)
1,818(23).
1,914(3)
1,775(392)
1,505Life (73)
Sciences' 946- (601
1,031,
(36)
1172(21)
1286(24)
1464'(23)
1496(32)
r693(35)
799(5)
1535(901)
1,292Social (21)Sciences' 986
'08)1,163
(24)
1325(8)
1550(7)
1553(13)
1,909(18)
1752(8)
1;556(2)
1,300(304)
1;487Mathematics & (113)Statistics' 1,107
(101)
1,272(92)
1_,479
(85)
1,692(68)
1,892(90)
1,933(81)
2,055(77)
2,058(7)
1,867(1,970)1,654
(159)
Engineering2 1,325(292)
1430(310)
1608(345)
1810(337)
11987(279)
2,075(282)
2,182(318)
a 2,255(68)
2,346(7,030)1,928
(2)
Chemistry2 1,250(17)
1277(29)
1461(26)
1569(30)
1645(29)
1,773(4) .
1,942(59)
1,986(11)
24,1429
14)
2,246
(908)
1,823(1,088)'
1,992
(2)
Physics2 1,425(17)
\\ ,360
(37)
1.496
(44)
1
(55)
1,875(51)
1,976(54)
2,204(58)
2,303Other Physical (2)
Sciences2 1,075.(15)
1245(12)
12320(17)
1722(11)
1,938(10)
1,835,(14)
2,192, (12)
2,058(14)
2,362- (347)
1,736Life (3)
Sciences2 1,158(32)
1,187(30)
1,36r(25)
1,471
(14)
1521(19)
1,717(17)
1,751
(21)
2,072(2)
1,700(514)
1,581Social (3)
Sciences2 1,091(16)
1290(15)
1,511
(14)
1682(8)
1700(10)
1,970
(17) ,
14942(8)
14831(270)
1,755(978)
4 .
1,,887-r-
Mathematics 1 (11)
StItistics2 1,143(32)
1300(42)
1532(51)1,758
(45)
1,969(45)
1,990.
(47)
2,162(40)
2,277(12)
2,037'-
Engineering3 -
( i)**
1,670(76)
1,804(187)
1936(182)
2;151
(143)
2 246(87)+2,374,
(39)+2,598
(22)
2,652(2,535)
2,198-
Chemistry3 -
(3)*1,425
(57)
1,672(98)
1,850(101)
2,055801
2,182(57)+2,319
(64)4-2,485 _...:
(23)
2505(1,894)2,203
,
-
Physics3 -
(2)
1,600(25)-
1,689(121)
1,838(103)
2,060(118)
2 206
(64)+
24401(33)+2,541
(20-2,680
(1,794)
2,215Other Physical, -
Sciences3 -
(5)
1,615(1)
1,475
(16)
1684(19)
1,11
(27)
1878(33)
l',691
(26)
2,000(42)
1,834
38)
2 10921)
1917
(13)+
2,453(22)+
2,063
(11)+2,584
(17)+2101
'(2)
2375(111 v
2,29
(430)'
2,097
(57Q)
I, 38
Life -
Sciences3 -
Social -
Sciences3 -
(1T1,675
(Er )1,581
(23)' (21)
11984'2l)
(13) (3)+
1,955 2,375-'8)+
2368(3)
2,158( Sr)
1,993Mathematics &Statist-cs3 -
-
-
(10)
1,785
,1,833
(18)
1,852 2017(11) ..] (41*
24079 1 2,537
(7)+
2,332" (3) 0
2,925(321) ,,
2,150
° Tote includes all yea's since first degree tr,
* Includes both 3-4 years since degree+ Includes only the first :year listed in the set .
1 Bachelor's2 Master's
.
.ates
- Indicat no data available,
t
,
. 62Q:-

SOURCE: Battelle, Col4mbus LaboratOries, National Survey of Compensation Paid.Scfpntists and Engineers Engagedin Research and DevelopmentActivities, November 1, 1976.
)
. .
tABLE 49impaumm
NUMBER AND MEAN MONTHLY SALARIES OFBACHELOR'S DEGREE NONSUPERVISORY SCIENTISTS AND ENGINEERSBY WORKINGzAS-OCCUPATION, SEX, AND SELECTED YEARS SINCE DEGREE,J976
WORKING -AS-
OCCUPATION
SELECTED YEARS SINCE DEGRcE .,
4 7 10 13 15 20-21 24-25 30-31 Total*
Biological and (25) (24) (17) (7) (17) (16) (21) (20) (1) (454)Biomedical Science , $905 $997 $1,272 $1,310 $1,645 $1,675 $1,775` $1,978 $1,475 $1,434
Biological and (29) (32) : (17) (7) (8)- (3)` (7!) t. (7) (2) (325)Biomedical.Sciences2 861 989. 1,019 1',110 1,212 1,075 1;303 1,096, 1,225 1,061
(84) (62) (63) (52) . (40) (43) (72) (95) (16) (1,606)Chemistry 1,026. 1,208 1,312 1,530 1,538 1,663 1,787 1,775 1,885 1,545
. . (29),, (24) (27) (15) (13) (8) (18) 03) '(5); (455)Chemistry2 976 964 1,234 1,341 1,363 1,337 1,386 1,340- 1,345 1,235
Mathematics , I 8) (20) (20) (27) (26) (27) (28) (23) (1) (515)& Statistics) 1,168 1,220 1,492 1,843 1,919 2,049 2,156 1,996 2,075. 1,884
Mathematics (12) (11) (8) (9) (6)' (7) (2 (7) (5) (171)& Statistics2 1,016 1,238 l',500 1,713 1,541 1 ,739 1,400, 1,732 1,845 1,488
* Total includes all years, since first degree. ? Males only,
63
Females wily.
64

1
1
AIIin 1""rimeawryto;h err0
.
imair 4 t':.-$1, I a*ilit71;$ :".:fAV! - Ike+ ; 4e.dwA 4r P:tt. ff
** 44q:.;."0 \
I
: 4.0,,... :1111,
1
4IA1
111.1111.111..111I
1 I
I
1
1
1 I
I
11441rtti
1
I

I
II
1 I
s
1
I ' 1 1
'. 21,,,t
:
: : : : : : : : : :
: : : : : : : : . : : : : : : : : : : : :
mogiNPIINRIVIOW$
, - . II
11
1 1
' 1 1
4
' :1
1 1 1'I
N lit1111
.kataam.*.w.ka
1 11 11 J:ssiz§t.tt$1*.:Ais§tztam
ke...1A1411111
It011111
at-taVAIM.:Aftte
I 1 I [1111

49SOURCE: U.S. Department' of Labor,.Bureaii of Labor Statistics, Press Release dated'July II, 1977.
TABLE 50 .Immmir.NUMBER AND AVERAGE SALARIES'FOR SELECTED PROFESSIONAL, ADMINISTRATIVE,-TECHNICAL AND CLERICAL OCCUPATIONS IN- PRIVATE INDUSTRY, MARCH 1977*
. JD
OCCUPATIONAND
CLASS .
Number*of
Employees
Average Salaries° ....
Monthly, .
Annual
Accountants II .-. 15,271 ,,, $1,219" $14,62416,545,,Accountants II.' 35,169 1,379
Accountants IV 22,227 1,697 I:, 20,367
Chief Accountants II . '1°,197 2,110 25,32031,324,Chief Accountants. III ' 782 2,610
Chemists I i . 2,110 1_2073 12,872Chemists II , 4,171 1,203 . 14,439Cl fists III 9;557 1467 17,600Chemists IV 11,143 1,806 21,674Chemists V . 9,132 2,184 26,234Chemists VI - 4,565 2,544 30,526Chemists VII . -1,564 3,027 361,329.Chemists VIII 438 3,720 44,642
,`Engineers 1 15-,892' 1,218 14,616Engineers II . -, 3,784 1,352 " 16,221
18,696_Engineers III , ,, 92,340 1,S58Engineers IV 125_,903 1,839 22;072Engineers V $51094 , 2,3 35". 25,620Engineers VI - 4642-35 2,448 29,376Engineers VII 17r,933,, 2,750 32;999Engineers AIIII 4;704 3,112 38,063
Engineering Technicians 'I 3,142 811 9N11,35Engineering Technicians II 16-,b33 946
Engineering Technicjans III- 2,056 1,096 ' " 13,151-Engineering Technicians IV 25,460 1,266 15,221,,Engineering Technicians V - 18,327 1,436' 17,237
Attorneys II , 11925 1,661 '1.9,938
Attorneys III 2,504- , 2,122 4,4603D,973Attorneys IV- 2,575 2,581
Clerk, Accounting I . - 96,181 678 8,138Cl-erk., :Accounti n9, n 82,419 866 i 10,388--,
Secretaries II / 78,726 ,.
84 '" '10,100,
11,159secretaries ICI 85,480 930
Orrafters I ., , . 181;1'40 863 10,354
DAfters II 31=,418 1,065 12,833Drafters III .. 29,568 1,319 15,828
Computer Oeratorsi U. , 8,889 789 9,463Computer Operators-III 25 636. , ' 877 10,529,,
12-,5571iComputer Operators IV r 1s,251 1,046
r
* Occupational Employment estimates relate to the- total in all establishmentswithin scope of the survey and notithe number actually surveyed.
° P el ilinaryi, -

50
SOURCE: U.S. Department of Labor, National Survey oftrofessional, Administrative,Technical and Clerical Pay, March 1,976, pp. 12, 13.
TABLE 51
NUMBER AND AVERAGE SALARIES FOR SELECTED PROFESSIONAL, ADMINISTRATIVE,TECHNICAL'AND CLERICAL OCCUPATIONS IN PRIVATE INDUSTRY, MARCH 1976
OCCUPATION
AND CLASS
..
Numberof -
Employees
Monthly Salaries>
Annual Salaries
Mean/
Median Mean Median
Accountants II 15,559 $1,117 $1,083 $13,39.4 $12,995
Accountants III 31,603 1,286 1,263 1542 15,120
Accountants IV 20,498 1,562 1,543 18,738 18,522
Chief Accountants II 1,132 41. .1,897 1,851 22,753 22,212
Chief Accountdhts III . 742 2,345 2,291 28,136 27,489
Chemists I 1,284. 1,040 1,037 12,473' 12,445
Chemists II 3,337 1,174 1,180 14,077 14,160
Chemists III 8,538 1,383 1,374 . 16,589 16;4931
Chemists IV 9,'699 1,703 1,694 20,429 20,3311
Chemsits V 7,555 2,009 1,977 24,09 23,724
Chemists VI 4,104 2,406 2,357 28,868 28,289
Chemists VII 1,477 2,797 2,725 33, 559 32,700
Chemists VIII 412 - 3;394 3,296 40,,423 39,552
Engineers I ' 11,648 1,160 1,151 13,918' 13,817
Engineers II 29,235 1,266 1,250 . 15,184 14,994
ItVgineers III 82;307 1,457 1,438 17,482 17,25.
Engineers IV 119,970 1,730 1,708 20,749 20,496
Engineers V 85;907 2,007 1,994 024,082 23,927
Engineers VI 44,284 2,312 2,280 27,737 '27,360 .
Engineers VII 117,608 2,571. 2,500 30,850 30,000
Engineers VIII 4,526 3,020 2,920 ,36,236 35,040
Engineering Technicians 1 3,005 756 747 9,064 8,960
Engineering Technicians II 12,355 - 904 875 10,841 10,500
ipgineering Technicians III 23,869 1,022 1,000 12,258 12,000
'Engineering Technicians IV 28,795. 1,182 1,173 14;178 14,078
Engihering TeoKnicians V 18,407 L,311--, 1,320 16,086 15,840
Attorneys II 1,565- 1,556 1,500 %18,667 18,000
Attorneys III 1,916 2,018 1,974 24,205 23,691
Attorneys IV y 1,948 2,486 2,457 29,828 29,488
Clerk, Accounting I 91,001 ,637 600 7,636 7,200
Clerk, Accounting II 74,328 805 767 9,652 9,204
Secretaries II 64,553 804 782 .- 9,641 9,384
Secretaries III 69,748 868 845 10,413 10,140. . _ ,
Drafters I 17,602 814 782' 9,763 9,384/
Drafters II . 29,395- 1,003 975 12,029 11,700
Drafters III 31,426 1,274 1,217 15,288 14599
Computer Operators II 8,172 732 713 8,774 8,551
Computer Operators III 21;718 847 830 .10;162 9,959
Computer Operators PL '44V1'. 13,617 991 964 11,881 11,563
68

SOURCE: Chemical and Engineering News, Vol. 55, June 21, 1976 pp. 47, 50;Vol. 56, June X20, 197T, p. 31.
ABLE 52
MEDIAN ANNUAL SALARIES'FOR CHEMISTS AND CHEMICAL ENGINEERS OF ALLEXPERIENCE LEVELS BY DEGREE, 1973,1977 (WEIGHTED AVERAGE)
YEARCHEMISTS CHEMICAL ENGINEERS
.B. S.
$16,800
, M. S. PH.D. B.,S. M. S. PH..D,
1973 $17,500 $20,500 $20,200 $22,000 $23,100
1974 17,500 18,400 21,700 21,300 22,400 24,800
1975 19,000 19,800* 23,000 24,000 25g100 26,000
1976 19,800 20,500 24,700 26,000 27,000 29,000
1977 21,000 22,000 '26,000 28,000 30,000 30,000
69
o

4
,tv52 ;SOURCE: Americah Chemical Society, 1977 Repdtt of Chemists' Salaries and Employment
" Status,.Jyne 1977.
TABLE 53
MEDIAN ANNUAL SALARIES OF CHEMISTS BY TYPE 05, EMPLOYER, DEGREE LEVEL AND SEX, 1977, T
,-Type ofEmOloyer'-
DEGREE LEVEL AND SEX
Bachelor s ,Master's Ph.D.'s.
Men . Women Total . Men :W Omen Total Men Women . Total
Industry
$23,000 $16,A0 $22,000 $24,000 $19,400 $24,000 $29,600 $24,000 $29,500Manufac
_
iturngNon-Manu-facturing 20,000 13,200 19,000 23,600 17,500 22,000 28,800 21,1000 28,000
Edutation '
13)000 11,500 13,000 16,000 '13,500 15,500
-z
20,000
.
16,500 20,000
College/
Univ.
High School,
Other Sthools 14,200
24,500
12,800
21,000
. .
12,800
23,900
17,500
26,000
. 16,000
'21,000
16,600
25,200
15,500
29,000
16,500
"%24,000
16.,000
6'4
29,000
GovernmentFederal
State/Local 16,400 14,300 16,000 18;000 16,300 17,600 22,000 16,800 21,800
Self Employment 26,000 * 26,000 26,000 * 26,000 -30,000 7 * 30,000
Hospital/ind. Lab. 17,300 12,500 147000 19,0001 14,200 16;000 25,000 17,000
,
25,000
Nonprofit ,
Research Inst. 14,000 15,800 15,800 20,000 16,000 19,000 21,500 20,000 25,000
Other s 14,000 * 14,0001,20,000 * 20,000 21,500 * 21,500
*Sample too small for meaningful data.
SOURCE: Chemical and Engineering News, Vol.-55, June 20, 1977,1). 33
MEDIAN ANNUAL SALARIES OF CHEMISTS BY LQ. ACTIVITY, DEGREE LEVEL AND SEX, 1977
DEGREE LEVELAND
SEX
WORK ACTIVI.T Y ,
ManagementResearch &Development Teaching
Marketing &Production.
BACHELOR'S
Men $27,500 $20,500
.
$12,000 $21,000
.
17,300 15,800 12,800 15,000l
,Wome.n___
'Total 27,000 19,900 12-,000 20,76.,.
%MASTER'S
Men 29,600 22,000 17,200
-
22,500
Women 20,000, .
38,400 14,800 14,500
Total 17-29,000 21,000 16,300 22,200
PH.D.
Men 35,000 26,000 20,000 '28,000 ,
Women 28,300 21.$000 16,500 . 25,000
Total ' 35,060 26,000 I 19-,800 = 28,000
70
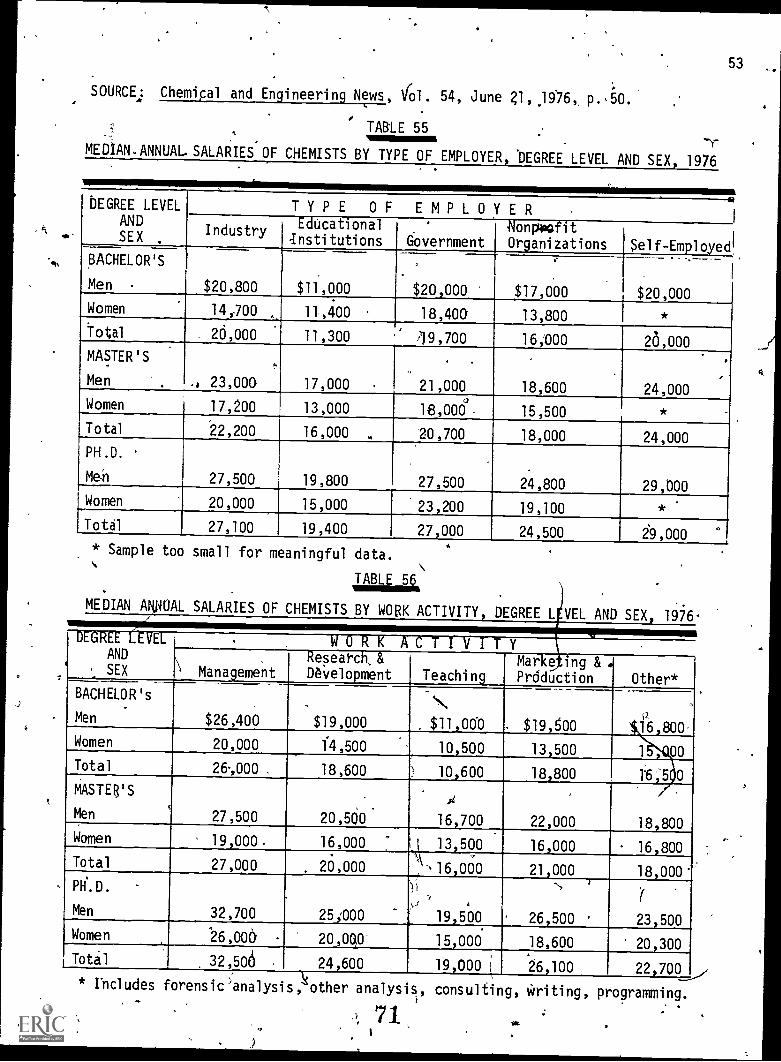
-
53
SOURCE: Chemical and Engineering News, VOL 54, June Z1,106, p.,6
TABLE 55-r
MEDIAN-ANNUAL SALARIES OF CHEMISTS BY TYPE OF EMPLOYER, *DEGREE LEVEL AND SEX, 1976
DEGREE LEVELANDSEX .
TYPE OF EMPLOyER.1
Industry EdUcationalInstitutions Government
VonpoofitOrganizations Self-Employed!
BACHELOR'S
Men . $20,800 $11,000 $20,000
,
$17,000
.
$20,000Women 14,700 11,400 18,400- 13,800 *Total , 20,000 11,300 19,700 16;000 26,000MASTER'S
Men . ,1 23,000 17,000 21,000 18,600 24,000,
.
Women 17,200 13,000 18,006 15,500 *Total 22,200 16,000 20,700 18,000 24,000PH.D.
Men 27,500 19,800 27,500
.
24,800 29,000Women 20,000 15,000 23,200 19,100 *Total 27,100 19,400 27,000 24,500 29,000
0
* Sample too small for meaningful data.
MEDIAN ANNUAL SALARIES OF CHEMISTS BY WORK ACTIVITY, DEGREE L VEL AND SEX, 106-
DEGREE LEVELAND
SEX
, WORK ACTIVITY\ Management
Research, &
DeVelopment TeachingMark4ing & .
Prdduction Other*BACHELOR's
Men $26,400 $19,000 .
N$11,000 $19,600
0
16,800Women 20,000 f4,500 10,500 13,500 1 , 00Total 26.,000 . 18,600 10,600 18,800 16;5 0MASTER'S
Men 27,500 20,500
,i
16,700 22,000 18,800Women 19,000 16,000 " t 13,500 16,000 16,800Total 27,000 26,000 , 16,000 21,000 18,000.D.
Men 32,700 25;000c-, ,
19,500 '
-,
26,500
18,600
(
23,500
20,300Women 26,000 20,060- 15,000
Total 32,506 24,600 19,000 1 26,100 22,700* Includes forensic'analysls, other analysis, consulting, Writing, programming.
,)
71

54
,v/
-64.4.661116
SOURCE: Chemical-and Engineering News, Vol. 55, June 20, 1977, pp. 3a, 35.
r TABLE 57
MEDIAN ANNUAL SALARIES OF CHEMISTS BY DEGREE, SPECIALTY, AND SEX 1977
64
DEGREE
AND
SEX
SPECIALTY -
Analytical Inorganic
i
OrganicPhysical,Theoretical
polymer,Macromol.
Bio-Chemistry
BACHELOR'S
Men $20,000
.
$24;000 $23,000 $23,000 $23,400 $20,000
Women 15,300 16,500 16,200 15,000 17,600 15,800
Totai 19,500 24,000 22,000 22,500 23,000 18,200
MASTER'S
Men
.
21,000 25,700 24,700 24,000 25,000
.
21,600
WoMen 17,200 18,000 18,000 * 19,000 16,400
Total . 20,000' 2440 24,000 24,000 24,500 20,400 ,
PH.D.
Men 24,000 22,000 25,000 '23,500 29,600 27,000
Women 19,000 15,100 20,000 19,600 27,800. 20,000
Total 24,000 22,000 25,000 23,000 29,500 26,000
' TABLE 58,,
MEDIAN SALARIES AND PERCENTAGE' DISTRIBUTION OF CHEMISTSBY GEOGRAPHICAL REGION AND DEGREE LEVEL, 1977
B.S. M.S. PH.D.
GEOGRAPHICALREGION Salary
% Working'in Region Salary
% Workingin Region
-
Salary ,
%,Working.in.Region
Pacific $20,000 11.6% $21,500 10.0% $25,000 9.3%
Mountain , 20,100 3.1 19,300 2.7 23,000. 3.3
West North Central 18,800... 44
4.9 19,000 61 25,000 6.9
East North Central 20,000 23.7 21,200 22.4 26,000. 20.5
West South Central 22,000 6.9 20,300 7.1 25,000 , 6.9 .
'East South'Central 21,500 3.6 '.22,500 36 24,000 3.6
Middle Atlantic 22,500 25.6 , 23,000 26.9 27,000 25.6 ,
South-Atlantic 22,000 , 14.2 22,500 14.2
,
26,000
V
', 16.9
New England 20,500 6.4 22,0001 6.9, 24,500.. 7.0
122 .
#
4.
J

55
SOURCE: Chemical and Engineering News, Vol. 54, June 21, 1976, pp. 49, 51,
TABLE i
MEDIAN ANNUAL SALARIES OF CHEMISTS BY DEGREE, SPECIALTY, AND SEX, 1976
DEGREE.ANDSEX
SPECIALTY - 4:
'Analytical Inorganic OrganicPhysical,
Theoretical15olymer,
Macromol.Bib-'
Chemistry Other*
BACHELOR'S
Men $18,500 $21,000 $21,500 $20,600. $21,800 $17,300 $21,500
Women 14,000 17,600 14,500 19,000 14,500 12,500 15,000
Total 18,000 21,000 21,000 20,000 21,500/ 15,500 26,400
MASTER'S'
Mep .20,600 21,300 22,200 21,500
1
23,400 17,700 21,000
Women 17.,200 16,000 14,000 20,300 17,600 16,000 15,000
Total 20,100 21,000 20,906 20,700 23,100 16,800 20,000
PH. D.
Men 22,600 20,500k 23,400
.
23,000
.
27,000 25,000
.
26,000
Women 18,000 16,000 18,400 16,800 19,700 20,000 18,000
Total 22,000 20,200 - 23,000 23,000 2x7,000 24,000 25,800
.*Includes agricultural & food chemistry, general chemistry, environmental chemistry,. information science and computer work.
MEDIAN SALARIES ANC
D PERCENTAGE DISTRIBUTION OF CHEMISTSBY.GEOGRAPHIAL REGION AND DEGREE LEVEL, 1976
GEOGRRPHICAL
REGION. ,
B.S M. 'S. PH0,_
Salaryi workingin Region' Salary
% Worktngin Region Salary
% Workingin Region
3acifit 119,500 . 13.6 $20;600 12.2 $24,800 12.9
Mountain l' 20,800 3.4 20,000 3.0 -21,560 3.3
West North Central, 113,000. 7.1 18,800 7.2 23,000 7.7
East North CentralI
19,000 ?3.5 20,000. 21.6 25,000 20.2
West South, Central 20,000 7.4 20,400 6.6 23,000 6.5
East South Central 20,000 3.7 ) 20,000 3.8 22,800 3.9
MiddleAtlantic 20,000. 23.7 21,000 26.9 25,000 22.5
South Atlan-tic - 20,000 ,, 13.6 20,400 14.3' 25,400 18.3
New England 21,500 4.0 21,000 4.5 25,000 4.7
73
4
3
7

56,
SOURCE: Chemical and Engineering News, Vol. 55, June 20, 1977, pp. 34, 35.
TABLE 61
1977 MEDIAN SALARIES OF INDUSTRIAL CHEMISTS AND ALL CHEMISTSBY DEGREE LEVEL AND YEARS OF EXPERIENCE
0-
YEARSB. S. M. S. PH, D.
All Industrial All- Industrial AT1 Industrial
1 $11,500 $12,000 $13,200 $14,000 $16,800 $20,000
2-4 13,900 14,000 , 15;500 1y6,000 20,000 21;500
5-9 16;400 16,800 17,500 18,800 22,000 25,000
10-14 20,000 20,000 21,100 22,300 25,20b 29,100 .
15-19 22,000 23;000 22,500 24q000 28,000 31,100
20-24 24,000 24,000 26,000 &7,500 30,000 33,000
25-29 25,000 25,000 26,800 27,500 .-32,600 36,000
30-34 26,200 26,500 26,200 28,000D 33,000.
-
36;000
35-39 26,000 26,300 27,500 29,000, 35,800 37,000
40+ 26;600 26,000 56,000 3a000' 35,000 35,500.
Overall 21,000 22,000 22,000 24,000 26,000 29,500
SOURCE: American Chemical Society, 1977 Report of Chemists'.Salaries and diployme.Status, June 1977,
TABLE 62
MEDIAN SALARIES OF CHEMISTS BY DEGREE LEVEL,SEX,,AND YEARS OF EXPERIENCE, 1977
'YEARS OFEXPERIENCE
B. S. .
'-r.' M. S. PH. D.IMen Women , Men Women Men -Women
1 or less ,$11,500 .$12,000 '' '$13,300 $ 9,500 $16,800 $12,800
2-4 . 14,000 13,200 16,000 - 13,500 20,000 16,800
5-9 ,.- 16,700 15,000 /- 17,800 16,800 22,000 19,000
10 -14 20,400 19,300 .3 22,000 17,500 25,8000 ,
9,300
15-19 23,000 ,,. 17,100 ,23,300 .
, ,, .
19,000 28,200. 20,000
20624 24,500.--,..
19;400 26,500' 20;406 30,300 ,22,000
25-29, . 25,200 -. 22,300 27,000 20,000' 33,000 25,500
30-34 26,500 23,500 27,000 18,000 33,000 211,000
35-39 . 26,500 15,6m ,28,000 , 20,400 . 36,000, 26,200:
40+. ". 26,600, ,, 29,000, 32,200, 55%000' 53,900
All levels 22,00Q 15,800 1 23,000 17,300 26,000, '20,000
ample too small for meaningful data.411.
2, 2

SOURCE: Chemical, and Engineering News, Vol. 54, June 21, 1976, pp: 50,51
TABLE .
19)6 MEDIAN SALARY OF INDUSTRIAL CHEMISTS AND ALL CHEMISTSBY DEGREE LEVEL AND YEARS OF EXPERIENCE
.
YEARS
B. S. ,M. S. PH.D.
All Industrial 6 All Industri.al All Industrial
$11,000 $11,700 $13,000 $14,100 $17,700 $18,500
2-4 13,000 13,300 14;100 15,000 , 19,000 20,000
5-9 ,A5,900 c,16,000 17,500 18,000 21,1t0 '24,000
10-14 18,900 19,000 19,200 20,000 24,000 28,000
15-19 21,000 21,600 . 22,000 24,000 26,400 29,000
20-24 22,500 23,000 23,500 24,700 28,800 . 11,800
25-59 24,000 24,000 25,200 26,000 30,000 33,500
30-34 24,700 24,000 25,000 25,000 31,000 34,000
35-39 25,200 26,000 24,800 26,000 , 32,200 35,000
40+ 25,000 25,000 30,500 .35;500 29,800 29,800
X7,100 .Overall i 19,800 i 26,000 20,500 22,200 24,700
. .
SOURCE: American\Chemical Society, 1976 Report of Chemists' Salaries. and Employ.:ent Status, July 1976.
TABLE 64
MEDIA LARIES OF CHEMISTS BY DEGREE LEVEL,MX-AND YEARS OF EXPERIENCE, 1976
YEARS OFEXPERIENCE
'B. S. M. S. PH. D.
Men Women Men Women Men Women
1 or less $11,000 $11,000 $13,006 $12,500 $17,800 $15,000
2-4 13,200 13,000 ....14,600 13,000 19,000 15,200
. 5-9 16,000 13,500 18,000 15,400 21,200 17,200
10-14 19,000 16,260 19,500 18,000 24,000 18,800
15-19 21,000 19,200 . 22,600 19,000 .27,000 20,000
20-24 23,000 20,000 '24,000 16,800 29,000 21,000
'25=29 24,000 18,500 25%400 19,800 30,000 25,500
30-34 '.-24,700 22,100 .25,000 21,000 31,000 28,000
35-39 '26,000 17,600 '25,000 17,300 33,000-'1'11,3h
40+ . 25,000 15,000 30,500 28,600' *
'All levels 20,000 14,700 21,300 16,000 - 25,000 18,800
* Sample too,smaT1 for meaningful data
75
,;
- 57

tk
58
SOURCE: Chemical and Engineering News, Volume 55, June 20, 1977, pp. 34 36. 5"
TABLE 65
1977 MEDIAN SALARY AND 1976 INCOME OF CHEMISTS B' DEGREE LEVEL AND YEARS OF EXPERIENCE
YEARS OFEXPERIENCE
. 1 9 7 7 SALARY 1 9 7 6 INCOMEB. S, M. S. PH. D. B. S. M. S. PH. D.
1 11,500 $13,200 $16,800 $10,700 $12,500 $15,000
2-4 3,900 15,500. 20,000 13;300 15,000 18,700
5-9 16,400 17,500 22,000 16,006 J7,500 22,0004
10-14 20,000 ?1,100 25,200 20,000 s 21,000 26,000
15-19 22,000 22,500 28,000 22,000 23;000 29.,500
20-24 24,000' 26,000 30;000 24,300 26,300, 31,400
25-29 25,000 26,800 32,600 25,000° 27,000 34.7100
30-34 26,200 26,200 33,000 27,500 27,000 34,000
35-39 26,000 27,500 35,800 27,000 -28,000 36,300
40+ 26,600 30,000 35,000 30,000 30,000 36,800
Overall 21,000 22,000 26,000 21,i00. . 22,300 26,500
4IkSOURCE: American 'Chemical Socqty, 1977 Report of Chemists' Salaries and Employ-
ment Status, June 1977.
1977 MEDIAN SALARY AND 1976 INCOME OF CHEMICAL ENGINEERSBY DEGREE LEVELAND YEARS OF EXPERIENCE
YEARS .OF
EXPERIENCE419 77 SALARY 1 976 I N,C 0 M E
B. S. .M. S. Ph....110. B.S. M.S. Ph. D.
or less $11,706,
.17,000(
$17,000
18,000
$17,000'
22:800
$10,500
15,890
$20,000
18,000
$16,556-
22,6002-4
5-9/19,200 . 18,300 6,000, 18;60 17,600 26,000
10-14 . 23,000
26,000
24,000
29:700
29,000
31,000,.
22,500 .24,000 .29,500
15-19 25,500 30,00 32:500
20-24 28,000 35,000 36,000, '27 ,70Cir 33, Od 36,000
25-29 30,000 32,500 34,800 30,000 32,Q00 35,500
30-34 30,000 34,000 34,506j
30;000 35,000 38,500
35-39 32,400 34,600 31,000 35,0001
36,600 34,5cii
50,00040+ 36,000.
,284000
40,4000
30,000
43,000
-30,000 ''
38,006 40,000
.Overall 28,600 30,000 32,000
'76a,

59
SOURCE: American Chemical Society, 1976 Report of Chemists' Salaries andEmployment Status, July 1976.
TABLE 67
41976 MEAN SALARY iiND 1975 INCOME OF CHEMISTS BY DEGREE LEVEL,ANDYEARS OF EXPERIENCE
YEARSOF
EXPERIENCE
1 9 7 6 SALARY 1 9 7 5 N C 0 .tvl E
/I
..e
'B. S. M. S. PH.D. 8: S. M. S. I PH%D.
1 or less $11,000 \-$13,060-- $17,700 $' 8,900 $ 1,000 $13,000
2-4 13,000 14,100 19,000 , 12,500 ,900 18,000
5-9 15,900 17,500 21,000' 15,600 17,500 .121,000
10-14 18,900 19,k 200 24,000 18,500- 19,000 24,500
15.1A90
21,00022,000 26,400' 21,000 22,800 27,500
20-24 22,500 23,500 28,800 23,000 24,000 30,060
25-09 ; 24,000, 25,200 30,000. 24,000 27,000 312600
30-34 24,700 25,000 31,000 25,000 25,000 33,000
35-39 25,200 24,800 32,200 26,500 26,000 35,700
31,700/.40+ 25,000 30,500 1 29,800 28,000 30,000
Overall 19,800 20,500 24,700 20,000 21,000 25,00(,
TABLE 68.4.A
°1976 MEDIAN SALARY AND 1975 INCOME R CHEMICAr. .ENGINEERS
BY DEGREE LEVEL AND YEARS OF EXPERIENCE 1
A
YEARS OF
EXPERIENCE
1 9 7 6 SAL'ARY 1 9 7 5 1 N 64 MHE
B. S. M. S. PH.D. B. S. M. S. rH.D.;
1 or less $14;300 $15,600. $21,000 $ * $12,700 $17,200
2*- 4 16,100 . 17,000 21,2pd '15,500 16,500 20,700
5 - 9 19,500 20,000 23,300 20,000' 19,500 -. 23,300
10 214 22,000' 24,000 27,500 22,000 X3,600
27,000
29,040
30,000.15 -,19 24,500 27,000 30,000 25,000
20 - 24 r 26,000 27,500 33,000 26,500 28,000 35,500
25 - 29 27,500' 28,900 33,500 27,900 30,000 35,000'
30 - 34 28,500 31,000 f 35,000 29,700 32 000- 40,000
35.- 39 .30,000 30,400 34,000 30,000 32,000 35,000
40+ 26,200 34,200 938,000 31,000' 38,000 . 38,000
A111eve11 26,000 27,000 29,00p 27,000 27,000 30,000a-.
* Data too smal) to be me\ avngful,
77
I
/.'

60
, 4
SOURCE: American Institute of Biological Sciences, Bioscience, Vol. 27,March 1977.
,
.
,TABLE 69'
1.1.111111.1Mili
NUMBER -AND SALARY OF AIBS* BIOLOGISTS BYTYPE OF EMPLOYER AND AGE, 1975
EMPLOYER
AVE BRACKET20 - 29:90 - 34 35 - 39 40 - 44 45 - 49 50 - 54 .55 - 59 60+
444Xr. College
or University
Number 36
,
142 164
'
140 156
.
-169
,
.
170 141Salary $13,750 $16,665 $19,558 $23,857 $26,458 $26,109 $29,853 $29,681
24r. Collegeor University
Number 4 119
,
25 10 10 7
.
8Salary 18,125 18,553' 20,000 .18,000 22,750 25,714 211,250 26,500
Government
Number . 22 27 27 25 31 30 31 23Salary_ 13,409 18,611 21,667 24,300 254726 29,167 30,323 %33,261
Industry
Number, 19 18 . 15 12 11 19 -9 8_ Salaryg 11,053 18,194 24,667 27,292' 25,225 28,64 29,444 33,125Other**
Number
.
17 42 ' 21 i , 14 21
.
22 "+16 19Salary 11,471 14,048 19:643 22,857 23,690 23,977 24,688. 27,763
* American Institute of-Biological Sciences/4 Other includes high school teachers, medical doctors, and sAf-employed persons.
TABLE 70,
'4141 ANNUAL SALARY OF.AIBS'BIOLOGISTS BY AGE, SEX AND DEGREE LEVEL, 1976
DEGREE
&-SEX
Bachel'or'sgr's
Men
0
AGE AND SALARY
20-29 ' 30-34 35-39 40-44 45 -49,11
50-54 -554.9 .fi0+ .
$11,000 $14,100
/
$14,600 * :$14,400 $18,300
i
$25,6-00
.
$27,100Women 10,000 14,400 14,400 * * *
Master's
,Men 12,900,- 14,8 20,306 $19,700
4,, :
21,000 23,2Q0
,
1
23,100 28,900Women 12,900 17,3 16,400 17,100 13,000 18,500 * *
Doctorates°
Men. , 14,700 17,200 20,800 25,600 27,300 28,700 30,300 31,40Women, 16,400 '17,200 19,600 .- 21,300 20,900 23,000 $ 23,900 25,800
* Fewer than 4 respondents.
7 8

61
SOURCE: Hitchcock Publishing Company, Infosystems, June 1977.
'TABLE 71
AVERAGE NATIONAL WEEKLY SALARIES IN DATA PROCESSING BY JOB DESCRIPTION, 1976 AND 1977
J,OB DEVCRIPTI 0 II1977
AverageSalarr.
- 1976AverageSalary
% ofIncrease
(Decrease)
,Manager of Data Processing $444 $436 1:8: -
Asst. Mgr. of Data Processing 405 381, 6.3
Project/Team Leader, : 41 *.
Mgr./Supvr. of Computer Systems .
Analysis & Programming , 416 399 ' 4.3
Lead Computer Systems Analyst & Programmer- 375 360 4.2
'Senior Computer Systems Analyst & Programmer 337 326 . 3.4'
Junior'Computer Systems Analyst & Programmer 1286 274. 4.4
Mgr./Supvr. of Computer Systems Analysis 435 433 - 0.5
`Lead Computer Systems Apalyst..
385 384 0.3
Senior Computer Systems Analyst 358 339 - 6%6
Junior Computer Systems Analyst 309 276 12.04.
Mgr./Supvr. of Programming. , 379 378
,
0.3
Lead Programmer '325 321 .2
Senior Programmer 304 282 7.8 .
Junior Programmer.251 231 8.7
Programmer Trainee s., 199 192 3. s
Data Communications Mgr. 385 380 1.3
Data Communications Opera . 203 196 1 3.6
Mgr./Supvr. of Computers Operations 320, , 333, (-3..g)
Lead Computer Operator 235 23 2.2
Senior Computer Operator . 214 i 2 6 3.9 .Junior CoMputer Operator , 179 175 2.3
Computer I/O Control Manager, 218, . ,215 . 1.4
Tape Librarian ' . . 178 170 ) 4.7XKby Entry Supervisor 1 206 201. 2.5-r
Lead Key Entry .6perator. 174 169 3.0_
Senior Key Entry Operator.
160 '154 , 3'.9
Junior' Key Entry Operator ,Th '145- , 134 4.3a
-Not ncl uded i
79 b,

..
,-SOURCE: Hitcock Publishing Company, Infosystems, June 1977.*. . .
.
' . r TARLF 72.
-sAVERAGE WEEKLY SALARIES OF DATA. PROUSSING PERSONNEL BY JOB DESCRIPTION AND GEOGRAPHICAREA, 1977 ,.$
...
-,_ -
.
4'4-' 't
,
.
J O B0 p
DESCRIPT,I 0 N
. GEOGRAPHIC AREA .
NewEngland
MiddleAtlantic
South
AtlanticEast North
CentralEast SouthCentral
West NorthCentral
West SouthCentral Mountain Pacific
Manager of Data Processingi
$473 $461 444 $433 $454 $420 t $447 $456 $454Asst. Mgr. of Data Processing 443 384 432 373 440 444 381 401 414Pr6ject/Team Leader -- --' 564 427 382 402 434 400 351 397 437Mgr/Supvr. of Ooeuter SystemsAnalysis & Programming .
.ct87 425 436 396 397 400 380 418 430
Lead Computer Systems Analyst& Programmer
.
.41)..
376 437 345 341 330 347 340 403Senior Computer SystemAnalyst & Programmer ,
391 346 348 312 422 294 329 311
0
360Junior Computer Systems,Analyst & Programmer 381 270 277 253 273 238 264 274 312
Mgr/Supvr. of ComputerSystems Analysis 489 -432 392 4
,
. 443 361 374 454 441 512Lead Computer Systems Analyst 411 406 376 37'9 30.- 366 339 395 '413Senior Computer Systems Analyst 356 3-91- 372 353 --116 335 359 330 391
'Junior Computer Systems Analyst 275 279 328 296 229 298 277 291 362Mgr/Supyr. of Programming 428 394 320 393 355 355 393 393 404Lead Programmer 347 305 324 , . 329 292 291 337 308 384Senior Programmer * 358 11130 300 288 258 282 313 1, 286 327JuRior Programmer 295 244 263 236 210 232 . 265 234 277Programme' Trainee , 252 193 186 190 176 185 209 198 213Data Communications Mgr. 432 380 366 448 4 338 - 375 353 -382Data Communications Operations 259 167 183 221 173 201 -". 229 160 221Mgr/Supvr. of Computer,Opeations 418 319 '320 314 308 305 303 310 336Lead Computer Operator 230 229 244 235 252 212 225 245 258Senior Computer Operator 203 204 228 210 192 201 199 212 236Junior Computer Operator . 173
234173
232 ,
188193
175
2237 191
263161
196168
194
183'214
197
236Computer I/O Control Mgr.Tape Librarian 90 ' 188 182 . 180 156 150- 171 159 191KeyEntry Supervisor 221 215 , 206 212 200 189 186 188 ' 220Lead Key Entry Operator 174 181 170 171 176 160 171 172 190Senior Key Entry Operator 164 .162 160 ' 137 151 153 147 175Junior Key Entry Operator - 141
0
143 154 1401 130 148 137. 137 159, . ,
*Insufficient Data. ¢"c;-7 ,
e.
.. y,.
., . 81
80. ,
.. ..
. ......._,
. ..,.!..
, . .
. . . ,,
. ...., .
)...: rr . ,

4
SOURCE: U.S. 'apartment of HEW, -Public Health Service, Position Classification and Payin State and Territorial Public Health Laboratories,e1975.
LE 734
AVERAGE ANNUAL.SALARJES FOR SELECTED POSITIONS IN STATE ANDTERRITORIAL PUBS; HEALTH LABORATORIES .BY STATE, 1975
''STATE-----7-411111,7
,POSIT l'ON.
LaboratoryAide 1
LaboratoryTechnician I
Micro-biologist I
ChemistI
Asst. Lab.Director
Lab.
Director -
Alabama $ 5,486 $ 6,949 $10,407 -* $19,884 $23,959Alaska 10,830 - 12,162 16,908 * , * . 38,484Arizona, . 6,313 8,973 11,768 $11,768 19,851 23,794Arkansas . 5,584 7,482 9,783 * 17,225 22,438
34,322California 7,844 9,907 9,926 11,217 25,043Colorado , 5,688 6,911 11;004 11004 * , 25,242
26,056Connecticut 6,561 7,266 8,958 8,958 22,210Delaware 6,783 , 7,717 11,771 ' 11,771 * 27,883D. C.'. . 7,965 ' 11,642 11,642 13,466 28,9J -1 34,555Florida 5,359 6,152 '10,276 10,276 18,284 21,447Georgia 5,898 6,996 9,948 9,948 18,900 22,800 "'"Hawaii 6,918 8,418 10,734 11,274 . .* 22,332Idaho . 6,408 6,906 11,496 11,496. 20,502 24,898Illinois 7,146., 8,532 12,414' 12,414 * 31,140Indiana *" 6,851 11,713 11,7181 22,100 35,438Iowa 5,544 7,608 9,850 9,850/ 22,300 25,618Kansas * 5,766 10,950 10,950 21,414 24,738Kentucky 6,162 ( 7,002 3,846 10,860 * 35,548
35,040-Louisiana 6,552 . 8,016 12,336 '11,532. 16,998Maine, 6,058 ' 7,176 9,412 9,412 17,498 20,098Maryland 6,439 7,781 10,934 '10,934, 24,937 38,058Massachusetts 6,526 8,461 10,699- 10,699 26,572 " 28,824Michigan 7,444 9,469 11,40' - 11,140 30,193 37,230Minnesota 7,141 7,945 ,,, 11,662 11,662 * 29,i62
21,648Mistissippi 4,560 6096 10,410 10,410 *Missouri . 5,490 8,106 10,152 , 10,152 17,106 201712
21,681Montana ' 6,213 9,874 "11,883 11,883' *Nebraska 5,766 7,512 10,578 0,578 18,090 21,702Nevada v -, 6,678 * 9,915 11,127. 14,967 21,342New Hampshire 5,791- 7,988 8,711. * * 17,249
30,041New Jersey . 6,003 8,870 9,877 9,877 *New Mexico- 5,700 .,7,140 9,360. 9,360 , 17,820 23,550New York 5,870 /3,775- 11,614 11,614 . * 50,600North Carolina .5,568 7,974 11,490 10,476 18,450' 23,484North Dakota 5,460 7,302 11,886 11=886 18,450 21,3540hier , 6,968 /"."" 7,852 10,047 10,047 -20,509, 24,396Oklahoma 6,480 / ' .7 ;11 70 TT
°550 TT,040 21,720 24,870
Oregon 6,618 8,6,10 * *. 16,950 . 22,746Pennsylvania -6,925 9,086 '12,558 '12,558 22,122 25,526Rhode Island 6,006. 7,605 , 9,776 * 13,841- 22,0.31South Carolina . 5,440 6-079 '10,993 10993 18 564 34,861South Dakota .- ,,,,,,2-5,354 6,918 10,753 10,7 3 ; 17,823 ,
Tennessee .-, . 5,052 6,420 10,098 10,098 17,556 21,354'Texa$ ' , 5,562 7,740 10,764 10,764 21,250 24,250Utah ,.. 6,09.0 , 7,4b8 11,802 11,802 2'5,050 28,038Vermont 5,525 7,605 ., 10,062. 10,061 14,612 21,008Virginia 4,980 . 6,492 9,696 ,- * '16,964 19,775Washington 0 6,252 6,870' 9,570 4 * . 28,872 23.298West Virginia 5,460 *- / 8,820 . 8,820 13,260 14,670Wisconsin 8,086 7,845 11,466 11,466 24,000 30,000Wyoming , * 9,570 * o * * 19,710 ,
13,663Guam , 5,126 ,, 5,780 8,434 * *Puerto Rico 3,480 / 4,020 8,600 . £,600 1 7 100 18,300Virgin Islands 4,242 * 8,353 *' 13,921'.
'*No Position Reported
82
63

64
SOURCE: U.S. Department of HEW Public Health Service, Position Classification.
and Pay in State and Territorial Public Health Laboratories, 1975.
t
TABLE 74
AVERAGE ANNUAL SALARIES OF SELECTED POSITIONS IN STATE ANDTERRITORIAL PUBLIC HEALTH LABORATORIES, 1972 AND 1975
Position' Classification
Average Annual Salaries Perc"ent Increase
1972 , 1975 1972 1975
Lab Aide I $ 4,9 $ 6,145 ,24.8
Lab Aide II 5,668 7,034 24.,1 .
Lab Technician I 6,368 7,762 21.9
Lab Technician II 7,664 8,940 16.6
Microbiologist I 8,955 10,631 18.7
Microbiologist II 10,252 12,212, 19.1
Microbiologist III 11,901 14,260 19.8
Microbiologist 'IV 14,251
,
16,868 18.4
Microbiologist V 15,686 18,82 20.C".
Chemist -I .. 9,3611,
10,807 15.4
Chem-kt Il , 16,729 124479 16.3
Chemist 12,261 '\___ 141;395 17.4
Chemist IV 14,709 4'(7 096 16.2
Chemist -V 16,749 20;221 20.7 ,
Asst. Lab Director 16',842 20.3.
--tab Director 20,406 25239 -.1-39-.
. -
83
r

SALARIES.OF ENGINEER
.
65
The Engineeting Manpower Commi44ion14 12th biennial survey of engineers'salaries, PROFESSIONAL INCOME OF ENGINEERS, 1276, includes data from 903 employers.covering 162,858 positions in industry, government and education. The "average engineer"in 1976 was making an annual salary of $23,400. The median figure for the survey,however,'was only,$22,350, indicating an upward-skewed distribution of salaries. Arelatively small number of high earners bring the 'average up.
,
1 A
The median engineer, typically a male who obtained his bachelor's degObe about -,
.15 years ago and is-therefore about 37 years old, is significantly affected by whetherhe is in supervisory or non-supervisor status. -Supervisors We more money and havemoreresponsibility than non-supervis rs.
.4By type of -inqustry, the petroleum industry tended to pay the highest salaries,
followed by the chemical and eledtronic equipment industries ('able 75).
By employment groui, those engineers working in research ancldevelopment hadthe highesLmedian salaries - $25,650 - followed by those in the petrtileum and aerospaceindustriegFState government's paid engineers the least' (Tables°76 and 77).
By'geographic region, there is'a spread of about 14-17 perceRirbetween thePacific states and the South Atlantic group, with engineers in the Pacifig area havingmedian salaries of $23,300 and tjiose in theSouth Atlantic states, $19,960. However,it is important to,note that the South Atlantic region also has the highest codbentrationof young engineers, tilus the lower media° salaries (Tables.78 and 80).
06 the average, an advanced degree also,confers ,a consistent salary advantagethroughoM the engineering career (Table 79).
Despite steadrincredses in current salary, the real value of engineers'salaries, has tended to decrease since 1968, and the.typical median engineer has barely
7-kept up with inflation. Chart.8 shows salary ranges for selected years with dottedlines indicating salary levels for the typical engineer Milo entered the field in 1953,
.1958 and 1964.#
The 12th biennial survay of the Nationa Society o4 P4o4RA4ionat Engine00PROFESSIONAL ENGINEERS' INCOME AND SALARY SURQEV - found that the median income of .'
. professional opgineers was $23,700, in 1975, a 15% increase'from the 1973 median income.This' incease failed to keep pace with the 21% rise in 'the cost of living, resulting in,a5% loss in purchasingpower during the tworyear period. .'
,o
Only 13'% of:the enginArs in the 1975'NSPE survey -were self-employed. Self- ...,
employment is seldom.chosen by engineers who.have' been in the profession for less thanten years. -Civil,and sanitary engineering are the two specialties ,where self-employmentis most frequent and by fan the largest proportion of self-employed engineers ownconsulting firmp. Self-employed engineers have medign income earnings almost $10,000
. higher than those of salaried engineers ($32,570 vs'$22,860 - Table 81).-.,
f .
By field of employment, median income was highest for those engineers workingin construct on-contractor firms and lowest for thosein state governments", Younger, .
engineers m ke ,higher salaries working in the federal government and in'constructiod=contracting firms while experienced engineers working in.consulting filtms and
;
constructio - contracting firms earn the Most. Salaries paid by-the federal government,, are cinsistenty.good with the earnings of educators_slightly behind (Tables 82,,84 an89).,

66A
4
The type of work Ferformed by engineers also exertsconsiderable i uence onearnings As in previous surveys, those in executive-administrative pdsitions had thehighest earnings, followedby those doing consulting work. The gap between executives
iand consultants and those in all other occupations'increased with the level ofexperience of salaried engineers (Tables 83 and 90);
Three branches of enaineering - chemical, aeronautical and aerospace and theheterogeneous "other' category which includes many engineers inexecutive7administrativepositions - rank highest with *retlpect to income. In 1.975, thtse fields together withthe small petroleum'and mining field outrank all others. Agricultural engineeringstands in the lowest position, as it has in past surveys (Tables 85 and 87).
TablA 86 end 91 show a steady earning pragression with higher levels of.lt0education, which is even more evident when years of experience are taken into account.
In 1975, engineers' tended to concentrate in the Middle AtlaNtic and NewEngland and the MidWest regions, and earned the highest salaries in the Middle Atlaticand New England areas (Table 881.
Of the 17,47T'INSPE members responding to the "moOnlighti'ng income",question,82% reported all of their income as coming from their prinCipal employer, while an
.
additional 13% earned less than 10% from outside sources.0,
The 13th biennialnalaPy survey conducted by the AmeniCan Society o6 UvitEnginau reports that the average of median entrance salaries (all <grades combined)paid in the five major employment c4tegories (excluding education) has increased by19.9% betwe0 1973 and 1975,. The largest increase occurred in the municipal category p
25.5%, followed closely by the railroads, utilities and induttries category at 22.4%/cThe lowest increase 'in 1975, 15.0%, was recorded by state departments and agencies(Table 95).
Those civil engineers working in education. in the west had the ighest medianentrance salaries - $21,,02Z, followed by,those working incontracting fi s in thesouth- $19,501.' Civil engineers working in railroads, utilities and i'ndustri'esthe Middle Atlantic region-badthe highest maximum median salXries (Table 92). J
For breakdowns by ASCE grades and'equivaler federal GS-grates by class ofemployment see tables 23 and 94.
N 4,,. fb,
The average manufacturing engineer received a total,compensation of approxi- ,
mately $1,9000 during the 12-month period from March Igo 1975 through,Februry 29, 1976,according to COMPENSATION:1N MANUFACTURING:PART I: MANUFACTURING ENGINEERS, the reportof a survey conducted by Abbott, LangeA and.A4sociate4 and sponsored by the SoCiety o6
c `By type of. employer, highest median annual incomes were enjoyed by those in
Mant4a,ctuiti,ng Eng.i.nem.'
. .
..
.
.
f4e field oftransportation equipment ($20,000). The lowest median incomes werereceived by those engineers in the manufacture of machinery (except electrical),$16,800; fabricate' metals, $16,900; and instruments and related products, $17,000 -,
(Table 96).- :4
6). .
.
related
...
As in all other salary studies, the income of manufacturing eniginee s variedaccording to the degree 15wel. Those who had not attended college had media' annual.
omincomes of $17,500, those with some college, $17,192, while those with an engineeringtechnician degree averaged $17,729. Bachelor's degree graduates in engineering had
. 'pedian incomes of $19,561,,while Mders of master's degrees had average incomes of$20;8 (Table 07). Howev0-,.the total _range from those With no college fo t-hose with
.
ei 85

,,
a Pfi:S4 is only $5,000 per year.
___,,,,'-' Increasing experfence in manufacturing engineering resulte in small, butfairly regular_ increases in. compensation. The average incomeof man facturing engineer?with five years of experience was $.14,150, while that of those with 5,to 29 years/ofexperience was $20,500. (Table 98). .
...4
0 Tohe maximum difference i4 median earnings between geogr hic areas was i18%.
...
.
Med an incomes were . highest in Michigan ($20,000), New York and ew Jersey ($19,694),an California ($19,130). Lowest median earnings we found.in Illinois and Wisconsin
7,000) and thb Southeastern 4atet ($17,601) (1"a,' '99). . :
, .4
tr.
One of the significant factors in compensation'for-6nufacturing engit)eerswas job funttion. Thehighest median income ivas:reporqd by research.and developmentengineers ($21,230), followed by technical sales enginee.rs $20,091). Theowe edianincome was received by methods and systems enginers, $16,484 ITable.1.00
.
Average compensation for industrial engineers during,the 12 -month period fromJinuary 1, 19/6 throUgh December 31-, 1976 ias $24,190, aocording to a survey conducted 4
., by Abbott, ranget esand Associates for the-Am tAietican Institute o6 Induzat Engineets..This represented an increase of about 11\3% during the,20-month pertod since the ,- .
preceeding survey, increasing faster than the cost-of-living index (which roseapproxi-mately 9.9% during that period). i
L.."
Industrial engineers showed a wider salary rage by level of degree thanmanufacturing engineers. Those with less than a bachelor's degi^ee had- median income'sof $19,180, while those with a bachelor's degree.had a median.annual Income of dyer': ,$21 ,000. fiolders of the MBA degree riceived a median annualsompensattgin o. $2.4,200,. .
and the median for Ph.Dis was $27,000.(Table. 101).. .
. , .
. r. ),C ,'
Total income of industrial engineers:rose with fairgularity b3i lengto'f* experience, and again showed a wider range than for manufacturing,-.engineers. A median.income of $14,401 for those with under two:year's of...experience rote to.$28,000 for ,
. those. with 30 years of experience and over.(Table102). ' ,- -:. .-:
. 4., .i
Median incomes by geographic area ranged from $2 :Th .0e,Plains states to
$23,580 in the Pa.cific states. Survey respondents of Canada had a:median totalcompensation of $21001 (Table 103).
..
,.
../. .... ' -
Median total compensation varied Considerabl$ from one-tyMof employer toanother The lowest average incomes were found in insurance companies ($18,689) and-teRtile mill firms-($20,699). Industrial en tneers *irking in consulting fihs and -' ,',.
,communications organizations,had the, highest average.salarles,($32.417), followed byo.those in merchandising ($25,91:0). Themiedians are someidhat different (;Table104).,
.
-r
-4 ,,s, , .
'
..- .x
.
0
e
,

e.
SOURCE: Engineering Manpower Commission, Professional Income of Engineers, 1976
'4106A
NUMBER AND MOIAN ANNUAL SALARIES OF
ENEGI41
NEERS BY TYPE OF INDUSTRY AND SELECTEDYEARS SINCE BACCALAUREATE, 1976
rl
TYPE OFINDUSTRY
. YORS SINCE BACCALAUREATE0 1. 5. dk
( 117.)
_$16,650
7 .
( 190) ,
$18,050
9=11
( '688)
$ 200
15,-17
(1,026).$24,250
18-20(1,119)
$25,900
21-23
T 866),$27,150
27-29
( 787)
$28,450
35+(. 412)
$28,100Aerospace
( 19)
$13,350
J 73)
$14,000. ( 124) (' 564) ( 747) (1,057) (3414,27) (1,761) (1,583) 1'1,218) ,(1,783) (1,570)*
Chemicals 14,400 15,200 18,350 9,900 22,100 25,750 27,100, -28,100- 29,400 30,190.( . 68) ( '307) ( 282J ( 266), ( 630) 1 453) 347) ( 350) ( 374) ( 269)
Gonstructibn 13,500 14050 17,750 19,300 21,400 24,400,(
25,400 26,050 26,800 27,100Electrical
Equlipment
( 252)12,900
( 561)13,700
(1,363)17,050,
(2,053)1,8,.850
(§,512)21,400
0,330125,450-
:(4,742).26,650
(3,814)27,250
(4,797)27,300
(3,118)26,200
Electronic (1,014) ( 760) (1,330) (1,986) ,(4,402) (3,898) (2,7471 --(1',863) -1T;21-01-'( 748.)Equipment 14,650 15;450 18/750 '20,250 ,22,250 24,900 25,600 .26,000' 26,250 26,200
Instruments7)
12,900( 38)13,700
( 38)._16,850
( 65)' 180350
( 148)20,400
( 142)23,150
( 96)- 23,850
( 50)24,250
( 77)24,450 (24,3-0024,3-00
(1338 (141ga
.
Machinery (;71,,W (i91N (214,C (253,M (2623Vi (272,N (265N q52,1N
Meta.ls.,' Basic' (14,1a .(14;2) (18,gN (19% (21%8" (241,g8 (251388 .(251,a1 (261,9g8 (261,g8.Metal Products,
Fabricated( 47)
12,850( 269)
13,500*( 308)
'16,300( -307)
17,700( 824)
19,650_( 515)
22,650( 482)
23,550'( 424)
24,050( 402)24,200
( 286)0
23,550( 1) (. 25) ( 20), ( 17) ( 46). ( .35) '( 42) ( 41) ( .,50) ( ,35) .
Link-1g 0 15,650 17;950- 19,050 20,600 23,100 24,100 t 24,850 25,900 261;600Paper & Wood ( 4) ( 23) df- 33) ( 29) (' 101 .(' 138) ( 87)' ( 67) ( 93) ( 89)P oduct .0 15 100, 18 200 ' 19 700 1,700 24650 25,600 26,250 26,900 27,200
61 357 273 278 '568 548) ( 558) .( 480) ( 897) ( 630)Petroleum 15,050 15,900 t9,350 21,000 23,35Q, 27,150 28,500 29,500 30,750 31,450
( 5) ( 13) ( -8) ( 13) (' 14), ( 33) ( 35) ( .14) ( '31) ( 31)Food ' 12,950, 13,850 17,400 19,000 '21,000, 23,550 R4,200 24,600 24,950 25,050ConsuItihg &-Engineeking ( 89) ( 551) (' 599) ( '545)..(1-293) ( -909) 1 853) ( 7839) ( 790) ( "651 :) .-
Service l 13,650 14,400 17;450 18,850 20,850,-23,850 24,950 ,25s700 26,600 27;000
87
R.
0

y C
ISOURCE: 'Engineering Manpower Commission, 'Professional ineome of Engineers, 1976
0Vagria '7
NUMBER AND MEDIAN ANNUAL SALARIES OF ENGINEERS BY TYPE OF. EMPLOYMENT GROUPAND SELECTED YEARS SINCE -BACCALAUREATE, 1976
\' x..
TYPE OFEMPLOYMENT .
.... ,
. YEARS SIN.CE BACCALAIVREATE .:-0
(1,051)$13,600( 663),13,900
1
(3,118')
$14,400(1,691)
14,650
5(4,546)$17,700
(2,544)
17,700
7
-(Mt',0582)
$19,350(3,619)
19,250
9-11
/13,225)$21,600
( 9,007).
21,500
15-17
(11,687)-$25,150
( 8,319)
25,150
18-209;591)$26,300'
(7,054)
26,450
21-23'
(8,113)
$27,160(5,844)
27,350
27-29(10,214)
$28,050( 7,196).
28,250
35+(7,396)$28,500(5,225)
28,550
All Industry,, 1
Alt ManufacturingIndustres
All Nons-Manufiacturling
Industries .
( 388)
13,250(1,427)
14,150(2,002);
17,800(1,963r(19,500
4,218)
21,800(.3,368)
25,100(2937)26,100
(2,269)
26,800( 3,019)/ 27,600
'(2:-171)
27,900
Fe4eral' Government( 25)
12,550( 124)
13,350
( 263)
16,400
( 307)
17,800( 733)
19;700( 684)
22,600( 57.5)
23,5.0( 527)24,200
( 476)
25;000( 305) '
257300
State Government-( 71)
11,700( 166) 4
12,300( 267)
14,750.)/ 336)
15,900.( 570)
17,550( 692)- .
20,000( 585)
20,700( 388)21,100
( 49.0)
4. 21,150,
(, 71)
20,600, .
Local Government '( .4)
14,400( 29).
5,100f 76)
17,300( 68)18,750
( 185)'
20,850( 189)
24,000( 190) ,
24,900( F6)t4-25,350
206)25,150
( 167)23,750
All Educational InstitutionsAll FAeulty,9 mo. Contract
(
1)
13,350
0)
. 0
( 5).13
( 0),.0
( 64)
15,000( s 3)
0
( T53)
.15,900'( - 6)
,;17,850
( 810)
17;200( 14)
'21',400
t 1,154)19,750
( 61)
274350
11,187)20,850
78)
29,350
( 928)
21,800( 110)30,650
( 81
23,05( 100).
31 7850
(T,069)22,980
se '117)
32,300
All'Schools, Administrators12 mo. Contract.'
All Schools, Researchers12 mo. Contract
( 0)0
( 0)0
( 23)
14;150
( 39)
.s 5,550(7 121)
17,400
( . 75)
20,000( 57)
20,800( 56)/(
21,30039).
21;800( 35)
22;000
Research!.and DeveloPment( 58)
1'4,200
( 139)
15,150( 335)
19,100(- 537)
21,050
/ ,554),(.
23,7001;626)
27,600(1,379)
28,700'( 950)
29,3501-( 1,00 ,
29,80 '( 566)29,800
.
communications/
.9)
'250
207)
13,400
( . 7)-
15,150( 510)
14,200
( 46)
178,800
( 975)
17,500
c 37)
, 20,500( 811)(19,050
( ' a 51)
22,9001,435)
21,200,
( AO).16,,500
( 1,032)24,400
( ; 70)
27,700( 906)
25,500
( 62)
28,600( 667)26,250
( 10329;65
( 427927,150
( ,, 67)
30,100(. 9)3)
27;550Electric Utilities >
Gas Uttlftties& Pipelines
( . 5)
13,250( 80).14,250
( 50)
18,150',/, 64)19,90Q
1 ) my-( , 77) ( . 88)22,150 25,150.. 26,050
( 64)26,600
( 125)-
V,150( 9)
27, 50
O
.4
H1

70
o
SOURCE: -Engineering Manpower Commission, Professional 4Income of Engineers, 1976'
TABLE 77Immo
MEDIAN AND MEAN SALARIES OF ENGINEERS BY TYPE OF EMPLOYMENT GROUP, 1976
EMPLOYMENT GROUP ,''), MEDIAN MEAN
Research and Development $25,650 $26,500 1
Petro.
.i4um - . 25,250. .
26,100A .
Aerospace 24,6001
25,000
Chemi a s 23,400 24,650
Elec ricaj & Electr9nic Equipment 22,850 '23,800
Local Government ' 22,200 22;900,
Federal Government 21,400 -21,600
Construction & Mihing ,i
21,100 21,950,
Utilities -I--
0,050 22,450
Consultirig & Engineering Services 20,760 22,000
MeChalnical Equipment . 4 20,600 21,900
Al 1 Education*.
2Q,600 ---? 21,550
Metal IndUstries ' s. ' 26,450 21,400....
State Goyernment, - 1$,200' 18;500
* Mostly 9-month ba.sis.
-TABLE 78
MEDIAN AND MEAN SALARIES OF ENGINEERS N_ INDUSTRY AND GOVERNMENT:BY GEOGRAPHICAL REGI N 1976
GEOGRAPHICAL REGION MEDIAN 77 y MEAN
Pacific.
. . P
$23A00' ' $24,15Q .
Middle Atlantic 2,100 24,250
MoUntath: .'.'".
.
22,
100. .
22,950.
. New England.
9 /f
1
\:-422,050 .\. .22,850
. .
East North Central..,
2 500 - 22,550 )
, West North Central 4 ,21,450 22,200
South Centrl. !
fil ,350 22,500
South Atlantic . 9,900 v -0.21,10

_ -
SOURCE:. Engineering Manpower CoMmission, ProfesAional Income of Engineers, 1976
TABLE 79
NUMBER AND MEDIAN ANNUAL SALARIES OF ENGINEERS BY HIGHEST DEGREE HELDAND SELECTED YEARS SINCE-BACCALAUREATE, 1976
(WEIGHTED NATIONAL AVERAGE)
1.
71
H1GHEsT'DEGREEHELD
YEARS SINCE BACCALAUR -EATE1 1 5- 9711 15-17 18-20 '21-;3 . 27-29 35+
Bachelor's(10,020)
$14,300(10,968)$17,100
(12,684)
$18,450(27,354)124,800)-(23,228)$20,400 $23,450 $24,550
(20,009)
$25,350'(24,154)
$26,300(17;992)$26,750
Master's( 907)
15,600( 3,573)
18,500( 4,502)
19,950(12,589)t2,150
(10,002)25,900
( 7,695)27,250
( 57405)
, 28,250
( 4,916)29,200
( 2,911)
29,000
Ph.D.'s( , 8)
19,650( 395)
22,150( 760)
23,300( 3,687)
25,100( 3,492)
28,600( 2,493)30;150
( 1,649)
31,1550
( '1,107)
33,300( 787),
32,200
All
Engineers"(10,936)
14,400(14,964)'(17,989)17,500 19,050'
(43,772)21,200
(38,471)24,500
(33,492). 25,550
(27,137)26,300
t
(30,233)
27,000(21,750)27,250
TABLE 80 4 e
, .'
NUMBER AND MEDIAN ANNUAL SA ARIES OF ENGINEERS ,BY GEOGRAPHIC AREA ANDSELECTED YEARS SINCE B CCALAUR.EAT , 1976
4,
GeographicArea
..e YEARS .SIN BACCALAUREAIT---.
1 5 '-:7 9-11 .: -17 18-20 21-23 27-29 35+,
NeW ( 63) ( 125) 1 !-1'62) { 79) ( 377) ( 349) ( 256) ( 286) ( 248)England , 13,700 716',700 1 .20, 50 24,900' 26,150 26,800 26,250 22,850
Middle e ( 381) ( 710)
,300
(41 0 -,3 ,328) 11,948) {1,530 (1,646) (12321)Atlantic 14,200 17,850 1 ;60 , 5 25,600 26,650 27,400 28,100' 28,400
4 ,
Eat North'(Central `
650) ( 832)
14,400 e17,600( 893420,119,050
)
-i,2* 0(1,628)23,500
0,503)24,350
(1t291)
2411900
(1,702)'
25,500(1',372)
25,750
Weit North'T "322) 0346) ( 426) ( 918) C. 92) (. 523), ( 738) ( 387)Central 14,100 16,950 18,350 400 23,650 24,750 25,450' 25,950 25,700
South (' 242) (. 436) ( 404) (, 739) (:555) '( 470) (*."337) ( 405) ( 317)Central 14,050 17,100 18,550 20,400 23,100 24,000 24',650 25,300 25,600
'766)..f . 4(South ( 554) ( ( 70Q) (10A50 -(1,237) (1,028)'( '812) (1,1761e( 790)
AtThntic 15,050 17,600 18,850 ''201-,630 23;600 24,750 25,650, 26;900 27,700
( - 75) ( 122) (J06)(-295) ( 279) 4._.3311) ( 194) ( 1-61) ( 14)Mountain 14,250' 17,450 19,000 21,100 23,9501 24 650 24;900 24,700 23,950
. Pacific s( 318) ( '399 ) 4 4191).(1,176) (1,083), ( 9 )9 ( 111) (' -830) ( 456)'Coast 15,200' 18,650 20,250'22;600 25,900. 27,050 27,850 28,800 29,206
.92 .
-0

72 SOURCE: Engineering Manpower Commi§sion, Professional, Income of Engineers, 1976
CHART 8"- TRENOS IN 'MEDIAN SALARIES OF ENGINEERS, 1953-1976
10 CCO
.71 MOM
X WO
rt coo
10 000
ncoo
PIO
21 000
21000
22 COO
20 000
111 000
3 000
301X
1200O3
10 000
000
1 000
4
SOC. c -Naionar Society of Professiontal Engi neeand Salary Survey, 1
, ,,
---NIMISIIMEMMIMISNIMMEIMIUNIONNIEMIllMIMMIIIIIIIIIMMIMIdi .1M-11Th
SIM=11111/11MUMMUMIN1111111111111111IIMMIIIIIIMINIIIIIIMMI
111111MINIMPIRIBMO
IIIIIIIIMNIMNIMMINEM111111MMIIMIENIMIN
IIIMULOWNi 1
IMIIIIIIMMIns1 , IIIIIII 1 !:
[ , , ' , 3
IMIMUP-11:011.-MNIBRIP.
LIMIMIUMILILIMMIMIIrralIMMENIIIIMMISMIIIIMIIIIVAII
I ,
.N., i 1 , -AMEMENRIIIMPIN.Tr, - I311 linlineEl.
AMIKAPMERWRIOwM;linnialThall' ' JIIIIMAN507_-"Zmuseminosii.4111,029111rMIIIM
NV APriliP"" ..A1P014.1.,1"--mmeeCallarAIMPIAIETIMINIss-U.A. 1IIIIVArairlESOHIWI.1.740.5p:w40205AnirAtWid----------___PreollP"'-.A1P-1411MTMIIIIIMM"-allial.irlimmosimiias-"-gallre-, '" .........mssimumMOIMIC"*MrielOMWRZIWOMMONOMMOMMMUZZilmwm
. , .
R4.- -- I 1 1 1 ! 1 1 L12 11 11 11I 20 '21 24 24 22
is
vow
75. .
1976
1974
1972
1970
1968
196619641
1960195819561953 ,
The dottedlines showhypothetical median engtmeerswho entered the field in1953, 1958 and 1964, andtheir salary Tevels'in 1976..
fessional Engineers' Inccmq. .
TABLE :1
MEDIAN INCOME OF PRI SSIONA ENGINEERS BY EMPLOYMENT STATUS,.AND YEAR OF J.NTO,PROFESSION1975
,
. ,
a
Yea/ of Entry ,,
Self-Employed.
Employee
1975 k
19741973 .
14,74,f.1971 '-1970.
1969 ..#
1967-68 .
1965-66
'1963-64'1961 -621959-601957-58,,-195506-1953-54
1951-521949-50 .
1944-481939-43 ...
1934-381929-331928 and before-
( a"
.
.
, f
N.
......
,
i
1
.
,
.
s
,,
'\ ,
20,25023,400 .."'"25,506
1,'27,1101, 28,590
, 28,980°1
, 33,63033,53033,90035,08037,98036,90039,2038,82033,670
631,43
.
,
,
`
,:,'
/
I
1
-1,
,
-
.
' ,
,
4:- tr '%
- i ;''g
.,
e'
q
112,97013,51014,370
15,16016,240
.
17 410,
18,4001/,14020,720267623,170
23,69024,570
25,070
2t,49026,25027,180 C271380
27,920 928,26026,40021;750
Fewer ihan 20 cases
r
(
!*

4
73
SOURCE: National Society of grofessional Engineei.s, Professional Engineers' Incomeand galary Survey, 1975.
T LE 82
MEDIAN INCOME OF PROFESSIONAL ENGINES ACCORDING TO FIELD OF EMPLOYMENT'AND.YEAR OF ENTRY INT ;ROFESSION, 1975
.,. ".
Consultingfirm
instruction-Contractdr
Firm. Educational
Institution
*OtherNonprofit
OrganizationVeer of Entry IndustryPublic
UtilitiesFederal
GovemmentState
Government
County orMunicipal
Government
1975
1974
1973
1972
1971 ,
1970II
1969
196'7-68
1965-66
1963.64
1961-62
1959-60 ,195-581955-56
1953-54
1951-52
1949-501944-48
1939-431934-38
1929-331928 and before
`
51954013,910
14,950
15.410
16,860 -.
17,960
18,750
'19,500
21,12022,15023,54023,94025,280
25,09026,20627.180
27,89026,24028,45029,470
29,25027,000
3. $
13,630
, 14,70015,390
16,69017,630
18,420
18,900
20,320
22,44023,130
24,120
24,24024,7t024,270
26,080
27.67027,630
29,25029,630
5
'''
12,640
14,000
15,100
16,400,18,630
18,790
19,610'20,730
22,660
24,130
24,490
25,210
26,640
26,3,20
26,470
28,110
29,110
2 ,600,040
29,400
r
-,
"
$12,430.
14,100
- 14,90015,670
15.800' 17,390
18,58619,430
20,32020,96021;53021,96022,64022.60024,28024.50023,22023,17025,290
,
,
,,
S
13,330
13,500 ,15,190
15.690'17,000
18,160
19,080
20.22021,7Q0
21;840
22.450 N
23.760
25,6902'4,350 -
25,320
25,25023,5a23,900 .24,N025,130
$13,500
13,900
14,930
7 16.120
16,940
18,240
18,800
21,300 '21,680
24,490 °- 26,000. \
27,260
27,220
28:1?,150
29,180'30,260
e. h.24033,550
30,780
27,330
27,750
S
14,100
14,890
16,500
17,220
19,580
"' 19.800
21,320
23,486 '26,130 4
27,300
27,1'30 ,
- 26.890
26,650
33,140
29,570
32,410
36,84036,790
36,430
30.670
'
.
P, S '
19.950
22.13024,30023,440
24,75625,040
, 27,19027,900
27,000 .-28,740
27,960
7`,1360
4 27,750
.S '
. .
'
:'la, ,
.
24,000
27,220
-- 24,00024,75027,860
\1-
N.TABLE In
MEDIAN INCOME OF ROFESSIONAL INEERS ACCORDING TO TYPE OF WORKAND YEAR
'Fewer than 20 cases ,
, 4, ...
I
Year of Entry
A
Executive-Administrative , Sales Teaching Design
ProductionQualityControl,
Maintenance
:
-
Research &Development
ConstructionSupervision
,.
Consulting Other
19751974197319721971k19701969 '''1967-68 %
1965-66 '1963-641961-621959-601957-581955-561953-541951-52- '1949-5019411-48
1939-431934-381929-33 ..1928 and before
S
' 15,33013,901117,110
*1.7,460 '''.---
--, 1'9,1,8019,680
1` - 21,32022,47024,52026,02026$3,20
27;00028,06028,20029,56030,19031,96031,75035,14029,63047,000
$
.-....\
$
.I1
li2 ,330 .21,00022,20021,50023,550
% 24,00022,88024,000.24,000 =
-26,5908,400*25,500
-
-
$12,40'13,51014,28014,96015,88610,82017,64018,210
-19,73o21,10021,46021,38022,66022,97023;3'70 -
.f,23,5t024,59023,58024,57024,22023,060
$13,33013,45014,97015,31016,50018,15019,09019,3920,321,21,22,4502323 10023,24,124,22022,97022,980
--- 25,500
'*.
,
0
00
00
50
.
$ '13',380
;13,96015,1Z0
.16,00017, 30
8,: 10
,,19,18021,00
.21,67023,17024,07025,79025,42025,97026:54025.92026,44026,84027,750
"5'13,63D14,13015,20015,830 %
18,06017,81019,54021,200'
'22,88022,500
-22,080' 22,900
2V00 '
25,00024,67025,75024,860.6,570
24;500
S '---- -
13,42014,24015,000
.16,84017,34019',36D19,21921,850
'23,67024,060
. 25,77026,130 ,
8,74028,39028,420
. 29,440.29,130'29;.89028,160 ,
X26,140'24,000
$'
.
*- I
-
)9,33020,7913."19,720,,24;860
t25,72
"', 25,130
26,25025,500 .
.
.,.`
, \,....'.
19,390'24;00025,09024,00027,00028,88627,00028,50026,25028,230 =
28,00030,910
"
'Fewer than 20 cases 94 ;

74
4
4 .SOURCE: National Society of Professional Engineers, Pyttifess_ierial Engineers' Intome
and Salary Survey, 1975..
TABLE 84 :
MEDIAN INCOME OF PROFESSIONAL ENGINEERS BY,YIELD OF EMPLOYMENTAND YEARS OF EXPERIENCE;1975
-a.FIELD OF EMPLO MENT - 0
I.
EngineersWith 5
Years ofExpetTence
Engineers, Wi the 10
of,Experience
-.EngineersWi th 20
Years ofExperience
InduStry . $17,960 $21 ,120 . ,$25,1390Public Utilities , 17,630, 20,320 24,720Federal ,00,vernment 1B,30 20`,730 26,640
,State Government / 15,670 18;580 . 21,960County Government - ' 17,000 . 20,220, ' -' 25,690Consul ting -Firm 16;940 21;300 -. -t's 27,220Construction-Contractor Firm,-4. 19,$80 23,480 , 26,650 fEducational Institution ., * - 194950 :2,5,040.-Other Nonprofit Organization * .-. * .* Fewer than twenty4icaes.,,
TABLE 85
MEDIAN INCOME OF PyROZSSIONAL ENGINEERS BY BRANCH _OF- ENGINEERING, 1971-1975
. P.
BRANCH OF ENGINEERING
CO! MEDIAN INCOME11111
PERCENT'NCREASE'
1971 .1973 _.1975 1971-73 1973-75
Aeronautical andAerospace $19,210
1$21,720 $25,360, 13%-
`. ',18%
Agricultural 16t600 19.980. .22,690 . 20 ' 14 ilb
Chemical-Civil
19,110 21,590 26t-, 010 - 11 .20. 1 860 , 20,4T0 23;260' - 14 14
& cElectrical ironic 60 20,330.4. 23,340_._
g' 12: A. 1,5Industrial 1 20 20,800 °- 24,100. 12 c. 11% 16'Mechanical 0 ",20,320 23,580 14 1B ''Sanitary . ,11O .20,60 23,090 ---,11 1 12Other . 20,360 22,930 , 26,330 13, 15
.
,.1au6. .
MEDIAN INCOME OF PROFESSIONAL ENGINEERS BY LEVEL OF EDUCATION, 19 7
LEVEL Of EDUCATION,
, MEDrAN INCOME; PERCENT INCIalgt_ L
191 ' 1973 , 1975 1971-n 1973-75
Less than Bachelor "s $17080 $19,770 _ $22,770 16% , 15%
Bakhelor's Degree / 17,920. 20,420.- 21,?90 14.
Master's Degree 19,030 -, 20,950 24,280.
__14,
10 16 .. --
Doctor's ,Degree 's 22,510 24,840 27,790,.
,. 10 1,2 '
7
4
r
, 9 0

,
75,4SOURCE: National Society of `professional Engineers,.Professional Engineers' Income
and Salary Survey, 1975: ,
' ,4.,
A Zs' :, 1 u *4s apilitixn. .
r ,
MEDIAN INCOME OF PROFESSIONAL BY BRANCH OF ENGINEERINGAND'YEAR OF ENTRY- INTO PROFESSION, 1975
Year of Entry
AeronautIcal &
AerospaceAgrIcul
turat Chemical Civil
Electrical&
Electronic Industrial Mechanical
Metallur-glcal & Petroleum
Materials & Mining Sanitary Other
1975 $ $ $12.000 513.108 $ $ $ $ - $ $1974 13L,260 13,540 13.810 13,17019737, 13,820 14,650 14,580 14,530 - 14,0001972 .-
16,830 14,920 15,310 14,930 15,2101971 '15,740. 16,570 16,430 16,500 16,750 :1970 e' 18,000 17,030 17,690 19,000 17 550 17,3501969 ' - .17,910 19,160 18,900 18,400 18,5,001967.6$
19,670 18 740 19,500 20.000 19,230 19,950 19,8501965-66 22,880 20,730 20.650 20,500 21,180 21,090 23,2501963-64 23,670 22.740 22,440 22,650 21,960 23,500 23,880P61-62 24,380 23,310 \2247290 25,500 23,400 24,120 24,350959-60 . 24.300. 26,400 24.050 3,970 24'350' 23,340 25,950 24,9401957-58 , 27 270 27 640 24,970 24,480 25,850 24,960 25,820 27,5501955-56 26 400 26,500 26.010 24,360 24:380 25.630 '.., 27,630 25,7201953-54 27 670 28,070' 26,550 25,600 27,600 25,660 29,000 26.060 '24,9401951-52 25 880; 27,940 26'960 27 150 27,680 26,460 '' 27,000 '1.200 27,3001949-50 28,500 25.830 28 130 28 360 27 180 27 810 27,360 30,000 31 000 )1.000 30,0001944-48 ' 29 7913 33,270 27 750 28A40 28,500 27,970 26,000 32 )500 29.630 29,8301939-43 28 500 30,840 28,420 28,530 28 750 28,130 28,500 33,330 28 630 33,0801934-38 32,800 28.400 29 320 29,400 28,690 ". 27,000 33.6001929-33 --- 26,130 24.000 */ 27,8301928 and before
-.-- 25,070eav man 20 'escomrts
'Wm
TABLE 88
MEDIAN INCOME OF1PROFESSIONAL ENGINEERS BY REGION, 1971-1975
REGION,
MEDIAN INCOME.
% INCREASE..1971 1973 1975 1971-73 1973-71New England &
Middle Atlantic.
$19,750 , $22,530 $25,540' 14% 13%South* 18,310 . 21,290 23,540 16 11Midwestl , 17,880 . 20,090 23,010 12 15Plains 16,810 18,990 21,900 13 t 15Southwest** 17,330 19.,730 22,790 14 16West*** 18,460 20,750 23,920 12 1.5
Includes Puerto Rico. ** Includes Canal Zone.
TABLE 89
le*** Includes Alaska and Hawaii
MEDIAN INCOME OF PROFESSIONAL ENGINEERS BY FIELD OF EMPLOYMENT, 1971-1975
FIELD OF EMPLOYMENT.MEDIAN INCOME \
.
% INCREASEf971-73 103-751971 1973 1975
Industry $17,870 $20,330 $23,810 14% 17%Public Utilities 17,40 19,780 22,670 14 15Federal Government 19,180 21,930 , 24,700 14 13State Government 16,120 18,130 20,730 12 14County or MunicipalGovernment 16,960 18,990 21,680 12.* 14
Consulting Firm 19,260 22,010 24,420 /14 11Construction-Contractor
Firm. . . 21,040
4
24;220 26,530 15 10Educational Institution 19,560 22;070 25,950 13 18.
98.

76
N
O
SOURCE;: National Society of. Piofessil5nal Engineers, Professional. Engineers' Inqome krand Saiary Survey, 1975.
TABLE 90
tvTDIAN INCOME OF PROFESSIONAL ENGINEERS BY TYPE:OF WORK PERFORMED, 1971-1975
-MEDIAN. INCO -. "PERCENT%
1971-73
INCREASE
11973-7511YIRK f . 1971 1973 - , 1975'
Executive- Administrative $21,540 $25,220 $28,256 17%.. 1Z°,4,.Sales ,
-' 21-;020 *.- 25,110 20 .1.9
.1
Teaching / 17,610. 19,940 .23,500 13 18 /. Design 15,580 .17,290 19,820 11 15
Productio%/Qual i ty Control,Maintenanc , etc.
N.
15,650 . 17,780 20,270 14 . 14
Research and DevelopMent )7,520 210,218 23,330 15 15
Construction Supervision 16,130 18,070 20,960 . `12 16
Consul ti ng 19 700 2,180 24,620 13 11
Other 17,060. 18,310 21,810 7 ..19
."TABLE 91immommimma
MEDIAN INCOME OF PROFESUONAL ENGINEERS BY LEVEL OF EDUCATIONAND YEAR OF ENTRY INTO PROFESSION, 1975
, .
Ye .r of Entry
Less ThanBachtlor's
DegreeBachelor's
Degree .
MaSter'sDegree
Doctor'sDegree
,1975 $ -k .$12,770 $ ___
.
1974 13.4404 14,6001973 14,360 14,5001972 ' 15.070 15,5201971 - 16,100 16.850 ..
1 970 . 17,360 17,4601969
st. 18,260 18,930 . '
1967-68 . '17,670 '" 19,010 19,770 206201965.66 19,500 20,520 21,670 22 3901963-64 . 21,000 22,260 23,360 24,7501961-62 23,000 23,300 24,070 26.2501959-60 22,500 23,560 25,420 26,5001957-58 22,500 24,960 25,480 27,9101955-56 : 24,320 25.820 25 500 27,0001953-54 . 22,590 26,010 27,810 , 28,1301951-52 23,750 26.770 27,990 29,4601949-50 24,500 27,950 28,740 29-,550
1944-48 25,850 28.150 29,250 32,5601939-43 26,420 28,900 ._ 28,930 29,4801934-38 26,140 29,200 28,960 . 32.4501929.33- :17,0804 28,2201928 and before a ,
25,500 .
Fevier Ihan 20 cases
97
.1,
4
-
ar
AO%

77.
SOURCE: American Society of Civil Engineers, ASCE Salary Survey
TABLE :92-
MEDIAN ENTRANCE AND MAIMUM SALARIES FOR ALL GRADES* OF CIVIL ENGINEERSBY CLASS OF EMPLOYMENT AND GEOGRAPHICAL REGION, 1975.
$
CLASSOF
EMPLOYMENT,
,G E'OGRAPH,ICAL REGIONNew
EnglandMidgeAtlantic
Middle.
4 West$
South.
WestWest Far Wes
CONSULTANTS
Entrance $16,000 4 $16,800 $16,000
.,
,
$15:250 $18,000Maximum- . . 20,000 21,000 20,000
t$1;,00020,000 18.850 22,400
CONTRACTORS
Entrancet.
- 2r
18,500
,
16.650 18000 19,501 19.001 18.0001Maximum , 23,000 22,900 24,900 22,400 25,000 24,600
STATE DEPARTMENTS andAGENCIES (TRANSPORTATION,HIGHWAY, PUBLIC WORKS)
Entrance 15,285 18-168 17,316
.
-
,,
14,456 15.864 17.340Maximum .
4: 20,573 24,685 22:000 29,088 22,368 23,664
141NICIPACITIES, COUNTIES,and REGIONAL AUTHORITIES
Entrance ° 16,000 17.945.' 17,130 14,844
'
14,904 17.888Maximum - 0 20,777 23,815 21,827 19,981 18720 21,924
RAILROADS, UTILITIES &INDUSTRIES
Entreice - 19,100 17,940
,
18,650 1.360 17.700Maximum . ' 45,000 28.000 24,522 27.36_0
1
16.000
26.600 23$95
.
.
9.500, 17,80022,800F 22,000
EDUCATION (9 - 10 Months). ,
Entrance.'.
,
15,300 , 19.000 16,180Maxithum 20,000 23,000_ 20,000 19,000
EDUCATION (11 .: 12 Months)'
Entrance 15,000 20,000
)
21,900 19,125 21,022 17,400Maximum
, 19,363 27,700 26ip00 27,300 24,100 20,167
TOTALS.
Entrance 1
,
16,000 :77,275 _ 16.822 16,000_
.
161200 18,000Maximum 20,000' 22,201\ 21,300 20,000* 20,300 22,692
* ASCE Grade Classliiimation Series comprises'eight professional grades, which are*
based grpde for grade on the requirement for hefU.S. Civil Service Cothmissionprofessional .grade'series, identified as GS t,12, ,13', 14, 15,, and 16 respectively.
,7 (Grades 1 and 2), GS- 9., 11,
:-,-,
,
,
98z
,"

SOURCE:, American Society of Civil Engineers, ASCE.Salary Survey 1975.
ANNUAL SALARIES OF CIVIL ENGINEERS B12 EQUIVALENT'AkE GRADE LEVEL,C
1973 AND 1975
G.S.
GRADEASCEGRADE
I/II,
1973SALARY
,..,
$ 8,055
1975SALARY
$11,607
PERCENTCHANGE
.
44.15
7 9,.;
9 9 12,518 25.6-9 III ' 12,167 13,482 10.8 1
11 IV 14;671 16,255, 10.812 -V 17,497 15 19;386 -1-,, '10.813 VI 0 20,677 22,906 - ' 10.814 VIII '' 24,247 - 26,861 T0.815 VIII 28,263 31,309 , -10.816. IX, 32,806 4, 36,338 10.817 .IX 37,976* . 42,066* 10.818 IX 43,926* 48,654* 10.8
\.)
* The rate of basic pay for.eMploYees at.these rates as limitedby Section 5308 of Title 5 of the United Stpte§ Code to the rate forlevel Vs of the Executive Schedule (as of the effective date of thisschedule: $37,800). It has been raised to $47,500 as of,Feb. ,20, 1977. .
TABLE 94
AVERAGE TOTAL COMPENSATION. OF CIVIL ENGINEERS INCLUDING FRINGE BENEFITSBY ASCE GRAbES, EQUIVALENT - FEDERAL GRADES AND, CLASS OF EMPLOYMENT, 1975
CLASSOF
.
EMPLOYMENT
ASCE GRADES AND EQUIVALENT FEDERAL GS'GRADES.
'.GS-15GS-5 - GS-7
I/II'GS-9
III
GS-11
IV
GS ;12
1 V
GS-13
'VI
GS-I4, VII VIII
$33,298$40,47'7
GS-16IX .
CONSULTANTS ,_$13,457 $46,074 $18,400 $21,377 $24,901 $28,731CONTRACTORS ,------ 13;982 16.297 24,092 27,568 33,349 .39,317 44,665aSTATE-DEPARTMENTS,& AGENCIES (TRANS-PORTATION, HIGHWAY,.PUBLIC WORKS, ETC. 14,601 19;002 20,423
..
211,037
,
26,303 27461 31,542
,
35;2MUNICIPALITIES,COUNTIES ®IONALAUTHORIT S w 16,709
.
18,211,
.
20,484 22,340 25,426 27,267
,
32,351
)39,122
RAILROADS,
UTILITIES &INDUSTRIES
.
17,620 19,107 22,103 24,401
,-.
28,697 32,834
..
,
38,323
. '''
- .
46,202)
65,000
EDUCATION
(11-12.Months) 13,145 17,026 19,550 22,764 26,303 32,367
.
32,665ON
9-1 , -... :,:iisiiielt
12,410,
,.
16,241 18,46B 22,782
.
26;300 30,166_ 35,900
99.r,
e

4rJ
lle
.
r.JRCE: 'American Society of Civil Engineers, A5CE 5ilary Survey 19754
TABLE 95
AVERAGE OF.MEDIAN ENTRANCE RATES FOR ALL GRADES OF CIVIL ENGINEERSBY CLASS OF EMPLOYMENT,-1973 AND 1975
.
.
CLASSOF
..-
'EMPLOYMENT
Average of Ne.dian Entrance Rates-All Grades, ,
,.
' '1975
t-,
. 1g7i
PercentChange1973-75
leximumRakes.'1975
Consulting Firms : $i801 $16,067,' .+1.7.5% $24,025Construction Firms 20,450 17,183 +19.0% . 27,125.State Departments andAgencies (Transportation,Highway, Public Vorks, etc.)._
.
17,674
.
.
15,-375 +15:QT 2.3,522
Mubicipalities, Counties,and Regional Authorities
. 19%202f-
,
15,295 +
..
25,5%. .
,2J,385Railroads,
A
Utiliti.and Industry . 21,236 17,344 -1 +22.4% ' 28,925
SOURCE: Society of Manufacttring Engineers, Inc., Compensat4fn inManuidcturing,Part I: Manufacturing Engineers, 1976. t
NUMBEANQ TOTAL ANNUAL INSOME OF MANUFACTURING ENGINEERS.BY TYPE4OF EMPLOYER, 1976
TABFI,,
TYPE OF EMPLOYER 'Total
EmployeesMedianIncome
MeanIncome
Chemical, Rubber,& Plastics Products 46. $18,601 $20,558
20,753PriMaty Metal- Industries 50 ..4'
'9
18,398
Fabricated Metal Produp . 247.. 16,900 17,452
Machinery (Except Ele6rical) 1E1 16,800 18,404Electrical and Electronic Equipment 243 18,760
,
18,989Transportation Equipment
. 348. 20,000 "20;338/
17;160
19,126
'20,671
Instruments & Relates/ Products 55 17,000
Other Manufacturing Industries '192 17,078 \'Other Non-Manufacturing Industries .
19,606 1
100
79
V
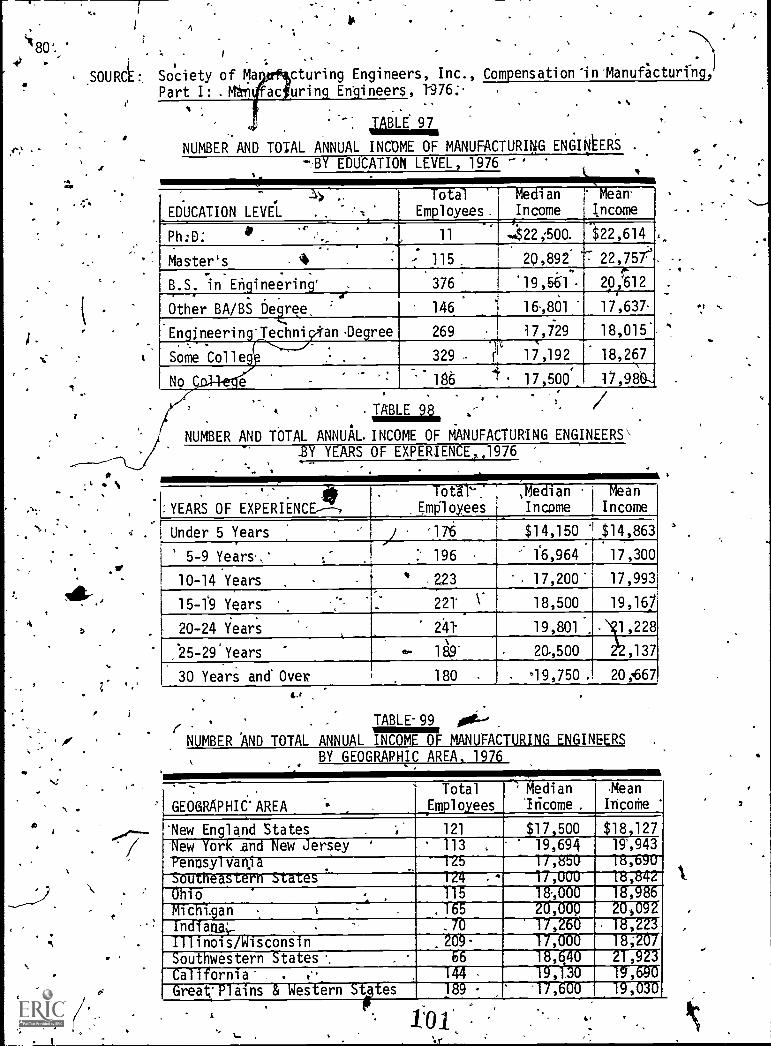
.
-..
SOURCL Society of MaPart I: .M*i
Afl
'N
cturing Engineers, Inc., Compensation in -Manufacturing
uring Engineers, 1976:
BLE 97
NUMBER AND TOTAL ANNUAL INCOME OF MANUF1CTURI4G ENGINEERS .
BY EDUCATION LEVEL, 1976 -'
-.4 ,
....EDUCATION LEVEL . . '-',
Total
Employees.Median -1.
Income
Mean'
IncomeE.,
Ph:D: . . 'c''._ : ., 11
. n422;500. $22,614
Master's . '4 . - 115. 20,892 '' 22,757. . .
B.S. in Engineering' 376 "19,66-1. p1612. .r
Other BA /BS Degree, ' 146 " 1,801.
17,637
'Engjneering'TechniyanDegree 269 _ 17,729 18,015
Some Colleg . 329 - 17,192 18,267, .
No e 186 4' - 17,500'. 17,90-
TABLE
NUMBER AND TOTAL ANNUAL. INCOME OF MANUFACTURING ENGINEERS'BY YEARS OF EXPERIENCE,,1976
. it:YEARS OF EXPERILNCE----,
Tot11-:Employees
MedianIncome
I MeanI Income
Under 5 Years ' '17.6 1 $14,150 $14,863
5-9 Years... :-
,/
. 196 ' 16,964 17,300
10-14 Years . 11 223 17,200' 17,993
15-1'9 Years.
221' V 18,500 19,167
20-24 Years i -
24 19,801 .V,228
22,13725 -29i Years .. 189' 21,500
30 Years and' Over 180 °19,750. 20,667
. rNUMBER AND TOTAL ANNUAL INCOME OF MANUFACTURING ENGINEERS
BY GEOGRAPHIC AREA, 1976
. TABLE- 99 joig-'
GEOGRAPHIC' AREA EmployeesTotal ' Median
'Income.
MeanIricoie
New England States 121 $17,500 $18,12719',943New York and New Jersey ' . 113 , 19,694
15enosylvanja . _125 17,850 18,690
Southeastern States 124 - 17,000 18,842
Ohio.
115 WOO 18,986
Michigan . 165 26,000 20,092
Ind-Tara.-- .70 17,260 1S,223
18;207Illinois/Wisconsin .209 17,000Southwestern States .. . 66 18,640 2T,923
California* . .- 144. 19,130 19,690
Great &'Plains Western StAies 189 - '17,600 19,030
1`01

I81
SOURCE: Society of Manufacturing Engineers, Inc., Compensation in Manufactaring,-Part. 1: Manufacturing Engineers, 1976. 0- t.
r.
7 - TABLE 100
NU ER AND TOTAL ANNUAL COMPENSATION OF MANUFACT011ING ENGINEERS'-13Y( TYPE OF. JOB FUNCTION, 1976
.
JOB FUNCTION . .
Total,
Employeesy Median -Income
,Mean'
Income, .
Cost' Estimating 40 '' $18,443 $18,721
Industrial Engineering 105 17,265 17,687
18,788Manufacturing Engineering 380 i 18,032
Manufacturing Planning 7.2,{ 18,809 22,312
Mechanical Engineering' 49 e 18,000 18,053.Methods & Systems Engineering , 61 16,484 17,755
ProceAEngineering , .70 19,000 19,666
Production Engineer.ing . 40 19,550 19;403
Qualicty Assurance Engineering 58..---
17,900 17,981
Tool Engineering , , 171 17t10q , 18r149
Other Manufacturing Engineering A* 63 16,000\-----0/,'779
18,425 -18,534
.19,079
21,965
19,623
24,971
Equipment Design Engineering--- 36
Product besign Engineering .7? "4 18,750
Research & Development Engineerinb 55 21,230
Other R & D PrOduct Design Functions 25 17,988
Technical ales Engineeriq 75 20,001-
All Other Engirieering Functions . 60 15,50 '17,324
A -
in
4
.
.4
S.

. ./
82
SOURCE: 'Americah Institute of Industrial Engineers, Inc., Cbmpensation of IndustrialEn_gineers, June 1977. .
*
,
kTABLE 101
.
NUMBER AND TOTAL ONUALINCOME OF INDUSTRIAL ENGINEERS/AY DEGREE LEVEL, 1977
.01
U.
0
DEGREE LEVEL( , Total
EmployeesMediam,Income
MeanIncome
Ph.D. 357 $27,0.00 .$29,165
MA/ME/MS - 1,146 23,501
24,200 J
26,267.
2.7,022'MBA , 775
Bachelor's (Engineering) 2,360 21,000 23,194
Bachelor's (non-Engineering) 855 '21,400
19,180
23,011
20,820.
Less Than Bachelor's Degree 825____
TABLE 102
NUMBER AND TOTAL ANNU L INCOME OF INDUSTRIAL ENGINEERS-BY YEARS 0 EXPERIENCE, 1977
a
4.
, ' YEARS OFEXPERIENCE
Total
Employees' Median
'Income
Mean
Income
Under 2 Years 204 $14,401 $15,778
2-4 Years 946 16,277 17,111
5-9 Years 1,401 .
*
19,769' 20,583
24,08210-14 Years 1,166 23,040
15-19 Yearsf
N'TO -25,446 . 27,884.
20L24 Years. 7864
26,061 29,331
25-29 Years 650 27,115 30,400
30 'Years and Over . 305 / 26,001 31,624
.
. -
? NUMBER tAND TOTAL ANNUAL INCOME OF INDUSTRIAL ENGINEERSBY GEOGRAPHIC AREA, 1977
GEOGRAPHICAREA
TotklEmployees
MedianIncome
Mean
Income
Northeastern States 1,452 $22,500, $25,423a
Southern States 1`,391 21,600 23,146
Midweste'rn'States 1,456 21,800 24,191
southwestern fates 439 J 21,960 24,168
Plains States 413 20,715
22,350
22,228'
24,441Mountain States 176
Pacific Stat 643 23,580 25,790
Canada . 398 21,001 22,776
....)
103- 11'

0
. , '83
SOURCE: American Institute of Industrial Engineers, Inc., CompenSation.of IndustrialEngtneers, June 1977,
. TABLE 104
NUMBER AND TOTAL ANNUAL INCOME'OF INDUSTRIAL ENGINEERSBY TYPE OF EMPLOYER, 1977
,.
TYPE OF EMPLOYERL.
otal
E loyeesMedianIncome
Mean.
IncoMe
Fopd and Kindred Products 246, . $22,904 $24,931
Jextild Mill Products.
94 -, 19,238 20;699.% .
A parel and Other Textile-Products -116 20,251 24,659
F rniture & Wood Products. . 43 V 17,400 21,835
yap& and Allied Products 160 2,590 23,690
Printing and:Publish44/ ,
.
88 j 21:497 23,236
Chemical and Allied Products '378 .22;605 .24,838
Rubber and Mtsc. Plastics Products 46 . .g2-0,000 . 22,310
Stone, Clay and Glass Products 141 21,000 22,938
Primary Metal Industries 348 22,501. 24,423
Fabricated Metal Products , 806 19,671 22,023
. Machinery (Except Electrical) . 211 21,300 24,453
Electrical and Electronit ,Equtpment /, -
789 21,500 23,144
Transportation Equipment - 304 21,391 23,141
Instruments & Reat4d Rroducts \ 71 19,001 22,190,
Banks and Finance Orlganizations - 84 19,851 25,016'
Colleges and Universities 365 25,000 , 26,973
Communications Organizatiotns 308 27,800 32,317
Consulting Organizations 308 , .27,800'
24,000
.32,31;
.24,547
7 . ,Governmdntal Organi,zations 543 -',._.,
Hospitals.and Health Organizations 231 20,500 21,804
18 689Insurance'Companies 45 . 17,450
Merchandising (Wholesale and Retail) 97 24,000 '25,510
Public Utilities . 104 : 22,813 ;23 105,
2590_Trancnortatinn and Warehousing \ 127' 24.000
1
104
4

4
4
SALARIES OF ENGINEERING TECHNICIANS AND TECHNOLOGISTS
From 1975 to 1977, median annual salaries of'engineering technicians .
increased,13.5% for new graduates, 15.0% for those out of schobl five years, 15.1%for those out of school 9-11 years; anq 12.5% for those graduating 21-23 years ago,,according to studies by Engineeking Manpowek COMOlabi011 06 Engineers Joint Councit.Table 105 shows number, median and, mean,annual salaries for engineering techniciansin 1977 by years since graduation, while Chart 9 presents the picture in graphic form.
In 1975, the salaries of engineering technicianfincreased about 5.2% from.1973 for those just out bf school and 8.9% for those vOth 35 or more years since
graduation. Graduate technicians start out aesubstantially higher salaries than non-graduates; but the advantage is reduced and' ultimately slightly reversed withincreasing experience. The median annual'salary for graduate technicians in 197.5started at $9,200 for those with less than a year of experience, increased steadilyto $13,000 twelve 12 years after graduation, then rose gradually ,to a maximum of $13,700,
The 1975 survey, results are based on returns from 630 different establishments,
employing 71,537 technicians, Tables 106 and 108 present median salaries'of engineering-technicians by type of employment and selected years since graditation.
Engineering technicians working in the western states have higher median ,salaries during the first 20'years of their, careers. However, after 20 years of ,
working, those engineering tahnicians in the north central area have higher medianannual salaries (Table 107)
1.
4 The small group of bachelor of technology graduates (about 2,400 in the 1975 ,
survey) repbrt median starting salaries of $10,400 in 4975, 13% higher than the medianfor,two-year graduates'and 35% more than for non-graduatei. Median salaries ofkachelor of technology recipients by type bf employmeft and selected years tincegraduation in 1.975are presented in Table 109. .
r N:
105
4

1
SOURCE: Eri,ineering Manpower Commission, Salaries of Engineering Techniciansechnologists, 1977.
ir-
an
TABLE 105
NUMBER, MEDIAJ1 AND MEAN ANNUAL SALARIES OF ENGINEERING TECHNICIANSBY YEARS SINCE GRADUATION, 1977
YEARS SMCE,GRADUATION
NUMBER OF /\TECHNICIANS
. SALARYMEDIAN MEAN
0'.
. 613 . $9,650 ' ,$10,1501 1,326 , '50,100` 10,5502' 1,690 10,550 ", 10,9503 2,065 11,000 11,350
2,273 11,450 ( 1 ,750 ,
5 2,270 '----' 11 850. , 12,150
.6 162,040 - 12,300. 12500-
7 - 2,205, 12,656 12,9008' 2,496 '13,050 13,200
. 9-11_ 7,324" 13,700 13,85012-14 ,6,235. 14,500. '" 14,650
° T5 -17 5,426 15,100 15,250T8 -20 . 5,011 15,500 15,650_.;
21-23 , 4,399 15,750 15,90024 -26 3,602 15,900 16,05027-29 3,520 15,950 16,100..30-34 4,860- 15,930 , 16,100
. 35+ 6,179 15,950 - 16,100'
CHAT 9 -?ANNUAL SALARY OF ALL ENGINEERING TECHNICIANSBY EQUIVALENTYEARS SINCE GRADUATION FROM
TECHNICAL INSTITUTE, 1977* 1
22 000,
20,000
18 090
16,000
14,000
12,000
10,000
8.000
....
0 2
LEGEND
Upper DeceleUpper ()usableMedianLowerOlaroleLower Decile
4 6 8 10 12 14 16 18 20 22 24 26 28 30 12
Base year (0. years since graduation) is 19 7For Associate degrees and nongraduales this ftconsidered equivalent to age 20
. 10.6N
6
85

864,
SOURCE: Engineering Manpower Commission, Salaries of Engineering Technicivs and Technologists, 1975 0
ti
TABLE 106
NUMBER AND MEDIAN SALARIES OF ENGINEERING TECHNICIANS BY TYPE OF EMPLOYMENT' AND SELECTED YEARS SINCE GRADUATION, 1975
Amor
.
TYPE OFINDUSTRY
'YEARMINCE GRADUATION - BASE YEAR 1975 .
.
5 7 9-11 ,15 -17 18-20 21-23 27-29 3+
All MechanicalProducts
(103)
9 500
(148)
10 900(169)
11 550
(444)
12 350
(378)
1 6'4
(391)
1(343)
21(300) (568)
$11;750'
1663)12.700
(158)
19,150
(274)
13,300
Aerosiace'(8) (26) (42)
8 800 10 2.s 11 :
(133)
11
n"* 1
(121)
3,250.
052) 1
13.400(111)
13 300.
% .
Machinery .
, (41) i -(55)
9,950:1 11,800.(63) .
12,700:(151)14,050
(141)
16,4002(137)17,250
010 417,950
(90)
18,750
(136)
13,600Metal
Products(60) i ',(61)
9,150 10,500(83)
11,150.(225)
12,000(143)
13,150,
(164)
13,450(127)
'13,600
FabricatedMetal Products
(43)
8,950(64)
10,450'(76)'
11,150(187)
12,050(121)
13,300(136)
13,600(108)
-13,750
. (110)
13',700
(238)
1,400
Metals8asic..
& Mining,
(17)10,400
(17)
10,950
(7)
11,200, (38)_ (22)
11,600 12,300
(28)
12,600(19)
12,850(26)
32150(36).
13,000.
Electrical & Elec-ironic ProdUcls
(355)
'9,900(717)
11,150'
(879)
11,700
(2,127)- (1;515)
12,00 13,350
(1,347)
13,55b(1%,262).
13,650
(1,462)14,600
(1,053)
13,550
(1,166)14,450
(1,199)
13,100
(1,031)
-12,750ElectricalEquipment
(273)
11,15Q
(704)
12,050
(804)
12,500
(2,163) .(1,759) .
13,150 14;150 .
(1,645)'
14,450
ElectronicEquipment .
(163)
9,250
(244)
10,850
(285)
11,550
(527) (319)
12,400 tI3,600
(234)
113,950
(241)
14,150(229)
1,400(322)
14,500
All ConsumerProducts
(47)-
9,700
(93)
11,050
(93)
11,650
(177) (152)
12,450 11,650
4156)14,050
(157)
14-050
(177),
14,700(222)
14,900
Chemicals
(21)
9,400
(19)
11,000
(22)
11,800
MO (27) ;
12,800 14,200
. (35)'14,550
(42)
14,700(43)
14,600'(39)
14,150
. Petroleum
(20)c10,000.-
(4p)
10,950
(65)
11,450
(117) (90) (111)
12,100' 13,350 al3,850
(126) .
14,300(129)
15,000
(168)
15,600
Pak':
- (16)
11,300
(10)
11,850
(30) (39) -% (29).
12,500 13,250 i. 13,400-
(21)
13,456(30)
,13,400
(26)
13,350
.
Construction .:
(47)
9,300
(34)'
11,150
(38)
12,050
(101) (86) (88)
13,300 15,100 15,700
(54)
16,400(38)
16,450(77)'
16,550
Engineering &Architectural,
Consulting
(144)
8,300
(161)
10,450-(172)
11,350
,(321) (212) (200)
12,450 13,800 14,2009
(14$) .
14,400
(115)
14,600
(201)
14,650
TechnicalServices, Other
(10)
'7,800
(24)
9,750
(24)
10,750
(55) (38) 1 (34),
12,200 14,500 15,150
(21)
15,400
'(20)
15,2.50
(29)
14,... 300
Research &Development .
. (124)9,250
-245111,900
(321)
12,750
(575)f, (567)-
13,550 :14,250(477) '
14,350 .
'(409i
14,400
(381)
14,450
(662)
14,450
Industrial
R & D
'.(38)10,000
(150)
12,400
-,(189)
13,200
( 94) (275)
13.50 t 14,650
(245)
14,750-(229)
14,800
(231)
14,850
(352)
14,85
R & DLaboratories
(30)
7,850
(32) .
9,100
(51)
92750
(89) (122)
10,700 12,500(67)
13,200(70),
13,750
(63)
14,200(33)
13,350
ElectricUtilities
. (90)
9,350
(158)
'_11,250
(1X)12,T00
(471) (272)
13,150 14,700
(218)
153150(183)
15,500
(200)
15-2850
(214)
16,000.
Gas Utilities& Pipelines' -
(9)
11,600
2 (13)
11,750
(41) (44)
12,000 12,450
(52)
12,700
(75) .-
12,900
. (52)
)3,350457).
14,050
CommAications
.
. -
(9)11,950
(12)
13,050
(39) ,--(38)
14,450 16,150
(32)
16,600
- (21) ".
16,900
(12)
17,150(21)
17,200
1E)a

. .87
SOURCE: Engineetin Manpower Commission, Salaries of Engineering Technicians andTechnologist, 1975.
TABLE 107 ..,00"-
NUMBER AND MEDIAN SALARIES OF ENGINEERING TECHNICIANS 'IN INDUSTRYBY.GEOGRAPHIC AREA AND SELECTED YEARS SINCE GRADUATION, 1975
GEOGRAPHIC
AREA
YEARS SINCE GRADUATION - eASE'YEAR 1975 :
1 ' 5 .7 9-11 15-17 18-20 21-23 27-29
---*-.s.tNcirtt$9,150
(32Z) (581)
$10,700(779)
$11,250(1,801)
$11,900(1,177)
$12,650(1,101)
$12,800(1,024)
$12,900(907)
$13,000(1,4674-
$13,050North/ (189). (277) (304) (745) (517) (461.) (404) (3.80) (601)Central 9,000 10,950 11,850-,13,000 14,550 15,050 15,350 15,700 15,800
(187) (257) 3141 ,(716). (516) ,(428) 1059) (407) -(463):Squth 8,950 10,250. 1 850 11,650 12,850, 13200 13,450 13,650 13,600
(107) '(91) 014) (257) (256) (237) (163) -(159) (287) -West 9,600 -11,750 12,700 13,800 14,950 15,100_ 15,000 14,900 14,650
TABLE 108
ROMBER'AND MEDIAN SALARIES `OF ENGINEERING ,TECHNICIANS BYTYPE OF EMPLOYMENT AND SELECTED YEARS SINCE GRADUATION, 1975
TYPE OF
EMPLOYMENT
- YEARS SINCE GRADUATION - BASE YEAR 1975
1 5 7 9 -11'f 15-17 18-20 21-23 '27-29 35+
(895) (1,457) (1,743) (4,140) (3,070). (2,796) (2,490) (.22213) (2,968)All Industry $9,300 $11,100 $11,800 $12,600 $13,6009 $13,8509 $14,000 $14,150 $14,2QT. .
All ManufaCtur- (505)' (958) (1,141) (2,748) (2,045) (1,904) (1,762) (1,530) (1;989)trig Undustry 9,700 '11,050' 11,650 12,400 13,400 13,600 13,750 13,750 13,550
All Non -Mfg. (390) (499) (602) (1,392) (1,025') '(892) ".(728) (683) (979)Industry 8,850 11,050 .11,950 13,050 14,400 -,14,750 14,95L 15,-150 15,200
Feder#1 (121) , (17)) (198), (537) (517) (450 (350) .(288) (808)Government. 7,950 .9,500 10,250 11,300 13,100 13,750 14,250 14,850 15,200
State _ (245) (359) , (504) (1,231)' (1,178) (1,171) (846)- (505) (1,028)Government 1,300 8/800 9,500 10,500 11;900 12,250 12,400 12,200 11,500
Local.,,,,,- '` (19) '74) (46) (154) (123) (116) (102) (111 (143)Government 8,850 10,600 11,408 12,500 14,100 14,600 15,000 15;45 15,650
Education (11) (37) . -130) *(79) , (98) (85) (106) .(93) . (274)8,400 9,900 10,550 11,350 12350 12,600 12,700 12,650 12,550
Engineering.
(6) r(25) (24) (63.) (85) '(77) (98) -(87) (249)Schools -e,750 ,10,050 10,600 11,400 12,350 12,600- 12,750 12,700 -12,500
Technician (5) (12) (6) (16) (13) . (8) (8) (6) :25)Schools 7,900 9,700 10,500 11,450 12,550 12,750 12,850 -12,850 12,800
A
108

88
SURCE: Engineering Manpower Commissi6h, Salaries of Engineering Technicians and
Tethnologists, 1975.
TABLE 109
NUMBER AND MEDIAN SALARIES OF ENGINEERINGTECHNOLOGIST5....BY TYPE OF EMPLOYMENT AND SELECTED YEARS SINCE GRADUATION, 1975
TYPE OF YEARS'SIINCE GRADUATION - BASE YEAR 1975
EMPLOYMENT , I 5 7 '9-11 15-17 18L20 21-23 27-29 35+
All tmployme'nt (193) (161) (101) (224) (108) (92) (124) (64) (83)
Sectors $11,200 $12,600 $13,150 $14,350 $16,100 $17,000 $17,000 $16,000 $13,450
46All -.- . (165) (122) (83) . (184) (75) (63) (77) (42) (55)
Industry 11,500 13,050 13,750 14,600 15,500 15,550 15,400 14,750 13,450
All Manufact- (81) (52) (49) (121` r (50) (44) (48) (32) (40)
uring Industry 11,200 11,000 12,200 13,450 16,200 14,000 12,900' 12,850 13,050
All Non-Mfg. (84) (70). (34) (63) (25) (19) . (29) (10) (15)
Industry 11,650 13,900 14,800 15,950 16,150 18,500 19,150 18,000
-All Mechanical (22) (9) ,(17) (50) (20) (20) (11) (7). (6)
Products 12,000 1450 16,250 18,550 - 20,000 - - 15,550
Electrical &Electronic (72) (51) '(26) 09) (37) (27) (37) (29) (28)
Products 10,650 11,150 11,000 11,900 15,150 12,250 12,700 12,600 11,850
Construction . (47) (34) (12) (27) (19) -(9) (20) (6)- (13)
& Consulting 11,400 13,000 14,000 17,150 .15,900, 18,500 18,000 20,000 -
All'Research & (19) (19) *(6) , (9) (5) (2) '(3) (1) (1)
Development 10,550 13,400 12,500 12,750 '13,750 -
'(31) (32) (17) (25) (4) (5) (6) (4) -
Utilities 11,750 14;850 15,100 15,650 - 17,250 20,000 - -
All (19) (23) (ON (29) (22) 24) (39) (20) (16)
Government 10,750 12,250 12,500 11,650 16,000 - - 17,000
(9)( (16) (12) (11) -.01 Y (5) (8) (2) (12)
Education 10.250 12.500 15.000 13.250 12.950 16.500. 11.750 - 12.250
(
109

4 89
FEDERAL SALARIES
On October 1, 1977,'1.4.million federal white-collar workerS-anNa 2 millionmilitary personnel around the world received a 7.05% pay increase. The annual federalpay raise is designed. to. keep federal employees' pay on a jar.witOtheir counterpartsin private industry. With the pay increase, the average salary of the white-collar,worker in the.Washington, D. C. area will ..go from $19,430 to $20,800, according to the'U.S. CivilService Commission, while tht national average rises to $17,674 from $16,510.
At the top levels of the General Salary SChedule ftefederal workers, theraises Will be smaller and in some cases nonexistent, since federal career salaries arepresently limited by law to $47,500 (Table 110). Table 111 presents the white-collarsalary.schedule in effect from October 1, 1976 to October 1, 1977...
Table112 'presents the median grade and average salary of federal white-collarworkers sex in all areas as of October 1976,- Women continue to be paid less than men
almos all the occupational series listed." Even in the "secretary" category (where .
the bulk of female employees working for the federalgovernment are concentrated), menearn slightly more than women - $11,940 to $11,937 respbctively.
Among the engineering specialties, general engineers had the highest averagesalary - $28,935, followed by aerospace engineers at $28;662 and materials engineersat $27,946. In the sciences, those persons in the "general fish and wildlife"category earned the highest salaries, $31,951, followed by astronomers and spacescientists at $30,234. Salaries in the health and medical areas show wide variationbetween medical officers at the top and dent-61 assistants at the bottom (Table 112):
Tables 113 and 114 Oesent a comparison of salaries of federal workers witfithose of workers in prViate industry in' 1975 and 1976. Salaries,paid personnel inprivate industry are generally higher than thole paid by the federal government-inthe higher paying jobs. For example, a chief chemist in private industry earned140,723 in private industry, but only $38,077,in the federal government (Table 113).In loWer level jobs, however, the federal salaries are sometimes higher such as fora secretary with medium experience.
v
O
O
4
C.

SOURCE: U:S. Civil Service Commission
TABLE 110'
:ANNUAL SALARIES OF FEDERAL WORKERS UNDER THE GENERAL SCHEDULE BY GRADE AND STEP LEVELS,: OCTOBER 1, 1977
".00
1 2 3 4 . 5 6" 7 8 9 10
GS- 1 $ 6,219 $ 6,426 $ 6,633 $ 6,840 $ 7,047 $ 7,254 $ 7,461 $ 7,668 $ 7,87ks,
8,915
$ 8,082
9,1502 7,085 . 7,270 7,505' 7,740 7,978, 8,210 8,445 8,680
3 7,930 8,194 8,458 8,722 8,986 9,250' 9,514, -9,778 10,042
11,278
10,306
.11,5754 8,920 9,199 9,496 , 9,793 10,090 10,387 10,684 . 10,981
5 "9,959 10;291 10,623 10,955 .11,287 Y .11619 11,951 '-12,283 12,615 12,947 6.
6 11,101 /11,471 11,841 12,211 12,581 12,951 13,321 13,691 T4,061 14,431
7 12,336 '12,747 13',158 3,569 13,980 ''14,391 14,802 15,213 15,624 16,035..
17,757 ''' 8 13,(62,/ 14,117: 14,572 '15,027' ,i., 4i,482 15,937 16,847 17,302
, 9 15,090 15,593 16;096 _16,599 ' 17,102 17,605 18,1 8 18,611 19,114 19,617
1,0 16,618 17,172 17,726 18,280 18,834 19,388 19,942 20,496 21,050 21,604
11 .18,258 18,867 19,476 20,085 . 20,694 21,303 21,912 22,521 23,130 23,739
12 21,883 22,612' 23,341 24,070 '24,799 25,528 26,257 26,986 27,715 .28,444
13 26,022 26,889 27,756 28,623 . .29,490 3Q,357 31,224 32,091 32,958 33,825
14 30,750 31,775 32,800 33,825 34,850 35,875 .36,900 37,925 38,950 39,975
15 36,171 37,377 . 38,583 39,789 40,995 42,201 43,407 44,613 45,891 47,025
16 42,423 43,837 45;251 46,665 48,079* , 49,493* 50,907* 52,321* 53,735*
17 49,696* 51,353* 53,010* 54,667* 56,324*
18 58,245* ,/
* The rate of basic pay for employees at these rates is limited by section 5308 of title 5 of the an,ited States Codeto the rate for level V of the Executive Schedule which, pursuant to Public Lak 95-66, would remain $47,5Q0.
-1% 112,

SOURCE: C.S. CiVil Service Commission
a
TABLE 111
ANNUAL SALAkIES OF FEDERAL WORKERS UDDER THE GENERAL SCHEDULE gY GRADE AND STEP LEVELS, OCTOBER 1976
'44'1.4,4.
I
1 .1 '2 3 4 6 7 8 9 10
GS- 1 $.5.810 ° $ 6,004 $ 6.198 -$ 6,392 $ 6.586 $ 6.780 $ 6,974 $ 7.168. $ 7.362 $ 7,5562 6,572 6,791 7,010 7,229 7,448 7,867 7,886 8,105 .8,324 8,543
3- ' 7,408 7,655 7,902 8,149 84396 8,643 8,890 9,137 9,384 %), 9,631
4 8,316 8,593 8 .870 9,147 9,424 9,701 9,976 ''10,255. 10,532 10,809
5 .. %., 9,303 9,613 9,923 10,233 10,543 10,853 11,163 11,473 11,783 12,093
-.6s. 1,0 370 10,716 11,062 11,468, 11,754 12,100 12,446. 12,792 13,138 13,484'
: 7 11,523 11,907 '12,291 12,675 13,059 13,443 13,827 14,211 14,595 14,979
8 12,76q 13;1.88 13,613 14,038 14,463 14,888 -15,313 15,738 )6,163 16,588
9 14,097 14,567 15,037 15,807 15,977 16,447 16,917 17,387 17,857 t 18,327
TO 15,524_ 15,041 1 , 8 17,075 % 1,592 ,18,109 18,628 19,143 19,660 20,177
.11 17,056 17,625 18 194 18',763 19,332 19,901 20,470 21,039 21,608 22,177
12 20,442 21,123 ---2*, 04 22,485 ' 23,166 23,847 24,528 25,209 25,890 26,571
13' if 24,308 25,118 25, 8 26,738 27;548 28,358 29,168 29,978 30;788 31,598
14 28,725' q 29,683 30,841 31,599 32,557 33,515 34,473 .35,431 36,389 37,347
15 83,789 34,915 36,041 371167 38,293.- 39,419 40,545 41,671 42,797 43,923
'16 39,629 ..' 40,950 42,271 43,592 4 ,44,913 46,234 ., 47,555 48,876 50,197
17 46,423 47;970* 49,517* 51,064*. 52,611*
18 ,54,410* 4 .
* The rate of b &ic pay for employees at these'rates is limited by 'section 5308 of title 5 of the United StatesCode to the ate for level,V.of'the Executive Schedule (as of the effective date of this schedule, $47,500).
113
It
41!
O

-)0
SOURCE: U.S. Civil Service Commission, .Unpublished Data, October 31, 1976.
TABLE 112
NUMBER,,MEDIAN GRADFAND.AVERAGE SALARY OF FEDERAL WHITE COL AR WORKERS BY SEX, ALL AREAS, OCTOBER'1976
OCCUPATION SERIESAND GROUP
..
.
TOTAL MALE FEMALE
Number
MedianGrade
AverageSalary Number
'Average
Salary NumberAverageSalary
General 'Engineering H.. 16,250 13 $28,934 16,138 $28,987 112 $21,379
Engineering reclini-cian 25,901 9 16,779 24,994. 16,952. 907 12,007
Safety Enginee4ing 563 12 24,678 55? 24,668 6 25,643
Fire Prevent Engineering 100 13' 25,713 99, 25,766 1 20,442
Materials Engineering 869 13 27,946 857 28,022 12 22,464
Landscape Architecture 569 12 22,497 547 22,621 22 19020Architecture 4 1,523 ,12 23,1137 . 1,454 23,209 69 . 19,412.
Construction.Control 3,749 9 151888 3,734 15,903 15.. 12,147. .
'Civil'Engineering, 15,274 12 23,921 15,173 23,956- 101 18,705
Surveying Technician . 2,718 4 10,276 2,613 10,386 105, 7,542'
Engineering DraftingEn sneering
2,422
. 1,214
5
12
11,34222,158
-2,0641,200
11;,441
22,225358
14
10,773' ,
16,432'
onstruct,ion nalyst1Sqanitary
. 1,050 11 20,903 1,032 . ',. 20,980k .,:, 4 16,569 ,
echanial'Engineering. 10,085 12 .23,871 10,044 23-, 88 +.,, 41 19,649.
Nuclear Engineering 2,152 13 27,263 2,141 .27:2 6 12 21,466,
Electrical Engineering 4,535 12 23,189 4,501 23,2 4 - 34 19,972 c
Electronics Engineering ' , 191411 12 25,532 19,481 25,56'5 130 20,51e'Electronics Technician 24,320 11 ' 19,688 24,163 N 19,733 157 12,666
Aerospace Engineering 8,451 13. 28,662' '8,359 28,731 92 22,339
Naval Architecture 1,02/ 12- 25,892 1,015 -' '25,915 8 22,975
Mining Engineerin< . 508 13 25,778 507 25;801 - 1 °141,097
Petroleum Engineering 351 13 24,985 349 25,053 2 4,3,251.
Agricultural'Engineering 443 11 23,094 . 443 23,094 . 0 - .
Ceramic Engineering \-1 54 13 26,958 , 52 27,330 2 184Chemical Engineering 1,398 12 25,401 1,382 25,466 16 19,794
Welding Engineering 69 12 24,581 . 69 24,581 , 0.
Industrial Engr. Tech. 2,477 9 17,508 2,378 17,635 99 14,456
Industrial Engineering , 2,455 12 23,874 2,439 23,9033 903, ,16 ' .19,443
Trainee, Engr. 8Architecture 1,036 4 8,361 907 . 8,443 129', -7,782):
Biomedical Engineering . 83 11 19,462 81 19,453 . 2 19,797
Ship Surveying , 52 12 21,996 52 21,996//
NOTE: Median Grade and Average Salary are based on those employees reported by general schedule grades
equivalent salary level. 116

,''' '.../
SOURCE: U.S. Civil Service ColOission, Unpublished Data, October 31,1976. .
---______,/, . TABLE 112 (ContinUed),
.
"'-NUMBER, MEDIAN GRADE AND. AVERAGE SALARY OF FEDERAL-WHITE COLLAR WORKERS B" SEX, ALL AREAS, OCTOBER 1976%
I
simmilme.
OCCUPATION SERIES I-
,AND GROUP
0. OTAL 2
o.MALt F E M /A L E
,
NumberMedian'Grade
AveageSalary Number
AverageSalaht
.
NumberAverageSalary
$23,01519,45622,404
General Physical ScienceHealth PlIsics .
Physics
4,596519
5:312
4'13
', 13 '
$29,754,.
24,521, 27,320
4,4qp504
54169
S30,02324,672 12745
176
15
143Physical Science Tech.GeophysicsHydrology
3,931404
7,12
12
_ 13 588 1, .
25:3460-101,360
3 186,
., 397
1,659
14-,093
25,42524,487
7457
28 .
11,428.
2Q,85616,803.
ChemistryChemistryMetallurgyAstronomy and Space Sci.
8,080607572
12
12 . ,
13
78,727.6,210 '
0,2344
6,852596551'
24,43026,24730,425
1,228. 11
21
19',804
24;20925,194
Meteorology ' ,
Meteorological TechnicianGeology
. 2,1452,543
2,053
12
10
' 12'
,254
16,631 s'
14,673, i
;2,101
2,353.1,905
25,42516,902
, 25,00
44190
148
' 17,08513,28620,089
,OceanographyCartography .
Cartographic Tednician.
1462,611
3,008
1
11
9
, 23,652
'- 20,95914,925
' -DO2,388,
2,291
3,95221,22715,496
36
223,717
17,735
18,09013,101
GeodesyFood Technology .
Forest Products Technology,
.' '252.174
124-
12,
12
>13
23,523 *
24,471
.G26,190
235
145
121 .
* 23,81425,556 .
26,403
17
293
19,500
19092.- 17,603
General Fish & WildlifeGen. Tiolog' al ScienceMicrobiology
1
)
171
3,5221,699
14 I
/ la'12
31,951
,312,-.4,147
170
2,954 .
1,178
32,01423,18423;640,
1
568521
'
21,10517,1'9-
18,770Biological clinicianZoology ,
Entomology
-. 5,750
135754
6 .
c-',1312
.11;779' 26,240
24,702
-4'036..: 119
729
12,06626,87524,948
1,71416
25 ,
11,10421,51817,5.32
Botany
.Plant PathologyPlant Physiology
)
. 4
,13p306
238
,12 .
13
13
22,865127,241
25,874
-97..
297.
227
24,211
'27,461
26,229
33
9
11
18,90719,916
18,558HorticultureSoil Conservation ,
Soil Science .4
924,4311,766
12'11
1.1,
*22 360 .? ...-
1-9,443 -20,108'
83
4;403-1,744
"23,458- 19,487 1
20,211
. 9
2822 .
12,237
12,440_11,927
Agronomy c,
Agricultural Management,Range Conservation
i,, .'
323
3,017801
12
11
9'
24,241*18;558
17,295 )
. -,322
2,988, 789
_24,27118,622
.17,393
, 1
29
12
14,56712,994
10,814Forestry
Fishery Biology .
Wildlife Biology
5,2061,065,
/ 723
11
11
41
21,50321,1,02
'20,746 '
5,190
1,018'. -- 702,4
21,526- 21,412
'20,866
16
. 4721
13,98714,391 ''
16,721
NOTE: Median Grade and Average Salary are based on those employees reported by general 5chedule grades or
117 eguivklent Clary level. = . =
t 118

SOURCE: U.S. Civil Service Commission, Unpublished Data, October 31,976..-
TABLE 112 (Continued)
NUMBER, MEDIAN GRADE AND AVERAGE SALARY'OF FEDERAL WHITE COLLAR WORKERS BY SEX, ALL AREAS, OCTOBER 1976
OCCUPATION SERIES
.AND GROUP
.
, TOTA L ..M A L E-. : F E M A.L E .
NumberMedian
GradeAverageSalary Number.
AverageSalary 'Number
' Average's
SalaryEconomics 5,026 13 $25,185 _4,170 $25,819" 656 $20,962Psychology
_2,950 13 25,543 2,55- 26,063 424 , 22,449
Social. Science 2,284 12 ' '24,162 . 1 ,569 25,214 715 21;852Social Work 3,108 11 20,121 1,762 2Q,607. 1,346 19,486Sociology - 87 13 24;266 55 26,217 32 20,912*Foreign Affairs 2,282 13 -27,140 2,004 27,865 278 , 21,906International Relations 83 14 r -29,274 64 31,923, 19 20,350Manpower Res. & Analysis , 50 14 ' 30,420 39 31,483 $ 11 26,650Geography 154 11 21,517 127 '22,207 27 18,276History
, / 459 24,275 387 24,976 72 20,506General Anthropology 62
.12
13 28,512 " 51 29,5656 11 23,630Archeology ' 169 9 17,203 124 19,035 *- 45
,;,.
12,155Secretary 64,036 6 11,940 . 453 12,252 63,58 11,937Digital Computer Systems 1,623 13 , 28,037 1,454 28,836 , 169 21,.163Computer 0 eration 11,363 7 12,965 7,154 13,747 4,209. 11,635Computer Specialist 25,379 k 12 21,882 1-. 20,503 22,477 4,876 19,383.Computer Aid & Technician . 6,449 5 11,707 2,339 12,418 4,110 '11,303Program Management '' 3,530 -15 34,182_ _ 3,355 341566 182 27,294Management Analys-k 10,485- 12 ' 21,757 8,004 22,807 2,481 18,369Communications Management , 2,095 11 , 21,347 1,970 21,637 125 16,791Program Analysis .. 9,623 12 24,401 7;153 26,037 2,470+, 19,663Communications Specialist 2,167 11 20e682, , 1,949 21,287 218 15,274,Operations Research . 2,673 13 27,993 ' 2,488 28,511 185 21,033Mathematics 4,178 12 23,511 3,382 . 24,191' -- 796 i 20i624."Mathematics Technician 265 6 12,171 107 11,752 158. 12,454Mathematical Statisticians 982 12 23,861 807-\ 24,690 175 20,040Statisticjan -. 2,427 12 23,399 . 1,862 ) 24,271 565 20,526Statistical Assistant 3,803 5 ' 11,95.6 681 11,958 3,122 11,954Actuary 101 12 - 24161r , 85 25,238 16 21,274Accounting 21,807 12 22,179 . 19,794 22,594 2,013 18,098'.Gegeral Attorney '-- 14,312 .-13 27,698 12,650 28,122 -1,662 24,466*
NOf : Median Grade and Average Salaryare based on those employees reported by general schedule grades orequivalent salary 1-evel,11,

11111111111
SOURCE: U.S. Civil Service Commission, Unpublished Data, October 31, 1976.
TABLE 112 (Continued)IP
NUMBER, MEDIAN GRADE AND AVERAGE SALARY OF FEDERAL WHITE COLLAR WORKERS BY SEX, ALL AREAS, OCTOBER 1976
OCCUPATION SERIES., AND GROUP
TOTAL- M A L E FEMALENumber
Me8ianGrade
Average
Salary NumberAverageSalary Number
AverageSalary
Medical Officer 10,368 15 $32,325 9,261 $32,151 1,107 $33,792Physicians Assistant 377 29 N. 14,718 236 14,857 141 14,485Nurse 31,850 - 9 15,446 1;746 11614,692 30,104 15,490General Health Science 980
/
14 26,773 696 -C 28,191 284 23,298Medical Technologist -3,631 13,860,
)1,160
-=
14,123 2 471,
13,736Medical Technician 2,923 6 11,711 1,398 12,106 1,525 11,349Medical Radiology Tech. 2,499 6 11,818 1,536 12,294 . 93 )1,059Dental Officer 1,407 14 27,101 1,396 27,111 11 25,815.
9,710
A
Dental Assistant 2,447 4 9,729 175 9,967 2,272-
Dental Hygiene 332 5 10,723 10 10,359 322 10,735Dietitian 1,132 9 17,915 36 18,743 1,096 17,887Occ\ upational Therapist ,,/ 626 9 15,825 , 74 16,340 552 15,755PhysiCalTherapist '774 9 15,782 354 16,493 420 15,183Optometrist . 55 11 18;890 55 18,890 0 -
Podiatrist 24 11 20,257 22 20,341 .2 19,332Pharmacist ,2,008 11 18,308 .1,760 18,518 248 16,817Pharmacology 310 13 26,785 261 ,27,189,
----..
49 24,628Physiology. 377 13 25,374 322
1
26;116 55 '21,034Genetics 207 13 26,744 192 27;301 15 19,621Veterinary Med. Science 2;299 12 > 24,905 2,245 24,981 154 21,765Industrial Hygiene 383 12 19,782 a49 20,10T 34 16,499
Hospital Administration 566 14 28,58 504 29,608 57 19,460
NOTE: M4Oian Grade and Average Salary are based on those employees reported by, general schedule gradesor equivalent salary level.
12kd6.
122'

96
SOURCE: Federal Salaries, U.S. Civi)Service tommission; Private Saldries,*U.S. Department of, Labor
TALE 113mCOMPARISON OF FEDERAL A)& PRIVATE A ERAGE SALARIES IN SELECTED JOBS,
1976
OCCUPATION li
v..
Oct. 1:1975Federal.
lalaries
Oct. 1; 1976Federal
Salaries
Salaries for° Comparable Job
In Industry 1976
,Top Career Official $37,800 $39,600
Engineer (near top) ' Th_r_-----;5,536 3:,077 $36,236
taWyer (near top).
. ) 35,636 : s 7 43,747
Chief CheMiit 4 35,636 3:,0
,
40',72
Chief Accountant 30,541 32,561 33,916
Personnel Director 26,009 , 27;601 26,845
Accountant (experienced) 21,848A,
23,039 23,402
;Auditor (ekperienced) 18,288 19,190 19,952
Buyer ' 18,288 ' 19,190 20,075
Engineering Technician (exp.) ddk 15,037 \.15,721 16,086
Accountant (medium experience) Ir 15,037 ' 15,721 15,428
Job Analyst (.medium experience) 112,429 12,967 13,559
Secretary (medium experience) --N 10,139 10,569 9,641
Engineer (beginning) 10,139 10,569 13,918
"Senior Stenographer 8,881 9,258 9,445'
Junior Draftman - . , 8,881 9,258 9,763
General Stenographer ' 7,617 7,945 8,472
Typist (experienced) - 7,617 7,945 7,975
Accounting Clerk (beginning) °' 7,617 7,945 7,636
Typist (beginning) 6,487 6,772 6,827
File Clerk (beginning -5,'658 5,913 5,875
t
. 123

SOURCE: U:S. Department of Labor, National Survey of Professional, Administrative, Technical and Clerical Pay, March 1976
COMPARISON OF AVERAGE ANNUAL SALARIES IN PRIVATE INDUSTRY. WITH SALARY RATES FOR FEDERAL EMPLOYEESUNDER THE GENERAL SCHEDULE, MARCH 1976
TABLE 114
a,
..
OCCUPATION
AND LEVEL
Average
salaries
in private
industry Grade'
.,e.
SALARY RATES UNDER THE GENERAL SCHEDULE
1 2 '3 4 5 6 7 - 8 9 10
Averagesalary'
Accountants IChemists I .
Engineers IEng. technicians IIIDrafters II
$11,45312,473
13,91812,258'
12,029
GS-5 $ 8,925 $ 9,223
.
$ 9,521
c
$ 9,819 $10,117
.
$10 415 $10,713 $11,011
.
$11,309
..
.
II
$11,607 $10,139
Accountants IIChemists II
Engineers II
Eng. technicians IV-Drafters III
13,394
14,077
, 4
14,178
GS-7
.
11,046
*---.
11,414
.
'
11,782
.
.
12,150 12,518
,
' .
12,886
-
, 13,254 13,622 13,990 14,358 12,429
,:-
ID,L88
Accountants IIIAttorneys I
Chemists IIIEngineers IIIEng,. technicians V
15,248 tOS-915,413
16,58917,482
16,086
13,482 13,931. .
14,380
A
.
14,829
.
15,278 15,727
.
-,,
-
16,176 140,625 17,074 17,523 15,037
Accountants IVAttorneys II . ,,
Chemists IVChief accountants IEngineers IV
18,73818,667
20,42920,46020,749,
GS-11 16,255
.
16,797 174339 12,881 18,423
.
18,965
, .'
19,507 20,049.
20,591
.
.
21,133k.
.
.
18,288.
k
Accountants VAttorneys IIIChemists V
Chief accountantsEngineers V
23,40224,205 .
, 24,099
22,75324,082
GS-12
.
19,386
.
20,032 20,678
.
21,324.
21,970
-.
4
22,616
'"23,262 23,908
.
,
4,544
4
25,200 21,848
Attorneys IVChemists VI
Chief accountants IIIEngineers VI
29,82828,868
28,13627,73/
GS-13 22,906 23,670 24,434' 25,198.
.
25,962 26,726
c
27,490 28,524 29,018 29,782 26,009. ...
.,
Attorneys VChemists VII
Chief accountants IVEngineers VII
36,308 ,GS-1433,559
33,91636,850 .
26,861, 27,756 28,651 29,546
.
30,441 .31,336
- .
32,231/
,
33,126.
34,021 , 34,916 30,541
Attorneys VI
Chemists III,Engineers VIII
43,747
40,72336,236
GS-15 31,309..
32-,353
.
-
33,397 34:441
.
35,485 36,529 37,573 38,617'.
..,
39,661 40,705
.
35,636
1Mean salary of All general schedule employees in each grade as of March-`31, 1976.A)
124
..

98
ACADEMIC SALARIES
The 'annual salary survey by the Ame/ Lcar d4gc,iiti.ovr 06 UniVadity
Pnoliessou shows that salaries for continuing faculty members - those employed in twoconsecutive years - increased by,6.7% in 1976-77 while overall facUlty salaries rose4.7%. However, after cohrecting for the 5.8% rate of inflation for the same timeperiod,' the real increase in purchasing power for continuing faculty members wasslightlyunder one percent,'and there,wdNa drop of 1% in terms of constant dollaTT-.for all faculty'members 4ombined,*
,
'Aver age compensation, which includes salary and fringe benefits, increasedby 5.5%, suggesting a slight decrease in the,real purchasing power of the averagefaculty member's remuneration.
The 1976-77 report is.based'on returns from 2,600 colleges and universitiesand ce ers the compensation and tenure status of about 360,000 full-time'facultyrip pers.
On the average, women's salaries were 5.1% lower than those of men of Fie\
same rank - the same differential as,last year However, in 1975-76, a third of womenfacu y members were reported to he in the upper two ranks; this yeth-. only 28% arerepor ed inAhese two ranks. ,
Gk-
Whatever their rank, and whatever type wrinstitutiOn employs them, womenrec ve lower salaries and compensation on theaverage than.men in the same rank andsame 'e if institution (Tables 115 and 116).
Geographic location affects,salary levels. The middle Atlantic states,,
followed closely by the Pacific states paid the highest salaries in every category ofingtitution and every rank (Table 117).
The average salary of all faculty members of all ranks in all kinds 'ofcolleges and universities is $17,930. FrilAge benefits of $2,740 bring the averagecompensation to $20,670, with fringe benefits averaging 15.3% of average compensation(Table 118)-.
The averagesalary for faculty members in preclinical departments of medicalschoolsPfortll ranks is $26,230. Adding 12.9% for average fringe benefits, totalcompensation for tfiese faculty members in 1976-77 was $30,130 (Table 120). Table 119presents averagelfaculty salaries and compensation in preclirlical departments ofmedical schdols*by type of affiliation and academic rank for 1976-77.
. Preliminary data released by the Nationat Center bon Education Sta,ti,4tie4on can faculty salaries for 1976-77 shows an overall increase of 4.9% in salary from19 5-76. Women,experienced a slightly higher increase than men - 5.2% and 5.1%
spectively. However, women in every rank continue to receive lower salaries ate ery type, of institution. For example, male professors had a mean faculty salary for1 76-77 of $23,828 compared to only $21,512 for-women.(Table 121).
Mean faculty Salaries by academic rank), length of contract andsex for1974 -7h and 1975-76 are shown in Table 122. Women received slightly higher increasesin salary from 19/4-75 to 1975-76 at the professor and lecturer rank, but overall menhad a higher percentage increase than women - 6.7% to 6.1% respectively, thus increasingthe salary gap between men and women (Table 122). .Faculty compensation by type of
itution, length of contract and acadeMic rank for 1975-76' is shown in Table 1'23.
By state orU.S. territory; Alaska paid the highestiman salaries to facultymembers in institutions of higher education - $25,044 for men and-$23";876 for women.
12e °

99
In the continential U.S., South Carolina pail the lowest salary to women faculty members,$11,640, while South Qakota paid the lowest to men, $14,006 (Table 124).
N.,
The 1975-76 survey of faculty salaries by Fie National Center. ,ban. EducationStat,Latic4, on which the above notedtables are based, covered 269,442 faculty members.The percent of the faculty who are women increased slightly from 1974-75 to 1975-76 to24:3%. The largest increases in the percentages of women, were al the ranks ofprofessor and lecturer. .
. /
The Nationae.Ssienee Foundation reports that the median annual salary ofdoctoral scientists and engineers who are at four year colleges and universities was$17,200 on an academic year basis in 1975. Engineering doctorate faculty had thehighest median salaries, $18,900followed by medical scientists, $18,700 (Table 125).Doctorate biological scientists o are teachers had the lowest median salaries -$16,200 (Table 125). Further d ussion of thisiNSF survey is on page 423.
.
,
The'20th annual sala survey by the Arnetican Mathernatiege Society is basedon returns from 788 departments in the mathematical sciences. Table 126 presentssalary ranges for doctoral degree mathematics teachers by rank and type of institution,while Table 127 shows the comparable data for non-doctorate mathematics teachers. Asshown in Table 126, the number of faculty at U.S. doctorate-granting-instituIjonsincreased from 4,683 to 4,742 in one academic,year, but the number of women fNceasedonly from 223 to225. The proportion pf doctorate faculty in these departments who arewomen thus dropped from 4.8% to 4.7%. Women earned 9% of Ph.D.'s in mathematics from.
The annual faculty salary survey for 1976-77 by the Arnenican ociation o6 .
Sottege4 o6 Pharmacy shows that 1976-77 salaries of faculty in colleges of harmacy ,
represent A varied picture of increases, with faculty on calendar year appointmentstending to fare better than those on academic. year.appointments.
.
Professors' salaries increased an average of .$537 for academic year appoint-ments and $2,803 for calendar year appo'ntments, up'2.3% and 10.3% 'respectively. ',Average salaries.were $410.087 and $30,02 or academic and calendar years. Associateprofessors received increases of 3.5% and 5. for "academic and calendar year: appoint-ments with average salaries at $1/,530 and $23,400 respectively, For a§sistantprofessors, the increases were 1,9% and 5.9% to average salaries of $17,206 and $19,811.
Table 128 presents calendar year salaries of faculty.in colleges of pharmacy.by years in rank and academic rank for 1976-77.
By discipline, hospital pharmacy paid the highest salaries to professors .and assistant professors, while pharmacy paid the best to associate professors andpharmacy administration shows the highest average for instructors (Table 129).
The Engineeking Manpower, Commiuion, as part of its collection of data forthe professional income of engineers survey, compiled data on,the SALARIES' OF ENGINEERSIN EDUCATION. The 304 educational institutions.providing data covered 13,094 engineeringeducators. Taie 130 prespes salarites of engineering faculty by rank and type ofinstitution for 1976, while Tables131 and 132 show salaries by rank and selected yearssince baccalaureate for those on nine and 12-month contracts respectively.
PreliMinary data'released by the Nationat. Centelt, 0,7. Education Stati,Ati,e4on mean salaries of administrative positions in higher education for 1976-77 show ahigh average salary of $27,448 paid to the chief academic officer and a low averagesalary of $11,956 paid to the Director of Student Financial Aid and the BookstoreManager (Table 133).
127

if
100
I
) 4
/ Similar data on median salaries paid to administratfv officers foi* 1975-76
compi by the Catege and Univemity Peuonnee A4sociation fou d that the Dean ofMedici e received the highest salary - $52,000, while the Registrar receivedthelowest, $17,568 (Table 134).
As a supplement,to their' salary survey, the Cortege and Univem PeAisonnet
Azsoaati.on analyzed the data by, sex and minority status. Salaryldifferentials are
more consistently related to sex than to race, with women (both white and minority)
being paid only about'80% as much as men withthe same job itle*when employed.by the
same type of institution (Tables 135-137).Nr
In rest; 'though employed predominantly in th lower-paying positios,
minority men we enerally paid about the same as white m i holding th'e same job
title at the same pe of institution. -
The percentages of jobs held by women and minorities generally.decrease as
salaries increase,, except' at women's colleges and minority institutions. Generally,public institutions'pay.htgher salaries toiaiministrators of all four race and sex
,groups than do private institutions (Table n5). Inte stingly, among those serving
as affirmative action officers, men are paid more than omen.
The U. S. Deppt4rit o6 Heath, Eddcation.and (Vella/Le in its DIGEST OFEDUCATION STATISTICS, /918presents,estimated average annual sa]ary of instructionalstaff in public elementary and secondery day schdols by state. Salaries ranged from
a high in Alaska.of $16,903 to a low in Mississippi of $8,338 (Table 138).
I
128

101
SOURCE: American'Association of University Professor , No Progress This Year:Report on the concmic Status of the Profession, 1976 -77.
8LE 115
.WEIGHTED AVERAE SALARIES OF FACULTY BY- ACADEMIC RANK,CATEGORY *,TYPE OF AFFILIATION AND SEX, 1976-77
ACADEMIC
RANK,
. .
ALL. COMBINED PUBLICPRIVATE iv
1
INDEPENDENTI CHURCH-RELATED
Men Women Men Women Men Women 1
:,,...
Men.*,-.
7 women ..t_
CATEGORY, r
Professor $5,710 $23,0510 $25,090 $22,760 $28,130 $24,790
3
$23,920
-... ,
21:12017,150,-
Associate Prof. 18,96015,610
18,850 18,030 19,550 18,430 18,970iTistant Prof.
__ip,01)14,700 15,550 14,670 15,700 14,890 16,090 14,520
Instructor T2,560 11,700 12,330 11,620 12,920 11,980 13,440 12,36015,160All Ranks 20,420 15,680 20,030 15,550 22,3-10 16,290 19,130
CATEGORY II-A
'P..-rofessor
,
22,990 22,440 23;360
z,
22,880 2 300
.
,
20,700
.
20,420
, .
18,400Associate Prof. r 18,250 17,740 18,540 18,220 16,450 16,660 14,980Assistant Prof. 15,060 .14,510 15,250 14,820 14,660 13,680 14,140 12,950Instructor 12,200,, 11,720 12,340 11 90 11,790 11,340 11,500 10,750All Ranks .18,34,- 15,690. 18,640 16 100 17,670 14,510 16,600 13,330
CATEGORY I I -B
Professor 20,060 19,250 20,900 20,080 21,430
,
20,690 18,540 i7,010'Associate Prof. 15,980 15,100 T7,250 16,480 16,420 15,650 15,010 14,120.Assistant Prof. 13,500 -12;940 14,520 14,140 - 13-,620 13,070 12,850 12,250Instructor 11,470 10,810 12,170 11,450 11,500 10,990 10,90D 10,290AT1' RanTS 1,870 13,440 16,390 14 490 16,670 14,200 14,960 . 12,520
CATEGORY III
Professor 22,390 21,200 22,500 21,510
,
15,150 014,040
Associate Prof. 18,470 18,250 18;560 18,320 14,030 13,230 13,760 13,2TOAsSistant- Prof: 15,630 15,430 15,710 15,00 12,170 11,870 ,11,670 11,040Instructor 12,700 12,130 12,750 12,200 10,310 .10,540 11,050 11 ;190All Ranks 17,180 15,470 17,270 15,570 12,460 11,220 12,460 11,480
CATEGORY. Iv.
No Rank .
.
17,590 15,770 17,870 71-6,130 13,610 11,460
,
13,610 ,10,480
* Category I - includes institutions which offer the doctorate degree, and whichconferred in the most recent three/Years an annual average of fifteen or more earneddoctorates covering a minimum of three nonrelated disciplines;' Category II-A - includesinstitutions awarding degrees above the' baccalaureate but not included in Category I;Category II-B - includes institutions awarding only the baccalaureate dr equivalentdegree; Category III - includes 4mo=year institutions with academic rank; an0Category IV - includes institutions without academic ranks.
° Sample too small to be meaningful.
.129tog

102
SOURCE: American Association of University Professors, No Progress This iYear, ,Reporqon the Economic Status of the Profession, 1976-77.
TABLE, 116 /
WEIGHTED-AVERAGE FACULTY COMPENSATION BY4ACADEMIC RANK, CATEGORY*,TYPE OF AFFILIATION AND SEX, 1976-77
(Standard Academic Year Basis)
-
. 4.
..
ACADEMIC All Combined Public''Fri vate ,,
Lndependent'
%,
Church-Related
RANK . Men Women . Men
-
Women Men 'Women Men,
. Women
CATEGORY I
Professor $29,410 $25,820 $28,4607$25,220
_1 .
$32,990 $28,830
.
$27,300 -$24,090
Associate Prof. 21,720, 20,710 21,510 20,640 22,820 21,470 21,830 19,740Assistant Prof. 17,950 16,940 17,850 16,900. 18,250 17,270 18,370 16,620InStrktor 14,470 13,460 14,2401 13,380 .14,830 13,790 14,640 13,950
ATI Ranks 23,400 17,960 22,820 1%780. 26,,080 8,910 21,900 17,320
CATEGORY II-A
Professor 26,640.
c.
26,030 27,060
. ,
26,550 26,010
_;060
,..
23,540 21,180Associate Prof. 21,240 20,670 21,580 21,240 2b,570 1 ,200' 19,290 \ 17,250
Assistant Prof: 17,490 16,840 17,740 17,230 16,940 15,790 16,240' 14,860
12,060All14,0'70 13,490 14,290. 13,770- 13,470 12,81Q ,12,970All Ranks 21;29O1 18,210 21,650 18,730 20,540 16,760 - 19,120 15,260
CATEGORY II-B
Professor' 23,420 22,450 23,700
-- 4
22,780 25;240
.
24,400
-,....
..
21,690 19,740
Alpsociate Prof.' 18,580 17,500 19,680 18,940 19,290 18,330 17,500 16,300
ASsistant Prof. 15,556 14,930 16;590 16,280 15,810, f3,070
15,220
1202014,78012,290
. 14,05011,560'Instrudtor 13,050 12,260 14,000 3,170
ATI Ranks 18,400 15,490 78,700 16,210 f 19,510 16,530 ,.,1 7,360 14,340
CATEGORY I I I
Professor 26,220
)24,900
..
'26,350 15,030
,-
17,190 '°
,
16,220., °
Associate Prof. . 21,620 21,330 21,746 21,410. 16020 15,490 15,840 14,00Assistant Prof. 18,430 /18;160 18,540 18,260 113,910 13,420
11,58013,32012,730
12,16012,920Instructor 14,870 114,120 14,950 14,230 11,340
All Ranks . 20,170 18,120 20,290 18,266 .14,150 120;55 14,540 . 1 2,860
CATEGORY IV
No Rank' 19,970
<
17;910 N),26eV
/ ,
18,320
.
16,00d
..
- -
13,110,
, 13,330__ 12,050A A,
* Category I - includes institution's which. offerthe doctasate degree, and Which conferred
qt, in the most recent three years an annual average .of fifteen or more earned doctorates
.*- co r i n fa minimum of three nonklated disciplines; Category II-A,- includes institutionsding degrees above the baccalaureate but not included in Category I; 'Category II-B -
includes institutions awarding only the baccalaureate or equivalent degree; Category III -
includesitwo-year institutions; and Category IV- - inclUaes institutions without academic..
ranks.
° Sample too small to be megningful.
t

V
_SOURCE: American Association of Universityyrofessors, No Progress This oar:Report on the Economic Status of the Profession, 1976-77.
TABLE 117
103
WEIGHTED AVERAGE FACULTY SALARIES BY REGION', CATEGORY2, AND ACADEMIC RANK, 1976-77
ACADEMICWEST NORTH CENTRAL NORTH EAST SOUTH
' West N. East N.' Middle New West S. East S. 'SouthRANK Pacific Mountain Central Central Atlantic England Central Central Atlar4ic
'''CATEGORY I
Professor $27,150 $23,830 $24,240 t_25,660 $28,140 $27i420 $23,830 $22,830 $25,120Assoc. Prof. 19,320' 18,430 18,710 78,980' 20,160 18,990' 18,440 17,940 18,680Asstt. Prof. 15,.930 15,180 15,890 15,570 15,790 15,920 15,080 14,680 15,250Instructor 13,130 12,410 12,620 12,130 12,270 13,770. 11,890 11,380 12,090All Ranks 21,600 18,900 19 290 19,900' 21,020 20,780 18,39Q 17,630 18,710
4 0)CATEGORYII-A ....
..,
r ,
Professor 23,930 20,130 20 270 210;0 '45,350 22,030 20,130 19,500 20,400Assoc. erof. 18,280 16,960 16!830' 17,740 20,040 17,500 16,970 16,370 16 770ikss't. Prot. 15,090 14,280 14,440 14,950 15,890 14,490 14,430 13,840 14,040instructor 12,160 12 050- 11,770 12,80 12,880 11,910 11,480 11,410 11,460All ,Ranks 19,340 16 0' '16,100 17,210 19,390 16,840 15,830 %15,070 15,680
CATEGORY'.II-B
, - ±
.
0
Professor 20,170 19,730. 18,270 19,470 21,360 21,160 17,100 16,030 18,830Assoc. Prof. 15,520 15,880 14,8-36 15,590 16,960 15,880 14,550 13,310 15,200Asst. Pr0t.. 0,570 T3,780 . 12,720 13,130 13,850,
11,41013,33011 120
131010
10,45011,500.
9,70012,87010,63%
instructor 12,020 11,350 11,060 11,150Ali- Ranks T5,350- T5',220 14,160 15,160 16,520 1 ,560 13,720 ,12,710 14,280
CATEGORYIII
,,
...- , .) ,
PrOfessor 21,630 '16;500 * 21,690 23,640., 18,050 17,31,0 14,900 21,160Assoc. Prot. 22,450 15,530 14,040. 19,010 11J, 250 15,550 15,740 13,810 17,260Ass ' t. Prot. 18,560 13,420 1.2,910 15,920 16,200 13,380 14,710 12,370 13,710instructor T5,660, T1,320 11,440 13,410 17,860 11,090 12,300 0,980 11,400NTT Ranks 20,090 14,160 12,560 16,500 17,510_14,150 14,140 2,250 14,650
CATEGORY_....
-
IV.'' ''
. ,
.
No 'Rank .1 19,970 14,950 14,070 16,610 12,670 11,960_ 13,450_ 11,750 -13,186
1 Regions Included: Pacific, Mountain, .West444ertrtentral , East North Central, MiddleAtlantic, New. England, West South Central, East South Central and South Atlantic:*
2 Category I - .includes institutions which offer the doctorate degree, and which'conferredill the most recent three years an annual average of fifteen or e earned doctoratescovering a minimum of three nonrelated disciplines; Category I - includes institutionsawarding degrees above the baccalaureate but not included in Cat gory I; Category II-B -
includes institutions awarding only the baccalaureate or equival t degree; 'Category III -
includes two-year institutions with academic ranks.; anOCategory '- includes institutions -without academic ranks.
* Sample too small to'be meaningful.
131 7

104
k
SOURCE: American Assaliation of University Profe sors, No Progress This Year: Report'
on the Economic Status of the Profession 1976-77.
TABLE )18
NUMBER, AVERAGE SALARY, FRINGE BENEFITS AND COMPENSATION OF FULL-TIME
aFACULTY MEMBERS lINSTITUTIONS OE HIG ER EDUCATION BY RANK, 1976-77
ACADEMICRANK
Total Full-Time Faculty'
MembersAverageSalary-
Aver geFri ge
Bene its
'
AverageCompensation
Fringe BenefitsAs a % of
Average Comp.
Professor 84,890 $23,930 $3,61 $27;540 15.1
Associate Professor 86,452 18,100
14.820
2,790
2 290\
20,890
17.110 ,
15.4
15.5Asistant Professo 98 813
Instructor . 3,118 13,920 1,770 13,690 14.8 .
7:.-_.
Lecturer 4,048 13,830 2,330 \ 16,160 16.8.-
All Ranks- 307,321 17,930 2,740 \, 20,670 15.3
TABLE 119
. WEIGHTED AVERAGE FACULTY SALARIES AND COMPENSATION \IN PRECLINICAL DEPARTMEW
J 1 OF MEDICAL SCHOOLS BY TYPE OF AFFILIATION AND ACADEMIC RANK, 1976-771 It
(12 -MONTH BASIS)
ALL COMBINED PUBLIC PRIVATE I EPEMbENT CHURCH-RELATEDACADEMIC
RANKSalary
Compen-sation Salary
Compen-sation Wary
mpen-
s tion Salary
Compen-sation
Professor $34,140 $39;250 $33,900 38,810 $35,160 $40, 60 $29,690 $32,880
4sociate!Professor '26,290 30030 25930 291,530
,27,0)0 31,40
.
23,790 26,640
Ass.istant,Profgisonr 20,790 23,910 20,840 23,820 20,790 24,250 ' 19,980 22,600
Iustructor 15,770 18,100 15,760 /18,050 15,750 18,200 16,270 18,050
All Ranks 26,230 30,130 ' 26,230 29,970 26,540; 30,910 23,560 26,360
TABLE111
NUMBER, AVERAGE SALARY, FRINGE BENEFITS AND COMPENSATION OF FULL TIM FACULTY
MEMBERS IN PRECLINICAL_DERARTMEM OF MEDICAL SCHOOLS BY ACADEMIC RANK 476-77
ACADEMICRANK.
Total Full-Time Faculty
MembersAverage,Salary Benefits
AverageFringe Average
Compensation
Fringe enefitsAs a % of ._Average omp.
Professor 1y764 $36,140 $5,110 $39,250 . 13.0'
aAssoicate Professor 1,684 26,290 3,740 30,030 12,5
Assistant Prgessor 1,944 20,790 3,120 23,910 13.0 ''
Instructor ....../ 316" 15,770 2,330 18,100 . 12.9
All Ranks 5,IN8 26,230 3,00 30,130 12.9.
1Sample includes 90 institutions (30 Privated2public, and 5 Church-Related).
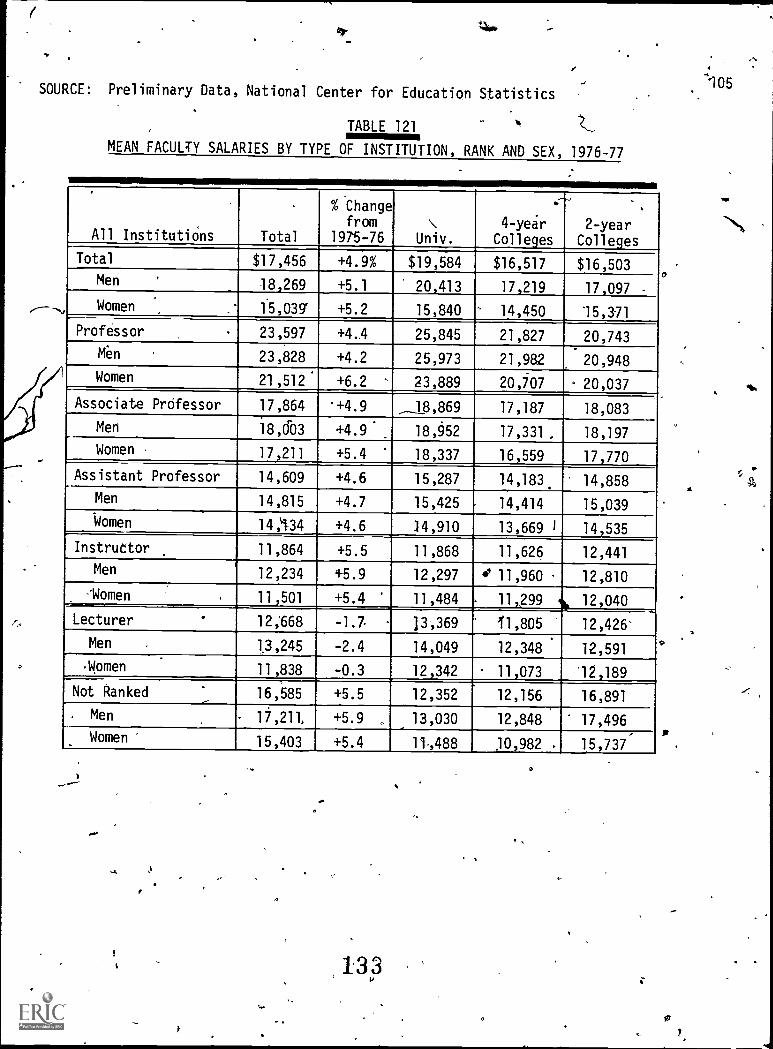
SOURCE: Preliminary Data, National Center for Education Statistics
- -4.1/41
TABLE 121 -r,
MEAN FACULTY SALARIES BY TYPE OF INSTITUTION, RANK AND SEX, 1976-77
.
All Institutions Total
% Changefrom
1975-76\
Univ.
4 -year
Colleges
.
2-yearColleges
Total $17,456 +4.9% $19,584 $16,517 $16,503Men 18,269 +5.1 20,413 17,219 17,097 -
Women 15,039' +5.2 15,840 14,450 15,3.71
Professor 23,597 +4..4 25,845 21,827 20,743Men 23,828 +4.2 25,973 21,982 20,948Women 21,512 +6.2 23,889 20,707 - 20,037
Associate PrOfessor 17,864 *+4.9 18,869 17,187 18,083
Men 18,003 +4.9. 18,952 17,331 18,197
Women 17,211 +5.4 18,337 16,559 17,770
Assistant Professor 14,609 +4.6 15,287 14,183. 14,858
Men 14,815 +4.7 15,425 14,414 15,039
Women 14,"134 +4.6 14,910 13,669 1 14,535
Instructor 11,864 +5.5 11,868 11,626 12,441
Men 12,234 +5.9 12,297 0 11,960 12,810
-'Women- 11,501 +5.4 11,484 - 11,299 12,040
Lecturer 12;668 -1.7 13,369 11,805 12,426'
Men 1,3,245 -2.4 14,049 12,348 12,591
Women 11,838 -0.3 12,342 11,073 '12,189-Not Ranked 16,585 +5.5 12,352 12,156 16,891
. Men 17,211, +5.9 13,030 12,848 17,496Women 15,403 +5.4 11-088 10,982 _ 15,737
t
t
.
133
0
or
0
al
'105

106
SOURCE: National ,Center for Education Statistics, Salaries, Tenure, and Fringe
Benefits of Full-Time Instructional Faculty in Institutions of Hi_gherEducation, 1975-76.
TABLE 122.
MEAN SALARIES OF FULL-TIME INSTRUCTIONAL FACULTY IN HIGHER EDUCATIONBY1ACADEMIC RANK, LENGTH OF CONTRACT AND SEX, 1974-75 AND 1975-76,
ACADEMIC RANK& LENGTH OFCONTRACT
M E N W OMEN
1974-75 1975-76PercentChange 1974-75 '1975-76
PercentChange
9 - 10 MonthContracts .
Professor $21,518 $22,866 6.3% $19,012
7
$20,257 6.5%
Associate ''
Professor 16,261 17,167 5.6 15,481 16,336 5.5
AssistantProfessor 13,452 14,'154 5.2 - 12,857 13,506 5.0
Instructor 13,351 j,440 8.2 11,740 12,580 7.2
Lecturer 13,231 13,577 2.6 11,543 11,870 2.8
Undesignated -
Rank 14,008 15,764 12.5
eta
--32-,619
,
14,098 11.7
All RanksCoMbined 16,290 17,388 6.7 13,470 14,292 , 6.1
11 - 12 MonthContracts
Prs.ftssor- , 25,608 27,1e 5.9
.
22,571
.
.
24,563 8.8k
Asso,ciate
Professor 21,144 a... 2.9 '
t
19,118 20,495 7.2
.
AssistantProfessor 17,035"17,035'
-..,_,-
1-8,176" 6.7 15,795 16,937 7.2
Instructor .13,791 14,577 5.7 12,719 13,5894
6.8.
Lecturer _ 16,672 17,418 1`4.5 15,516 15,872 2.3
UndesignatedRank 14,689 14,927
1,
1.6 ' 13,3'65 - 13793 3.2.
All Ranks .Combined 19,979 21,013 5.2 15,528 16,658 7.3
4 e'
1%.
, 134
6
,71
*11

107
SOURCE: National Center for Education Statistics Salaries, Tenure, and FringeBenefits of,Full-Time Instructional Faculty in Institutions of HigherEducation,'1975-76.
MEAN COMPENSATION OF FULL-TIME INSTRUCTIONAL FACULTY IN HIGHER EDUCATIONBY INSTITUTIONAL CONTROL, LENGTH OF CONTRACT AND ACADEMIC RANK, 1972-73 AND 1975-76
t-
ACADEMIC RANK& LENGTH OFCONTRACT
ALL INSTITUTIONS PUBLIC INSTITUTIONS PRIVATE INSTITUTIONS
1972-73 1975-76%
Change 1972-73 1975-76%
Change 1972-73 1975-76%
Change
I - 10 MonthContracts
Professor
.
$21,822
-°,
$26,025 19.3%
.
$21,869
.
$26,238 20.0% $21',732
.
$25,599 17.8%
AssociateProfessor
.
4,.16,625 19,672 18.3 16,914 20,169-19.2
Ai
15,992 18,508 15.7
AssistantProfessor 13,709 16,141 17.7 13,985 16,606 18.7 13,092 15 104 15.4
InstruCtor ,12,118 15,702 29.6 12,541 16,410 30.8 10,431 11,945 14.5
Ledturer .13,298 14,918 12.2 13,738 15,164 10.4 11,634 '14,051 20.8
UndesignatedRank 14,072' 17,421 23.8 14,566 18,299 ,25.6 11,533 13,735 19.1
All RanksCombined 15,748 19,172
n
21,7 15,847 19,456 22.8 15,461 18,432 19.2
11 - 12 Month:Contracts
Professor $25,574 $30,828 20.5% $26,212 $32,118 22.5% $23,860 $26,218 9.9%
Associate'Professor 20,016
,
24,838
.
24.1 20,560v
26,017 26.5 18,651 20,576 10%3
AssfstantProfessor 16,781' 20,704 23.4 17;268 21,617 25.2 15,591 -17,369 1.4Instructor '13,363 16,343. 22.3 13,573 16,.862 24.2 12,419 13,584 9.4
Lecturer 15,671 19,876 26.8 16,178 20,228 2540 12,531 16;811 34.2
UndesignatedRank 14,317 16,782 17.2 14,502 17,243 18.9 -13,910 14,7.45 6.0
All RanksCombined .18,840 23,045 22.3 19,195 23,847 24.2: 17,747 19,838 11.8
135ek

SOURCE: National Center for Education Statistics, Salaries, Tenure, and Fringe Benefits of Full-Time Institutional Facultyin Institutions of Higher Education, 1975-76 TABLE
MEAN SALARIES OF FULL -TIME INSTRUCTIONAL FACULTY (ALL RANKSD COMBINED ON 9-10 MONTH CONTRACTS) IN INSTITUTIONSOF HIGHER EDUCATION BY SEX OF FACULTY MEMBERS AND STATE, 1975-76
PUBLIC ANDMen
PRIVATE
Women
1
STATEOR OTHERAREA
PUBLIC ANDMen
PRIVATE '
WomenSTATE OR OTHERAREA Number Salary Number Salary Number Salary Number Salary
Alabamar
2,369 $14,665 1,275 $12,307 New Jersey 1 _5,073 $17,731 1,954 $15,063
'Alaska e '308 25,044 108 23,876 New Mexico 1,293 16,798 336 13,466
Arizona 2,898 18,370 860 14,891 , New York 18,439 19,107 5,694 1 ',547
Arkansas 1,508 14,560' 616 11,964 North Carolina 5,439 15,918 2,280 2,329
California 27,444 20,146 7,936 17,771 North Dakota 901 15,274 287 2,927
Colorado '3,885 16,783;, , 982 +3,541 Ohio
OkJahorird
9,401
2,542
17,070 2,638 13,791.
Connecticut 4,099 .18,308 1:172 14,623 14,882 895 '12,507
-.Delawar.e., 638 17,520 237 13,618. Oregon 3,312 16,722 910 14,230
District of Columbia 2,033 18,533 902 14,996 Pennsylvania 12,314 18,200 3,359 14,856
Florida 5,950 15,818 2,073 13,479 Rhode Island , 1,467 17,321 488 14,210
Georgia 4,408 14,905 1,730 12,321 South Carolina 3,060 14,597 1,164 11,640
Hawaii 1,081 19,725 395 .15,979 South Dakota 847 14,006 267 11,900
Idaho 1,034 15,070 237 13,056 Tennessee , 4,551 15,455 1,538 12,043 *
Illinois 12,902 18,015 .4,076 14,899.
Texas .12,354 16,515 4,540 13,634
13,318Indiana 5,542 16,754 11,546 13,570 Utah 1,575 16,776 321
Iowa . , 3,315 15,969 1,046 13,140 Vermont 897 161184' 266 12,403
Kansas 3,163 15,494 866 , 12,614 Virginia 5,855 15,850 2,103 12,803-
Kehtucky 2,874 15,438 1,057 12,509 Washington 4,764 16,922° 1',353 T4,345
Louisiana 6,397 15,409 1,422 12,483 West Virginia , 1,683 14,411 717 12,196
Maine ''''''' 1,225 14,833 302 12,305 Wisconsin 6,515' 17,037 1,858 14,627
Maryland "-- ft' 3,851 17,662 1,682 15,163 Wyoming 635 16,787 152 13,640
Massachusetts 9,666 18,731 3,105 14,735 50. STATES & D.C..
229,034'o--
17,387 73,735 14,292
Michigan' 7,964 18,207 2,270 15,185 Ameican Samoa 26 7,,865 15 7,760
Minnesota 3,307 16,716 946 13,704 Canal Zone 25 21,754 6 17,481
Mississippi 1,925 14,285 1,135 11,960 Guam 102 14,676 45 14,087
Missouri 4,747 16,093 1,526 13,125 Puerto Rico 1,472 14,631 1,269 12,429
Montana ,943 15,948 209 13,126 Trust Tem, Pac. Is.
Virgin Islands 37 14,357 27 14,493Nebraska 1,996 15,119 495 12,422
.Nevada 449 17,,742 112 15,306 OUTLYING AREAS 1,661 14,629 1,362 12,494
New Hampshire 1,194 16,413 297 12,909 AGGREGATE U.S.,,
231,207 17,380 75,102 . 14,259

SOURC : National Science Foundation, Characteristics of Doctoral Scientists Ind Engineers in theited States, 1975, NSF 77-309.
-
TABLE 125
MEDIAN ANNUAL SALARIES OF DOCTORAL SCIENTISTS AO ENGINEERS WHO AREUNIVERSITY OR-4-YEAR COLLEGE TEACHERS BY FIELD, SALARY BASE AND ACADEMIC RANK, 1975
109
.
FIELD AND '
SALARY BASE
Total
ACADEMIC RANK - .
No
Rppnrt
.
Professor'AssociateProfessor
AssistantProfesSor
.
Instructor Lecturer,
Other
All Fields
Academic Year '$21,700 $16,600 $13,390 $12,500 $13,100 $16,200 *Calendar Year 1,700 26,500 - 20.700 17 300' 15 000 16.800 20 Linn $1q,4nn
Physical Scientists
4eademi t year 17,100 20,80U 16,200 13,000 * * * *Calendar Year 21,700 25,900 20,400 15,900 * if_ 20,000 *
Chemists
AcademiC Year 16,600 20,000 15,900 12,900 * * *
Calendar Year 21,900 25,000 20,500 16,300 * 20,600 *
Physicists & Astronowers
Adadedlic Year 17,700 21,700 16,400 13,200Calendar Year 21,200r 28,700 20,300' 15,600 c . * - * *
Mathematical Scientists .
t /
Academic Year 16,900 22,500 16,700 13,400 : * *.. *Calendar Year 19,200 124,600 18,200 14,800 * *'.. *
_*
Mathematicians , 4Academic Year'Calendar Year
416,8tp18,800
22,300(4
24,400 k16,660 ,
18,20013,40014,200
**
**
*
**
*
Statisticians . , ..
Academic Year 17,800 23,800 17,300 13,9001 *
.
* * *Calendar Year 20,700 . * * * * * * *
Computer Specialists.
.
.
.
t
Acadehlic Year 18,000' 23,000 18,200 13,900 * -A, * *
Calendar Year 24,700 30,500 * * . * * * *
Environmental Scientists 1
Academic Year WOO 20,900 16,300 13,200 * * *Calendar Year 21,200 25,400 20,700 16,400 * * * *
,
Earth Scientists ,.t
.
Atademic Year 16,900 20,700 16,100 13,100 * * q *
Calendar Year 21,400 25,200 21,000 16,500 * * * ,.
. .
Oceanographersi
Academic Year. 1 '1
18,100 i * * * le.
b
*AO
*
Calendar Year 19,800 * 19,500 * * * * *
Atmospheric Scientists ,
1
Academic Year 17,800 ; * * * * *
Calendar Year 'ie s 1 . * * *
.*
NOTE: Includes individuals reporting Teaching as their primary or secondary work activity. Allmedian salaries were computed only for full-time employed, civilians.
* No median was computed for groups,with fewer than 20 individuals reporting salary.
138

110
SOURCE: National Science Foundation, Characteristics of. Doctoral Scientists_and Engineers in the,United States, 1975, NSF 77-309.
TABLE 125 (Continued)
MEDIAN,ANNUALSALARIESOF DOCTORAL SCIENTISTS AND ENGINEERS WHd'ARE4UNIVERSITY OR -YEAR COLLEGE TEACHERS BY.4FIELD, SALARY BASE AND ACADEMIC RANK, 11975
FIELD ANDSALARY BASE !
Total
ACADEMIC RANK ,
No
ReportProfessorAssociateProfessor.
Assistant IProfessor1 Instactor Lecturer CUM.
Engineers
Academic Year -
Calendar Year$18,90024,300
,
$22,40028,400
$17,700..21,800
$14,80018400
*-
*
*
*
* *
*
Life Scientists
Academic YearCalendar Ye
16,40021,500
20,60026,600.
16,00020,800
13,000
17.700
. *
'14.800*
*
*
S18.400*
*
Biological' entists. '
Academ' earCalen r Year
.
16,20021,100`
20,60027,100
.
15,90020,900
13,000
17,600
*14,600
.
.
*
*
* °
16.500
*
Agricultural Scientists
Academic YearCalendar Year
18,20020,600
20,80024,200
18,00019,600
* ,
17,000*
*
, .
*
*
* *
,7Nss
,
* N ** *
Medical Scientists
Academic YearCalendar Year
18,700
24,10021,00030,100
.
17,500. 23,00(3.
15,000
18,800
.
* -* , .
i*
.**.
Psychologists
Academic Year,
Calendar Year
16,90021,300
21,700
25,900
16,40020,700
.
13,00017,000
*
.
AP
.
1 :* *
* *
Social Scientists
Academic YearCalendar Year
17,300
21,000
2,200
26,000
16,700.19,600
)3,40015,500
*
*
.**
* *
' 25,400
Economists
Academic YearCalendar Year
18,40022,200
22,80025,800
17,40021,700
14,600, 18,400
*
*
*4.,'
* *
* *
Sociologists/Anthropologists
Academic YearCalendar Year
16,80020,400
22,30025,900
16,60020,300
.
13,20014,200
*
*
v-
*
*
* *r * *
Other Social Scientfsts
Academic YearCalendar Year
16,80020,200
,
21,80026,400
16,40018,700
13-,100
15,000
.
*
*
*
*
..
* *
' * *
A
NOTE: Includes individuali reporting Teaching as their primary or secondary work activity. All median
salaries were computed only for full-time employed civilians.
* No median was computed for groups with fewei-than 20 individuals reporting salary. ..,
13e)
,;)

SOURCE: The American Mathematical Society NOTICES, Vol. 23, No. 6, Issue No. .172, October 1976, pp. 313-316.
TABLE 126
'NUMBER AND MEDIAN SALAA RANGES FOR DOCTORAL DEGREE MATHEMATICS TEACHERS BY RANKAND TYPE OF INSTITUTION, 1975-76°AND 1976-77
,
TYPE OF- .
INSTITUTION
-- - - - '
RANK
-7 N& 76 - 1 9 7 7 1 9 7 5 - '1 9 7 6NUMBE OFFACULTX,
, ,
__MEDIAN RANGESNUMBER OFFACULTY /
/
MEDIAN' RANGES
.
Total Women Total -Women'/0 ..
.
Doctorate Granting Instructor 58 3 '$12,300-14,000 61 8 $11,600-13,500Departments , Assistant Professor 166 17 14,000-15,900 170 16 13,100-15,500
GROUP-1* Associate ProfessorProfessor
171
546
7
9
18,000-20,00026,400-30,500
183
5246
9
17,200-18,50025 400-31,000
'3octorate Granting' Instructor 55 6, 11,400-12,500 45. 5 11,0 0-12,500Departments Assistant Professor 240 14 ,13,900-15,400 .253 19 13, 0-15,600
Associate:Professor 361 12 18,100-20,100% 358 12 17,100-19,100GROUP II* .. ,
rofessor 438 10 25,900-28,800 427 10 24,600-27,500
Doctorate Granting )1PInstructor 23 4 10,000-12,400 30 4 9,300-11,100Departments . Assistatit Professor 432 39 14,000-15,600 477 39 13,600-151,000
GROUP III* Assocfate Professor. Professor
676'
59929
21
17,700-19,20022,500-26,700
645
55624
24N7,100-18,800
2,000-25.000
Doctorate Granting Instructor 4 1 - 2 1 . -'Departments Assistant Professor 127 19 14,500-16,300 ,118 14 13;500-15,600
GROUP IV* Associate ProfessorProfessor
124
2047
6
18,300-21,40026,400-30,200
131
197
6
6
17,600-4,20025,600 -29,000
Ddctorate GNnting' Instructor- 4
,,-
'1 - 8 1 -Departments Assistant Professor' 203 12 15,000-17,,100 201 11 14,500-16,200
GROUP V*, Associate Professor
Prof sor123
188
44
19,500-21,60025;800-30,000
115
182
4
4'
18,300-20,50024,300-27,800
Doctorate Granting Instructor '2 0 ..- 0 0- Departments i Assistant Professor 156 7 15,400-18,400 465 , 9 14,500-17;400
Associate Professor 261 66 19,700-24;100 253 5 17,700,22,300'GROUP VI*Professor 176 0 24,700 - 32.,000 163 0 22,600-30,700
Master's/Degree Instructor 24 6 11,200-14,200 .. 25 9 -, 12,000-13,700Granting ' Assistant Professor 646 72 13,900-15,900 670 68 13,500-15,100.Departments' Associate Professor , 890 68 16,800-19,000 844 67 16,200-19,000
Professor 658 . 37 20,500-23,100, .611 34 19,600-23;100
Bachelor's Degree Instructor . 1p. 6 , 10 2 --Granting Assistant Professor 481 55 12,500-14,500 482 45 12,000- 13,800Departments Associate Professor 418 30 14,400-15,600 384 30 14,000-16,800
Professor - 367 32 17,300-23,400' 352 37 16,500-22,100
*See footnote to.Table 127
140
4
141

SOURCE: The American Mathematical Society NOTICES, Vol. 23, No4-.; 6, Issue No. 172, October 1976, pp. 313-316 ;
TABLE 127
NUMBER AND MEDIAN SALARY RANGES FOR NON-DOCTORAL E MATHEMATICS TEACHRSl'N' 'ND TYPE iF ST TI N, 1975-76 AND 1976-77
9
TYPE AF
INSTITUTION
.
. -1 9 7 6 - 1 9 7.7.,_
1 9N7. 5 1 9 7 6NON -PH.D. DEGREE
-
RANKNUMBER OF
, FACULTY MEDIAN RANGESNUMBER 0,FACULTY %,., MEDIAN RANGES
Total Women l Total Womdn
Doctorate GrantingDepartmentsGROUP II*
Instructor f ,
Assistant ProfessorAssociate Professor
21
8
3
81
0
$10,960-14,600-
-
28
8
4 -
11
2
0
$ 9,900-13,600
-
Doctorate GrantingDepartments
GROUP III*
>
InstructorAssistant' ProfessorAssociate ProfessorProfessor
59
90
67
21
23265
0
9,400-12,400.13,700- 15,800,
16,900-19,80018,700-28,500
1
.
*
65
94
69
20
' 27
286
1
9,000-11,80012,900-15,80015,500-18,30018,200-31,000
DoCtorate GrantingDepartmentS
GROUP VI*
Instructor
Assistant ProfessorAssociate ProfessorProfessor .
11
16
-29
9
45
30
-
- '
20,300-26,2OO-
, 5
21
26
7
2
5
3
0
/ -
-
18,200-23;700' - .
Master's DegreeGrantingDepartments
Instructor
Assistant ProfessorAssociate Professor,Professor
180
333
219
55
.
72
9232
,4
3,000-1,6005,400-18,10019,100-24,600
200
353222
54
81'
- 90,28
2
9,800-12,30012,500-14,80014,300-17,20018,000-:2900
'.
11,100113,90012,700-16,00015,000-20,600
Bachelor's DegreeGrantingDepartments ,
InstructorAssistant PrOfessorAssociate ProfessorProfessor
109
278223
'108
37652711
-
11,700-14,70013,100-17,10016,000-21,300
123
30.1
219106
476328
10
* Gropp 1 and Group II include the leading/ departments of mathematics in the U.S. as rated by the American Councilof Education in 1969 in "A'Rating of Graduate Programs" by Kenneth D. Roose and Charles J. Andersen, in whichdepartments were ranked according to the quality of their graduate faculty. Group I is composed of the 27,departments ranked highest; Group II is made up of the other 38 leading departments listed in that report.'Group III contains, all other U.S. departments of mathematics. Group IV includes tEs. departments of statistics,biostatistics and biometrics. Group V includes all other U.S. departments in the mathematical' sciences.
.Group VI consists of all idepartments in the mathematical sciences from Ganadian tiniversites. 1431.44?

113
,SOURCE! American Association of Colleges of Rharmacy, Annual Survey of Faculty
Salaries, 1976-77.
TABLE 128'
NUMBER AND AVERAGE CALENDAR YEAR SALARIES OF FACULTY IN COLLEGES OF PHARMACYBY,YEARS IN RANK AND ACADEMIC RANK, 1976-77
/Years InRank
.
ACADEMI1 RAaN K.
ProfessorAssociateProfessor
AssistantProfessor
,
-
De(
rAssistant/Associate
Dean
(25) (78) - (178) (6) (6)-0-1 $26,996 $22,4 5 $18,788 $35,422 $25,116
(89) (1 (236) , (18) (23))
2-5 28,169 , 23,975 20,346 :33,698 25,893 ,
(73) (40) (1.3) (17) (8)6-10 29,918 32,983 f21,760 .37,179 ' 25,588*
(43) (10) .(19)11-15 31,547 22,798* 36,975* -
4
a
16-20(27)
31,912 °.
e . .
21+: (14)
33,115, 4',
. ..
* Includes A11 e4ws .Beyond
'76
`.
lb" TABLE 1 294 -amw_
V RAGE CALENDAR YE' LARIES OriF FACULTY IN COLLEGES .OF PHARMACY. BY DI NE AND AOADEMIC JA (k, 1976-77
,
.
ACADEM:I C 'RAN,km ..
IfProfessor
'AssOCjateProfessor.
'Assisttn1 -
Prdflpssor ' Instructors
Pharmacy Is $30-,265 $23i964 $2 ,a23.,1m. $15,811
Pharmaceutical
Che istry ' 30,645 ' 22,891 - 4 19 124 ' 11,586 .
.P ha acology 29,438 22,547 19°,237 ' 12,881
Pha ac*osy 29,226 23,584 19,.
85 -
PharmacyAdministration
,
28,584
.
24,543 4 .20, 6
.
17,504
Clinical Pharmacy 30,317 23,859 19,753 '4....-4.-,..17,218
HospitlPharmacy 4; 31,174. 21,071_ 21,040 ..
,
.
. -
-
- 144

114I
SOURCE: Engineering Manp er Commi.ssion, Salaried of Engineers in Efteation, 1976
."NUMBER AND MEDIAN SALARIES"bF ENGINEERING FACULTY BY RANK,
TYPE OF INSTITUTION AND MONTHS ON CONTRACT, 1976
TYPE OF INSTITUTION InstructorAssistantRrofessor
AssociateProfessor
/
ProfessorAdmini-strator Researcher
PH.D. SGHOOLS(251) (1,432) (2,504) (3,305) (257) (76)
9-10 Month Contract $13,600 $16,200 $19,500 $24,900 .$27,700 $16,900(6) (192) . (276) (378) (547) . (737)
11-12 Month Contract 18,500 19,850 23,950 29,300 32,506 18,250
-NON-PH.D. SOHO N(69) ,- (313). (544) (545) f63) (18)
9-10 Month Contract 14,550 15,600 18,550 24,050 20,100 14,500
(9) (24)- (44). (28) "(124) . (29)
11-12 Month Contract 12,400 15,000 23,950 27,650 28,p00 15,750
TECHNICAL SCHOOLS(252) (307 (295) (127) (48) (3)
9-10 Month Contract 13450 15,500 17,850 21,150 16,900(18) 15) (18) (14) 0 (116) (14)
11-12 Month Contract 15,650 15,906 17,000' 15,350 22,100
TM/1111.NUMBER AND MEDIAN ANNUAL SALARIES.OF FACULTY IN ALL ENGINEERING SCHOOLS
BY LINE- MONTH CONTRACT, RANK AND SELECTED YEARS SINCE BACCALAUREATE, 1976
RANKYEARS SINCE BACCALAUREATE
3 , 5 7 9-11 15-17 18-20, 21-23 24-26 35+
Professors
,
(11)
$20,850(315)
$22,950(534)
$23',850
(509)
$24,650(501)
$25,300(734)
$25,450
AssociateProfessors
(8)
$17,650On)
18,650(5911
-19,6gff
(487)
19,750(284)
19,650(234)
19,450
,,,-....
(w9r18,450
Assistant?rofessors
(8)
$14,850(51)
$15,350(128)
15,800-(477)
16,250(154)
16,600(78)
16,500
(71)
16,350
,(42)
16,150
(49)
15,350
Instyl::,rst
(13)
_1111,600600(07)
1212,450(14)13,150
(51)
14,100' (22)
15,350(22)
5,,700
(14)
16,000(19)
16,150(17)
16,400
Admini-strators
Ot)
-
(28).
22,200(45)
4,950(44)'
26,800(41) (43)
29,150
All
Faculty*(12)
14,150N(64)15;1700,
(153)
15,900(810)
17;200.(1,154).(1,154)
19,750(1,187)
20,85Q(928)
21,80G
_27900
0(854)
22,550(1,069 ).
22,950
4
145
I

a
S
SOURCE: ',,Engineering ManpOwe'r Commission, Salaries of Engineers in Education, 1976
NUMBER AND MEDIAN ANNUAL SALARIES OF FACULTY IN ALL ENGINEERING SCHOOLSBY 12-MONTH CONTRACT, RANK AND SELECTED YEARS SINCE BACCALAUREATE, 1976
:115
RANKYEARS SINCE BACCALAUREATE I,.
3 5 7 9-11 15-17 18-20 21-23 24-26 35+
(7) t (41) (51) (43) (60) (74)Prof sors -
. . $4,250 $27,300 $28,600 $Z9,650 $30,300 $28,400
Associate 2 (2) (35) (63) (40) (37) (25) (16)Professors 22,650' 24,100 24,500 24,600 24,450 20,700r
Assistant 113) (40) '-(21) (15) (13) (15)Professors $18,950 19,450 19,800 19,750 19,550 19,350
Admini- (1) (1) ,(3) (.6) ° (46) (70) (100) (101) (101)strators = - 23,100 28,600 30,350 31,550 32,300 33,200
P .
(37) (22) (39) (121) .(74) *(56) (53) (32) (32)Researchers $12,750 $14,150 $15-,500 $17,350 $20,100 $20,950 $21,550 $21,950 $22,450
SOURCE: National Center for Education Statistics, Preliminary Data
'TABLE 133 .
, .NUMBER AND MEAN SA RIES,OF OFFICERS IN
HIGHER EDUCATIO INSTITUTION .BY POSITION, 1976 -77' .
4I
POSITION 0 .
No. ofPersons
MeanSalary
0
Chief Academic Officer 211 $27,4482'
Chief Business' Officer 2,239 14,696
23,303Chief Development Officer . 1,294
Chief Student Life Officer 1,871 22;574
Director Of Computer Center 1,067 20,790
Director of Student Counseling' 1,095 '018,965 A
/1C,791Chief Librarian/
-,
2,192
Director of Admissions 1f826 18,723/
Director'of PtysicalLPlant 1,628 17,853
17,712:Chief Public Relations Officer 1,163
Registrar ' , 1;695' 16,516.
Director of StudentFinancial Aid
-
1,268. 11,956
Bookstore Manager 1,268 11,956
14
,

116 SOURCE: .College and University Personnel Association, reported.in The Chronicleof Higher Education, February 17, 1976.
TABLE 134
NUMBER AND SALARIES PAID TO ADMINISTRATIVE OFFICERSIN HIGHER EDUCATION INSTITUTIONS, 1975-76
P OSITION Number ofPersons
1975-76 Median-.Salary
Percent IncreaseFrom 1973-1974
Medicine Dean or Director A
63 $52,000 24.6%--\N
Dentistryypean or Director 43 42.907 \.-
Law Dean or Director 87 39.200 13.6
Chief Executive Officer Within a System 255e.
28.175 . *
Pharmacy Dean or Director 48 35.082 9.6
Executive' Officer 864 34_.800 10.5,Chief
engineering Dean or Director 186 33.000 17.1
Clief Health Affairs Officer 197
..-
32.000 *
A#
l-chitecture Dean or Director 60 31%645 13:8
Graduate Dean or Director 279 30.300- 4-S,
14.5
Executive Vice President 284 30.000 *
Agriculture Dean or Director 90 29.950 ..
.
8.3
Social Work Dean or Director 116 29.000 15.1i'"
Education Dean or Director 338 28,848, 10.0
Arts and Sciences Dean or Director 416 . 28,000 11.0
BUsiness Dean or Director . 392 28,060 9.9
Chief Academic Officer 974 . 27,500 . 10.7
CgiefPlanning_Qfficer . 235 26,000
.
*
Extension Dean or Director 212 25,627" *15.4
Staff Legal Counsel 79 25,580 , .9.1
Fine Arts Dean or Director i 195 25,008 4.5 '-,
Chief Business Officer 1,022 24,378 10.8
Nursing Dean or Director 240 24,000 , 20.0
Technology Dean or Director '103 23,500 5.9r
Chief Development Officer. 543 22700 13.5
Information Systems Director 126 22,351 *
Institutional Research Director 390 20,423 *
Athletic Director.
"592 20,000 . 9.9
Computer Center Director 626 19,800 11'4
Affirmative Action Officer 229 19164 * p
COmptroller ,566 19,221 . 13.0 ..
Director of Admissions ,
r '%
,
771 1p,500 14.6:.
Personnel Services Director * ' , 537 18,430 16,3 I.
-..
Registrar 974g17,568
. 14.6
*'Position not included in 19i3174. Survey.
-1.47 Oa.

k
,
SOURCE: College and University Personnel Association, Women and Minorities inAdministration of Higher Education Institutions: Employment Patternsand SalaryiComparisons, June 1977.
TABLE 135
AVERAGE OF MEDIAN SALARIES PAID ADMINISTRATORS AT PUBLIC AND PRIVATE INSTITUTIONSBY SEX AND MiNORITY STATUS, 1975:76(WHITE COEDUCATIONAL INSTITUTIONS)
AVERAGE MEDIAN SALARIES
Public- Private .
Watio ofPublicTo Prfvate
White Men
$35,228
.
.
$31,283
.
1:13.Chief Executive Officers
Administrative Affairs 22,251 20,221 1.10,Academic Affairs 30,779 27,152 1.13Student Affairs 20,194 16,107 1.25,External Affairs 21,521 17,875 1.20
Minority Men,
.
$36,424 $28,316 1.29Chief Executive OfficersAdministrative Affairs 20,340 17,583 1.16Academic Affairs - 28,67em_med0129,811. 0.96Student Affairs . 18,-871 - 15,422 1.22External Affairs 23,607 , 20,950 1.13
White Women ,
$29,316
1
$29,92514,816'
( 0.981.1
/Chief Executive OfficersAdministrative Affairs f7,093Academic Affairs 23,353 19,061 .nStudent Affairs 16,024 12,287 1.30 '
External Affairs 16,309 14,630 1.1)
Minority Women I._
-* $ -*
.._,o
.
-*.
'
Chief Executive_00ticersl''Administrative AffiirSZ".k W-7;952 13,745 1.31Academic Affairs ,r ,-24,99.L -,16049 1.53Student Affairs 16,220 4, 14,810 11.10 '-
External Affairs- 17,484 . T4,950 _1.17 °
. * Indicates data are not disclosed.
148
41>
.1"
117
4$.

coSOURCE: College and University Personnel Administration, Women and Minorities 4,11 Administration of Higher Educa-% tion Institutions, Special Supplement: 1975-76 Administrative CompensAion Survey, June 1977
TABLE 136
4
NUMBER AND MEDIAN SALARY OF ADMINISTRATORS IN ALL PRIVATE WHITE COEDUCATIONAL HIGHER EDUCATIONINSTITUTIONS BY POSITION SEX AND MINORITY_ STATUS, 1975-70
_
Position . Total SampleNumber Median Salary
.White Men
Number Median Salary NumberMinority Merf
Median SalaryWhi e Women
Number Median SalaryMinority Wumen
Number Median Salary
Chief Executive Officers I . .
Chief Executive Officer (PnesidentiChivr.allor) 333 33.000 319 33,700 1 11 28,000 0 ',.
Chief Executive Office). within a System 5 31,650 5 31,650 0 0 0Executive Vice-President 65 28.500 61 28,500 1 - 2 - 1 '
AdMinistrative Affairs OfficersChief Planning Officer 37 24,000 36 24,000 0 - 1 0 -Director, Computer Center 147 17000 141 17,600 0 - 6, 11,500 0 . 'Director, Information Systems 29 21,400 26 22,900 - 3 14,700 0 -Chief Business Officer - 316 22,500 294 23,000 3 21,450 19 15,000 0 -Chief Budgeting Officer ' 36 18,915: 28 20,900 0 , 8 13,225 0 -Director, Personnel Services 119 %, 16,000- 69 18,500 4 13,300 42 11,550 4 15,750Affirmative Actioli Officer / 22 20,200 7 20.500 7 20,400 . 5 18,000 3 16,200Director, Physical Plant 293 15,100 286 15,007 6 22;100, 1 0Purchasing Agent ' 96 14,934 78 15,950 5 16,584 13 9,200 0.
.Director, Food Services ,i_ 106 15,500 73 16,500 3 8,820 28 13,390 2Comptroller . .."-- 203 18,143 r, 171 19,143 3 14,000 28 12,250 1
Manager, Bookstore 203 10,010 108 13,000 1.
92 7,850 2Sten Legal Counsel ° 13 25.500 ,b 12 25,100 '....., 0 ....., - 1 0Chief Health Affairs Officer 31 30,400 '''- 27 31,000 1 / 3 8,870 0
Academic Affairs OfficersChief Academic Officer 281 25.000 267 25,500 2 '' 12 19,004 0Head Librarian 317 16,000 191 18,500 6 21,400 120 13,593 1 -Director, Institsitional Research 51 10,896 39 16,/96 0 11 17,765 1 -Dean /Director, Architecture 7 28,800 7 28,800 -- 0 ' -Dean /Director, Agriculture - 0 0 0 - , 0Dean'DI rector, Arts and Sciences 83 27$00_ t 76 27,700 1
.- 6 19,105
Dean/Director, Business 72 2.* 1 66 27,200 2 - 4 13,813 -Dean /Director, Dentistry 10 1 10 43,400 0 0
(Dean/Director, Education - 66 4, it 54 22,278. 1 14* 17,600Dean/Director, Engineenng 37 36 31,075 . 1 015ebn/Di rector, Extension 35 ' : /- . 29 24,064 1 . 4 9 23,200 1 -Deon/Director, Fine Arts 38 20,10f
''33 20,000 0 -5 21,332 0 -
Dean /Director,tor, Graduate Progiama 50 26,125 , 25,875 2 - 6 23,769 - QDean/Director, Home Economics 7 16,532 0 - 5 13,975 0Dean/Director, Law 35 40,000 31 40A25 1 - . 1' . 0Dean/Director, Medicine 52,500 11 52,500 - 0 - 0DaniDa actor, Music
.46'35 ,, 21,500 33 21,500 - 2 . 0
DeanIC.rector, Nursing 39 21,785 1 re 37 21,785 1 -Defn/Director, Pharmacy 6 32,250 6 32,2%0 a - 0 .0Dean/Direttor, Social Work 26 27,801 22 28,459 4*. 14,788 0Dear.i0trector; TechnologyDean /Director, Vocetional Education
54
23.00014,488
. 54
23,00014,488
.
00 -
00
-
Student Affairs OfficersRegistrar 280 14,620-il 171 16,850 104 11,889 4 13,123Director, Admission 244 16,800 211 17,275 1 - 30 13,306 2Director, Student Housing 139 13,200/ 91 14,000 : A 10,860 43 11,000 1
Chief Student Life Officer 250 18,487 211 18,500 8 24,241 28 16.250 3 26,000Director, Student Union- .. 99 13,000 69 13,800 .0 27, 10,500 3 11,000Director, Student Placement 149 13,733 89 15,000 5 f1,300 51 12,175 4 10,686Director, Strident Financial Aid 229 13,400 153 14,750 11 15,000 62 10,665 3 11,500Director, Student Counseling 137 16,320 102 17,185 4 17,398- 31 12,200 , 0Director, Athletics 174 17,552 166 17,600 6 19,075 3 12,594 0
External Affairs OfficersDirector, Community Service, 36 17,940 27 17,980 2 - 6 17,708 1
Chief Development Officer 292 22,179 276 22,500. 1 24,600 13 17,760 0Chief Public' Relations Officer, . 182 15,500 137 16,600 0 44 12,700
.1
i Cnictor, Information Office 12 1r5 79 14,600. 1 42 10,3 61 0, i la

SOURCE: College and University Personnel Administration, Women and Minorities in Administration of Higher Educa-tion Institutions, Special-Supplement! 1975-76 Administrative Compensation Survey, June 1,977
TABLE 1.
NUMBER AND MEDIAN SALARY OF ADMINISTRATORSs ALL PUBLIC WHITE COEDUCATIONAL HIGHER EDUCATIONINSTITUTIONS BY POSITION, SEX AND 'MINORITY STATUS, 1975-76
Position - NumberTote! Sample
Median Salary, White Men
Number Medan SalaryMinority Men
Number Median SalaryWhite Women
Number Median Salary NumberMinority Women
Median Salary
Chief Executive OfficersChief Executive Officer (President/Chancellor)Chief Executive Officer within SystemExecutive Vice-President
Administrative Affair OfficersChief Planning OfficerDirector, Computer CenterDirector, Information SystemsChief Business OfficerChief Budgeting OfficerDirector, Personnel ServicesAffirmative Action OfficerDirector, Physical PlantPurchasing AgentDirector. Food ServicesComptrollerManager, BookstoreStaff Legal CounselChief Health Al fairs Officer
Academic Affairs OfficersChief Academic OfficerHead LibrarianDirector, Institutional ResearchDean/Director, ArchitectureDean/Director, AgricultureDean/Director, Arts and SciencesDean/Director, BusinessDean /Director, DentistryDean /Director, EducationDean /Director, Engineerdig .Dean /Director, ExtensionDean/Director. Fine ArtsDean/Director, Graduate ProgrurnsDean/Director, Home EconomicsDean/Director, LawDean /Director, MedicineDean/Director, MusicDean/Director, NursingDean/Director, PharmacyDean/Director, Social Work
... Dean/Director, Technology'-' Dean/Difector, Vocational EducationStudent Affairs Officers
RegistrarDirector, Admissions '
41114.Director, Student HousingChief Student Life OfficerDirector, Student UnionDirector, Student PlacementDirector, Student Financial AidDirector, Student CounselingDirector, Athletics
External A f fairs Of f leersDirector, Community ServicesChief Development OfficerChief Pubic Relations OfficerDirector, Information Office
'
394178152
131330
78491152287148448296164278319
48134
4795092264269
25324731
202115144116158
73414558
160'32
6476
123
455310196422254296411325261
219139224220
4
'
,
,
.'
.35,41337,80531,860
27,50520,80322,37526.11422,00019.69219,45019,30446,62517,56920,36713,00026,33432,682
29,42121,65021,65031,50031,41028,76429,00042,95030,89'i33,42026,79827,29532.000'27,46838,20051,97027,349'24,51637,00030,90223,75022,460
19,74020,245 .17,50025,73417,73117,79816,75020,05022,305
21,00024,98120,47517,269
380165147
1293.13
76471136222
26433
/4 25111025419844
118
4393531914068
23323630
17911213897
1411041455514
.324673
115r
358272167350213241\292251252
182134
1, 186154
35,41338,17532,095
27,72021',06072,60025,820
.22,221. 19,933
20,29419,30817,20018,85020,65415,25426,85833,284
29,35523,59022,78421,50031,49779,48029,370'3,09970,79033,42027,30277,30032,10029,42738,20Q51,97027,36423,59437,00031,50024,00022,500
20,47920,40018,06025,84318,18018,17117,44220,69422,475
21,00024,99021,38118,714
11103
071
104
234915
74 .
671
2%
14791
1
840
15'1
4551
0021
08,3 ,5
9154
3614104513
7
1643
4
s .
39,95036,52132,800
-20,100
29,86218,54520,47221:40018,64514,92418,732
21,7319,600
- -
28,93725,570
_ 19,950 -
-31,16125,645 .
31,118
26,225_ 34,600
33,420
--
. ,It
'` 33,420
'22,500 .,
23,017
018,500, 18,576
16,21826,68613,63117,70417,00020,17121,357
.26,37724,95719,30023,792
i
(
.
33,2
2100
1012404$
0373917
1122
13
2413826
1
011
71
71
4121 260
001
1380
100
7 2
812123'3327416366
2
.16
1
3460
.
1.
32,98430,750
-17,045 _
-18,35018,07515,50118,182
12,75611,79813,5009,441
Tt,347 '
30,300118,06216,K3
I.
24,85019,090
27,492
20,51260112,089
172 ,16
1 .-
' =
24,588
26,559,
/
13.55118,70415,40820,12015,70014,94-713,50017,977
18,514
14,70013,839,
/
'
I/ .
,
,
.
".....
0, 0
00et,
002
2501
1
1
2, 1
1
211000
al 1
001
1
2 ,020 20 ,../
07 ,,0'0-01 '7 ,;,
2 r230 'i4 %.
11 ,7;
5 4
0, e,
5, ,01 ,
2
..
--
i-
19,078- -
-20,500
.-
--------
--
31,041
---
14,653
-27,000
15,621 .\12,81616,006
15,015
-
151

OM.
SOURCE: U.S. Department of Health, Educktion & Welfare, Digest of EducationalStatistics, 1976, NCES 77-401, p. 58.
TABLE 138
ESTIMATED AVERAGE ANNUAL SALARY OF TOTAL INSTRUCTION6L STAFF*IN FULL-TIME PUBLIC ELEMENTARY AND SECONDARY DAY SCHOOLS BY STATE, 19744-75
STATE \ SALARY STATE SALARY
United States -AlabamaAlaska
$12,0709,503
16,906
. .
MissouriMontanaNebraska
$10,25710,1609,715
ArizonaArkansas
11,1689,0211
NevadaNew Hampshire
12,85410,016
California, 14,916 New Jersey +
Colorado 11,554 New Mexico '10,200,Connecticut . 12,051 New York 15,0002Delaware T2,110 North Carolina 11,275District of Columbia 14,716 ..., North Dakota ° 9,176Florida 10,780 Ohio )1,100Georgia 10,641 Oklahoma 9,208Hawaii ' . 13,665 Oregon 10,958Idaho .
9,573 Pennsylvania 12%200Illinois 13,469 Rhode Island 12,885.IndIanalow* .
'1Kantas
.
,'
l,35810,5989,770
South CarolinaSouth DakotaTennessee
,9,7708,8669,878
Oentucky 9,240 le . Texa ' 10,136,LoufSiana . 9,800. Utah 10,150,Mai ,, . 13,202 Vermont 9,206 -,
Marpand 13,282 Virginia . 11,279'Massachusetts 12,468 Washington 12,538Michigan - 14,224 West Virginia 9,124Minhesota 12,852 Wisconsin 13,046Mississippi 8,338 Wyoming 10,350
*Includes supervisors, principals, 'classroom teachers, and other instructionalstaff.
+Data not available.
'Includes professionalymoninstrUctional administrative staff.
2Median Salary
153
*OS

BIBLIOGRAPHY OF SOURCES
(Listed in Alphabetical Order bOublisheq
ABBOTT, LANGER & ASSOCIATES, P. O. Box 275, Park'Forest, Illinois 60466
Compensation in Manufacturing, Part I: Manufacturing Engineers, Sponsored by the Society of Manu-facturing Engineers, ISBN No. 0-016506-09-6, 1976; 55 pp., $40.00
Compensation of Industrial Engineers, Sponsored by the American Institute of Industrial Engineers,Inc., ISBN No. 0- 916506 -19 -3, June 1977, 92 pp., $40.00
AMERICAN ASSOCIATION OF COLLEGES OF PHARMACY, Office of Educational Research and Development, Suite 201,4630 Montgomery Avenue, Bethesda, Maryland 20014
Annual Surveyof Faculty Salaries, 1976-1977, 12 pp., free .
AMERICAN ASSOCIATION OF UNIVERSITY PROFESSORS, One Dupont Circle, N.W., Washington, D. C. 20036
No Progress This Year: Report on the Economic Status of the Profession, 1976-77, August 1977,83 pp., $2.50
AMERICAN CHEMICAL SOCIETY, 1155 - 16th Street, NA., Washington, D. C. 20036
1977 Report of Chemists' Salaries and Employment Status, June 1977, 129 pp., $7.00
1976 Report of Chemists' Salariesand Employment Status, July 1976, 86 pp., $5.00
1976 Survey Report - Starting Salaries and Employment Status of Chemistry and Chemical EngineeringGraduates, November 1976, 40 pp., $3:00
"Salaries of Starting and Experienced Chemists Generally are Higher," CHEMICAL AND ENGINEERINGNEWS, Volume 55, October'25, 1'976
"1977 Salary Survey - Fewer Chemists Are Without Jobs This Year," CHEMICAL AND ENGINEERING NEWS,Volume 56, June 20, 1977
A.
CHEMICAL AND ENGINEERING,NEWS, Volume 55, June21, 1976 11/4
AMERICAN INSTITUTE OF BIOLOGICAL SCIENCES, 1401 Wilson Boulevard, Arlington, Virginia 22209
"The Biologist Census," BIOSCIENCE, Volume 27, No. 3, March 1977
AMERICAN INSTITUTE OF PHYSICS, 3135 East 45th Street, New York, New York 10017
1975-76 Graduate Student Survey, AIP Pub. No. R- 207.9, July 1977, free
1974-75 Graduate Student Survey,' AIP Pub. No. R-207.8, September 1976,-free,
Survey of 1975-76'Physics and Astronomy Bachelor's Degree Recipients, AIP Pub. No. R-211.8,February 1977, free 0
AMERICAN MATHEMATICAL SOCIETY, Box 6248, Prividence, Rhode Island 02903
..,'20th Annual 1976 AMS Survey," NOTICES, Volume 23, No. 6, I;sue No. 1972, October 1976
AMERICAN SOCIETY OF CIVIL ENGINEERS, 345 East 47th*Street, New York, New York 10017.
1975 ASCE Salary Survey, Reprinted from ENGINEERING ISSUES, Volume 102, April 1976
BATTELLE, COLUMBUS LABORATORIES. Available from the Government Printing Office, Washington, D.C. 20402
National Survey of Compensation Paid Scientists and Engineers Engaged in Research & DevelopmentActivities, 1976; ERDA 76/157, November 1, 1976, $3.85
COLLEGE PLACEMENT COUNCIL, P. O. Box 2263, Bethlehem, Penna. 18001
A Study of 1976-77 Beginning Offers, Final Report, July 1977,-12 pp. Available to subscribersonly, -$35 /year for three reports
COLLEGE AND UNIVERSITY PERSONNEL ASSOCIATION, One Dupont Circle, N.W., Washington, D. C. 20036
1975276 Administrative Compensation Survey, reported in THE CHRONICLE OF HIGHER EDUCATION,February 17, 1976
Women and Minorities in Administration of Higher Education Institutions: Employment Patterns andSalary Comparisons, June 1977, 95 pp.
ENDICOTT REPORT, Placement Center,-Northwestern University, Evanston, Illinois 60201
The Endicbtt Report, 1977, Trends in the Employment of College andUniversity Graduates inBusiness and Industry, by Frank S. Endicott, 12 pp. free
a 4
154
12.1

122 r
ENGINEERING MANPOWER COMMISSION, 345 East 47th.Street, New York, New York 10017
Professional Income of Engineers, 1976, December 1976, 92 pp., $8.00
Prospects of Engineering andTechnology Graduates, 1976, January 1977, 31 pp., $10.00
Salahes of Engineering Technicians and Technologists, 1977, September 1977 (in press)
Salaries of Engineering Technicians and Technologists, 1976, Detailed Industry Report,February 1976, 128 pp., $60.00
Salaries'of Engineers in Education, Special Report 1976, December 1976, 44 pp., $5.00
HITCHCOCK PUBLISHING COMPANY, Hitchcock Building, Wheaton? Illinois 60187
"Report on EDP Salaries - 1977," INFOSYSTEMS, June 1977
INDUSTRIAL RESEARCH, INC.., 222 South Riverside Plaza, Chicago, Illinois 60606.
"More Money in AlTrPaycheck," INDUSTRIAL RESEARCH, March 1977
INSTITUTE OF FOOD TECHNOLOGISTS, Suite 2120, 211 North LaSalle Street, Chicago, Illinois 60601
"1976 Starting Salary Sur4y," FOOD TECHNOLOGY, January 1977
MIDDLE ATLANTIC CAREER COUNSELING ASSOCIATION, eomiliged and Availble from Leo A. Polinsky, Director/-
of Placement, SUNY Agricultural and Technical College, Cobleskill, New York 12046
'"Starting Salary Offers to Graduates of Two-Year Colleges, 1975-76," 2 pp., free
NATIONAL ACADEMY OF SCIENCES/NATIONAL RESEARCH COUNCIL, 2101 Constitution Avenue, N.W., Washington,D. C. 20418
Doctoral Scientists and Engineers in the United States - 1975 Profile, 1976, 51 pp.
NATIONAL SCIENCE FOUNDATION. Available from the Government Printing Office, Washington, O. C. 20402
Characteristics of Doctoral Scientists and Engineers in the United States, 1975, NSF 77 -309;144 pp, $3.00-
'Characteristics of the National Sample of Scientists and Engineers 1974, Part 2, Employment,NSF 76-323, 214 pp., $2.80
NATIONAL SOCIETY OF PROFESSIONAL ENGINEERS, 2p29 K Street, Washington, D. C. 200U6
, Professional Engineers' Income and Salary Survey 1975, Pub. No. 0004, June 1975; 72 pp., $10,00togembers, $20.00, non-members
U. S. CIVIL SERVICE COMMISSION, 1900 E Street, N.W., Washington, D.,C. 20415
General Pay Classification Schedule, October 1, 1976 and October 1, 1977, free
Unpublished Data, October 31, 1976
U. S. DEPARTMENT OF HEALTH, EDUCATION AND WELFARE, NATIONAL CENTER FOR EDUCATION STATISTICS. Availablefrom the Government Printing Office, Washington, D. C. 20402 .4
Digest of Education Statistics, 1976 Edition, NCES 77-401, 214 pp., no price given,
Higher Education - Salaries, Tenure, and Fringe Benefits of Full-Time Instructional Faculty inInstitutions of Higher Education, 1975-76, NCES 77-318, 157 pp., $2.40 P
Unpublished PYeliminary Data 1"U.$. DEPARTMENT OF HEALTH, EDUCATION AND WELFARE, PUBLIC HEALTH SERVICE, Center for Disease, control,
.Bureau of Laboratories, Atlanta, Georgia 30333
Position Classification and Pay in State and Territorial Public Health Laboratories, Fiscal Year1975, Number 8, 39 pp., free
U.S. DEPARTMENT OF LABOR, BUREAU OF LABOR STATISTICS. Available from the Government Printing Office,Washington, D. C. 20402
A
National Survey o Professional, Administrative, Technical, and Clerical Pay, March 1976,Bulletin 1931, 69 pp., $1.35
Occupational Outlook Handbook, 1976-77 Edition, Bulletin 1875, 775 pp., $7.00
News Release Dated July 11, 1977
155