ED 015 808 R E F O R T RESUMES 1-/' ED 015 808 RC 002 042 PROBLEMS IN FINDING JOBS FOR MIGRANT...
22
I R O R T E F T RESUMES 1-/' ED 015 808 RC 002 042 PROBLEMS IN FINDING JOBS FOR MIGRANT YOUTH. BY- LINDSTROM, D.E. ILLINOIS UNIV., URBANA. COLL. OF AGRICULTURE REPORT NUMBER RSM-42 PUB DATE OCT 67 ECRS PRICE MF-$0.25 HC-50.92 21P. DESCRIPTORS- EMPLOYMENT, *JOBS. JOB MARKET, MIGRATION. MIGRANT YOUTH, METROPOLITAN AREAS. *NEEDS, OCCUPATIONAL GUIDANCE. OCCUPATIONAL INFORMATION. *OPPORTUNITIES, PROFESSIONAL OCCUPATIONS, *RURAL YOUTH, SEMISKILLED OCCUPATIONS? TECHNICAL OCCUPATIONS, UNSKILLED OCCUPATIONS. *VOCATIONAL COUNSELING. THE PURPOSE OF THIS STUDY WAS TO DETERMINE THE OUTCOME OF RURAL IN-MIGRANT YOUTH SEARCHING FOR JOBS IN ST. LOUIS. MISSOURI. THE DATA CAME FROM TWO RANDOMIZED SAMPLES OF RURAL YOUTH (TOTALING 4046) MIGRATING TO ST. LOUIS FROM 50 MILES OR MORE OUTSIDE THE CITY. THESE RURAL YOUTH ARE CHARACTERIZED AS FOLLOWS--(1) TWO - THIRDS HAD FINISHED HIGH SCHOOL. WITH ONLY 10 PERCENT ACHIEVING A HIGHER LEVEL, (2) 60 PERCENT WERE MALES. AND (3) IN INTERVIEWS ALMOST HALF STATED THEY WERE SEEKING JOBS IN THE CLERICAL. SALES, AND SERVICE AREAS, WHILE MORC THAN TWO-FIFTHS ASPIRED TO MANUAL LABOR TfFE JOBS. LESS THAN TWENTY-FIVE PERCENT OF THE APPLICANTS AT THE EMPLOYMENT SERVICE RECEIVED JOB REFERRALS, WHICH PROMPTED A STATISTICAL ANALYSIS OF THE DATA TO DETERMINE THE REASONS FOR THIS POOR RECORD. THE VARIABLES UTILIZED WERE---SEX, JOB CLASSIFICATIONS, EDUCATION, TIME IN THE CITY, DISTANCE TRAVELED. STATED INTEREST, AND COURSE TAKEN IN HIGH SCHOOL. CONCLUSIONS REACHED FROM THE STATISTICAL ANALYSIS INCLUDE--(1) MALES ARE LIKELY TO REMAIN IN THE CITY LONGER THAN FEMALES SEEKING JOBS, (2) MALES ARE MORE LIKELY THAN FEMALES TO FIND JOBS OPEN TO THEM, AND (3) OLDER YOUTH ARE LIKELY TO BE MORE ADVANCED IN SCHOOL. AND THUS HAVE BETTER TRAINING, SPEND MORE TIME IN THE CITY. MIGRATE FARTHER, AND HAVE WIDER JOB INTERESTS. IMPLICATIONS FROM THE STUDY INDICATE THAT THESE YOUTH NEED BETTER GUIDANCE AND COUNSELING. WHICH SHOULD BE PROVIDED BY THEIR HIGH SCHOOLS. (ES)
Transcript of ED 015 808 R E F O R T RESUMES 1-/' ED 015 808 RC 002 042 PROBLEMS IN FINDING JOBS FOR MIGRANT...

I R O R TE F T RESUMES1-/'
ED 015 808 RC 002 042PROBLEMS IN FINDING JOBS FOR MIGRANT YOUTH.BY- LINDSTROM, D.E.
ILLINOIS UNIV., URBANA. COLL. OF AGRICULTUREREPORT NUMBER RSM-42 PUB DATE OCT 67ECRS PRICE MF-$0.25 HC-50.92 21P.
DESCRIPTORS- EMPLOYMENT, *JOBS. JOB MARKET, MIGRATION. MIGRANTYOUTH, METROPOLITAN AREAS. *NEEDS, OCCUPATIONAL GUIDANCE.OCCUPATIONAL INFORMATION. *OPPORTUNITIES, PROFESSIONALOCCUPATIONS, *RURAL YOUTH, SEMISKILLED OCCUPATIONS? TECHNICALOCCUPATIONS, UNSKILLED OCCUPATIONS. *VOCATIONAL COUNSELING.
THE PURPOSE OF THIS STUDY WAS TO DETERMINE THE OUTCOMEOF RURAL IN-MIGRANT YOUTH SEARCHING FOR JOBS IN ST. LOUIS.MISSOURI. THE DATA CAME FROM TWO RANDOMIZED SAMPLES OF RURALYOUTH (TOTALING 4046) MIGRATING TO ST. LOUIS FROM 50 MILES ORMORE OUTSIDE THE CITY. THESE RURAL YOUTH ARE CHARACTERIZED ASFOLLOWS--(1) TWO- THIRDS HAD FINISHED HIGH SCHOOL. WITH ONLY10 PERCENT ACHIEVING A HIGHER LEVEL, (2) 60 PERCENT WEREMALES. AND (3) IN INTERVIEWS ALMOST HALF STATED THEY WERESEEKING JOBS IN THE CLERICAL. SALES, AND SERVICE AREAS, WHILEMORC THAN TWO-FIFTHS ASPIRED TO MANUAL LABOR TfFE JOBS. LESSTHAN TWENTY-FIVE PERCENT OF THE APPLICANTS AT THE EMPLOYMENTSERVICE RECEIVED JOB REFERRALS, WHICH PROMPTED A STATISTICALANALYSIS OF THE DATA TO DETERMINE THE REASONS FOR THIS POORRECORD. THE VARIABLES UTILIZED WERE---SEX, JOBCLASSIFICATIONS, EDUCATION, TIME IN THE CITY, DISTANCETRAVELED. STATED INTEREST, AND COURSE TAKEN IN HIGH SCHOOL.CONCLUSIONS REACHED FROM THE STATISTICAL ANALYSISINCLUDE--(1) MALES ARE LIKELY TO REMAIN IN THE CITY LONGERTHAN FEMALES SEEKING JOBS, (2) MALES ARE MORE LIKELY THANFEMALES TO FIND JOBS OPEN TO THEM, AND (3) OLDER YOUTH ARELIKELY TO BE MORE ADVANCED IN SCHOOL. AND THUS HAVE BETTERTRAINING, SPEND MORE TIME IN THE CITY. MIGRATE FARTHER, ANDHAVE WIDER JOB INTERESTS. IMPLICATIONS FROM THE STUDYINDICATE THAT THESE YOUTH NEED BETTER GUIDANCE ANDCOUNSELING. WHICH SHOULD BE PROVIDED BY THEIR HIGH SCHOOLS.(ES)

U.S. DEPARTMENT OF HEALTH, EDUCATION & WELFARE
OFFICE OF EDUCATION
THIS DOCUMENT HAS BEEN REPRODUCEDEXACTLY AS RECEIVED FROM THE
PERSON OR ORGANIZATIONORIGINATING IT. POINTS OF VIEW OR OPINIONS
STATED DO NOT NECESSARILY REPRES:NTOFFICIAL OFFICE OF EDUCATION
POSITION OR POLICY.
PROLLEMSINFINDINGJOBSFORMIGRANTYOUTH
by
D. E. Lindstrom
RESEARCH IN RURAL SOCIOLOGYDEPARTMENTS OF AGRICULTURAL ECONOMICS AND SOCIOLOGYAGRICULTURAL EXPERIMENT STATIONUNIVERSITY OF ILLINOIS COLLEGE OF AGRICULTUREURBANA, ILLINOIS
OCTOBER, 1967RSM-42

TABLE OF CONTENTS
Page
Introduction1
Part I Results1
Age1
Job identification 2
Distance traveled 3
Grade attained in school 3
Sex, marital status, and number of children in the family 4
Geographic distribution and classification of migrants 4
Tests given and stated interests of in-migrants 5
Length of time in city, number of interviews, and times called in. 7
Number of times referred, record of last placement, and number oftimes placed in a job 8
Significant relations between sex, age, and job classification toother variables 9
Significant relationships between education, type of high schoolcourse taken by job seekers, and other variables 10
Part II Results 12
Occupational code job classification 12
Activity relative to registering for a job 13
Extent of referral and activity to find jobs 14
Summary and conclusion 15
Implications 16

PROBLEMS IN FINDING JOBS FOR MIGRANT YOUTH
by
D. E. Lindstrom1(
INTRODUCTION
Many rural youth go to cities each year to find jobs. What happens when they ar-
rive in the cities is not clear. Some do get jobs, but little is heard from the
majority.
In an effort to find out more about what did happen to migrants going to St. Louis,
Missouri, to look for jobs from 50 miles and more outside the city, data were se-cured from a study made Li connection with The Youth Demonstration Project by theDivision of Employment Security, Department of Labor and Industrial Relations,State of Missouri;., These data were taken from two sources: (1) the first made
in 1963 of 16,928A/ in-migrants and (2) a more-selective study of data on 1,077
in-migrants. The first source of data (1) provides a general picture of whathappened in connection with efforts to place the youth; the second (2) providesadditional and more-detailed data on the in-migrant youth.
The data from the present study covered only the youth migrating to St. Louis from
50 miles or more outside the city. These included records on all 3,558 youth from
the random sample of 16,928 used for the first part of the study, and 488 recordsfrom the data on the second part. These were youth living 50 miles or more out-
side the city taken from the 1,077 in-migrants included in the Demonstration Proj-ectY.
PART I RESULTS
Age. In the sample there were about the same percentages for each of four agegroups--18, 19, 20, and 21 years of age (see Table 1)--with only 9 percent 16 and
17. That the non-metropolitan sample was comparable with the total project sample
is also shown in Table 1, thus indicating that the non-metropolitan/ sample com-
pared favorably with the total sample in ages of the youth.
17Viaessor of Rural Sociology, Departments of Agricultural Economics and Soci-ology, University of Illinois. Acknowledgment and thanks are due J. R. Signer,
Chief, Research and Analysis, Division of Employment Security, State of Mis-souri, and his staff, especially H. E. Linzee and Marie Maxwell, for making
available original data from their studies in connection with their Youth Dem-onstration Project for use in this analysis. Statistical programming was done
for the study by Mrs. R. D. Dhindsa and Stanley Tucker, Graduate Assistants in
the Department of Agricultural Economics, assigned to Rural Sociology Research.
2/ "A sample of youth application cards were randomly selected at the end of each
month, during January to June, 1963. The sample was made from applicationsbeing transferred to the inactive file, that is, there had been at least 60
days since the youth's last contact with the office." Personal correspondence
with H. E. Linzee.3/ That is, those 50 miles and farther out from St. Louis.

Table 1. Age in Years in Number and Percent of MigrantsSeeking Jobs in St. Louis, Missouri
Total sam leNon-metropolitans. le Percent
N = 16,9;.81Y N = 3,558
16 1 2
17 7 6
18 22 23
19 26 23
20 24 23
21 20 22
a/ Coming from 50 miles or more outside the city.b/ Used in the Youth Demonstration Project: 24 percent of
all applicants fo-z the months of January, February, March,April, May, and June, 1963.
Job identification. When these youth came into the employment office,li theywere asked to fill out application forms. In making out these forms, oliy 29 per-cent of the 3,558 youth reported they had had experience in a job ('Table 2); themajority reported experience in the clerical and sal s, semiskilled, and unskilledareas (a total of 81 percent). The "inexperienced"2! (87 percent) were classifiedlargely in the clerical and sales, semiskilled, and unskilled areas. Over one-fourth were without a skill. It is quite probable that the inexperienced type ofyouth are among the most numerous who are likely not to be placed in jobs whenthey migrate.
Table 2. Job Classification) of Migrants toSt. Louis, Missouri, Seeking Jobs, 1963
All
(N = 3,558)
Experienced(N = 1,043)
Inexperienced(N = 2,506)
No. Percent No. Percent No. Percent
Professional and technical 63 2 10 1 53 2
Clerical and sales 1,037 29 361 35 676 27
Service 475 13 276 26 199 8
Agriculture, forestry,and fishing 18 1 18 2 0
Skilled 240 7 62 6 178 7
Semiskilled 1,067 30 316 30 751 30
Unskilled 649 18 0 649 26
No data 9 Less
than 1
a/ This is tgkimary occupation gied on a two-digit classIlication system:the first digit indicating primary occupation; the second, whether experiencedor inexperienced, as shown in the application forms.
1/ All youth seeking jobs did not come to the employment office; this study istherefore limited to those who did.
2/ See footnote a, Table 2.

-3-
Distance traveled. Only 13 percent of these youth traveled less than 100 milesto make an application for a job; on the other hand, 35 percent traveled 300 milesor more. So the majority (62 percent) came from distances ranging from 100 to300 miles (Table 3).
The fact that so many (87 percent) traveled 100 miles or more to apply for jobsin St. Louis can mean that they were anxious to get a job, as doubtless nonecould be found in the home community. But this assumption would have to be checked,since so many (Table 3) failed to return to the office for consultation or assign-ment.
Table 3. Distance Traveled by Migrants SeekingJobs in St. Louis, Missouri, 1963
NumberDistance in miles = 3,558) Percent
50 to 99 476 13100 to 199 1,024 29200 to 299 815 23300 and more 1,243 35
Grade attained in school. Only 9 percent had gone beyond high school in theirpursuit of education; almost a third had not finished the 12th grade (Table 4).This situation probably influenced success in securing a job, for other studieshave shown that most (including those having finished high school and no more)had little training in the high school they attended that would fit them for thekinds of jobs they reported they could handle.1/Y
Table 4. Educational (Grade) Attainment,i in Number and Per-cent, of Migrants Seeking Jobs in St. Louis, Missouri,Coming From 50 Miles or More Outside the City
Number of years of formal schoolingNumber(N = 3,558) Percent
Under eight 102 3
Eight 291 8
Nine 265 7
Ten 478 13
Eleven 400 11
Twelve 1,718 49Thirteen 175 5
Fourteen 86 2
Fifteen 20 1
Sixteen and over 23 1
a Shown at time of application. (See footnote 1, Table 2.)
1/ Most rural high schools are oriented to aca4emic or college-prepatory programs.2/ See D. E. Lindstrom, Factors Affecting Post-High School Education of Rural
Youth in Illinois, AES, Univ. of Ill. Coll. of Agr., Dept. of Agr. ::con., inMS to be published as a Station Bulletin, 1967.

As to the migrants under study, only 30 percent took major course work in voca-
tional, commercial,or "other" fields. The majority reported they took a general
course; another 13 percent listed academic course work. About two-thirds of the
youth had taken only general and academic courses, or what amounted to college-
preparatory work. Yet, as shown in Table 2, only 2 percent sought jobs in the
professional and technical areas; 81 percent sought jobs in the semiskilled and
other jobs lower than in the professional and technical areas. Few sought jobs
in the agriculture-related fields (1 percent), yet 12 percent had high school
courses in these fields; 42 percent reported they hoped to get jobs in the cler-
ical, sales, and service areas; yet only 18 percent had had high school curses
in these fields.
Table 6. Type of M4jor School Course Reported by Migrants
Seeking Jobs in St. Louis, Missouri, 1963
Type of course
Number(N = 3,558) Percent
Generalalb/
Commercial.Academicc/Vocatio4a111/
Others--/
No data
1,75662044943948
246
49
17
13
12
1
7
a/ A variety of courses checked and no concentration in any
one class.
b/ Courses taken included shorthand, typing, or bookkeeping.
c/ Courses taken included algebra, geometry, trigonometry,
physics, chemistry, and biology.
d/ Courses taken included some home economics, agriculture,
mechanical drawing, or shop courses.
e/ Courses included secretarial or business school work, or
some college courses, such as business administration,
law, etc.
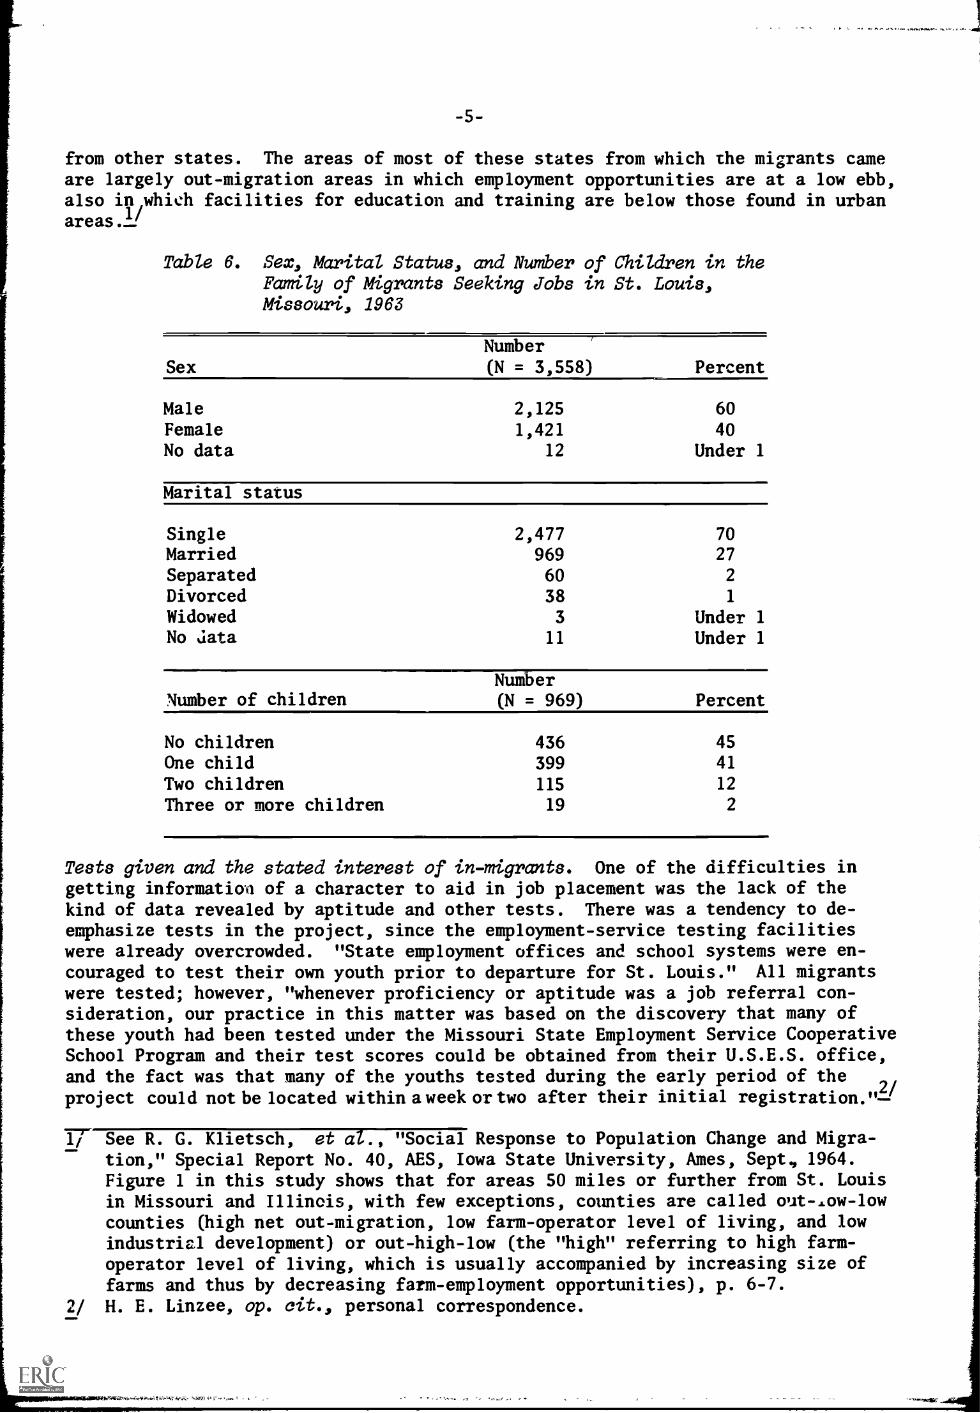
Sex, mari.tal status, and number of children in the family. The youth in the sam-
ple were mostly males (Table 6). This does not follow the usual pattern of migra-
tion from rural areas. Usually, more females than males seek to migrate. Because
migrants from these dominantly non-metropolitan areas include both farm and non-
farm, and because most males seeking jobs cannot find them in the home community,
these job-seeking migrants were preponderantly males.
Almost three-fourths of the migrants were single; but it is worth noting that
27 percent were or had been married. Of these, 55 percent had 1 or more children;
41 percent had only 1 child (Table 6). What effect marriage had on success in
getting a job was not determined. Doubtless, marriage served to enhance the desire
get a job, especially if there were children in the family. Obviously, such
families would be faced not only with the need to secure a job as soon as possible,
but also the need to find a suitable home for the family.
Geographic distribution and classification of migrants. Most of the migrants
(48 percent) came from the state of Missouri; 28 percent came from the nearby states
Arkansas, Illinois, Mississippi, and Tennessee; the balance (14 percent) came
from other states. The areas of most of these states from which the migrants cameare largely out-migration areas in which employment opportunities are at a low ebb,also in which facilities for education and training are below those found in urban
1areas/
Table 6. Sex, Marital Status, and Number of Children in theFamily of Migrants Seeking Jobs in St. Louis,Missouri, 1963
SexNumber(N = 3,558) Percent
Male 2,125 60
Female 1,421 40
No data 12 Under 1
Marital status
Single 2,477 70
Married 969 27
Separated 60 2
Divorced 38 1
Widowed 3 Under 1No data 11 Under 1
Number of childrenNumber(N = 969) Percent
No children 436 45
One child 399 41
Two children 115 12
Three or more children 19 2
Tests given and the stated interest of in-migrants. One of the difficulties ingetting information of a character to aid in job placement was the lack of thekind of data revealed by aptitude and other tests. There was a tendency to de-emphasize tests in the project, since the employment-service testing facilitieswere already overcrowded. "State employment offices and school systems were en-couraged to test their own youth prior to departure for St. Louis." All migrantswere tested; however, "whenever proficiency or aptitude was a job referral con-sideration, our practice in this matter was based on the discovery that many ofthese youth had been tested under the Missouri State Employment Service CooperativeSchool Program and their test scores could be obtained from their U.S.E.S. office,and the fact was that many of the youths tested during the early period of the
2/project could not be located within aweek or two after their initial registration.m-
17- See R. G. Klietsch, et al., "Social Response to Population Change and Migra-tion," Special Report No. 40, AES, Iowa State University, Ames, Sept, 1964.Figure 1 in this study shows that for areas 50 miles or further from St. Louisin Missouri and Illinois, with few exceptions, counties are called out-ow-lowcounties (high net out-migration, low farm-operator level of living, and lowindustrial development) or out-high-low (the "high" referring to high farm-operator level of living, which is usually accompanied by increasing size offarms and thus by decreasing farm-employment opportunities), p. 6-7.
2/ H. E. Linzee, op. cit., personal correspondence.

Table 7. Distribution in Various States and Classificationof Migrants Seeking to Find Jobs in St. Louis,Missouri, 1963
StatesNumber(N = 3,558) Percent
Missouri 1,713 48
Arkansas 340 10
Illinois 318 9
Mississippi 202 6
Tennessee 142 4
Other 770 22
No data 33 1
Classification
In-migrant 3,321 93No data, 183 5
Others2! 54 2
a/ Juvenile court, post-high school, -econdary schools, andterminal education, part-time summer work, vocationalschool, dropouts, and settlement houses. These were areasof concern to the Project unit areas and related to theYou,h Program in the greater St. Louis metropolitan area.
It is not surprising, therefore, that there were no test results available for83 percent of the applicants (see Table 8). Only 17 percent had the advantageof being able to produce, or have produced for them, the kind of counseling datathat would help in intelligent job placement.
Table 8. Tests Given and Stated Interestsql of MigrantsSeeking Jobs in St. Louis, Missouri, 1963
Type of test givenNumber(N = 3,558) Percent
Professional 405 11
GATB 136 4
Special aptitude and other 58 2
None (including no data) 2,959 83
Stated interest
Professional, technical, managerial 282 8
Clerical and sales 956 29
Service work 406 11
Mechanical workb/ 311 9
Manual work 1,483 42
No data 120 3
a/ Based on Occupational Code: preferred work area or kindof work desired.
b/ Including agricultural, marine, or forestry work.

The youth were asked to state their interest in the type of job desired. Surpris-
ingly, 8 percent sought jobs in the highest ranks;1/ on the other hand, 42 percent
would take jobs requiring manual work. Almost half, however, felt they would beinterested in a clerical, sales, or service job--or in one involving mechanicalwork; 40 percent were interested in clerical or sales and service work. The prob-
abilities are that the majority of job placements were in the lower-ranking jobareas and that those finding jobs were those most-advanced or best-qualified inthe clerical, sales, or service work areas in which jobs are increasing mostrapidly.
Length of time in city, number of interviews., and vines called in. It is surpris-
ing that so few youth coming in for interviews were placed. Most of them (54 per-cent) stayed in St. Louis less than 6 months; 25 percent stayed 1 or more raars(Table 9). Since "most of the applicants were from out-state Missouri or nearbyIllinois, a high percentage were staying with relatives or f2iends. They usedthis address during their 1- to 2-week stay, then returned home without notifyingthe postman. Our letters and cards were usually returned--'moved, no forwardingaddress'. "?/ It would seem many could have taken the time to go through the proc-ess of being placed. Why they did not take this 'Am can only be implied from thereasons given by the interviewers.
In view of the reports that over two-fifths of the youth stayed in St. Louis6 months or more, it is surprising to note in Table 9 that 75 percent did not re-spond to a call to come in after the first interview.Y This, of course, was amatter of choice on the part of the in-migrant. But the fact that such a largepercentage failed to return implies a lack of understanding on the part of theyouth as to what was expected of him or that a decision was mad., to seek othermeans of job placement. If this is a fault, it is doubtless as much one of lackof local community preparation of the youth and their understanding and concernas it is of the procedures employed by the employment service, if not more so.
1/ Note in Table 2 that only 2 percent had job identifications (1 percent expe-rienced) in the professional and technical areas.
2/ H. E. Linzee, op. cit., personal correspondence. "The normal applicant regis-tration process included a 20-30 minute interview with an employment servicetechnician; job interest, job ability, and the local labor market were dis-cussed at this time. Often, the applicant was then sent to a placement tech-
nician for immediate job referral consideration. Either of these technicianswere qualified to advise the youth on the correct way to pursue his own inde-pendent job-seeking program. The 1-hour counseling interviews were usuallylimited to youths who needed guidance in making a proper vocational choice.Counseling interviews generally required an appointment for a later date;even though so scheduled, the in-migrant youths usually failed to keep theirappointments."
3/ H. E. Linzee, op. cit., personal correspondence. "This has reference to the
practice of calling a youth into the office just before job referral. The
technician could then check proper dress and appearance, review transportationdirections, and the job duties in greater detail. Most importantly, it pro-
vided an opportunity to build up confidence just prior to the employer inter-view. At the same time, many of the youth applications contained the inter-view comment, 'O.K. to refer by phone,' indicating this special assistance wasnot necessary prior to referral."

Table 9. Length of Time in City, Number of Times Called in,and Number of Interviews of Migrants Seeking Jobsin St. Louis, 1963
Time in cityNumber(N = 3,558) Percent
Less than six months 1,995 54Six to twelve months 660 19One to two years 372 11Two to three years 240 7Three years or more 230 7No data 61 2
Number of times called in
None 2,675 75One 683 19Two 134 4Three or more 66 2
Number of interviews
None 3,235 91One 230 8Two or more 43 1
The situation is even more exasperating with respect to records of the number whocame in for interviews (see footnote 3, page 7)--only 9 percent (Table 9), ofwhich only 1 percent came in for 2 or more interviews. It would appear that some-thing happened to these youth; they did not come back, and for the most part didnot leave a forwarding address so that they could be reached.
Number of times referred, record of last placement, and number of times placedin a job. Less than a fourth of the in-migrant youth applicants received at least1 job referral!! (Table 10). One difficulty, apparently, was that no data on thelast job placement were available for 87 percent of the applicants. This is notsurprising in view of the fact that most of the youth probably had not previouslybeen placed by an employment agency (see Table 2 for the percentage reporting jobinexperience). Those having a record (14 percent) were all in the clerical, sales,service, skilled, semiskilled, and unskilled areas.
For 85 percent of the applicants, the actual percentage of number of times placedwas "none"; 14 percent were placed once; and 1 percent twice or three times (whichmay mean once a youth is placed he or she is likely to stay with the job).
1/ H. E. Linzee, op. cit., personal correspondence. "This is somewhat below theoverall youth-applicant average, but these youth were extremely mobile, andoften could not be contacted at a later date. Many of these referrals were,therefore, made on the initial day of application." This low percentage, itmay be observed, could be due to the lack of training or experience needed forjobs open by erployers, many of whom have no place for those with educationalqualifications below high school.

"A number of considerations are involved in the evaluation (of the number of timesplaced): most immediately the poor chance of contacting these youth a week or twoafter their initial registration; then an employer preference for local youth- -it is difficult to check in-migrants' references. The quality of thlir educational
system is often unknown. In- migrant youth have often not established a good em-
ployee record, particularly those from out-state Missouri or nearby Illinois.Many return to their homes on weekends; they do not want overtime or weekend work.Most frequently, employers stated the in-migrant youth employee does not resign,ae ;imply fails to report for work on Monday morning."1/
Table 10. Number of Times Migrants Were Referred, Record ofLast Job Placement, and Number of Times Placed:Youth Who Migrated to St. Louis Seeking Jobs, 1963
NumberNumber of times referred (N = 3,558) Percent
None 2,438 68
One 835 24
Two 191 5
Three 61 2
Four or more 33 1
Job code
No data 3,092 87
Professional, technical, man. 10 Lessthan 1
Clerical, sales 173 5
Service 52 2
Skilled and semiskilled 142 4
Unskilled 89 3
Number of times placed
None (2 blanks) 3,041 85
Once 496 14
Twice or three times 21 1
Significant associations?J between sex, age, and job classification and other
variables. The variables related (1) to sex: (Table 11) time spent in the city
and stated interest; (2) to age: education, type of course, time spent in thecity, distance migrated, stated interest; and (3) to job classification: age,
education, type of course, sex, time spent in the city, distance migrated, and
stated interest.
1/ H. E. Linzee, op. cit., personal correspondence.
2/ As determined by chi-square computations. The word "associations" is usedhere following Hagood and Price, Statistics for Sociologists, New York: Holt,
1952, p. 365 ff. See appendix for details.

-10-
What do these associations mean? Specifically, males would be more likely to re-main longer in the city seeking jobs than females. Also, males would find betterjobs open to them than females. Likewise, the clder youth would be more likelyto be more advanced in school, have more general training, spend more time in thecity, migrate farther, and have higher job interests.
Table 11. Significant Associations Between Sex, Age, and Job Classi-fication, and Other Variables; 3,558 Migrants From Outsidea 50-Mile Radius From St. Louis, Missouri
Variable: sexDegrees of Level of
Chi-square freedom significance
Time in cityStated interest
54.51,011.5
4
3
.001
.001
Variable: age
Education 170.7 8 .001
Type of course 37.8 8 .001
Time in city 97.14 8 .001
Distance migrated 75.7 6 .001
Stated interest 18.8 6 .001
Variable: '03 classification
Age 75.5 10 .001
Education 981.03 20 .001
Type of course 665.2 20 .001
Sex 1,001.8 5 .001
Time in city 610.6 20 .001
Distance migrated 228.4 15 .001
Stated interest 4,383.4 15 .001
Significant associations-1/ between education, type of high school course takenby job seekers, and other variables. Education and type of course (see Table 12;also 4 and 5) were associated: the better educated (more advanced in school)were those taking courses fitting them for college work or higher-ranking jobs.
Associated also with education were sex, time in city, distance migrated, andstated interest (Table 12)--all at a significance level of .01 or .001. Relatedto the type of course were sex, time in city, and stated interest.
This can be taken to imply that those most advanced in school are likely to bethose having taken the general rather than the vocational course in high school,those migrating the greatest distances, those having spent the most time in thecity (the males), and those (when applying) who showed the most interest in thehigher-ranking jobs.
if See Taves, et al., op. cit., for similar findings, that migration is utilizedas a vehicle to vocational achievement and financial success.

Table 12. Significant Associations Between Education and Type of HighSchool Course Taken and Other Variables: 488 Migrqnts FromOutside a 50-Mile Radius From St. Louis, Missourigl
Degrees of Level ofVariable: education Chi- square freedom significance
Sex 90.8 4 .001Distance migrated 44.2 12 .001
Stated interest 678.5 12 .001
Type of course 1,053.0 16 .001
Time in city 97.1 16 .001
Variable: type of high school course taken
Sex 693.4 4 .001Time in city 66.5 12 .001
Stated interest 554.6 12 .001
Variable: time in city
Distance migrated 49.2 12 .001
Stated interest 32.1 12 .01
Variable: distance migrated
Stated interest 111.5 9 .001
a/ The analysis of the additional 488 migrants was used to make resultsavailable on data relative to their situation that was not availableon the larger sample.
There seem to be some inconsistencies in these relationships. But it may be ob-served that the majority of the migriting youth were males; they were doubtlessinfluenced by their school and community circumstances to major in the academicand general rather than the vocational and business courses, since it was expectedthat they would go to college; and that when they applied, they would indicate aninterest in the jobs in which they were most likely to get work. The fact thatthe variables of "distance migrated" and "time in city" were related seems logical,as does the fact that those who migrated the farthest and stayed the longest inthe city were the older youth (the males; -- obviously the ones showing the mostinterest in higher-ranking jobs.
School advancement, general course work, more advanced age, more time spent inthe city, and interest in higher-ranking jobs requiring human relations skillsare all factors that need to be considered when youth migrate to the city seekingjobs. These are the concerns that are most likely to be of help to youth in find-ing jobs in the city. Youth who seek jobs in cities shortly after high schoolgraduation and who lack human relations as well as business or vocational skillsmust exhibit other abilities that will help them make the expected adaptations.

-12-
PART II RESULTS
The data secured through the restudy (made from 488 cards selected by random sam-ple) provided additional information on the following items that seems to be worthreporting:1/
Persons or agency directing youth to the employment service.Claim for unemployment insurance.Occupation-code classification.Employment-service activity.Type of job desired.Extent of contact for referral.Reaction to referral notice.Success in finding a job.
Occupational-code job classification. The data reported in Table 13 indicate the
success with which the project personnel were able to classify the youth in the
special tabulation. The highest percent (25) could be classified in the skilled,semiskilled, and unskilled areas; 12 percent in agriculture, marine, forestry,clerical, and sales; and only 6 percent in professional, technical, and managerial.Almost half could not be classified at all. This signifies that the youth, them-
selves, for the most part, did not know what specific job type they wanted orwere prepared to enter, indicating a lack of counseling and guidance before they
came to the city seeking jobs.
Table 13. Occupational Code Classification of and ClaimMade by 488 Migrants Seeking Jobs in St. Louis,Missouri, 1963
NumberOccupational class (N = 488) Percent
Professional, technical, managerial 30 6
Clerical and sales 16 3
Agriculture, marine, forestry 42 9
Skilled 33 7
Semiskilled 49 10
Unskilled 38 8
No data 280 57
Number
Was claim made? = 488) Percent
Yes (a claim) 95 20
No 393 80
Table 13 also shows that only one-fifth of the youth made a claim for unemploymentinsurance; four-fifths either had not had enough employment to qualify or did not
know if they were eligible. Linzee states?/ "The 20 percent in-migrant youth
1/ See footnote a, Table 12.2/ H. E. Linzee, op. cit., personal correspondence.

-13-
insurance claim status was approximately the same as that for all youth applicants.These 16- to 21-year-old youth were, in many instances, just beginning their workcareer, others had not worked long enough to establish the necessary quarters ofcoverage for eligibility."
Activity relative to registering for a job. As a whole, these 488 young peopledid have some help in finding their way to the employment office; 82 percent re-ported that their friends or relatives (7 percent their parents) helped to directthem the agency. Almost as many were directed to the service by the mass media- -radio, TV, or the press--as was the case with parents, and a few employers (2 per-cent) referred youth to the employment service. But the data on schools were con-spicuous for their absence, indicating that youth do not really look to schoolsfor help in directing them to city employment services. (See Table 14.)
Forty percent indicated no employment service activity on their application cards.According to Linzee, this is "not a surprising percentage for in-migrant youth ap-plicants. They registered, no immediate job referral was available, and they madeno effort to contact us during the immediately following two months. At thistime, an effort was made to contact the applicant, but if not successful, his cardwas transferred to the inactive file."1/
Also, Table 14 shows that practically all applicants (98 percent) were lookingfor permanent employment. This would seem to be a challenge to any governmentalagency and the employers of a city community needing workers to find them perma-nent jobs. In view of the fact that an alarmingly high percentage of the in-migrants cannot find jobs in the city and choose rather to go on public assistance,such a challenge should concern the leaders of the city community.
Table 14. Persons or Agency Directing and Activity Shownand Type of Work Desired on Part of migrantsSeeking Jobs in St. Louis Through the MissouriState Employment Service, 1963
Number./Directed to MSES by (N = 488)
Relatives or friends 216Parents 18Press, radio, or TV 13Employer 6
Schools 1
No data 234
Percent--a/
82
7
5
2
Less than 13
Indication of activity
SomeNone
Number(N = 488)
292
196
Percent
60
40
Type of job
PermanentPart-timeTemporary
Number(N = 488)
482
3
3
Percent
981
1
aT There were 234 blanks; percentages are based on 254 records.
H. E. Linzee, op. cit., personal correspondence.

-14-
Extent of referral and activity to find jobs. Contrary to the data on the largersample, Table 15 shows that 93 percent of the 488 youth were reached for referral,but the response was not encouraging. Evidently, 91 percent did not respond and2 percent were not interested. Yet, it was reported that 73 percent did not finda job.
The Demonstration Project intended to encourage youth to seek employment independ-ently. Their experienced interviewers helped applicants evaluate their workabilities, explained the local labor market, suggested prospective employers, andinstructed the youth on proper application procedures and interview conduct. It
is quite app,._Alt, however, that this was not enough. As many as 93 percent didnot find a job on their own--only 7 percent on their own.
Table 15. Extent of Contact for Referral, Reaction to Noticefor Referral, and Number Who Found Jobs on TheirOwn With 488 Youth Seeking Jobs in St. Louis,Missouri, 1963
Extent of contact
ReachedNot reached
Number(N = 488)
45434
Percent
937
Nature of res onseNumber(N = 488) Perc:1t
Had another jobNot interestedNo data
32 7
11 2
445 91
Success in finding a jobNumber(N = 488) Percent
Found job on ownDid not find job on own
33 7
455 93
Obviously, serious problems still remain in taking care of the constant flow of in-migrant youth se-king jobs in cities. For one thing, more preparatory work needsto be done in the home community with these youth before they go to the city toseek a job. They should expect to remain in the city long enough to carry throughwith the employment-service help that can be given. Careful follow-up work needsto be done to help these young in-migrants adjust to city work and 1 4e.
More important, however, are (1) the need for greater efforts to train the in-migrant youth for jobs in an increasing]" complicated technological society and(2) to provide them with effective job counseling, in school and at home. To be-come a doctor or enter almost any profession takes up to the time a young man is30 years old. The expectation of many youth 16 to 21 years of age that they willbe employed in the city when they graduate from high school (or even before) isalmost a forlorn one. Seemingly, very few do become employed, even with the helpof a highly trained employment-service staff.
-15-
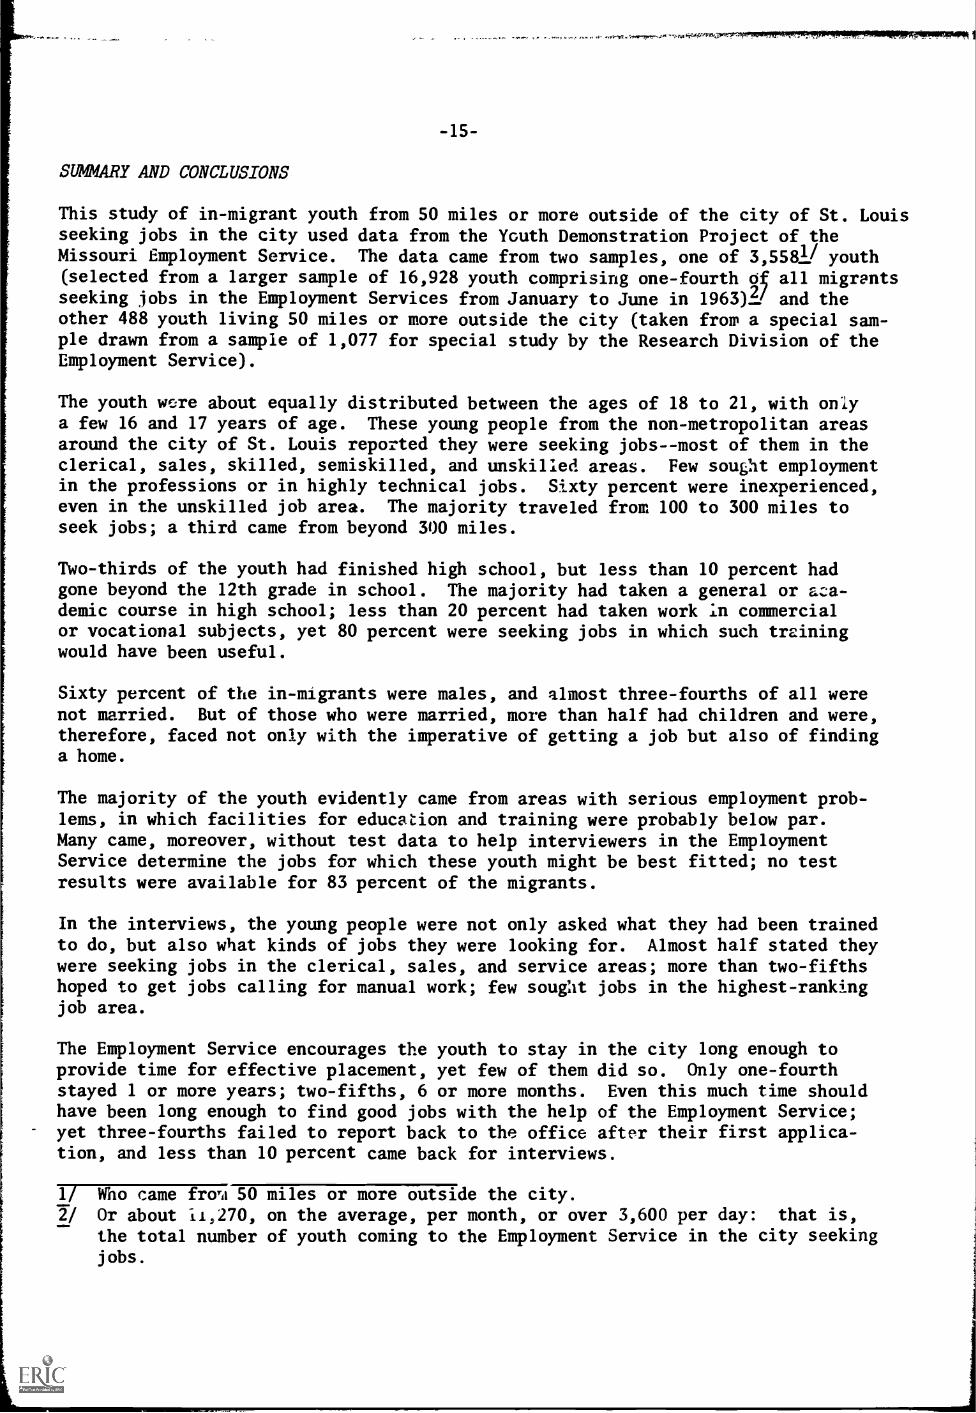
SUMMARY AND CONCLUSIONS
This study of in-migrant youth from 50 miles or more outside of the city of St. Louisseeking jobs in the city used data from the Ycuth Demonstration Project of theMissouri Employment Service. The data came from two samples, one of 3,5581/ youth(selected from a larger sample of 16,928 youth comprising one-fourth of all migrantsseeking jobs in the Employment Services from January to June in 1963)2! and theother 488 youth living 50 miles or more outside the city (taken from a special sam-ple drawn from a sample of 1,077 for special study by the Research Division of theEmployment Service).
The youth were about equally distributed between the ages of 18 to 21, with onlya few 16 and 17 years of age. These young people from the non-metropolitan areasaround the city of St. Louis reported they were seeking jobs--most of them in theclerical, sales, skilled, semiskilled, and unskilled areas. Few sought employmentin the professions or in highly technical jobs. Sixty percent were inexperienced,even in the unskilled job area. The majority traveled from 100 to 300 miles toseek jobs; a third came from beyond 300 miles.
Two-thirds of the youth had finished high school, but less than 10 percent hadgone beyond the 12th grade in school. The majority had taken a general or ac:a-demic course in high school; less than 20 percent had taken work in commercialor vocational subjects, yet 80 percent were seeking jobs in which such trainingwould have been useful.
Sixty percent of the in-migrants were males, and almost three-fourths of all werenot married. But of those who were married, more than half had children and were,therefore, faced not only with the imperative of getting a job but also of findinga home.
The majority of the youth evidently came from areas with serious employment prob-lems, in which facilities for education and training were probably below par.Many came, moreover, without test data to help interviewers in the EmploymentService determine the jobs for which these youth might be best fitted; no testresults were available for 83 percent of the migrants.
In the interviews, the young people were not only asked what they had been trainedto do, but also what kinds of jobs they were looking for. Almost half stated theywere seeking jobs in the clerical, sales, and service areas; more than two-fifthshoped to get jobs calling for manual work; few sought jobs in the highest-rankingjob area.
The Employment Service encourages the youth to stay in the city long enough toprovide time for effective placement, yet few of them did so. Only one-fourthstayed 1 or more years; two-fifths, 6 or more months. Even this much time shouldhave been long enough to find good jobs with the help of the Employment Service;yet three-fourths failed to report back to the office after their first applica-tion, and less than 10 percent came back for interviews.
1/ Who came fro -,A 50 miles or more outside the city.
2/ Or about 11,270, on the average, per month, or over 3,600 per day: that is,
the total number of youth coming to the Employment Service in the city seekingjobs.

-16-
In view of the preceding, it is not surprising that less than a fourth receivedjob referrals and that no data on the last job placement was available for 87 per-cent of the youth. The few placements that did take place were almost wholly inthe clerical, sales, service, skilled, and unskilled areas. Few were placed more
than once; only 15 percent were placed once.
In seeking reasons for such a poor record of referral and reporting back, statis-tical tests of relationships between variables were made--using sex, job classifi-cation, education, time in the city, distance traveled, stated interest, coursetaken in high school, and other variables. Some of the results were:
1. Males were likely to remain in the city longer than females seeking jobs.
2. Males were more likely an females to find jobs open to them.
3. Older youth were more likely to be more advanced in school, and thus have bet-ter training, spend more time in the city, migrate farther, and have wider jobinterests.
Education and type of course were interrelated. Education was related to sex, time
in the city, distance migrated, and stated Interest. The same relations were foundbetween type of course taken, time in thc city, stated interest, and distance mi-grated.
From ..hese findings, it would appear that it is a mistake for youth just finishinghigh school--especially the younger ones and the females--to migrate immediatelyto the city to seek jobs; most of them are likely to be frustrated in their objec-tive. Rather, it woltld be better for the youth to remain in the community to getsome job experience related to the kinds of jobs available in the city, or to getadvanced training of the type demanded by these occupations.
The data from the 488 youth showed that more than in the larger sample were classedin the highest-ranking occupations, but almost half could not be classified at all.This probably means that these youth had no specific training in high school thatwould prepare them for the jobs likely to be open in the city.
Most of the youth in this sample had some help in finding their way to the Employ-ment Service--82 percent from friends and relatives, only 7 percent from parents,and 5 percent from the mass media. No help in this regard came from the schools.
Practically all of the youth were seeking permanent employment, but only 9 percentresponded to calls to report back after their first interview. Seven percent re-
ported they had found jobs on their own.
IMPLICATIONS
Serious questions arise with respect to the wisdom of youth in the 16 to 21 agebracket migrating shortly after graduating from high school from non-metropolitanto metropolitan areas to seek jobs. No doubt the pressure is on many of them tomigrate as they finish high school, since the job situation in their home communi-ties is evidently very tight. The data presented indicate that most of them arepoorly prepared, even to make intelligent use of the Employment Service. They are
misguided in being urged to migrate before they know more about the job situation

-17-
in the city; they do not have the kind of information about their own abilities,interests, and qualifications that can help the interviewers in the EmplcymentService give them intelligent guidance; and for one reason or another 9 in 10 doriot come back after the first contact (the application), failing to leave an ad-dress at which they can be reached.
Further information is needed about what these youth experience in going to thecity. All of them evidently need better counseling and guidance before they maketheir first trip to the city, even if it is limited only to how best to use theEmployment Service. They should not be set adrift in the city, seeking jobs andhomes with little or no information about the city and the nature of its job needsand housing situation. Rather, they should be led to make much better use of theprofessional services at home and in the city in seeking jobs, rather than rely-ing so much (as they seem to do) on friends and relatives. This implies that theschool system--as the most available source of professional service--should takemore seriously the formation of an effective system for guidance and counseling,including up-to-date information about employment and living conditions in thecities.

-18-
APPENDIX
Implied Associations as Shown in Table 111/
1. The association between sex and times in the city: males stayed longer thanfemales.
2. The association between sex and stated interest: more males sought jobs inthe more advanced job area.
3. The association between age and education: the older youth had the moreadvanced education (as measured by years in school).
4. The association between age and type of course taven: the older youth had
a more general education.
5. The association between age and time spent in the city: the older youthspent a longer time in the city.
6. The association between age and distance migrated: the older youth migratedthe longest distances.
7. The association between age and stated interest: the older youth preferredjobs in the upper range of occupations.
8. The association between age and job classification: the older youth wereclassified in the higher range of job classification.
9. The association between job classification and type of course taken in highschool: those classified in the higher ranges of jobs took the general coursein high school.
10. The association between job classification and sex: those in the higher job
classifications were largely males.
11. The association between job classification and time spent in the city: those
in the higher classification of jobs spent more time in the city.
12. The association between job classification and stated interest: those clas-
sified in the higher ranges of jobs were those looking for jobs in the higherranks.
Implied Associations as Shown in Table 121/
1. An association between education and sex: males were more advanced in school
than females.
2. An association between education and distance migrated: those more advanced
in school migrated the longest distances.
1/ These associations were implied from the fact that there were X2 differences
at the .01 and .001 levels, a C ranging from .04 to .75,and a T ranging from.24 to .75.

-19-
3. An association between education and stated interest: those more advanced in
school were more interested in the higher-ranking jobs.
4. An association between education and the type of course taken in high school:those more advanced in school were those havinF taken the general course.
5. An association between education and time in city: those more advanced inschool were those spending more time in the city.
6. An association between the type of course taken in high school and sex: those
having taken the general course in high school were largely males.
7. An association between the type of course taken in high school and the timespent in the city: those having taken the general course were those who
spent more time in the city.
8. An association between the type of course taken in high school and stated
interest: those having taken the general course in high school were moreinterested in the higher-ranking jobs.
9. An association between time spent in the city and distance 'migrated: those
spending more time in the city had migrated the longest distances.
10. An association between time spent in the city and stated interest: those
spending more time in the city had an interest in the higher-ranking jobs.
11. An association between distance migrated and stated interest: those havingcome the longest distances were interested in the higher-ranking jobs.