ECOSYSTEMS IMPROVED FOR SUSTAINABLE ...habitats fostered by the Coastal Resources Management Project...
140
ECOFISH COMPLETION REPORT 1 ECOSYSTEMS IMPROVED FOR SUSTAINABLE FISHERIES (ECOFISH) PROJECT COMPLETION REPORT
Transcript of ECOSYSTEMS IMPROVED FOR SUSTAINABLE ...habitats fostered by the Coastal Resources Management Project...

ECOFISH COMPLETION REPORT 1
ECOSYSTEMS IMPROVED FOR SUSTAINABLE FISHERIES (ECOFISH) PROJECT COMPLETION REPORT

This publication was produced for review by the United States Agency for International Development by Tetra Tech, through USAID Contract No: AID-492-C-12-00008. This report was prepared by: Tetra Tech 159 Bank Street, Suite 300 Burlington, Vermont 05401 USA Telephone: (802) 658-3890 Fax: (802) 495-0282 E-Mail: [email protected] Tetra Tech Contacts: Nygiel Armada, Chief of Party Gina Green, Project Manager 159 Bank Street, Suite 300 P.O. Box 1397 Burlington, VT 05402 Tel: (802) 495-0282 Email: [email protected]
COVER PHOTO: © Joel Policarpio.
PHOTOGRAPHY CREDIT: Unless otherwise noted, all photos are property of the ECOFISH project.

ECOSYSTEMS IMPROVED FOR SUSTAINABLE FISHERIES (ECOFISH) PROJECT COMPLETION REPORT
JULY 2017
The author’s views expressed in this publication do not necessarily reflect the views of the United States Agency for International Development or the United States Government
ECOFISH COMPLETION REPORT 3

TABLE OF CONTENTS
ACRONYMS AND ABBREVIATIONS ...................................................................................................... III
EXECUTIVE SUMMARY ............................................................................................................................. VIII
1.0 INTRODUCTION AND PROJECT OVERVIEW ........................................................................... 1
1.2 PROJECT DESIGN AND OBJECTIVES .................................................................................. 2
1.3 KEY FOCUS AREAS AND INTERVENTIONS ..................................................................... 6
1.4 TIMELINE OF ECOFISH ACTIVITIES .................................................................................... 8
2.0 PROJECT RESULTS ............................................................................................................................ 10
2.1 DELIVERABLE 1: POLICY STUDIES ON EAFM, MPA, AND CLIMATE CHANGE .................................................................................................................................... 11
2.2 DELIVERABLE 2: TOOLKITS, SOURCEBOOKS, AND CASE STUDIES ON EAFM, MPA, AND CLIMATE CHANGE .................................................................... 15
2.3 DELIVERABLE 3: A NATIONAL DATABASE ON EAFM ESTABLISHED USING THE ANNUAL MONITORING DATA IN THE EIGHT MKBAS ................... 18
2.4 DELIVERABLE 4: STATE OF THE MARINE RESOURCES REPORT (SMRR) ......................................................................................................................................... 19
2.5 DELIVERABLE 5: NATIONAL, REGIONAL, AND MUNICIPAL EAFM TRAININGS CONDUCTED ................................................................................................. 21
2.6 DELIVERABLE 6: PUBLIC-PRIVATE PARTNERSHIPS SUPPORTING ECOFISH OBJECTIVES ESTABLISHED ............................................................................... 24
2.7 DELIVERABLE 7: BIO-PHYSICAL, SOCIAL, AND ECONOMIC BASELINE ASSESSMENTS OF THE EIGHT MKBAS ........................................................ 28
2.8 DELIVERABLE 8: SCIENTIFIC STUDIES ON SELECT MKBA-SPECIFIC FISH SPECIES ............................................................................................................................. 35
2.9 DELIVERABLE 9: MPA NETWORK ANALYSES IN THE EIGHT MKBAS .................. 40
2.10 DELIVERABLE 10: FISHERIES MANAGEMENT PLANS OF SELECT INTER-LGU ALLIANCES IN THE EIGHT MKBAS ........................................................... 44
2.11 DELIVERABLE 11: REGISTRY OF USERS OF MUNICIPAL FISHING WATERS ESTABLISHED IN SELECT MUNICIPAL LGUS IN THE EIGHT MKBAS ......................................................................................................................................... 51
ECOFISH COMPLETION REPORT i

2.12 DELIVERABLE 12: REVENUE GENERATION SYSTEM FOR FISHERIES MANAGEMENT ESTABLISHED AND EFFECTIVELY IMPLEMENTED IN SELECT LGUS ............................................................................................................................ 54
2.13 DELIVERABLE 13: SUSTAINABLE FINANCING PROGRAMS FOR EAFM IMPLEMENTED IN SELECT LGUS IN THE EIGHT MKBAS .............................. 57
2.14 DELIVERABLE 14: ADVANCED TRAININGS IN SPECIALIZED FISHERIES MANAGEMENT (SFM) INTERVENTIONS FOR IMPLEMENTATION/REPLICATION IN CORE GROUPS .............................................. 62
3.0 PROJECT PERFORMANCE .............................................................................................................. 68
3.1 HIGHLIGHTING KEY THEMATIC RESULTS .................................................................... 71
4.0 IMPACTS, SUSTAINABILITY, AND LESSONS LEARNED ....................................................... 77
4.1 PUBLIC-PRIVATE PARTNERSHIPS ...................................................................................... 78
4.2 SCIENTIFIC STUDIES .............................................................................................................. 78
4.3 ESTABLISHMENT OF MPAS AND NETWORKS OF MPAS ......................................... 78
4.4 INTER-LGU FISHERIES MANAGEMENT PLANNING ................................................... 79
4.5 MARINE SPATIAL PLANNING ............................................................................................. 79
4.6 RIGHT-SIZING OF FISHING EFFORT ................................................................................ 80
4.7 ADVANCED TRAININGS IN SPECIALIZED FISHERIES MANAGEMENT ................ 81
4.8 ECONOMIC INCENTIVES FOR SUSTAINABLE FISHERIES ......................................... 82
APPENDICES .................................................................................................................................................. 83
APPENDIX A. EAFM BENCHMARKING FOR LGUS IN THE ECOFISH MKBAS ......................................................................................................................................... 84
APPENDIX B. ADDITIONAL INFORMATION .......................................................................... 96
APPENDIX C. PUBLICATIONS AND REPORTS ..................................................................... 101
APPENDIX D. ECOFISH FINAL MONITORING REPORT OF KEY PROJECT RESULTS A AND B ................................................................................................................ 103
ECOFISH COMPLETION REPORT ii

ACRONYMS AND ABBREVIATIONS
700DALOY Smart Communications to Mainstream the Dedicated Alert Line for Ocean Biodiversity
AIM Asian Institute of Management
AMPA Adopt-a-Marine Protected Area
BFAR Department of Agriculture’s Bureau of Fisheries and Aquatic Resources
BISU Bohol Island State University
BoatR National System of Municipal Fishing Boat Registration
CBA Cost-Benefit Analysis
CCA Climate Change Adaptation
CFLC Community Fish Landing Center
CFRM Coastal and Fisheries Resources Management
CIG Calamianes Island Group
CMC Command Memorandum Circular
CNFIDP Comprehensive National Fisheries Industry Development Plan
CPUE Catch per Unit Effort
CRM Coastal Resource Management
CRMP Coastal Resource Management Project
CTI Coral Triangle Initiative
DALOY Dedicated Alert Line for Ocean Biodiversity
DB Danajon Bank
DDL USAID’s Development Data Library
DEC USAID’s Development Experience Clearinghouse
DENR Department of Environment and Natural Resources
DILG Department of Interior and Local Government
DOST Department of Science and Technology
ECOFISH COMPLETION REPORT iii

DPSIR Driver-Pressure-State-Impact-Response
DSWD Department of Social Work and Development
DTI Department of Trade and Industry
EAFM Ecosystem Approach to Fisheries Management
ECAN Environmentally Critical Areas Network
ECOFISH Ecosystems Improved for Sustainable Fisheries
EO Executive Order
EwE Ecopath with Ecosim
FACTS Foreign Assistance Coordination and Tracking System
FAO Fisheries Administrative Order
FARMC Fisheries and Aquatic Resources Management Council
FCRM Fisheries and Coastal Resource Management
FGD Focus Group Discussion
FISH Fisheries Improved for Sustainable Harvest
FishR National System of Municipal Fisherfolk Registration
FLE Fishery Law Enforcement
FLEMIS Fishery Law Enforcement Management Information System
FLEQRT Fishery Law Enforcement Quick Response Team
FOO Fisheries Office Order
GCM Growth Control and Maintenance
GIS Geographic Information System
Ha Hectare
HIPADA Hinatuan Passage Development Alliance
ICTO Information and Communication Technology Office
IEC Information Education and Communication
IFRM Integrated Fisheries Resource Management
IFRMP Integrated Fisheries Resource Management Plan
IMC Information Management Center
IRR Implementing Rules and Regulations
LB-SPR Murdoch University’s Length-Based Spawning Potential Ratio
ECOFISH COMPLETION REPORT iv

LG Lingayen Gulf
LGU Local Government Unit
LME Large Marine Ecosystem
LMP League of Municipalities of the Philippines
LOP Life of Project
MARINA Department of Transportation and Communications Maritime Industry Authority
MBI Market-Based Instrument
M-EAFM Mainstreaming Ecosystem Approach to Fisheries Management
MEAT Management Effectiveness Assessment Tool
MERF Marine Environment Resources Foundation
MKBA Marine Key Biodiversity Area
MMSU Mariano Marcos State University
MPA Marine Protected Area
MSN Marine Protected Area Support Network
MSP Marine Spatial Planning
MSU Mindanao State University
N National
NAMRIA National Mapping and Resource Information Administration
NAPC National Anti-Poverty Commission
NEDA National Economic Development Authority
NFI National Fisheries Institute
NFR Nongovernmental Organizations for Reform
NFRDI National Fisheries Research and Development Institute
NGO Nongovernmental Organization
NOAA National Oceanic and Atmospheric Administration
NPV Net Present Value
NSAP National Stock Assessment Program
P3 Public-Private Partnership
PACPI Philippine Association of Crab Producers, Inc.
PAMB Protected Area Management Bureau
ECOFISH COMPLETION REPORT v

PCA Philippine Coconut Authority
PES Payment for Ecosystem Services
PhP Philippine Peso
PIK Project Information Kit
PMP Performance Monitoring Plan
PNP Philippine National Police
PNP-MG Philippine National Police – Maritime Group
PO People’s Organization
PPP Public-Private Partnership
PSU Palawan State University
QRT Quick Response Team
RTD Roundtable Discussion
SA Sulu Archipelago
SAF Special Activities Fund
SCTR State of the Coral Triangle Report
SDN Surigao del Norte
SDR Social Discount Rates
SEAFDEC Southeast Asian Fisheries Development Center
SEAT Socioeconomic Assessment Tool
SFM Specialized Fisheries Management
SMRR State of the Marine Resources Report
SMS Short Message Service
SN South Negros
SNCDMC South Negros Coastal Development Management Council
SoPCA Sorsogon Pacific Coast Alliance
STCR State of the Coral Triangle Report
TP-LG-SBS Ticao Pass – Lagonoy Gulf – San Bernardino Strait
TWG Technical Working Group
UPMSI University of the Philippines Marine Science Institute
UPVFI University of the Philippines Visayas Foundation, Inc.
ECOFISH COMPLETION REPORT vi

USAID United States Agency for International Development
USG United States Government
VA Vulnerability Assessment
VCA Value Chain Analysis
VIP Verde Island Passage
VIIRS Visible Infrared Imaging Radiometer Suite (NOAA)
VSU Visayan State University
WTP Willingness to Pay
WWF World Wildlife Fund for Nature
ECOFISH COMPLETION REPORT vii

EXECUTIVE SUMMARY
A fish landing in Calatagan, Batangas. A 22-day ban on fishing was imposed by the Local Government Units around Balayan Bay coinciding with the pelagic fishes’ peak spawning period. This seasonal closure was a result of a study conducted by the Ecosystems Improved for Sustainable Fisheries (ECOFISH) project with Conservation International and local partners.
ECOFISH COMPLETION REPORT viii

Ecosystems Improved for Sustainable Fisheries, or ECOFISH, is a flagship project of the United States Agency for International Development (USAID) with the Philippines Department of Agriculture’s Bureau of Fisheries and Aquatic Resources (BFAR) and with local governments in eight Marine Key Biodiversity Areas (MKBA) in the Philippines. The overall objective of ECOFISH was to conserve marine biodiversity by improving the management of coastal and marine resources and associated ecosystems that support the local economies of eight MKBAs. ECOFISH built on the pioneering success of previous USAID-supported programs in the country, the community’s and local government’s efforts of protecting costal habitats fostered by the Coastal Resources Management Project (CRMP, 1996–2003), and the alliance of local government unit’s efforts to manage fisheries resources and conserve biological diversity advocated by the Fisheries Improved for Sustainable Harvest (FISH, 2003–2010) project.
ECOFISH further raised the bar by expanding the habitat and fisheries management efforts to ecologically meaningful scales with a conscious effort of ensuring that benefits from fisheries are equitably shared by the resource users. It did this by promoting Ecosystem Approach to Fisheries Management (EAFM) as the foundation and capitalized on the strength of participatory, decentralized, multi-sectoral approach that the Philippines has practiced for decades. EAFM and its guiding principles enabled the project to focus on well-defined management initiatives intended to strike a balance between ecological well-being and human well-being. ECOFISH, through its partners, made all conscious efforts in applying these EAFM principles into practice to achieve tangible and measurable results.
The project surpassed its key results targets and achieved 24 percent increase in fisheries biomass and 12 percent increase in employment or better employment over a five-year period of implementation. It contributed significantly to the national capacity development program to enhance Local Government Units (LGUs) capacity to apply EAFM. This lead to the improved management of over 1.8 million hectares of municipal marine waters in the project sites.
In the process, ECOFISH developed and leveraged several high-level partnerships with the country’s leading technology, telecommunications, and law enforcement institutions, setting up platforms that boosted institutional capacities for fisheries management—specifically, fisherfolk registration and fishery law enforcement. The partnership forged by the project between the Department of Science and Technology (DOST) and Microsoft to roll out the TV White Space pilot to support fisherfolk registration in the Danajon Reef demonstrated the potential of technology to serve as a powerful tool to execute fisheries management strategies and reach out to stakeholders more effectively. Another major partnership brokered by the project between the Philippine National Police – Maritime Group (PNP-MG) and Smart Communications to mainstream the Dedicated Alert Line for Ocean Biodiversity, or 700DALOY (later DALOY3456), an SMS platform to report coastal and fisheries violations anonymously, showed that a simple technology can be a tool to improve environmental governance. These partnerships contributed significantly to the project’s success in attaining its biodiversity goals.
The success of the TV White Space pilot, together with the lessons learned by partners on the potential scope and use of TV White Space for public services, encouraged the DOST- Information and Communication Technology Office to model its National Free WiFi program after the pilot, with TV White Space being utilized as a last-mile connectivity solution for all rural areas in the country. In June 2017, Microsoft announced that it will use TV White Space to connect two million people to broadband in rural America by 2022 using the same technology and spectrum developed for the ECOFISH project. Smart Communications’ continued support to PNP-MG’s DALOY3456 further enhanced its coverage across a wider section of the country, accommodated other telecommunication service providers, and
ECOFISH COMPLETION REPORT ix

developed additional intelligence analytics to make coastal and fisheries violations predictable and therefore preventable.
Catalyst of Change. ECOFISH helped build the capacity of government partners at both the national and local levels, and facilitated increased stakeholder participation in EAFM. National agencies worked with LGUs to adopt and implement EAFM plans to reduce fishing pressure and improve enforcement of coastal laws and fisheries management policies. These plans catalyzed management action to increase fisheries biomass and conserve marine biodiversity in the eight MKBAs. With an improved resource base, fishing communities now have more options for diversified income sources including sustainable fisheries livelihoods and alternative conservation enterprises. The success of the ECOFISH partners bodes well for the expanded improvement of fisheries by national and local governmental agencies throughout the Philippines.
Adopting Theory of Change. ECOFISH benefitted from the introduction of the Theory of Change as another lens that helped the project refined its strategies and activities (Figure 1). It helped the project team dissect its results framework, implementation strategy, and analytical tools to make the key results more relevant by providing links through development of evaluation questions. Coupled with the recommendations from the Midterm Performance Evaluation, ECOFISH refined its approach and refocused its investment.
FIGURE 1. RESULTS CHAIN OF ECOFISH PROJECT
Governance. Among the challenges that ECOFISH faced in implementing EAFM was the complexity of multiple stakeholders, each with overlapping governance responsibilities. ECOFISH conducted detailed examinations of local conditions and applied fisheries science to establish governance baselines and benchmarks in each MKBA. From these baselines and benchmarks, ECOFISH developed governance trainings that were responsive to an ecosystem approach and covered the boundary, scale, and scope of the fisheries systems. ECOFISH strengthened ecosystem-wide management planning and implementation processes through inter-LGU alliances. The project strengthened the Bay-Wide Management Councils or Alliances of Clusters of Municipalities. The inter-LGU fisheries management plans served as the road map for the inter-LGU alliances in the implementation of MKBA-wide fisheries management.
During project implementation, LGUs were provided assistance in conducting regular governance benchmarking to track progress in building capacity for various elements of EAFM. Compared to the
ECOFISH COMPLETION REPORT x

baseline assessment conducted in Year 1 of project implementation, the EAFM benchmark levels for the 3 LGUs monitored improved by Year 5. Benchmark level 3 practically doubled in Year 5 while benchmark level 1 decreased by more than 30 percent.
Resilience. Resilience is key to ecological well-being. The ability of marine ecosystems to recover from overfishing and natural disasters within the management of an EAFM framework ensures the sustainability of the fishing community. Resilience is linked to conserving biodiversity, even if fisheries productivity does not increase significantly. In Danajon and Coron, which were hit by natural calamities, fishing communities were able to rebound quickly through targeted and coordinated efforts by the BFAR, LGUs, nongovernmental organizations (NGOs), and ECOFISH. Overall, ECOFISH achieved a 24 percent increase in fisheries biomass across the eight MKBAs.
Local Support for Ecological Well-Being. The successful Adopt-a-Marine Protected Area (AMPA) Project of the PNG-MG linked the PNG-MG with LGUs and local stakeholders to increase visibility and enforcement actions in the areas of the MPAs. ECOFISH worked with the PNP-MG to strengthen the AMPA Project and develop a monitoring and reporting system for assessing its effectiveness. Over the course of the project, ECOFISH developed a novel approach of valuing resources by linking the Marine Spatial Planning (MSP) interventions to an area-based valuation. MSP delineated the different zones and this is how their economic values were determined and accepted by the LGUs.
Spotlighting Human Well-Being. One important lesson learned from ECOFISH’s predecessor, the FISH project, is that increasing fish stocks though management interventions is doable but does not necessarily benefit small-scale fishers and their family. This realization served as guidance in the design of ECOFISH and the inherent human well-being focus of its interventions. ECOFISH developed a variety of market-based initiatives to strengthen economic opportunities in the MKBAs. This resulted in an increase in people gaining employment or better employment from sustainable fisheries. Key project interventions such as the reallocation of fishing efforts through right-sizing complemented the efforts to address equity and human well-being issues.
Public-Private Partnerships. ECOFISH can be credited for establishing and implementing a series of innovative technology partnerships supporting EAFM, which enabled the project to achieve economic and biodiversity conservation goals through hard work, consensus building, and political will. Across the flagship technology partnerships of ECOFISH, most notably the TV White Space and DALOY3456 partnerships, connectivity and technology platforms were adopted as tools to bridge and facilitate human capacities. While these tools increased the sophistication and efficiency of partners and improved performance from public and community partners, success ultimately depended on the human element as well as the partners’ capacity to harness such technologies successfully toward specific goals.
Engaging Peoples Organizations. The ECOFISH approach focused on assessing and building the capacity of people’s organizations to capitalize on and expand their vision of worthwhile and lucrative initiatives, balanced with the project’s goal to support EAFM and the government’s goal of reducing poverty. ECOFISH comprehensively engaged local communities and trained members to be leaders of
“ECOFISH is our flagships program that promotes robust partnerships with BFAR, local governments in the eight MKBAs areas helped to catalyze effective fisheries management and governance actions. The results of these partnerships contributed to the growing body of evidence that bio-diversity conservation is critical to improving human well-being and achieving sustainable inclusive development.”
— Dr. Susan Brems, Mission Director USAID. The Philippines
ECOFISH COMPLETION REPORT xi
their own internal management processes, while taking responsibility for aligning their activities with community visions and missions. The results included the communities comprehensively taking ownership of external projects that will endure beyond the lifetime of ECOFISH.
Balancing Ecological and Human Well-Being. ECOFISH showed that EAFM improved the health of the marine ecosystems and local communities within the eight target MKBAs. National policies expanded the impact of ECOFISH beyond the eight MKBAs and BFAR shifted its focus on fisheries policy to balance fisheries production with social equity. PNP-MG similarly shifted its focus from police work consisting largely of enforcement, to becoming ecosystem stewards. These government reforms are a strong foundation for improving marine biodiversity and boosting the resilience of natural and human ecosystems. The engagement of local communities, private sector businesses, scientific communities, and local and national governments in a coordinated approach improved fisheries management to the benefit of all.
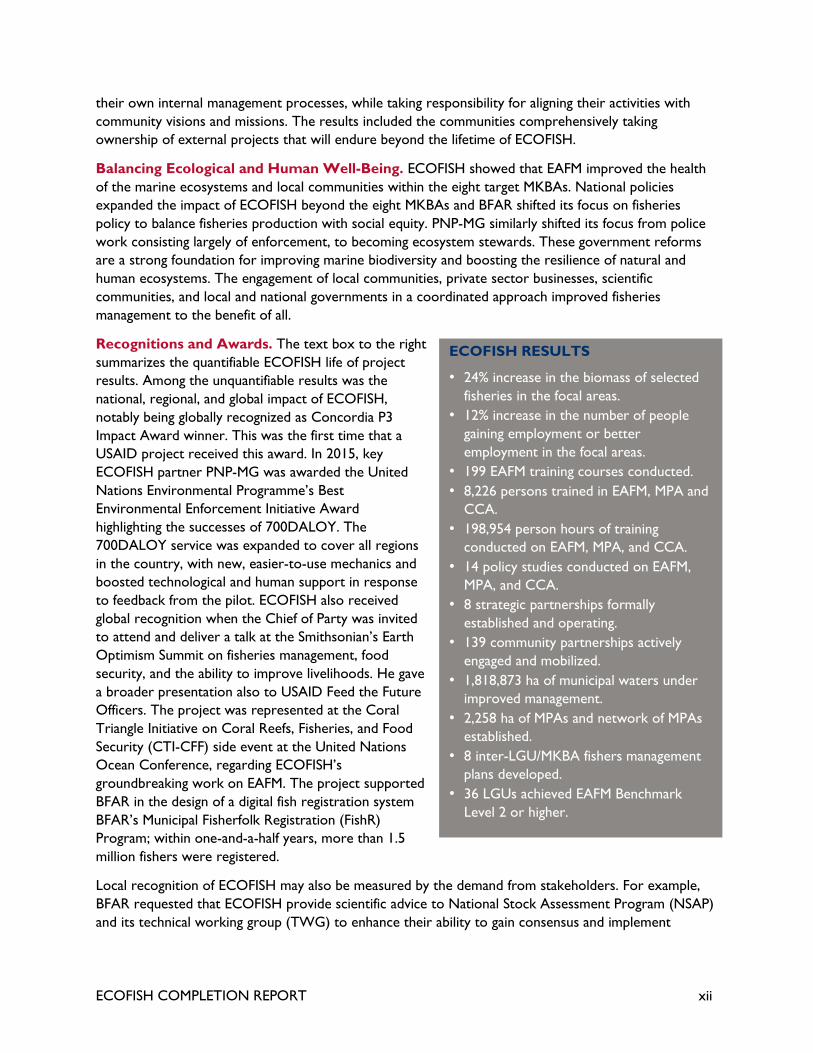
Recognitions and Awards. The text box to the right summarizes the quantifiable ECOFISH life of project results. Among the unquantifiable results was the national, regional, and global impact of ECOFISH, notably being globally recognized as Concordia P3 Impact Award winner. This was the first time that a USAID project received this award. In 2015, key ECOFISH partner PNP-MG was awarded the United Nations Environmental Programme’s Best Environmental Enforcement Initiative Award highlighting the successes of 700DALOY. The 700DALOY service was expanded to cover all regions in the country, with new, easier-to-use mechanics and boosted technological and human support in response to feedback from the pilot. ECOFISH also received global recognition when the Chief of Party was invited to attend and deliver a talk at the Smithsonian’s Earth Optimism Summit on fisheries management, food security, and the ability to improve livelihoods. He gave a broader presentation also to USAID Feed the Future Officers. The project was represented at the Coral Triangle Initiative on Coral Reefs, Fisheries, and Food Security (CTI-CFF) side event at the United Nations Ocean Conference, regarding ECOFISH’s groundbreaking work on EAFM. The project supported BFAR in the design of a digital fish registration system BFAR’s Municipal Fisherfolk Registration (FishR) Program; within one-and-a-half years, more than 1.5 million fishers were registered.
Local recognition of ECOFISH may also be measured by the demand from stakeholders. For example, BFAR requested that ECOFISH provide scientific advice to National Stock Assessment Program (NSAP) and its technical working group (TWG) to enhance their ability to gain consensus and implement
ECOFISH RESULTS
• 24% increase in the biomass of selected fisheries in the focal areas.
• 12% increase in the number of people gaining employment or better employment in the focal areas.
• 199 EAFM training courses conducted. • 8,226 persons trained in EAFM, MPA and
CCA. • 198,954 person hours of training
conducted on EAFM, MPA, and CCA. • 14 policy studies conducted on EAFM,
MPA, and CCA. • 8 strategic partnerships formally
established and operating. • 139 community partnerships actively
engaged and mobilized. • 1,818,873 ha of municipal waters under
improved management. • 2,258 ha of MPAs and network of MPAs
established. • 8 inter-LGU/MKBA fishers management
plans developed. • 36 LGUs achieved EAFM Benchmark
Level 2 or higher.
ECOFISH COMPLETION REPORT xii

seasonal closure for flagship species such as round scad (Decapterus spp.) fisheries in Palawan. These are just a few examples of the impact ECOFISH had on the Philippines and elsewhere.
Appropriate Use of Science. One important aspect of the implementation of ECOFISH was how the project team used science along with simple to complex tools to engage key partners and stakeholders to develop or improve existing fisheries management interventions. Trophic system modeling using Ecopath with Ecosim (EwE) software informed partners and stakeholders in an iterative process to decide and agree on the appropriate or right-size of fishing effort. Results of hydrodynamic studies, dispersal models, and fish plankton surveys served as vital inputs to determining the ideal location of individual MPAs and reconfigure MPAs to improve the ecological functioning of MPA networks. Geographic Information System (GIS) tools combined with citizen science were used to improve MPA and MPA network designs and develop zoning schemes for fisheries uses within the project areas. Web-based technologies such as Murdoch University’s length-based spawning potential ratio (LB-SPR) and the National Oceanic and Atmospheric Administration (NOAA)’s Visible Infrared Imaging Radiometer Suite (VIIRS) were used to inform the development of fisheries management interventions. The project initiated the use of economic indicators to determine MPA effectiveness through its socio-economic assessment tool (SEAT). The project made practical use of forensic science, analytical tools, and scenario planning in building capacity of BFAR’s fishery law enforcement teams and local enforcement team in the project sites.
Right-Sizing of Fishing Effort. One of the most ambitious initiatives of ECOFISH was the project’s attempt to optimize the productivity of marine ecosystems, through the re-allocation of fishing effort among the users. The objective was to determine and agree on the “right-size” of fishing effort that can be sustained by the marine ecosystem that supports the fisheries at the same time provides adequate fish catches for the local fishing communities. Trophic systems modeling using the EwE software was used by the project to investigate the potential impacts of various fisheries harvest scenarios and, ultimately, guide partners and stakeholders to decide and agree on the appropriate configuration of fishing effort. ECOFISH worked with local partners within each MKBA to reach a consensus on the ecological and socio-economic management objectives. With the agreed MKBA-wide targets as the basis, the LGUs were then able to set their own gear limits through facilitated gear trading and negotiation workshops. Gear limits were continuously worked out by the ECOFISH team with LGUs to serve as bases for the limited issuance of fisheries licenses in the LGU’s respective MKBAs. This represented the first ever effort-based fisheries license control intervention in the world. ECOFISH’s right-sizing of fishing effort is a non-prescriptive application of science which primarily capitalized on the strength of participatory and multi-sectoral approach. Being highly participatory, the team and stakeholders realized that the approach is a practical vehicle to strike a balance between ecological and human well-being that EAFM is trying to achieve. Right-sizing is one of the most effective fisheries management tools that should be applied to the future of fisheries management in the country and throughout the region.
ECOFISH COMPLETION REPORT xiii

1.0 INTRODUCTION AND PROJECT OVERVIEW
Against the backdrop of the famous “Bud Bongao,” or Bongao Peak in Tawi-Tawi Island. ECOFISH provided technical assistance to the Barangay and Municipal LGUs of Tawi-Tawi, Panglima Sugala, and Simunul for the establishment and management of marine protected areas.
ECOFISH COMPLETION REPORT 1

This Completion Report documents the activities and interventions conducted during the five years of Ecosystems Improved for Sustainable Fisheries (ECOFISH) Project implementation. The United States Agency for International Development (USAID) awarded Tetra Tech ARD (now Tetra Tech) the ECOFISH contract (number AID-492-C-12-00008) on June 29, 2012. This project was designed to provide technical assistance to the Government of the Philippines through the Department of Agriculture’s Bureau of Fisheries and Aquatic Resources (BFAR). Tetra Tech implemented the project in partnership with selected local government units (LGUs).
1.2 PROJECT DESIGN AND OBJECTIVES
The ECOFISH project was designed in line with the U.S. Country Assistance Strategy directed at reducing threats to biodiversity and improving natural resources and environment. It contributed to achieving Development Objective 3: Environmental Resilience Improved, particularly Intermediate Result 3.2: Natural Resources and Environmental Management Improved of the USAID/Philippines Country Development Cooperation Strategy (2012–2016) Results Framework. In addition, ECOFISH was created to contribute to priority goals and actions laid out in the Philippines Development Plan (2011–2016), particularly Chapters 4 (Competitive and Sustainable Agriculture and Fisheries) and 10 (Protection, Conservation, and Rehabilitation of Environment and Natural Resources).
The main objective of the ECOFISH project was to improve the management of important coastal and marine resources and associated ecosystems that support local economies. It sought to achieve this by promoting fishing sector reforms and improving sustainable growth and profitability of fisheries. The project carried out these objectives through the application of the ecosystems approach to fisheries management (EAFM) in larger marine conservation areas and involving clusters of LGUs.
ECOFISH activities centered on eight Marine Key Biodiversity Areas (MKBAs) within the Philippines (see Figure 1.1, next page): (1) Lingayen Gulf, (2) Calamianes Group of Islands, (3) Danajon Reef, (4) South Negros Islands, (5) Sulu Archipelago, (6) Surigao del Sur and Surigao del Norte, (7) Verde Island Passage, and (8) Ticao Pass – Lagonoy Gulf – San Bernardino Strait. These MKBAs represent the country’s eight marine bio-regions, and USAID selected them as project sites because of their extreme need for marine biodiversity conservation. These marine ecosystem hotspots mirror the issues that affect capture fisheries both at the local and national levels in the Philippines, namely:
• Loss of marine biodiversity;
• Declining fish stocks;
• High population growth;
• Limited private sector investment; • Inconsistent policies and programs for sustainable fisheries; and
• Weak institutional and stakeholder capacity to plan and implement fisheries management.
Although the majority of project activities cut across the eight MKBAs, implementation strategies and levels of engagement differed from place to place due to each area’s unique ecosystem features and the opportunities and threats therein (see Table 1.1, page 4).
ECOFISH COMPLETION REPORT 2

FIGURE 1.1. THE EIGHT MARINE KEY BIODIVERSITY AREAS OF ECOFISH
ECOFISH COMPLETION REPORT 3

TABLE 1.1. SUMMARY OF ECOSYSTEM FEATURES, OPPORTUNITIES, AND THREATS IN THE EIGHT ECOFISH MKBAS
MKBA Ecosystem Features Opportunities Threats
1. Lingayen Gulf
• Extensive coral reef, seagrass, and soft bottom community supporting the rich fishing ground
• Ability of the project team to identify specific protection and management interventions from long-term fisheries data sets
• Potential to leverage high awareness of environmental issues due to past programs to implement EAFM activities
• Severe overfishing and poor water quality in mariculture areas, resulting in fish kills
• Lack of inter-LGU alliances
2. Calamianes Group of Islands
• Contains 70 percent of the coral and seagrass species recorded in the Philippines
• Focus on Marine Protected Area (MPA) management to support ecotourism and economic alternatives
• Coral Triangle Initiative (CTI) demonstration site with potential for collaboration
• Destructive fishing and uncontrolled live fish trade
• Inter-LGU alliance activities reduced due to presence of one weak LGU
3. Danajon Reef • One of only three
double barrier reefs in the Indo-Pacific region
• Strong provincial and municipal buy-in of Coastal Resource Management (CRM) programs to further EAFM goals
• Strong LGU alliances
• High fish demand leading to high fishing pressure and illegal fishing.
4. South Negros Island
• Deep water harbors • Large and small
pelagic fishes
• Long history of community-based MPAs upon which to begin formalizing and developing EAFM activities
• No comprehensive assessment of capture fisheries
• Lack of inter-LGU alliances
5. Sulu Archipelago
• Rich ecosystem with massive network of coral reefs, seagrass beds, and mangroves
• CTI demonstration site with potential for collaboration
• Potential for capacity building due to increasing awareness of coastal and fisheries resource management
• Still weak management and law enforcement and lack of formal inter-LGU alliance agreements
• Unsustained support from some local governments
6. Surigao del Sur and Surigao del Norte
• Extensive deep water and shallow water coral reef, seagrass, and soft bottom resources
• Strong inter-LGU alliances to leverage and increase fisheries interventions
• Upland erosion and siltation from mine tailings of nearshore impacting on habitats
7. Verde Island Passage
• Considered the “center of the center” of the world’s fish diversity
• Long-term marine conservation initiatives by NGOs
• CTI demonstration site
• Encroachment of commercial vessels
• Use of cyanide in aquarium fish collection
ECOFISH COMPLETION REPORT 4

MKBA Ecosystem Features Opportunities Threats
8. Ticao Pass – Lagonoy Gulf – San Bernardino Strait
• Diverse small pelagic resources
• Important dolphin, dugong, and whale shark habitat
• Long-term data for Lagonoy Gulf and Sorsogon Bay to help identify specific interventions
• Active university involvement with potential for participation in project activities and development of employment from growing marine ecotourism sector
• Steep declines in fish stocks
• Encroachment of commercial vessels
• Complex marine ecosystem
• Lack of inter-LGU alliances
The ECOFISH project was designed around 14 deliverables (see Table 1.2) and six key results:
A. An average of 10 percent increase in fisheries biomass across the eight MKBAs; B. A 10 percent increase in the number of people gaining employment or better employment from
sustainable fisheries management from a baseline established at the start of the Project; C. Establishment of a national capacity development program to enhance the capacities of LGUs and
relevant national agencies to apply ecosystem-based approaches to fisheries management; D. Eight public-private partnerships supporting the objectives of the ECOFISH project created and
operating; E. One million hectares of municipal marine waters under improved management; and F. A core of 30 LGUs across the eight MKBAs with improved capacity for implementing the
ecosystem-approach to fisheries management.
Table 1.2 demonstrates how the project’s deliverables align with the above results. Deliverables leading to Results C and D served as foundational project activities, while those leading to Results E and F drove the implementation of project activities with local partners at the MKBA level. Taken together, these deliverables attained the overall ECOFISH Results A and B.
TABLE 1.2. MAIN RELATIONSHIP BETWEEN PROJECT DELIVERABLES AND KEY RESULTS
Tasks Deliverables Results Final Project Outcomes:
Result A. An average of 10 percent increase in fisheries biomass across the eight MKBAs Result B. A 10 percent increase in the number of people gaining employment or better employment from sustainable fisheries management from a baseline established at the start of the project Task 1. Establish and Implement a National Training Program TASK 2. Provide Technical and Advisory Support at the National Level Task 3. Create Public-Private Partnerships
Deliverable 1. Policy Studies on EAFM, MPA, and Climate Change Deliverable 2: Toolkits, Sourcebooks, and Case Studies on EAFM, MPA, and Climate Change Deliverable 3: A National Database on EAFM Established Using the Annual Monitoring Data in the 8 MKBAs Deliverable 4: State of the Marine Resources Report Deliverable 5: National, Regional, and Municipal EAFM Trainings Conducted Deliverable 6: Public-Private Partnerships Supporting ECOFISH Objectives Established
Result C. Establishment of a national capacity development program to enhance the capacities of LGUs and relevant national agencies to apply ecosystem-approach to fisheries management Result D. Eight public-private partnerships supporting the objectives of the ECOFISH project created and operating
Build Foundation
ECOFISH COMPLETION REPORT 5

Tasks Deliverables Results Task 4. Provide Technical and Advisory Support at the Local Level Task 5. Develop a Registry of Users of Municipal Fishing Waters Task 6. Identify and Implement Sustainable Financing Programs to Support EAFM Projects Task 7. Establish a Baseline on Coastal and Marine Resources and Relevant Socio-Economic Information, Develop and Apply Metrics on Monitoring EAFM Implementation in Target MKBAs
Deliverable 7: Bio-Physical, Social, and Economic Baseline Assessments of the 8 MKBAs Deliverable 8: Scientific Studies on Select MKBA-Specific Fish Species Deliverable 9: MPA Network Analyses in the 8 MKBAs Deliverable 10: Fisheries Management Plans of Select Inter-LGU Alliances in the 8 MKBAs Deliverable 11: Registry of Users of Municipal Fishing Waters Established in Select Municipal LGUs in the 8 MKBAs Deliverable 12: Revenue Generation System for Fisheries Management Established and Effectively Implemented in Select LGUs Deliverable 13: Sustainable Financing Programs for EAFM Implemented in Select LGUs in the 8 MKBAs DELIVERABLE 14: Advanced Trainings In Specialized Fisheries Management For Inter-LGU Alliance
Result E. One million hectares of municipal marine waters under improved management Result F. A core of 30 LGUs across the eight MKBAs with improved capacity for implementing ecosystem-approach to fisheries management
Implem
ent Best P
ractices
1.3 KEY FOCUS AREAS AND INTERVENTIONS
The ECOFISH project sought to build on the many successful elements of the Fisheries Improved for Sustainable Harvest (FISH) Project (2003–2010). The lessons learned from the FISH project provided a solid foundation upon which to build meaningful partnerships, and the need to create awareness and apply an EAFM. ECOFISH’s objectives, however, were much more ambitious and broader in scope than those of its predecessor. It required the implementing team to expand the sites for the application of EAFM and simultaneously institutionalize EAFM at the national and regional levels through innovative approaches and partnerships.
ECOFISH provided technical assistance to local governments to set in place a suite of interventions to enable stakeholders to manage their coastal and fisheries resources following an ecosystem approach. These included:
• Rehabilitation of fishery resources-enhancing initiatives; • Restoration and/or protection of coastal resources through MPA networks; • Management of species and fishing gear; • Zoning of fisheries and other coastal uses; • Right-sizing of fishing efforts; • Inter-LGU fisheries management planning; • Establishment of revenue generation and collection mechanisms such as fees and fines for coastal
resource use; • Development of conservation based social enterprises together with business planning and plans; • Translation of MKBA Integrated Fisheries Resource Management (IFRM) plans into business plans;
and • Valuation of MPAs to local communities to gain their commitment to support marine biodiversity.
ECOFISH COMPLETION REPORT 6

ECOFISH focused much of its efforts on livelihood and socioeconomic initiatives to address overfishing and poverty-related threats as well as increasing public and private financial resources that will contribute to better management of fisheries in the MKBAs. The strategy was to start the initiative in the focal area (management unit) and ultimately scale up fisheries management to the MKBAs.
During the first quarter of Year 2, two major disasters struck the Philippines. A magnitude 7.2 earthquake with its epicenter near the Danajon Bank MKBA struck the central Philippines in October 2013; in November 2013, super typhoon Haiyan/Yolanda hit Samar, Leyte, northern Cebu, and the Calamianes Islands. ECOFISH put a number of planned activities on hold in the two affected MKBAs and responded immediately with relief and rehabilitation efforts. The project continued to implement key interventions in the majority of its sites as well as provide relief efforts to the sites and communities struck by the disasters. The team worked tirelessly to catch up on lost time and continued to support those communities severely impacted.
The project team worked with a broad array of stakeholders to identify focal and expansion areas within the MKBAs, and to tailor types and timing of project activities to suit the need of each area. ECOFISH interventions began in focal areas identified in each MKBA at the start of the project, and spread over time through expansion and replication areas (see Appendix Table B-1). In some cases, ECOFISH identified and chose to strengthen former FISH focal areas. The project then expanded its reach by working directly with municipalities adjacent to the focal areas; these municipalities became the expansion areas. Project interventions were replicated in other municipalities in the MKBAs by assisting provincial governments in each MKBA, the regional offices of BFAR, and other partners.
As the project progressed through its five years of implementation, the significant interventions are stated below:
Start-Up (Year 1)
• Mobilize project resources and formalize engagement with implementation partners. • Develop Life of Project Work Plan, Year 1 Work Plan, and Performance Monitoring Plan. • Standardize data collection and conduct baseline assessment. • Develop institutional arrangements with stakeholder groups in each MKBA. • Initiate early fisheries management actions in each MKBA. • Commence policy reviews and initiate collaborative arrangements for national policy improvements.
Implementation (Years 2–4)
• Develop constituency-building strategies and roll out national and local constituency-building initiatives.
• Put in place interventions that will serve as building blocks of the outcomes of the project as well as directly influence the achievement of these outcomes—namely, an average of 10 percent increase in fisheries biomass and a 10 percent increase in the number of people gaining employment or better employment from sustainable fisheries management.
• Use baseline assessment results as inputs to fisheries management and socioeconomic interventions. • Establish and strengthen individual MPAs and networks of MPAs. • Assist BFAR in the establishment and implementation of National System on Fisherfolk Registration
(FishR) and National System on Municipal Fishing Boat Registration (BoatR). • Support BFAR in enhancing its capacity to store, retrieve and analyze data from FishR, BoatR, and
other related database systems.
ECOFISH COMPLETION REPORT 7

• Support LGUs in their implementation of FishR and BoatR. • Implemented Theory of Change Workshop and Developed Results Chain. • Accelerate the establishment of community partnership. • Develop the Municipal Fisheries Management Toolkit series. • Institute market-based financing instruments. • Focus on inter-LGU interventions on fisheries management. • Develop the Municipal Fisheries Management Start-Up Guide. • Integrate communication strategies into key interventions and expected results for sharing with a
bigger and broader audience. • Focus on interventions at both the inter-LGU level and at the individual LGU level that will improve
or trigger the improvement of their individual LGU benchmarks. • Develop MPA network designs that incorporate ecological principles and mitigation of impacts of
threats. • Accelerate the establishment of community partnerships and develop strategies for their
sustainability and maintenance. • Focus on control mechanisms for the management of important fish stocks and increase accuracy of
monitoring to ensure the achievement of Project Key Result A as recommended by the Midterm Performance Evaluation Report.
Close-Out (Year 5)
• Accelerate and expand enterprise development initiatives to ensure the achievement of Project Key Result B as recommended by the Midterm Performance Evaluation Report.
• Craft site-level policies that will promote site-level fisheries management interventions, particularly the establishment of market-based financing instruments and revenue generation mechanisms.
• Conduct advanced training on specialized fisheries management for Inter-LGU alliances to ensure the achievement of Project Key Results and sustain management interventions.
• Focus on the right-sizing of fishing effort to inform the registration and licensing policies of the LGUs in the MKBAs.
• Communicate the biodiversity messages generated by the project, integrate communication strategies into key interventions and expected results, and share with a bigger and broader audience.
• Fast track activities for the translation of IFRM plan into business plans. • Roll out the Mainstreaming EAFM Training of Trainers and EAFM Planning in two MKBAs.
1.4 TIMELINE OF ECOFISH ACTIVITIES
Figure 1.2 (next page) summarizes the general calendar of ECOFISH activities and interventions for the life of project.
ECOFISH COMPLETION REPORT 8

FIGURE 1.2. GENERAL CALENDAR OF ECOFISH ACTIVITIES AND INTERVENTIONS FOR THE ENTIRE LIFE OF PROJECT
ECOFISH COMPLETION REPORT 9

2.0 PROJECT RESULTS
The Bureau of Fisheries and Aquatic Resources is continuously increasing its capacity to enforce fishery laws in the country. It has acquired new monitoring control and surveillance boats and created a Quick Response Team (QRT) in the field. ECOFISH developed and conducted training courses to enhance the knowledge and capacity of the QRT members to enforce the fishery laws effectively.
ECOFISH COMPLETION REPORT 10

Overall, ECOFISH greatly exceeded its targets. Below we provide descriptions of key activities and accomplishments achieved for each of the project’s 14 deliverables, including key team members and partners.
2.1 DELIVERABLE 1: POLICY STUDIES ON EAFM, MPA, AND CLIMATE CHANGE
ECOFISH focused project policy support and capacity building in order to lay a foundation with government partners (specifically, BFAR) at national, regional, and provincial levels. Partners also included LGUs in the eight MKBAs. This approach ensured that project activities and outputs were aligned with partner priorities that contributed significantly to national and local efforts to implement EAFM.
While the original plan was to spread policy work over four years of the project, ECOFISH accelerated this technical assistance, especially at the national level, to set the implementation framework for
the rest of the project interventions. For example, the project worked to establish the national policies on fisherfolk, boat, and gear registration, which enabled LGUs to conduct registration in their areas (an LGU mandate that had remained dormant since establishment of the Fisheries Code in 1998).
TABLE 2.1. DELIVERABLE 1 – POLICY STUDIES ON EAFM, MPA, AND CLIMATE CHANGE
Project Intervention/Activity Target (Scale) Accomplished
Conduct studies on EAFM policies and policy implementation in providing an enabling environment for EAFM
2 (National) 8
Conduct policy forums with relevant stakeholder groups 5 (National/ Regional)
12
Conduct policy studies to integrate CTI themes (EAFM, MPAs, and climate change adaptation [CCA]) into existing policy instruments
3 (National) 4
Conduct policy studies on revenue generation, sustainable financing, and public-private partnerships (PPPs) to support sustainable fisheries management
3 (National) 3
Team Lead: Senior Governance and Institutional Development Specialist, Chief of Party Key Partners: BFAR, Department of Environment and Natural Resources (DENR), Department of Interior and Local Government (DILG), National Economic Development Authority (NEDA), Department of Trade and
Michael Klecheski (center), Deputy Chief of Mission of the US Embassy Manila, joined DA Secretary Proceso Alcala, former Department of Environment and Natural Resources Secretary Angel Alcala, Senator Cynthia Villar, DA Undersecretary Asis Perez, and more than 500 representatives of the fishing industry, LGUs, and civil society in pledging support for the implementation of the updated Comprehensive National Fisheries Industry Development Plan (2016–2020).
ECOFISH COMPLETION REPORT 11

Project Intervention/Activity Target (Scale) Accomplished
Industry (DTI), League of Municipalities of the Philippines (LMP), Nongovernmental Organizations for Reform (NFR)
KEY ACTIVITIES/ACCOMPLISHMENTS
The policies and programs that ECOFISH and BFAR designed together had national scope and significance (despite the project working in only eight sites) because many project-initiated policies were to be implemented throughout the country. A number of these policy interventions were crucial in laying the foundation of the design and implementation of subsequent programs. The BFAR-generated fisherfolk and boat registration data collected in ECOFISH sites formed the basis of initiatives to enhance equitable livelihood opportunities and right-size fishing efforts. ECOFISH also worked with the Philippine National Police – Maritime Group (PNP-MG) on nationwide programs, such as the Adopt-a-Marine Protected Area (AMPA) and Dedicated Alert Line for Ocean Biodiversity (DALOY) programs.
Consultations with BFAR and key stakeholders in Year 1 led to identification of the following policy priorities: municipal fisherfolk registration, commercial boat registration, capacity building frameworks for LGU fishery personnel and law enforcement, livelihood support for municipal fisherfolk, and a national framework for closed seasons. ECOFISH closely monitored other opportunities for policy support relevant to EAFM in BFAR, the Department of Environment and Natural Resources (DENR), the PNP-MG, and other agencies involved in the protection of marine biodiversity and fisheries. While ECOFISH’s target was to complete eight policy studies during the life of the project, the project completed fifteen.
ECOFISH provided policy assistance to BFAR to prepare the National System of Municipal Fisherfolk Registration (FishR) concept and implementation strategy, which also included the creative use of communications policy. The project’s technical support included adding connectivity in one site using TV white space (referring to unused spectrum or buffer channels that can be accessed to provide broadband internet access). ECOFISH invested around US$10,000 (PhP440,000) in project activities and BFAR spent at least $5.5 million (PhP240 million) to implement FishR nationwide. FishR became BFAR’s banner program and led to the development and implementation of other national programs. In the 15 years following implementation of the Fisheries Code of 1998, only about 50,000 fisherfolk had been registered by the LGUs countrywide. As of April 2017, FishR contained almost 1.8 million registrants.
The success of FishR motivated BFAR to launch a complementary program on municipal fishing boat and gear registration in 2015, the National System of Municipal Fishing Boat Registration (BoatR). As under FishR, BFAR provides incentives to LGUs to comply with the legal LGU mandate. Although BoatR uses the FishR database to link fishers to their boats and gear, BoatR is technically more complex than FishR; for this reason, BFAR decided to implement BoatR separately. ECOFISH provided assistance in designing the technical aspects of boat admeasurement (measuring boat dimensions and capacity) and training the BFAR staff guiding LGU implementation of BoatR. With the success of FishR, BFAR had greater confidence in implementing BoatR with and required minimal assistance from the project.
ECOFISH worked with the PNP-MG to design programs to protect marine biodiversity. ECOFISH and PNP-MG, in collaboration with the World Wildlife Fund for Nature (WWF), University of the Philippines Marine Science Institute (UPMSI), BFAR, and DENR, designed the AMPA and DALOY programs. ECOFISH also facilitated a PPP with SMART Telecommunications to provide the
ECOFISH COMPLETION REPORT 12

communication structure to implement both programs. These pilot programs were so successful that they ultimately were expanded nationally.
ECOFISH provided technical assistance in conserving mangrove and beach forest resources. With guidance from a technical working group (TWG) convened by the National Fisheries Research and Development Institute (NFRDI), ECOFISH prepared a draft bill on establishing coastal greenbelts nationally. The bill was passed on to stakeholder groups, including the NFR. The NFR submitted the bill to the Congress of the Philippines for consideration.
ECOFISH provided technical comments on the draft revisions to the Fisheries Code, which Congress eventually passed as R.A. No. 10654. The project provided support in the writing of the implementing rules and regulations (IRR), especially in managing fishing efforts, enhancing capacity for fisheries law enforcement, and disseminating information about the new law.
The project conducted 11 policy forums (more than twice the original target) in response to BFAR and LGU requests. ECOFISH provided the needed technical expertise to inform stakeholders and enable them to make decisions based on relevant facts and scientific principles. A number of forums were developed to facilitate information sharing and best practices, including provincial-level forums in Batangas and Negros Occidental and a forum that linked local management to international actions, such as the U.S. State Department’s “Our Oceans” initiative.
ECOFISH ensured policy interventions were coherent with EAFM principles and CTI themes and consistent with the USAID goal to conserve marine habitats and biodiversity.
Table 2.2 lists the policy studies and forums conducted by the project to support this deliverable.
TABLE 2.2. POLICY STUDIES AND FORUMS CONDUCTED BY ECOFISH
Policy Studies or Forums Instrument of Adoption
Date Adopted/ Completed
Policy Studies on EAFM Policies and Policy Implementation in Providing an Enabling Environment for EAFM 1. BFAR National Program for Municipal Fisherfolk Registration
(FishR) FOO 2013-228 July 5, 2013
2. National Program for Municipal Fishing Boat and Gear Registration (BoatR)
FOO 2014-290 December 2014
3. Inputs to amendments to the Fisheries Code; IRR of the Revised Fisheries Code
R.A. No. 10654; R.A. 10654 IRR
March 23, 2015 October 10, 2015
4. National Stock Assessment Program (NSAP) Draft FOO — 5. Fish Examiners Draft FOO — 6. Comprehensive National Fisheries Industry Development
Plan (CNFIDP) CNFIDP 2016-2020 February 3, 2016
7. Mainstreaming EAFM FOO 2016-164 June 23, 2016 8. Closed Season for Galunggong (Round Scad) in Northern
Palawan Joint DA-DILG AO No. 1, 2015
December 15, 2015
Policy Forums with Relevant Stakeholder Groups 1. Climate Change Adaptation and Sustainable Fisheries
(National Roundtable Discussion [RTD]) April 16, 2013
2. Administrative Adjudication (Danajon Reef MKBA) April 27, 2013 3. Oil Spill Response (Cebu; Danajon Reef MKBA) August 22–24, 2013
ECOFISH COMPLETION REPORT 13

Policy Studies or Forums Instrument of Adoption
Date Adopted/ Completed
4. Forum on Registration and Licensing of Fishing Boats and Gear (South Negros MKBA)
October 23–24, 2013
5. Forum on Disasters, Climate Change, and Biodiversity (Danajon Reef MKBA)
December 4, 2013
6. Negros Occidental Fisherfolk Summit (South Negros MKBA) December 11–13,
2013 7. Batangas Environmental Summit March 26–28, 2014 8. Forum on Proposed Fisheries Administrative Order on Coral
Propagation of the National Fisheries and Aquatic Resources Management Council (FARMC)
April 9, 2014
9. RTD with Ambassador Goldberg (Verde Island Passage [VIP] MKBA)
May 12, 2014
10. RTDs on Hulbot-Hulbot Impacts (Cebu; Negros) Statements supporting ban on hulbot-hulbot
July–November, 2014
11. Forum Series: Pagpapahinga ng Look ng Balayan Seasonal Closure for Small Pelagics (VIP MKBA)
9 municipal ordinances July 2014–January 2016
12. Fisherfolk Summit on the Amended Fisheries Code and Identifying Priority Issues for the IRR
October 2015
Policy Studies to Integrate CTI Themes (EAFM, MPAs, and CCA) into Existing Policy Instruments 1. PNP-MG AMPA Program CMC 02-2013 August 28, 2013 2. Study: Climate Change and Sustainable Fisheries Guiding
Principles, Policy Recommendations, and Opportunities for the ECOFISH Project Building on Regional Efforts in the Coral Triangle
Research paper September 2013
3. National Greenbelt Bill Senate Bill 2179 March 26, 2014
4. NFRDI Research Agenda Draft NFRDI Research Agenda
(September 2015) Not yet approved
Policy Studies on Revenue Generation, Sustainable Financing, and PPPs to Support Sustainable Fisheries Management 1. PNP-MG DALOY Program (PPP) CMC 05-2014 April 2014 2. BFAR/National Anti-Poverty Commission (NAPC)
Community Fish Landing Center (CFLC) Guidelines Draft guidelines CFLC launched
February 2015
3. Survey of Fishpond Lease Agreement Cases (and Their Impacts on Productivity and Conservation of Mangroves
Fishpond lease agreement cases survey and tracking procedures/forms
January 2015
ECOFISH was primarily designed to engage in policy studies at the national level. However, the team regarded the support of policy development at the LGU and inter-LGU levels to be of equal importance to translate national policies into local actions. ECOFISH supported preparation of both local fisheries ordinances that incorporated national programs, such as FishR and BoatR, and site-specific initiatives, such as closed seasons, marine spatial planning (MSP), and fishing regulations (species- and gear-specific). These ordinances translated the project outputs (plans, scientific studies, stakeholder agreements, inter-LGU agreements) into formal policies and regulations ready for implementation.
Early exploratory discussions with the Departments of Justice, Trade and Industry, and Budget and Management on economic instruments/policies related to fisheries did not progress because there was less urgency on the part of these departments. ECOFISH instead worked with the NAPC and BFAR to
ECOFISH COMPLETION REPORT 14

provide assistance in designing a poverty alleviation program in the fisheries sector—the poorest socio-economic sector in the country. One of ECOFISH’s key interventions was to establish community fish landing centers throughout the country. The project provided policy and technical support to NAPC in the areas of center site selection and design to align with the goal of sustaining fisheries productivity while enhancing the economic opportunities of the municipal fisherfolk. The policy was oriented toward value-adding, enhancing community skills, and increasing efficiency in fish landing operations rather than fishing effort.
2.2 DELIVERABLE 2: TOOLKITS, SOURCEBOOKS, AND CASE STUDIES ON EAFM, MPA, AND CLIMATE CHANGE
In support of its various training activities, ECOFISH developed and updated toolkits, sourcebooks, case studies, and other guides on EAFM, MPA management, and CCA. The project also produced and disseminated many of these materials in easy-to-understand language to increase stakeholder awareness, knowledge, and engagement in EAFM, MPA, and CCA initiatives.
The ECOFISH-developed Start-Up Guide targeted LGUs beginning to think about a strategic and sustainable program for managing fisheries and coastal resources. These LGUs did not yet understand EAFM in its entirety, but felt a sense of urgency that something needed to be done. The Start-up Guide provided a rudimentary framework to implement actions immediately and with little cost and effort. Through learning-by-doing, LGUs gained the confidence to embark on a more
comprehensive management plan later using the full EAFM curriculum (Deliverable 5).
The project responded to the BFAR’s request for assistance in drafting a standard training module on the scientific examination of fish caught through the use of explosives. Prior to ECOFISH, BFAR had conducted training and certification of fish examiners for more than 50 years without the benefit of an organized and written module.
As one of its toolkits, ECOFISH adapted the Essential EAFM Training Course developed by NOAA, CTI, U.N. Food and Agriculture Organization, the Bay of Bengal Large Marine Ecosystem Project, and the Southeast Asian Fisheries Development Center for use in the Philippines. The “Mainstreaming EAFM” approach goes beyond training and focuses on identifying a workable and realistic EAFM plan that stakeholders can rally behind to implement. Participants in the early stage of the planning process (shown above) identify all stakeholder groups in their fisheries management area and categorize them according to the level of importance and influence to the entire process.
ECOFISH COMPLETION REPORT 15

TABLE 2.3. DELIVERABLE 2 – TOOLKITS, SOURCEBOOKS, AND CASE STUDIES ON EAFM, MPA, AND CLIMATE CHANGE
Project Intervention/Activity Target (Scale) Accomplished Review existing toolkits (Municipal Fisheries Management Source Book – Volume 1) and other guidance
1 (National) 1
Develop EAFM Start-Up Guide for LGUs 1 (National) 1 Develop case studies on the integration of CTI themes (EAFM, MPAs, and CCA) at the site level
24 (3 per MKBA)
28
Develop Municipal Fisheries Management Toolkit series (update Volume 1, develop additional volumes)
4 (National) 4
Develop Fishery Law Enforcement Procedural Handbook 1 (National) 1
Develop Fishery Law enforcement instructional video 1 (National) 1
Team Lead: Information Education and Communication Specialist, Senior Fisheries and Coastal Resource Management Specialist, Regulation and Enforcement Specialist, Marine Environment Resources Foundation (MERF) Key Partners: BFAR, DILG, Philippine National Police (PNP), LMP, university network, NFR
KEY ACTIVITIES/ACCOMPLISHMENTS
The project team launched ECOFISH by way of two-day inter-LGU and stakeholder orientation workshops in each MKBA. These workshops served as scoping activities for the information and training needs of partners at the local LGU level. Through benchmarking exercises (using benchmarks developed by the FISH project), the workshops generated information on the various gaps in fisheries governance of the respective municipalities in each MKBA. The concept of EAFM was still vague to the participants, underscoring the need for more popularized information materials on what constitutes an ecosystems approach. However, the highly participatory and consultative process ensured that ECOFISH interventions were aligned with local partners’ priorities, thus generating their commitment to a partnership.
ECOFISH developed an LGU Start-up Guide, drawing upon the FISH-produced “Managing Municipal Marine Capture Fisheries in the Philippines: Context, Framework, Concepts, and Principles” and various studies and references developed by MERF and partners. The project also integrated modules on CCA developed by CTI. Various information materials on ECOFISH were developed for use in the launch and subsequent orientation activities, and these became the initial set of information education and communication (IEC) materials for subsequent project activities.
The project produced case studies intended to inform, inspire, and catalyze actions by LGUs and stakeholders. These case studies were used as examples in the EAFM training curriculum and other EAFM trainings that followed. For a full list of case studies conducted by ECOFISH, see Table B-2.
As part of the design process for a national capacity building program for LGU fishery staff, ECOFISH conducted a review of existing toolkits, including the Municipal Fisheries Management Source Book – Volume 1 and other materials used by BFAR and training institutions. The Essential EAFM Training Course developed by USAID and other partners included a volume on toolkits with useful information related to EAFM implementation. However, ECOFISH decided not to duplicate the existing toolkits but rather to add four new toolkits (see Table 2.4).
ECOFISH COMPLETION REPORT 16

TABLE 2.4. TOOLKITS DEVELOPED BY ECOFISH FOR EAFM
Toolkits Description 1. EAFM Governance
Benchmarking Tool This revised benchmarking tool evolved from the version developed by FISH. The self-assessment tool is meant to be used by LGUs in assessing their status and progress in complying with basic elements of EAFM. There are 15 benchmarks (indicators) to be scored by LGUs: Level 1 (initiated at LGU); Level 2 (sustained at LGU); and Level 3 (expanded at ecosystem scale or inter-LGU scale).
2. Review of Municipal Fisheries Ordinance
LGUs are in the process of reviewing or drafting municipal ordinances to conform to the revised Fisheries Code (R.A. 10654). This tool helps LGUs evaluate existing ordinances or develop new ordinances with all the elements needed for EAFM. It is also consistent with national laws.
3. Interaction Matrix of Activities and Conflict Mapping
Addressing conflicts is crucial in fisheries and coastal resources management. In order for decision-makers to address conflicts, they must first have a systematic understanding of them. The related tools of interaction matrix and conflict mapping allow for a comprehensive assessment of conflicts in the area and where they are located.
4. Threat Mapping for Fisheries Law Enforcement
Fisheries law enforcement is a major pillar of sustainable management of fisheries and coastal resources. Threat mapping is a tool for decision-makers to identify, locate, and prioritize law enforcement issues. This is a pre-requisite to designing an effective monitoring-control-surveillance framework.
The Philippines is the only country with an established system for determining if a fish has been caught by blast. The system has been in place for more than 50 years, but with no standard documentation process. In collaboration with the BFAR TWG, the project facilitated a series of meetings and focus group discussions that resulted to the production of a Fish Examiners Training Manual and an accompanying video demonstrating how fish specimens are dissected. The TWG was composed of fish biologists, taxonomists, veterinarians, laboratory technicians, field enforcers, and lawyers. In addition to the manual, the project also developed a guide for laboratory technicians called “Investigating Fish Samples from Suspected Blast Fishing Cases: Handbook of Laboratory Procedures and Practice.”
The ECOFISH project also funded the third edition of Mending Nets: Handbook for the Prosecution of Fishery and Coastal Law Violations. This handbook was developed in 2004 under the Coastal Resource Management Project (CRMP) and revised in 2008 during the FISH project. With the introduction of the New Rules of Environmental Courts in 2010 and the new provisions under the amended Philippines Fishery Code in 2015, ECOFISH updated the handbook. Using the Special Activities Fund (SAF), the project engaged the Environmental Legal Assistance Center, the co-producer of the two earlier editions, to develop the third edition. The previous editions of Mending Nets are immensely popular among police, prosecutors, and judges and are often referenced in court decisions. The third edition of Mending Nets now forms part of the legal reference of judges and prosecutors enrolled in the Philippine Judicial Academy.
Development of case studies was delayed while ECOFISH waited for start-up interventions in the MKBAs to show initial results. The Start-Up Guide for LGUs was supposed to be completed in Year 1, but more time was needed to sort out the differences and similarities between the Start-Up Guide under Deliverable 2 and the EAFM Training Curriculum to be developed under Deliverable 5. After months of experimentation, observation, and learning from the initial trainings conducted at the sites, it became clear that the two products had different but complementary purposes.
ECOFISH COMPLETION REPORT 17

2.3 DELIVERABLE 3: A NATIONAL DATABASE ON EAFM ESTABLISHED USING THE ANNUAL MONITORING DATA IN THE EIGHT MKBAS
One of ECOFISH’s key contributions was the development of a national database on EAFM. This database was created to enhance the capacity of the national government and LGUs to initiate appropriate resource management interventions.
The national database on EAFM built on the fisheries database system developed under the FISH project, and successfully tested and partially implemented in FISH sites. It was likewise tested and used by LGUs implementing fisheries management projects supported by the German Corporation for International Cooperation. ECOFISH added data from fisheries, enforcement, socio-economic monitoring, and other relevant sources to transform the platform into a national resource. The new system was designed to be compatible with the NSAP and FishR and BoatR systems. This database
has the capability to generate reports to support local EAFM efforts, such as fisheries registrations, licenses, apprehensions, and trends in fish catch. The database also supports the generation of maps to depict the status of EAFM by municipality in the eight MKBAs.
TABLE 2.5. DELIVERABLE 3 – A NATIONAL DATABASE ON EAFM ESTABLISHED USING THE ANNUAL MONITORING DATA IN THE EIGHT MKBAS
Project Intervention/Activity Target (Scale) Accomplished Review existing fisheries database and identify additional sources of data needed for EAFM
1 (National) 1
Develop a national database on EAFM 1 (National) 1 Develop protocols for data collection and entry in the national database on EAFM
1 (National) 1
Develop protocols for a fish catch monitoring system in the MKBAs to become part of the NSAP
1 (National) 1
Develop protocols for benchmarking local EAFM 1 (National) 1
Conduct training on the national database system on EAFM 2 (National)
8 (1 per MKBA) 2 8
Team Lead: Senior Fisheries and Coastal Resource Management Specialist Key Partners: BFAR, DILG, LMP
KEY ACTIVITIES/ACCOMPLISHMENTS
As early as Year 1 of ECOFISH, the project had already put in place a database system that served as a receptacle for encoded information from fish catch monitoring; registration of fishers, boats, and gear;
Local fisherwomen working together to bring in their harvest.
ECOFISH COMPLETION REPORT 18

and socioeconomic monitoring in ECOFISH focal areas. This system supported routines for data capture, retrieval, and some analysis in support of, and in line with, the baseline assessment and monitoring plan developed by the project to measure the Key Result Areas.
The project completed development of various protocols for data entry, retrieval, and analysis in Year 2. The team added socioeconomic information to the database and developed routines for use by LGU personnel in accessing and processing data on registration and licensing. The elements, scope of coverage, and utility of the database was tested during the Registration and Licensing Training in Calamianes Island Group MKBA.
ECOFISH developed a protocol for integrating EAFM-related information from various fisheries management initiatives in the country. This consolidated set of information was designed to feed into the State of the Marine Resources Report (SMRR) under Deliverable 4. The overall general principle followed was that all project databases would feed into BFAR’s national database, and that the project should not create its own customized database.
ECOFISH provided assistance to augment BFAR’s data management capacity to enable BFAR to host the database and enhance the bureau’s capacity for acquiring and processing data generated from other programs (e.g., FishR, BoatR, the Fishery Law Enforcement Management Information System [FLEMIS], and the Philippine Fisheries Information System). Project support also allowed BFAR to expand the system to incorporate NSAP field data and NFRDI research studies and results.
2.4 DELIVERABLE 4: STATE OF THE MARINE RESOURCES REPORT (SMRR)
ECOFISH designed and developed the SMRR to provide national and local partners with information on the status and management of fisheries, protected marine species, coral reefs, and other marine habitats. The purpose of the report was to increase awareness of a wide range of stakeholders about the state of the marine resources and resource-use issues, and to guide LGUs and national agencies in their implementation of appropriate fisheries management efforts. The MERF of UPMSI led the preparation of the report.
The Driver-Pressure-State-Impact-Response (DPSIR) Framework, used in drafting the
State of the Coral Triangle Report (SCTR), was also proposed to guide development of the report (see Box 1). DPSIR is a conceptual framework developed in the 1990s by the Organization for Economic Cooperation and Development to aid in the decision-making process with regard to the environment. The framework assumes a cause-and-effect relationship between the interacting components of the
ECOFISH conducted compliance promotion and enforcement training for partners and stakeholders. Key sessions to ensure proper handling and engagement with suspected illegal perpetrators included pre-boarding and boarding procedures as well as practical boarding exercises.
ECOFISH COMPLETION REPORT 19

environment and society—aligned with the basic assumptions and principles of EAFM. Organizing and structuring information according to the DPSIR framework allowed ECOFISH to compare various fishery stock data and information types through environmental/biological/social/economic lenses—with the goal of prompting more holistic management response strategies relative to the reported resource status. Furthermore, this approach is complementary to the nation’s State of the Coast Report and the regional SCTR of the CTI.
The core of the SMRR was baseline data and existing information on the eight MKBAs. Information from existing national and site-specific reports and documents generated by other projects and programs in the country further enhanced the report. ECOFISH and partners set in place an agreed process for regular updating and publication of the report. This also included the simplification of format for the report to serve its purpose of increasing awareness.
TABLE 2.6. DELIVERABLE 4 – STATE OF THE MARINE RESOURCES REPORT
Project Intervention/Activity Target (Scale) Accomplished Review protocols and status of CTI efforts in knowledge management and State of the Coral Triangle Report
1 (National) 1
Develop a framework for the SMRR with partners and informed by CTI efforts
1 (National) 1
Conduct workshops and review sessions with partners to develop sections of the report
5 (National) 5
Develop the draft SMRR 1 (National) 1 Team Lead: Senior Fisheries and Coastal Resource Management Specialist, MERF Key Partners: BFAR, DENR, LMP, university network, WWF, WorldFish Center
KEY ACTIVITIES/ACCOMPLISHMENTS
In Year 1, ECOFISH conducted a review of the SCTR and other reports on the state of the fisheries resources, coastal resources, and marine environment in general. The project then met with key partners to present the results of the review. ECOFISH developed the SMRR’s framework and generally reached agreement with the partners on the tasks involved in drafting and developing the report.
BOX 1. WHAT DOES DPSIR STAND FOR?
• Driver, or driving force – A societal need that has to be fulfilled; this can be very basic, such as the provision of shelter, food, and water for a growing population, or the need of a particular sector or industry to maximize profits.
• Pressure – A force exerted by human activities on the environment resulting from consumption and production purposes; relevant examples include overharvesting of resources and coastal and marine habitat degradation/loss.
• State – The condition of the environment resulting from the pressures exerted by society; in the SMRR, focus is on the biological component of the marine environment, particularly fishery stocks.
• Impact – The overall quality of the ecosystems and society’s welfare with respect to the state of the environment or its components; in the context of marine fisheries, a specific impact could be an increase or decline in fishery production and the corresponding economic gains or losses.
• Response – The answer on the part of society as a result of the changing states of the environment; this may be in the form of a management strategy, legislation, designing of incentive schemes, or further monitoring.
ECOFISH COMPLETION REPORT 20

In Year 2, ECOFISH subcontractor MERF conducted review sessions and workshops with partners to determine assignments to arrive at the first consolidated draft in Year 3. The team conducted a writeshop with partners from BFAR and MKBA LGUs that resulted in the report’s outline. Writeshop participants also took stock of site-level available information and other sources, and attendees strategized on how to access it. In collaboration with NSAP, the ECOFISH team conducted a training for NSAP data analysts to revisit and standardize procedures for estimating fish population parameters and status of fish stocks. These sets of information form part of the SMRR and are intended to be updated on a regular basis. In Year 4, MERF finalized the draft and disseminated it for review by partners from the eight MKBAs. Following another round of edits, ECOFISH partners approved and adopted the report.
2.5 DELIVERABLE 5: NATIONAL, REGIONAL, AND MUNICIPAL EAFM TRAININGS CONDUCTED
ECOFISH was mandated to design, implement, and help institutionalize a comprehensive and systematic training program for EAFM complemented with scientific research in biophysical and socio-economic issues. The project designed the program to align with priorities of key partners, especially BFAR, and to serve the needs of frontline resource managers (e.g., LGUs and local community partners). The process of identifying and conducting the studies was consultative and collaborative with key partner agencies and stakeholders. As a rule, ECOFISH worked with BFAR and its relevant projects and programs implementing fisheries and coastal management capacity-building
activities. Likewise, ECOFISH designed standardized curricula for BFAR to implement.
The team also provided technical and management trainings to increase the capacity of individuals working at the regional and local levels to apply EAFM in the MKBAs. These training courses were tailored to the capabilities and roles of specific target audiences and to their capabilities and roles as partners in the project. The team also provided support in the training of the newly formed national Quick Response Teams (QRTs). ECOFISH supported a series of capacity-building trainings for QRTs to increase their effective response to illegal activities.
Calamianes Group of Islands MKBA partners gain understanding of the complex trophic interactions between the different components of the marine ecosystem in an exercise that had them simulate a marine food web.
ECOFISH COMPLETION REPORT 21

TABLE 2.7. DELIVERABLE 5 – NATIONAL, REGIONAL, AND MUNICIPAL EAFM TRAININGS CONDUCTED
Project Intervention/Activity Target (Scale) Accomplished Conduct a training needs assessment 1 (National) 1 Develop EAFM training curriculum 1 (National) 1 Conduct training needs assessment of partners in the MKBAs and develop a training program to enable them to implement various elements of EAFM
8 (1 per MKBA) 8
Develop various training courses for the EAFM curriculum 15 (National) 26 Deliver training courses for national government, LGUs, NGOs, and university network in MKBAs
120 (15 per MKBA)
306
Provide complementary scientific and technical support in the training series for national QRTs on fishery law enforcement
5 (National) 5
Provide complementary scientific and technical support in the training series for MKBA Fishery Law Enforcement Quick Response Teams (FLEQRTs)
40 (5 per MKBA)
40
Team Lead: Senior Governance and Institutional Development Specialist, Senior Fisheries and Coastal Resource Management Specialist, Regulation and Enforcement Specialist Key Partners: BFAR, Philippine Coast Guard, PNP, LMP
KEY ACTIVITIES/ACCOMPLISHMENTS
The ECOFISH team worked closely with BFAR national units and regional teams to review existing training programs and develop initial ideas for institutionalizing capacity building for LGU fisheries staff using a comprehensive, structured, and locally responsive curriculum. The initial consultations guided ECOFISH in designing a curriculum with specific courses to be initially offered to ECOFISH partner LGUs. ECOFISH also explored partnerships with national and local institutions of higher learning to incorporate or adopt the ECOFISH training curriculum.
The development of an EAFM curriculum and training program ran through the entire life of the project. The overall strategy was for ECOFISH to enhance the capacity of LGUs to move from start-up activities that address specific concerns to activities that address conservation and management issues holistically by applying EAFM. This process took time, and progress made across partner LGUs in an MKBA and across MKBAs was not uniform.
The EAFM training curriculum is an adaptation of the Essential EAFM Training Course developed by USAID, the National Oceanic and Atmospheric Administration (NOAA), the United Nations Food and Administration Organization, CTI, and the Bay of Bengal Large Marine Ecosystem Project. ECOFISH modified the course and tailored it to a site-based planning process (as opposed to a training exercise). The course incorporates Philippine-specific legal/policy/ governance context and local best practice examples. It also incorporates site-specific scientific information and local knowledge that is crucial in developing a realistic EAFM plan ready for implementation. The adapted curriculum is the core of the Mainstreaming EAFM Program adopted by BFAR under FOO 2016-164. The “EAFM Planning and Implementation Process” curriculum includes:
• Mainstreaming EAFM Program overview, explaining the planning and implementation process (that includes two main workshops and a stakeholder validation forum);
• Agenda and presentations for the two main workshops (start-up and planning); • Participant workbook;
ECOFISH COMPLETION REPORT 22

• Handbook of presentations with annotations as reference material for participants; and • Mainstreaming EAFM Program brochure; and • USB device containing electronic versions of all relevant materials.
The training course delivery schedule depended on the current capacity and readiness of LGUs in the MKBAs. The project drew upon the results of the EAFM benchmarking exercises (Deliverable 7) to guide the training course schedule, targeting support for the municipalities in the MKBAs according to benchmark scores.
ECOFISH provided trainings on socio-economic and biological assessments, constituency-building and conflict management, MPA networks, boat/gear registration systems, law enforcement, fish examination, local legislation and administrative adjudication, MSP, and integrated fisheries management planning (for the entire MKBA). The project conducted advanced technical trainings, such as the Coastal Vulnerability Assessment and CCA Trainers Training held September 23–27, 2013.
ECOFISH provided technical assistance to update and standardize the NSAP training curriculum. NFRDI adopted the updated training curriculum and used it to conduct trainings nationwide. ECOFISH also worked with NFRDI to conduct an EAFM orientation for senior BFAR officials. Following the successful orientation, the BFAR Director proposed instituting an EAFM training course for all BFAR staff.
The project contributed to building the capacity of FLEQRTs by providing an instructor to the BFAR. In response to the BFAR Director’s request and in light of the level of specialization required for fish examination, ECOFISH engaged a known expert on fish examination to conduct trainings at BFAR’s FLEQRT training center. This took precedence over developing our own training curriculum and conducting independent training. Project support resulted in close to 200 FLEQRT members trained on fish examination in five sessions over a two-year period.
Once the rapid training needs assessment was completed for each MKBA, ECOFISH developed a five-tiered training program (Table 2.8). The project customized this multi-level training program based on MKBAs’ geographic, political and cultural attributes. This process included identifying fisheries threats, levels of governance benchmarks, and institutional mechanisms for each MKBA. MKBAs were classified as:
1. Initiating (FLEQRT members are just starting to establish themselves); 2. Operational (FLEQRT member have already started conducting field operations as BFAR or in
coordination with LGUs or other agencies); and 3. Institutionalized (FLEQRT is already part of an established enforcement system).
TABLE 2.8. TOPICS FOR VARIOUS OPTIONS AND FIVE LEVELS OF TRAINING FOR FISHERIES LAW ENFORCEMENT QUICK RESPONSE TEAM
Levels Option 1 (Initiating) Option 2 (Operational) Option 3 (Institutionalized) Level 1 Confidence-building Community relations and
stakeholder engagements Joint patrol planning
Level 2 Basic fishery law enforcement
Media relations and management
Strategic communications
Level 3 Paralegal workshops Information management Advanced information management
Level 4 Patrol planning Fisheries prosecution/ administrative adjudication
Legal interface workshop with judges and prosecutors
ECOFISH COMPLETION REPORT 23

Levels Option 1 (Initiating) Option 2 (Operational) Option 3 (Institutionalized) Level 5 Community relations and
stakeholder engagements Joint patrol planning Instructor development
Other subjects covered within these modules were basic navigation, self-defense, water-borne search and rescue, crisis management, and negotiations. These subjects were included in some modules in response to the need and requests of FLEQRT members. All trainings received positive feedback in their incorporation of experiential and adult-learning methodologies.
In addition to FLEQRT participants, ECOFISH allotted 10 percent of the available training slots to representatives of the municipal enforcement teams supported by the project to build connections with BFAR counterparts. In areas with an established enforcement mechanism, members of other law enforcement agencies were also invited to participate. Toward the end of the training process, the BFAR, PNP, and other agencies asked that additional members be allowed to take part, but the project was unable to meet these requests due to time restrictions imposed by the Leahy Vetting regulations.
By end of project, ECOFISH has developed and implemented 26 training courses under eight themes. Overall, the project team conducted a total of 306 trainings (Table 2.9) in the eight MKBAs and at the national level.
TABLE 2.9. ECOFISH TRAININGS BROKEN DOWN BY THEMATIC FOCUS AND BY MKBA
Thematic Focus Number of Trainings
Total MKBA LG VIP CIG TP-LG-SBS DB SN SDN SA N
Coastal Law Enforcement 7 12 8 8 10 11 8 6 7 77 Fisheries Resource Management
12 6 7 9 8 11 7 4 9 73
Governance and Institutional Development
7 4 4 2 7 11 5 4 1 45
Information, Education, and Communication
2 4 2 2 1 1 4 16
Marine Protected Area 4 9 1 4 7 7 3 35 Marine Spatial Planning 2 3 2 2 1 2 2 1 15 Public-Private Partnership 1 1 6 1 1 4 1 1 16 Conservation Enterprise Development
5 7 8 1 7 1 29
Total 40 30 45 32 32 44 41 23 19 306
Notes: LG = Lingayen Gulf; VIP = Verde Island Passage; CIG = Calamianes Island Group; TP-LG-SBS = Ticao Pass – Lagonoy Gulf – San Bernardino Strait; DB = Danajon Bank; SN = South Negros; SDN = Surigao del Norte; SA = Sulu Archipelago; N = National
2.6 DELIVERABLE 6: PUBLIC-PRIVATE PARTNERSHIPS SUPPORTING ECOFISH OBJECTIVES ESTABLISHED
ECOFISH pursued the project’s socio-economic component to achieve two major objectives: (1) increase public and private financial resources that will contribute to better management of fisheries in the MKBAs; and (2) address overfishing and poverty-related threats by improving the socio-economic conditions of fishing communities directly dependent on marine resources in the MKBAs. The project used PPPs as a key vehicle to achieve these objectives.
ECOFISH COMPLETION REPORT 24

ECOFISH’s PPP strategy focused on mobilizing government agencies, companies, organizations, and local communities to support EAFM at the national and site levels. The project designed strategic partnerships to leverage the resources of the private sector— from financial to in-kind contributions—to augment and scale up government programs with shared value for both public and private partners. ECOFISH rolled out community partnerships to increase the capacity of local stakeholders, specifically people’s organizations (POs), to transact among themselves legitimately
with strategic partners (and hopefully the broader market), guided by EAFM principles. Ranging from the traditional to the innovative, the PPPs facilitated and executed by ECOFISH over the course of the project together helped mobilize resources and deploy novel solutions to address challenges in fisherfolk registration, enforcement, stock assessment and management, livelihoods, capacity building, and organizational strengthening at the community level.
TABLE 2.10. DELIVERABLE 6 – PUBLIC-PRIVATE PARTNERSHIPS SUPPORTING ECOFISH OBJECTIVES ESTABLISHED
Project Intervention/Activity Target (Scale) Accomplished Develop portfolio of PPPs 8 (1 per MKBA) 8 Conduct training in establishing PPPs 20 Individuals 21
Establish private-sector partnerships 8 Strategic Partnerships
$8M Leveraged 100 Community Partnerships
8 $10.2M Leveraged
103 Team Lead: Senior Resource Economics Specialist, REECS, SSG Key Partners: Private sector, LGUs
KEY ACTIVITIES/ACCOMPLISHMENTS
Throughout the life of the project, ECOFISH developed PPPs across the eight MKBAs to complement project efforts to achieve a 10 percent increase in biomass and a 10 percent increase in households with better employment.
ECOFISH established eight strategic PPPs that demonstrated and deployed innovative EAFM models and delivered high-impact and lasting benefits at national and local levels. Over the course of the project, ECOFISH formalized and implemented a variety of partnerships, including:
Fisherfolk from the municipality of Talibon, Bohol, participate in a demonstration of a mobile fisherfolk registration process (FishR) using TV White Space connectivity.
ECOFISH COMPLETION REPORT 25

• Deploying technology solutions to support fisherfolk registration, marine environmental enforcement, and marine spatial planning;
• Collaborating with companies and local fisherfolk, including indigenous peoples, to identify and develop potential products for marketing while assessing and addressing species-specific management issues;
• Assisting with post-disaster recovery through livelihood assistance; and • Establishing mentorship and capacity-building programs to increase the competence of local and
sectoral champions regarding PPPs and enterprise development.
ECOFISH also facilitated the mobilization of 103 community partnerships composed of diverse fisherfolk and POs. Project support strengthened and legitimized these groups, paving the way for improved livelihood opportunities for, and preparedness of, social enterprises (see Deliverable 13).
The project rolled out the “TV White Space Supported Fisherfolk Registration in the Danajon Reef” in San Jose National High School in Talibon, Bohol. The Department of Science and Technology (DOST) Information and Communication Technology Office (ICTO) and Microsoft, together with ECOFISH, turned over to BFAR, the Province of Bohol, and respective local government officials TV White Space connectivity for over 20 public schools in the municipalities of Tubigon, Talibon, Ubay, Bien Unido, Trinidad, and Carlos P. Garcia. These connected public schools served as mobile registration hubs under the FishR and, together with the 30 tablets provided, significantly increased the capacity of the pilot municipalities to facilitate registration of fisherfolk. The TV White Space partnership was awarded the prestigious P3 Impact Award in 2015 hosted by the U.S. Department of State, Concordia, and the University of Virginia Darden School of Business. The partnership bested over 20 other partnerships and was recognized for its innovation in addressing a systemic problem in fisheries management—fisherfolk registration in remote areas—through the use of technology.
ECOFISH officially launched the 700DALOY Partnership between the PNP-MG, SMART Communications, and USAID. A central Information Management Center (IMC) has since been established in PNP-MG headquarters and over 100 phones distributed to pilot users in Tawi-Tawi and other selected offices. Monthly traffic of over 500 text messages has resulted in the successful filing of two cases against marine wildlife violators in Tawi-Tawi. Advanced training for the IMC and its enforcement partners are also regularly conducted together with a massive public information and education campaign. 700DALOY was identified as a finalist for the USAID Regional Development Mission of Asia Harnessing Data for Resiliency Award. SMART commissioned and prototyped an enhanced version of the platform (the DALOY3456) according to the specifications requested by the PNP-MG and user feedback. The inclusion of DALOY3456 in the PNP integrated police hotline mobile application (i-serbis) has already been approved after a series of meetings with the PNP-MG,
“DALOY” a PPP platform to encourage public participation in environmental protection. Partnering with SMART Communication and PNP-MG, technology was developed to strengthen the fight against illegal fishing and other marine wildlife crimes.
ECOFISH COMPLETION REPORT 26

PNP-Information and Technology Management Service, SMART Communications, and ECOFISH. i-serbis is a reporting hotline for all police services and complaints.
DALOY was conceived in partnership with the Maritime Police and SMART Communications to provide a platform for witnesses to report anonymously through short message service (SMS). DALOY utilizes an already existing technology by SMART Communications called Infoboard, a web-based SMS broadcast.
The formal engagement of the private sector proved to be an
innovative model that unlocked shared value between government and some of the country’s most vibrant and forward-thinking private entities, complementing ECOFISH’s interventions and supporting sustainable fisheries in the Philippines. These partnerships not only invigorated traditional fisheries interventions with a fresh perspective and entrepreneurial spirit, but also demonstrated the potential of private sector expertise and resources to catalyze collaborative solutions with government. The project successfully established a portfolio of PPPs per MKBA that comprised strategic and community partnerships. Strategic partnerships spanned three key types: innovating fisheries management through technology, building public and private sector champions for EAFM, and support for enterprise development (Table 2.11).
TABLE 2.11. STRATEGIC PARTNERSHIPS ROLLED OUT BY ECOFISH
EAFM Theme Title Partners MKBA
Innovating Fisheries Management through Technology
TV White Space Supported Fisherfolk Registration in the Danajon Reef
DOST-ICTO, Province of Bohol, Microsoft
Danajon Reef
700DALOY (Dedicated Alert Lines for Ocean Biodiversity)
PNP-MG, Province of Tawi-Tawi, SMART
Tawi-Tawi/ Multi-MKBA
The National DALOY Hotline PNP-MG, SMART Multi-MKBA Species Specific Assessment and Sustainable Management of Blue Swimming Crab in the Danajon Reef
BFAR, PACPI Danajon Reef
Augmenting the Data Management Capacity of BFAR and the Establishment of an EAFM Database
BFAR, Imaginet Multi-MKBA
The DALOY dragon boat team trains in Manila Bay. The dragon boat is being used to promote the DALOY3456 hotline and has already competed in two national and one international dragon boat festival.
ECOFISH COMPLETION REPORT 27

EAFM Theme Title Partners MKBA Building Public and Private Sector Champions for EAFM
Pilot PPP Training Program USAID, Development Academy of the Philippines
Multi-MKBA
Support for Enterprise Development
Bancas for Calamianes—Post-Typhoon Yolanda Recovery Assistance
Province of Palawan, WWF, PPPI
CIG
Mentorship for Enterprise Development USAID, AIM CIG Philippine Coconut Authority (PCA)’s KAANIB Enterprise Development Project on Coco-coir Production
PCA, ECOFISH SN
2.7 DELIVERABLE 7: BIO-PHYSICAL, SOCIAL, AND ECONOMIC BASELINE ASSESSMENTS OF THE EIGHT MKBAS
ECOFISH carried out baseline assessments to determine biophysical, socioeconomic, and governance conditions at the start of the project. For this and the FISH project, baseline and subsequent monitoring data were not only used to serve as reference points to monitor and evaluate project interventions, but also as inputs to planning and implementation of fisheries management initiatives. Most importantly, the data served as critical information with which to engage stakeholders and resource users in fisheries management. The team collaborated in the design and implementation of the baseline
assessment and monitoring program. ECOFISH submitted a baseline assessment plan (ECOFISH 2013–2017) for USAID approval in Year 1 to finalize the data collection methods and calculate the key results.
The project collected fisheries catch data and reef fish biomass in selected landing sites and MPAs, which would also be used as monitoring sites to determine fisheries biomass increase or decrease. For the socioeconomic component, the team measured variables that would indicate better or new employment at the household and community levels through individual household surveys in the focal areas across the eight MKBAs. Finally, ECOFISH collected data on other parameters monitored during the life of the project, such as the capacity of local governments to implement EAFM and improvement in law enforcement capabilities.
ECOFISH used the fisheries and MPA surveys to measure project result of achieving at least an average of 10 percent increase in fisheries biomass across the eight MKBAs over the five-year period. The
Fish catch enumerators during the ECOFISH fisheries baseline and subsequent monitoring events employ standard data collection and recording methods.
ECOFISH COMPLETION REPORT 28

project team measured catch rates of various fishing gears in the focal area of each MKBAs using fisheries-dependent assessment method and estimated reef fish biomass using coral reef assessment method.
The project team collected catch and effort monitoring data of all fishing gears operating in the focal areas for three months in the first year to serve as baseline. The team then collected the same set of information during comparable three-month periods in Year 3 and Year 5. Weighted averages of catch rates were used to determine changes in fish stocks. Table 2.12 presents start and end dates of fisheries baseline, monitoring, and final assessments in the focal areas of the eight MKBAs.
TABLE 2.12. START AND END DATES OF FISHERIES BASELINE (2013), MONITORING (2015), AND FINAL (2017) ASSESSMENTS IN THE FOCAL AREAS OF THE EIGHT MKBAS
Marine Key Biodiversity Area Year 1 Baseline
Assessment (2013) Year 3 Monitoring
Event (2015) Year 5 Final
Assessment (2017) Start End Start End Start End
Calamianes Group of Islands Mar 25 Jul 5 Dec 4 Mar 16 Feb 11 May 17 Danajon Reef Mar 16 Jun 23 Jan 25 May 7 Feb 11 May 17 Lingayen Gulf Jun 1 Aug 28 Feb 13 May 26 Feb 4 May 13 Southern Negros Island Jun 1 Aug 28 Feb 13 May 26 Jan 19 May 13 Surigao del Norte/del Sur May 25 Sep 4 Feb 4 May 17 Feb 11 May 17 Sulu Archipelago Jun 10 Sep 20 Feb 22 Jun 4 Feb 11 May 17 Ticao Pass – Lagonoy Gulf – San Bernardino Strait
Jun 1 Aug 28 Mar 14 Jun 25 Feb 11 May 17
Verde Island Passage Jun 1 Aug 28 Mar 14 Jun 25 Feb 4 May 13 ECOFISH conducted MPA baseline assessments in existing MPAs and MPAs likely to be included in the MPA networks to be established by the project. The project measured reef fish biomass and density in three MPAs within each focal area, and surveyed reef fish assemblages using the standard visual census techniques. This process was repeated during the monitoring event in Year 3 and the final assessment in Year 5. Table 2.13 summarizes the start and end dates of the MPA baseline, monitoring, and final assessments in the focal areas of the eight MKBAs.
TABLE 2.13. START AND END DATES OF MPA BASELINE (2013), MONITORING (2015), AND FINAL (2017) ASSESSMENTS IN THE FOCAL AREAS OF THE EIGHT MKBAS
Marine Key Biodiversity Area
Year 1 Baseline Assessment (2013)
Year 3 Monitoring Event (2015)
Year 5 Final Assessment (2017)
Start End Start End Start End Calamianes Group of Islands Sep 23 Sep 26 May 25 May 27 Mar 5 Mar 9 Danajon Reef Oct 5 Feb 8 Apr 13 Apr 15 Apr 20 Apr 25 Lingayen Gulf May 20 May 31 Mar 16 Mar 20 Feb 5 Feb 12 Southern Negros Island May 6 May 10 Mar 23 Mar 20 Feb 23 Apr 29 Surigao del Norte/del Sur Nov 11 Nov 16 Mar 24 Mar 20 Apr 30 May 4 Sulu Archipelago Dec 5 Dec 8 May 5 May 8 Mar 24 Mar 28 Ticao Pass – Lagonoy Gulf – San Bernardino Strait
Aug 19 Aug 20 Mar 6 Mar 9 Feb 17 Apr 29
Verde Island Passage Aug 6 Aug 10 Feb 26 Feb 28 Jan 27 Mar 5
ECOFISH COMPLETION REPORT 29

The project designed the socioeconomic monitoring survey to measure progress in reaching the project’s target of a 10 percent increase in the number of people gaining employment or better employment from sustainable fisheries management. The survey instrument made use of a combination of parameters including household incomes, household expenditures, resource uses, environmental perceptions, and employment. Percentage changes were used for the sample population directly relying on their coastal and marine resources for their primary livelihoods.
The survey was divided into four major parts: (1) social and demographic profile of the fishing household; (2) general economic profile including household sources of income and expenditures; (3) perceptions about conditions of and threats to marine resources, as well as about enforcement of fishing rules and regulations; and (4) the profile of fishing households with respect to fishing practices, income, and expenditures. In the last survey, perceptions on changes in the conditions of marine resources and perceived changes in fisheries management were followed by questions on perceived attribution.
TABLE 2.14. START AND END DATES OF SOCIOECONOMIC BASELINE (2013), MONITORING (2015), AND FINAL (2017) ASSESSMENTS IN THE FOCAL AREAS OF THE EIGHT MKBAS
Marine Key Biodiversity Area Year 1 Baseline
Assessment (2013) Year 3 Monitoring
Event (2015) Year 5 Final
Assessment (2017) Start End Start End Start End
Calamianes Group of Islands Mar 25 Jul 5 Dec 4 Mar 16 Feb 13 Apr 7 Danajon Reef Apr 29 Jun 19 Jan 21 Feb 21 Feb 27 Mar 31 Lingayen Gulf May 14 Jun 7 Feb 27 Mar 20 Feb 17 Mar 24 Ticao Pass – Lagonoy Gulf – San Bernardino Strait
Jun 22 Sep 28 Feb 9 Apr 24 Feb 7 Mar 21
Southern Negros Island Apr 22 May 28 Mar 21 Apr 18 Feb 27 Apr 14 Surigao del Sur/del Norte Apr 8 May 9 Feb 20 Mar 17 Mar 10 Mar 31 Sulu Archipelago Mar 22 Apr 28 Mar 30 Apr 27 Mar 6 Mar 27 Verde Island Passage Feb 21 Mar 22 Feb 16 Mar 19 Feb 20 Mar 17
To measure the cumulative effect of courses developed, training programs conducted, and on-site development and implementation of fisheries management interventions to increase capacity of partners to apply EAFM, ECOFISH developed an EAFM Benchmarking System (Appendix A) to determine the baseline as well as subsequent status during the monitoring events throughout the life of the project. Benchmarking was conducted at the start of the project (Year 1), which served as baseline, and during the monitoring events (Year 3 and Year 5). In some cases, the project team also conducted monitoring efforts annually to guide partners, particularly the fisheries managers, to implement EAFM programs effectively (primarily by the increase or decrease of their benchmarks at various stages of their implementation).
ECOFISH conducted enforcement baseline assessments and monitoring events in conjunction with either project orientation or benchmarking sessions. This approach was used to stress that enforcement is just one tool that can be used to promote responsible fisheries management and not an end in itself, and to emphasize that compliance promotion and enforcement of fishery laws in coastal areas must be an integral part of a holistic fisheries management planning process to make it truly EAFM. The baseline assessment reports included: list of actual and perceived threats; names of municipal-based enforcers; legal instruments supporting enforcement; enforcement assets and logistics; numbers of arrests, confiscations, and prosecution; agency and NGO partners; and trainings attended. The project drew
ECOFISH COMPLETION REPORT 30

upon this initial assessment when planning its approach to assisting enforcement in the MKBAs. The baseline also served as the basis for developing capacity building for municipal enforcement units. The two monitoring events that followed coincided with benchmarking sessions, enabling ECOFISH to track enforcement progress vis-à-vis other fishery interventions such as delineation of municipal waters; establishment of MPAs or networks of MPAs; inter-agency and inter-local cooperation; registration of fishers, boats, and gear; and livelihood interventions.
TABLE 2.15. DELIVERABLE 7 – BIOPHYSICAL, SOCIAL, AND ECONOMIC BASELINE ASSESSMENTS OF THE EIGHT MKBAS
Project Intervention/Activity Target (Scale) Accomplished Conduct fisheries baseline assessment and monitoring 24 (3 per MKBA) 24 Conduct MPA baseline assessment and monitoring 24 (3 per MKBA) 24 Conduct socioeconomic baseline assessment and monitoring 24 (3 per MKBA) 24 Conduct enforcement baseline assessment and monitoring 24 (3 per MKBA) 24 Conduct governance baseline assessment and monitoring using benchmarking system in MKBA focal area LGUs
41 LGUs 61
Team Lead: Senior Fisheries and Coastal Resource Management Specialist, MERF, Senior Resource Economics Specialist Key Partners: University network, WorldFish Center, NSAP, BFAR
KEY ACTIVITIES/ACCOMPLISHMENTS
ECOFISH selected a total of 84 landing sites (Table B-3) in 29 municipalities for catch monitoring in the focal areas across the eight MKBAs. The project selected sampling sites for catch data collection to ensure that both major and minor landing sites were proportionately represented. The team conducted fish catch monitoring activities to evaluate project results in the same sites and months of subsequent years. A total of 15,000 to 25,000 fisheries catch and effort data were collected and processed during each baseline and monitoring event. ECOFISH collected catch samples from between 16 and 42 types of fishing gear in the focal areas across the eight MKBAs. Commonly used fishing gear included the simple hook and line, bottom-set gillnet, bottom-set longline, drift gillnet, and multiple handlines.
Catch rates were based on the average catch per unit effort (CPUE) of selected fishing gear in the focal areas. The average CPUE is the proxy estimate of fish biomass. The computation involved estimating percentage change in CPUE during the final assessment and comparing it to the baseline using fisheries-dependent methods. The average CPUE was estimated from the weighted average of CPUE of various fishing gear used during the three-month catch and effort monitoring using the number of samples as the weighting factor.
The second component tracked was the change in reef fish biomass of selected MPAs in the focal areas. The project conducted baseline assessments in 2013 in three selected MPAs in each focal areas of the eight MKBAs and repeated them the final assessment in 2017.
Table 2.16 shows the computed weighted average percent change for both CPUE and reef fish biomass per MKBA, and the weighted average percent change for the MKBAs. For the Project Key Result A, the percentage increase in fisheries biomass is about 24 percent.
ECOFISH COMPLETION REPORT 31

TABLE 2.16. WEIGHTED AVERAGE PERCENT CHANGE IN CPUE AND REEF FISH BIOMASS IN THE FOCAL AREAS OF THE EIGHT MKBAS DURING THE FISHERIES AND MPA BASELINE ASSESSMENTS CONDUCTED IN 2013 AND FINAL MONITORING IN 2017 AND THE ESTIMATED INCREASE IN FISHERIES BIOMASS
MKBA Average Percent Change
Weighing Factor (wc, wm)
% Increase in Fisheries Biomass
Calamianes Group of Islands
Catch Rates 6.58 4,786.78
23.79
Reef Fish Biomass 192.04 2,533.28
Danajon Reef Catch Rates 13.67 2,220.75 Reef Fish Biomass 136.62 2,159.20
Lingayen Gulf Catch Rates* 39.96 3,909.16 Reef Fish Biomass 24.08 209.60
Ticao Pass – Lagonoy Gulf – San Bernardino Strait
Catch Rates* -31.76 8,125.14
Reef Fish Biomass -27.03 986.39
South Negros Island Catch Rates* 36.32 11,091.02 Reef Fish Biomass -33.12 343.06
Surigao del Norte and del Sur
Catch Rates 109.05 3,781.76 Reef Fish Biomass 39.98 817.75
Sulu Archipelago Catch Rates 64.68 894.38 Reef Fish Biomass 21.99 2,761.20
Verde Island Passage Catch Rates* -30.66 9,150.88 Reef Fish Biomass 30.81 539.59
* 2015 was used as the reference point for catch rates in Lingayen Gulf, TP-LG-SBS, South Negros, and Verde Island Passage MKBAs to rectify sampling error incurred in 2013.
A total of 4,727 households were surveyed for the socioeconomic baseline assessment. The sample was set at a minimum of 500 households per MKBA for eight project sites. Random sampling was employed in choosing the individual households. The choice of barangays (or villages) was made consistent with the choice of barangays covered by the biophysical surveys. The surveys were repeated in Years 3 and 5 to track the changes, covering the same sample households. By Year 3 the sample size was reduced to 4,003, and by Year 5 the total number of original households that were still living in the same area was only 3,800. Not all of these 3,800 households were still harvesting seafood as their main source of livelihood by Year 5; this further reduced the sample size of the fishing households by the end of the project. For the SA MKBA, baselines had to be re-established in 2015 due to inconsistencies in data gathering and survey methods employed by the enumerators.
TABLE 2.17. NUMBER OF SAMPLE HOUSEHOLDS IN SELECTED MUNICIPALITIES IN THE EIGHT MKBAS SURVEYED DURING THE BASELINE ASSESSMENT IN 2013, MONITORING EVENT IN 2015, AND FINAL ASSESSMENT IN 2017
Marine Key Biodiversity Area No. of Sample Households
Year 1 Baseline Assessment 2013
Year 3 Monitoring Event 2015
Year 5 Final Assessment 2017
Calamianes Group Islands 542 502 450 Danajon Reef 800 599 649 Lingayen Gulf 503 433 398 Ticao Pass – Lagonoy Gulf – San Bernardino Strait
720 594 579
ECOFISH COMPLETION REPORT 32

Marine Key Biodiversity Area No. of Sample Households
Year 1 Baseline Assessment 2013
Year 3 Monitoring Event 2015
Year 5 Final Assessment 2017
Southern Negros Island 544 465 446 Surigao del Sur/del Norte 507 386 352 Sulu Archipelago 537 537 522 Verde Island Passage 574 487 404 Total Sample 4,727 4,003 3,800
The increase in the number of people gaining employment or better employment are composed of the following:
a. Ten percent increase in the number of people gaining employment was measured through:
i. Number of households with increased fish catch, resulting from the monitoring surveys of 5,000 households across all eight MKBA. The hypothesis comes from the FISH project results, wherein increase in biomass translates into increases in fish catch and therefore increases in fish harvesting-related incomes. Fishing incomes were monitored through the baseline and monitoring assessments conducted in Years 1, 3, and 5.
ii. Number of households earning additional incomes from project interventions, as a proportion of the total number of households directly invited to participate in project interventions. This was based on the official definition of the indicator under Workforce Development of the USG’s List of Standard Indicators.
b. Ten percent increase in the number of people gaining better employment was measured through the survey of households, wherein the definition of better employment consisted of:
i. Improved seafood consumption, as a proxy of protein intake; ii. Improved awareness/perceptions of conditions of and threats to marine resources, MPAs,
and enforcement activities; iii. Improved household savings or better expenditure patterns; iv. More fisherfolk using friendlier gears; and v. More fishers with decreased economic costs in fishing, including time travel and distance
from shore to fishing grounds.
Measurement of the number of people who gained employment from increased profits from fishing, as well as better employment, is shown in Table 2.18. For the Project Key Result B, the percentage increase (average of the eight MKBAs) in number of people who gained employment or better employment (ΔE) was 12 percent.
ECOFISH COMPLETION REPORT 33

TABLE 2.18. AVERAGE PERCENT CHANGE IN INDIVIDUAL INDICATORS IN THE FOCAL AREAS OF THE EIGHT MKBAS DURING THE SOCIOECONOMIC BASELINE ASSESSMENT IN 2013 AND FINAL MONITORING IN 2017 AND THE ESTIMATED INCREASE IN THE NUMBER OF PEOPLE GAINING EMPLOYMENT OR BETTER EMPLOYMENT
MK
BA
∆Net
pro
fit
∆Sav
ings
∆Sea
food
die
t
∆Enf
orce
men
t
∆MP
A
awar
enes
s an
d su
ppor
t
∆ E
nvir
onm
ent
perc
epti
on
∆Len
gth
of
fishi
ng t
rip
∆Tra
vel t
ime
∆E
CIG 4% -4% -33% 14% 32% -31% 16% 7% 11% DB -7% -3% 9% 1% 14% -60% 12% 12% -17% LG 9% 6% -10% -2% 13% -9% 19% 9% 20% TP-LG-SBS
0.4% -9% -12% 24% -8% -36% 3% 1% -11%
SN 28% 13% 28% -7% 3% -8% 34% 18% 35% SDN 1% 18% -18% 11% 33% -11% 21% 17% 39% SA -13% 18% -19% 2% 48% 16% 2% -1% 29% VIP 8% 1% -29% 6% 23% -1% 26% -18% 15% Average 3% 4% -8% 7% 18% -21% 8% 1% 12%
EAFM Benchmarks. In several meetings with the BFAR National Director, regional directors, and key BFAR units, the project team discussed priorities and scope of trainings to be conducted under the project. The group also discussed how these could be integrated into the proposed national LGU capacity building framework that BFAR wanted to implement to support development of technical and administrative capacity to absorb assistance packages provided by BFAR to the fisheries sector.
ECOFISH conducted benchmarking consultation workshops in all eight MKBAs. These brought together LGU partners and local representatives of national agencies and civil society to discuss the state of fisheries and coastal management and identify policy and capacity building priorities for their respective areas. The benchmarking workshops were able to draw on governance baselines (using pre-designed indicators) used to measure progress of LGU partners in developing their capacity for implementing EAFM. Based on the results of these workshops, ECOFISH designed and delivered site-appropriate policy development and training activities that were linked to other project interventions, such as the fisheries, biodiversity, and socio-economic assessments; MPA networking; and fisheries management planning.
In the succeeding years, ECOFISH assisted LGUs in conducting regular governance benchmarking to track progress in building capacity for various elements of EAFM. Improvement in benchmarks score is a determinant in assessing project Key Result F (LGUs with improved capacity to implement EAFM) and, indirectly, Key Result E (areas under improved management). Compared to the baseline assessment conducted in Year 1, the EAFM benchmark levels of the 53 LGUs monitored generally improved (Figure 2.1) in Year 5. Benchmark level 3 practically doubled in Year 5 while benchmark level 1 decreased by more than 30%.
ECOFISH COMPLETION REPORT 34

FIGURE 2.1. FREQUENCY DISTRIBUTION OF EAFM BENCHMARK LEVELS OF 53 LGUS IN 2017 (YEAR 5) RELATIVE TO 2013 BASELINE (YEAR 1)
The field experience in using the EAFM governance benchmarking led ECOFISH to fine tune the benchmarking tool to emphasize progress from LGU-initiated interventions to ecosystem-scale inter-LGU cooperation. The revised tool synchronizes with current BFAR programs such as FishR and BoatR. Finally, the revised tool includes a number of socioeconomic benchmarks to take into account the actions focusing on human well-being. The revised EAFM governance benchmarking tool is included as a toolkit under Deliverable 2.
Following the baseline assessment, ECOFISH held monitoring sessions prior to local and national elections and right after the election (near the end of the project). It has been established that an election is a major variable determining enforcement at the local level since the source of authority to enforce and the manner by which regulations are enforced are significantly dependent on local leaders. Fortunately, factors found in the local governance benchmarks such as creation of a fishery office, drafting of a fisheries management plan, and inter-local cooperation cushioned some of the adverse effects on field enforcement that often accompany a change of political regimes.
2.8 DELIVERABLE 8: SCIENTIFIC STUDIES ON SELECT MKBA-SPECIFIC FISH SPECIES
True to the practice of EAFM, ECOFISH used the information from the biophysical and socioeconomic data collection to establish eight trophic system models (one for each of the ECOFISH MKBAs), which
ECOFISH COMPLETION REPORT 35

served as platforms to initiate fishing effort configuration or the “right-sizing of fishing efforts” (under Deliverable 10). At the same time, the project assisted MKBA partners in the identification of focus species with particular importance in their areas (ecologically, economically, and for food security). ECOFISH conducted background studies for at least two focus species per MKBA. The project also conducted studies on the viability of mariculture species in the eight MKBAs, in consideration of the Philippine government’s prioritization of that field as a source of livelihood opportunities in the fisheries sector. These studies were also
intended to provide guidelines for sustainable mariculture and how to mitigate environmental impacts by establishing the appropriate carrying capacity in existing and potential mariculture areas. Furthermore, the project planned cost-benefit analysis (CBA) studies for 41 LGUs at the beginning of the project, and 43 studies were ultimately carried out over the life of project. Initially, the CBA studies were intended to be largely patterned after that done by the FISH project for Ubay, Bohol, to demonstrate the economic and financial benefits that can be achieved with consistent and appropriate coastal resources management. During the course of the project, however, ECOFISH developed a novel approach of linking valuing resources with MSP interventions (under Deliverable 10) via an area-based valuation, whereby the values of the different zones as delineated in the MSP are determined. This additional layer of information in the MSP can further support the planning and decision-making by enabling planners to assess which uses bring in the most benefits per unit area, determine how the benefits and costs of the different uses are distributed across a system-wide scale, and provide the economic basis for implementing revenue-generating schemes (e.g., as user fee systems).
TABLE 2.19. DELIVERABLE 7 – SCIENTIFIC STUDIES ON SELECT MKBA-SPECIFIC FISH SPECIES
Project Intervention/Activity Target (Scale) Accomplished Establish trophic interaction and appropriate fishing effort configuration in the focal areas of the MKBAs
8 (1 per MKBA) 9
Identify species-specific or fishing gear studies for management interventions in the MKBAs from baseline assessments
16 (2 per MKBA)
21
Assess and evaluate the viability of mariculture species (with preference toward lower trophic-level species)
8 (1 per MKBA) 8
Establish mitigation measures for mariculture activities 8 (1 per MKBA) 8
An enumerator measures landed blue swimming crabs during the one-year pilot study that applied the Length-Based Spawning Potential Ratio (LB-SPR) assessment to evaluate the sustainability of the blue swimming crab fishery in the Danajon Reef.
ECOFISH COMPLETION REPORT 36

Project Intervention/Activity Target (Scale) Accomplished Determine economic values and perform CBA in MKBA focal area LGUs
41 LGUs 43
Team Lead: Senior Fisheries and Coastal Resource Management Specialist, MERF, Senior Resource Economics Specialist Key Partners: SEAFDEC, university network (SAF may be used to support these institutions)
KEY ACTIVITIES/ACCOMPLISHMENTS
The team utilized Ecopath with Ecosim (EwE), a free trophic modeling software designed to evaluate ecosystem effects of fishing and explore management policy options for various fisheries scenarios in an exploited marine ecosystem. In Years 1 and 2, activities focused on data gathering and literature review to support the development of four trophic models for the project’s focal areas in Danajon Reef, Calamianes Group of Islands, Surigao del Norte, and Sulu Archipelago MKBAs.
By Years 3 and 4, ECOFISH’s development of the trophic models was informed by complementary species-specific and value chain studies conducted by the project to improve fisheries management. For example, the trophic models for the Verde Island Passage and Ticao Pass – Lagonoy Gulf – San Bernardino Strait MKBAs focused on the small pelagic fisheries, the Danajon Reef model on the coral reef and demersal fisheries, and the South Negros model on interactions between the small and large pelagic fish groups that are prominent in the area. The incorporation of the socioeconomic fisheries data completed the model parameter inputs with three distinct fishing effort configuration scenarios simulated for each trophic model. One scenario maximized the ecosystem structure (i.e., favors the biomass recovery of exploited apex predators and large fishes in the system); the second scenario maximized the net profits from the entire fishery regardless of who or which user/gear group benefits; and the third scenario maximized the direct fisher jobs operating within the system. These initial scenarios served as the basis for partners to determine the right-size fishing effort in their respective MKBAs (Deliverable 10). In addition, the models proved useful in validating some early fisheries management actions of the project (Box 2).
Based on initial stakeholder consultations and the results from the fisheries baseline assessment surveys, candidate species for species-specific management were identified (see Table B-4). The project compiled secondary biological information available in literature to supplement the information collected from the ECOFISH baseline surveys. Destructive and illegal fishing gear was commonly cited in all MKBAs and was the obvious candidates for management interventions via enhanced fishery law enforcement.
ECOFISH COMPLETION REPORT 37

In the end, the project conducted 21 studies to support species-specific or gear-specific management interventions. Box 3 highlights where species-specific and gear-specific studies were taken further to promote objective and science-based management decisions, policy, and action.
ECOFISH contracted scientists from the Southeast Asian Fisheries Development Center (SEAFDEC) to review the previous studies on viability of mariculture species in former sites of the FISH project and to conduct similar studies for the other remaining MKBAs in Years 3 and Year 4. Delays in the availability of technical personnel and funding moved back the activities through to Year 5. Nevertheless, all eight viability studies were completed with corresponding support measures for mitigation and management of both current and future mariculture activities in the focal areas of the MKBAs. Results from the previously conducted viability studies were used to pilot mariculture ventures in select MKBAs. In the Calamianes Group of Islands MKBA, for example, sea cucumber has been identified for sea ranching and was piloted in Year 3 as a social enterprise activity (see Deliverable 13).
In lieu of general CBAs for 41 LGUs, ECOFISH conducted economic valuation studies for the major marine zones identified in their marine spatial plans (see Deliverable 10): fishing grounds, mariculture zones, recreation zones, coral reef MPAs, mangrove forests, and in the case of Calamianes Group of Islands MKBA, indigenous partner zones. The plans were developed to harmonize the various uses in the marine environment. In support of these, the project conducted valuation studies to aid further policy and legislation in determining allowable uses and zone boundaries by providing a snapshot of the
BOX 2: ECOSYSTEM MODELS COMPLEMENT LOCAL FISHERIES MANAGEMENT
After the second round of fisheries monitoring and with some species-specific or gear-specific management interventions already initiated, the Senior Fisheries and Coastal Resources Management Specialist was able to test the robustness of the trophic models by validating independent results of species-specific study surveys and by exploring how the model would respond to simulated changes in fishing effort that reflect the planned management interventions. Key examples are as follows: • The earliest trophic model from the Danajon Bank (north Danajon municipal waters covering Talibon, Bien
Unido, Ubay, and Pres. CPG) was able to predict the observed reductions in blue swimming crabs catches after subsequent increases in fishing effort directed at the blue swimming crabs resources in the area. The Danajon LGUs are now taking part in intensified management of the blue swimming crabs together with BFAR 7 and PACPI.
• Using the CIG base model as a platform, simulated changes in the fishing effort of bag net or basnig operators in Coron Bay indicated a fishing effort that may already be close to fishing mortality rate at maximum sustainable yield (fMSY). This finding corresponded to the basnig operators’ observations of recent catch trends, which prompted them to apply the precautionary principle and agree to limit the total number of basnig operations in Coron Bay to no more than the existing number of units. ECOFISH assisted in drafting the ordinance to regulate the number of basnig operations in Coron Bay even before the formal orientation of fishing effort right-sizing (Deliverable 10).
• Using the VIP (Balayan Bay) base model as a platform, potential increases in pelagic fish biomasses were predicted as a consequence of a full implementation of the seasonal closure in small pelagics fisheries. Significantly, not only were the small pelagics predicted to demonstrate steady biomass increases over the years, but the medium to large pelagic fish stocks were predicted to bounce back as well, due to the combined effects of reduced fishing mortality and increased prey availability. Results from the reproductive biology survey and fish catch monitoring following the seasonal closure were in agreement with the model predictions. These results were presented to the stakeholders during the consultation meetings prior to the succeeding implementation of the seasonal closure. This scientific backing convinced the majority of the Balayan Bay LGUs to continue with the initiative.
ECOFISH COMPLETION REPORT 38

net benefits enjoyed for each type of use. The net present values (NPVs1) can be used to aid in resolving conflicts among uses by showing how much can be gained or lost if rezoning takes place. They can also be used as basis for setting fines for violations specified in their respective marine spatial plans.
TABLE 2.20. NPVS OF MAJOR MARINE ZONES ESTIMATED FROM ECONOMIC VALUATION STUDIES CONDUCTED IN SELECTED MUNICIPALITIES OF THE EIGHT MKBAS
MKBA No. of LGUs
Total Area (ha)
NPV/ha (2015 PhP) 12% SDR
NPV/ ha (2015 PhP) 0.1% SDR*
CIG 4 1,161,533 62,871 176,802 DB 5 86,869 282,456 794,301 LG 6 86,318 82,268 231,349 TP-LG-SBS 6 199,597 122,867 345,516 SDN 6 122,383 96,504 271,382 SNI 7 337,715 39,859 112,090 VIP 9 162,707 42,548 119,652 * Social discount rates (SDRs) are the interest rates used in cost-benefit analyses of social projects.
Values for fishing grounds were derived from ECOFISH’s primary surveys, particularly for the revenues and costs per major type of fishing gear. Mariculture zones were hardly valued due to the negligible
1 Net present values (NPVs) are calculations that compare the present value of a sum of money with the future value of the same sum when invested with compound interest.
BOX 3: EXAMPLES OF SPECIES-SPECIFIC AND GEAR-SPECIFIC STUDIES LEADING TO BETTER-INFORMED MANAGEMENT AND POLICY
In Year 3, ECOFISH completed collection and analysis of gonadal maturity data in support of the proposed seasonal closure of small pelagics in Balayan Bay. The data was used to consult with stakeholders to evaluate the effective period and strategy of seasonal closure implementation, draft the appropriate legislation, and provide information for the proper compensation of the affected stakeholders. The result was the Pagpapahinga ng Look Balayan, a 22-day commercial fishing ban on small pelagic fishes within the Balayan Bay.
Also in Year 3, the project started a partnership with the Philippine Association of Crab Processors, Inc. (PACPI) and the National Fisheries Institute to conduct the Species Specific Assessment and Piloting of Spawning Potential Ratio Method for the Blue Swimming Crab in the Danajon Reef. The data collected was used to estimate the spawning potential ratio of the blue crabs along with other fisheries parameters that serve as reference points for managing the resource. The results were presented to partners and stakeholders, including BFAR 7. This led to a management agreement that includes gear-swapping measures to eliminate unsustainable fishing gear, the strengthening of government-led and private sector-driven development, and enforcement of policies and guidelines to manage blue crabs properly.
In Year 4, the project assisted LGUs in South Negros Island to conduct preliminary key informant surveys focusing on the beach seine fisheries in the area. The survey outcomes were used as starting point for consultation with stakeholders including beach seine fishers and operators to agree on a basic monitoring strategy for beach seine landings, and subsequently, to use the information to inform possible management and regulatory actions. Early in Year 5, the commitment of the South Negros Coastal Development Management Council (SNCDMC) to support the beach seine fisheries monitoring was formalized. At the same time, LGU Hinoba-an, where beach seine operations are primarily concentrated, has finalized and adopted a local ordinance implementing the seasonal operation of beach seines in the municipality to minimize the harvest of juvenile or undersized fish.
ECOFISH COMPLETION REPORT 39

number of users, except in the Calamianes Group of Islands MKBA where pearl farm operations were used (although admittedly undervalued in terms of their revenues). Coral reef MPAs were valued in terms of their spillover functions based on ECOFISH biomass estimates, shore protection functions, existence values, and in some cases, their recreational values through entrance fees based on willingness-to-pay (WTP) surveys. Mangrove forests were valued in terms of their functions as fish breeding grounds partly based on ECOFISH monitoring surveys, carbon sequestration functions, storm protection functions, and recreational values through entrance fees. Recreational zones were valued in terms of the reported revenues and costs associated with marine-based tourism establishments in the area. The costs were derived either from LGU financial statements, direct interviews with the users, or the project’s business planning exercise (see Deliverable 13). Finally, the SDRs used were based on two extremes: 0.1 percent, which accounts for ethical considerations and the hurdle rate being used by the National Economic Development Authority in determining feasibility of government programs and projects. For transparency purposes, both results were used by the valuation exercise.
ECOFISH initially presented the study results to the LGUs during the final stages of the project, to a highly positive response and acceptance of the usefulness of the results. In South Negros MKBA, the results were used to compute fines in a ship-grounding incident in Sipalay immediately following the submission of the report. In Calamianes Group of Islands, the results are being used as reference for future long-term lease agreements with pearl farms. In Ticao Pass – Lagonoy Gulf – San Bernardino Strait MKBA, the BFAR regional office is interested in extending the CBA process to cover all municipalities surrounding the MKBA. More importantly, in all project sites the LGUs saw the value of good record-keeping, as well as the opportunity costs of undervaluing the importance of sustainable uses of marine zones. The potential for revenue generation and equitable distribution of benefits through proper management of their coastal resources was demonstrated through the valuation exercise. The project officially submitted final reports during the MKBA summits conducted in the last quarter of project implementation.
As a way of scaling up scientific advice for fisheries management beyond ECOFISH focal areas, ECOFISH provided guidance to NSAP Region 4-B on conducting studies and developing plans for the management of round scad (Decapterus spp.) fisheries in Palawan. This also included advice to the TWG on options for a seasonal closure. The first closed season was eventually implemented between November 15, 2015, and January 30, 2016, in northern Palawan.
2.9 DELIVERABLE 9: MPA NETWORK ANALYSES IN THE EIGHT MKBAS
One of ECOFISH’s first management interventions was to establish and strengthen MPAs. MPAs serve not only as a venue for partner and stakeholder engagement, but also as a laboratory for learning the concepts of fisheries management. Consequently, the project was able to use the quantifiable increases in reef fish biomass and biodiversity and the improvements of coral cover within the MPAs as yardsticks of project performance.
In applying EAFM, the project recognized the system-wide scale of the environmental and other bio-physical factors that affect the successful functioning of MPAs and the trans-boundary nature of the potential benefits of well-managed MPAs. Recent studies have demonstrated how even a network of small MPAs can magnify positive impacts by enabling individual MPAs to benefit from each other’s adult spill-over. This in turn results in a recruitment subsidy across the entire system, subsequently
ECOFISH COMPLETION REPORT 40

replenishing the exploited stocks in the fishing grounds. Further, an MPA network can act as a buffer against complete deterioration of one or several MPAs (e.g., physical destruction as a result of severe storms), as unaffected MPAs can provide biological seed products to facilitate the recovery of damaged MPAs in a network. ECOFISH aimed to develop eight MPA network designs that applied ecological, social, and governance principles as a means of scaling up not only the management of MPAs but also the benefits that can be derived from conservation and protection activities (including climate change adaptation and resiliency).
Eight hydrodynamic studies,2 dispersal models, and fish plankton studies aimed to characterize circulation patterns
in scales relevant to the dispersal of fish larvae within the ECOFISH MKBAs. The dispersal models and fish plankton studies also yielded information that identified the ichthyoplankton species and their general distribution within the waters of the MKBAs. These studies served as key inputs to one of the main ecological principles in designing and improving the ecological function of MPA networks.
Activities conducted for this deliverable all contributed toward the establishment and strengthening of MPA networks. These preparatory and support activities demonstrated how MPA networking applies the EAFM and how networking is expected to yield magnified ecological (encompassing temporal and spatial scales), social (resolution of conflicts), and economic (efficient use of resources) benefits.
TABLE 2.21. DELIVERABLE 9 – MPA NETWORK ANALYSES IN THE EIGHT MKBAS
Project Intervention/Activity Target (Scale) Accomplished Conduct hydrodynamic study and dispersal modeling 1 per MKBA 8 Conduct fish plankton studies 1 per MKBA 8 Develop MPA network design (includes CCA strategies) 1 per MKBA 8 Establish MPA networks in new MKBA focal areas 1 per MKBA 4 Strengthen MPA networks in existing MKBA focal areas 1 per MKBA 4 Team Lead: Senior Fisheries and Coastal Resource Management Specialist, MERF
2 As of project close, these studies were in the process of being approved.
Participants in the MPA Network Design Training evaluate their current MPAs and MPA network based on ecological design principles. The resulting map was a spatial representation of the updated MPA network design and color classification of individual MPAs by criteria used in the evaluation and corresponding action plans. This approach guides stakeholders to maintain and adjust size or shape, and improve management, remove, transfer, or identify a potential site for new MPAs.
ECOFISH COMPLETION REPORT 41

Project Intervention/Activity Target (Scale) Accomplished Key Partners: University network (SAF may be used to support these local colleges/universities)
KEY ACTIVITIES/ACCOMPLISHMENTS
ECOFISH Years 1–3 were dedicated to providing technical assistance to LGU partners in the establishment and strengthening of individual MPAs. These included a series of trainings for MPA guards and trainings on the use of the MPA Monitoring Effectiveness Assessment Tool (MEAT). At the same time, the project focused on completing the hydrodynamic and dispersal models through MERF and University of the Philippines in the Visayas Foundation, Inc. (UPVFI). Hydrodynamic studies, dispersal models, and fish plankton studies for the Calamianes Group of Islands, Danajon Reef, Surigao (Lanuza Bay), and Sulu Archipelago (Tawi Bay) systems were developed under the FISH project. These were readily utilized for the analysis, establishment, and/or strengthening of the network of MPAs in these MKBAs. In Year 3, ECOFISH completed the same studies for the rest of the MKBAs (Lingayen Gulf, Verde Island Passage, Ticao Pass – Lagonoy Gulf – San Bernardino Strait, and South Negros). For the Surigao MKBA, however, the focal area was moved from Lanuza Bay in Surigao del Sur to the alliance of LGUs in Surigao del Norte as requested by BFAR Caraga Region. As a result, ECOFISH developed the same studies for the Surigao del Norte focal area waters in the later part of Year 4. The team then used these models as inputs to the MPA network design trainings and workshops to either establish new MPA networks or strengthen existing ones.
Early in Year 4, the team conducted a training workshop facilitated by MERF of the UPMSI to introduce the MPA network design concepts, discuss ecological principles governing MPAs and MPA network designs, and apply these concepts and principles to ECOFISH site conditions. The team further refined the ecological design principles and decision-support criteria. The Danajon Reef MPA network was chosen as the pilot study area and a two-day training workshop (under Deliverable 14) was conducted with local partners in March 2016. Key workshop outputs pertain to the identification of the critical and relevant ecological principles that will greatly improve the functioning of the existing MPA network. The partners then used these ecological principles, along with standard social and governance monitoring tools for MPAs (i.e., MEAT), to identify areas that need improvement and ultimately develop and carry out the corresponding municipal action plans (Box 4).
The Danajon workshop resulted in the development of a case study to demonstrate the application of ecological, social, and governance principles in strengthening individual MPAs and in designing an MPA network. This likewise resulted in the development of a draft training guide that was used by the project
BOX 4: TRANSLATING MPA NETWORK DESIGNS INTO ACTIONS FOR MPA NETWORK ESTABLISHMENT AND STRENGTHENING
In the months following the MPA Network Design Workshop, UPVFI, in partnership with Bohol Island State University (BISU), provided the necessary technical assistance in the form of underwater surveys, basic monitoring and assessment trainings, and community consultations in order to carry out the action plans. Within five months’ time, UPVFI and BISU led the partners in a final workshop to further refine and then consolidate the municipal action plans of all five focal municipalities into a unified Western Danajon MPA Network Action Plan for 2017. An MPA Management Network was subsequently formed. Elected officers of the management network passed a resolution to adopt the MPA Network Action Plan across all member municipalities. This was formalized with the signing of an MoU by the local chief executives of the five municipalities, representatives of the partner agencies, and the chairpersons of the five municipal MPA Networks.
ECOFISH COMPLETION REPORT 42
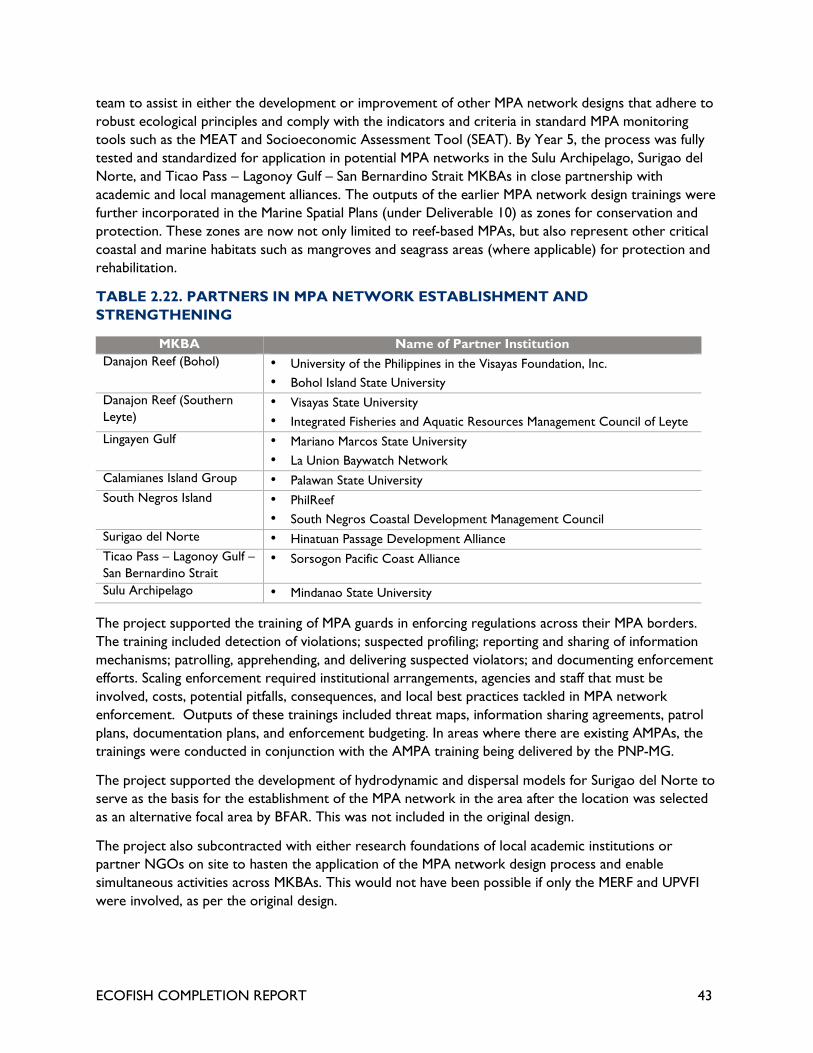
team to assist in either the development or improvement of other MPA network designs that adhere to robust ecological principles and comply with the indicators and criteria in standard MPA monitoring tools such as the MEAT and Socioeconomic Assessment Tool (SEAT). By Year 5, the process was fully tested and standardized for application in potential MPA networks in the Sulu Archipelago, Surigao del Norte, and Ticao Pass – Lagonoy Gulf – San Bernardino Strait MKBAs in close partnership with academic and local management alliances. The outputs of the earlier MPA network design trainings were further incorporated in the Marine Spatial Plans (under Deliverable 10) as zones for conservation and protection. These zones are now not only limited to reef-based MPAs, but also represent other critical coastal and marine habitats such as mangroves and seagrass areas (where applicable) for protection and rehabilitation.
TABLE 2.22. PARTNERS IN MPA NETWORK ESTABLISHMENT AND STRENGTHENING
MKBA Name of Partner Institution Danajon Reef (Bohol) • University of the Philippines in the Visayas Foundation, Inc.
• Bohol Island State University Danajon Reef (Southern Leyte)
• Visayas State University • Integrated Fisheries and Aquatic Resources Management Council of Leyte
Lingayen Gulf • Mariano Marcos State University • La Union Baywatch Network
Calamianes Island Group • Palawan State University South Negros Island • PhilReef
• South Negros Coastal Development Management Council Surigao del Norte • Hinatuan Passage Development Alliance Ticao Pass – Lagonoy Gulf – San Bernardino Strait
• Sorsogon Pacific Coast Alliance
Sulu Archipelago • Mindanao State University The project supported the training of MPA guards in enforcing regulations across their MPA borders. The training included detection of violations; suspected profiling; reporting and sharing of information mechanisms; patrolling, apprehending, and delivering suspected violators; and documenting enforcement efforts. Scaling enforcement required institutional arrangements, agencies and staff that must be involved, costs, potential pitfalls, consequences, and local best practices tackled in MPA network enforcement. Outputs of these trainings included threat maps, information sharing agreements, patrol plans, documentation plans, and enforcement budgeting. In areas where there are existing AMPAs, the trainings were conducted in conjunction with the AMPA training being delivered by the PNP-MG.
The project supported the development of hydrodynamic and dispersal models for Surigao del Norte to serve as the basis for the establishment of the MPA network in the area after the location was selected as an alternative focal area by BFAR. This was not included in the original design.
The project also subcontracted with either research foundations of local academic institutions or partner NGOs on site to hasten the application of the MPA network design process and enable simultaneous activities across MKBAs. This would not have been possible if only the MERF and UPVFI were involved, as per the original design.
ECOFISH COMPLETION REPORT 43

2.10 DELIVERABLE 10: FISHERIES MANAGEMENT PLANS OF SELECT INTER-LGU ALLIANCES IN THE EIGHT MKBAS
While the basic spatial and governance scale of ECOFISH is the municipal waters of the LGUs, an ecosystem is often a body of water shared by several neighboring LGUs. For the coastal and fisheries resources management (CFRM) planning process, the key is to develop integrated management plans for a cluster of LGUs and, as much as possible, scale them up to the MKBA level. The team will link the MKBA to other LGU collaborative initiatives, such as inter-LGU enforcement operations, comprehensive bay-wide fisheries use zoning, and institution and allocation of appropriate levels of fishing effort for shared fishing grounds. ECOFISH aims to strengthen ecosystem-wide management
planning and implementation processes through inter-LGU alliances. The team pushed for the creation and strengthening of bay-wide management councils or alliances of clusters of municipalities. Inter-LGU fisheries management plans would serve as the road map for inter-LGU alliances to conduct MKBA-wide fisheries management, which would be adopted and implemented by the respective member LGUs at the local level.
The project supported municipal and city government units in the establishment of their coastal and fishery law enforcement teams in compliance with the Local Government Code. An established fishery law enforcement team would mean that there is a signed legal instrument that supports the creation of a team, a clear organizational set-up and leadership structure, a coordinator from within the LGU, and a budget. In areas where there were already duly established and appropriately created Municipal Enforcement Teams such as Verde Island Passage, Calamianes Group of Islands, Danajon Reef, and South Negros, ECOFISH provided them with assistance through skills enhancement training, enforcement planning, and inter-local confidence building.
MSP is another inter-LGU planning process that ECOFISH facilitated in all eight MKBAs. In applying EAFM, the project recognized that the coastal and marine environments host a multitude of activities and uses other than fishing (e.g., tourism and recreation, transportation of people and goods, and biodiversity conservation) that may also impact on the marine ecosystem’s productive capacity to support the fisheries. Policies should thus be in place to ensure the compatibility and appropriateness of the various activities and uses and to minimize any of the potentially harmful impacts. This necessitates a system-wide and cross-sectoral approach in management. The MSP process provides the spatial
The series of site validation activities and stakeholder consultation workshops were integral to the Marine Spatial Planning process. A wider group of stakeholders were reached for their inputs during these visits, which ensured the accuracy and appropriateness of the planned zonation schemes.
ECOFISH COMPLETION REPORT 44

dimension and acts as a consolidating tool for the inter-LGU or MKBA-wide fisheries management interventions and priority actions. The MSP approach was tested during the FISH project and drew from the experiences of earlier sea use zoning and MSP initiatives in the Philippines and other countries. A major output is an inter-LGU marine spatial plan or LGU zoning schemes with harmonized zoning guidelines across the MKBA.
ECOFISH intended to provide scientific support for EAFM and set itself apart from mainstream management interventions by applying cutting-edge ecosystem modeling software for EAFM planning. Specifically, the trophic model outputs and fishing effort configuration simulations (from Deliverable 8) helped to quantify key components of the ecosystem, especially of living groups exploited by fisheries, and how the various fisheries activities impacted standing biomass, production, optimum yields, natural mortality, and trophic structure. The simulations likewise examined the impacts of various fishing effort configuration scenarios on the corresponding fisheries profits and numbers of direct user-beneficiaries (fishers) MKBA-wide. These scenarios then served as the platform for partners to build other scenarios for fishing effort configuration to examine the potential tradeoffs between the ecosystem structure and socioeconomic fisheries benefits. Stakeholders from the MKBA focal areas reached a consensus on the “right-size” of fishing effort in their respective fisheries systems and the fishing effort allocation that they deemed as the most realistic, workable, and acceptable compromise between the ecological and socioeconomic fisheries management objectives. The goal of right-sizing fishing effort is to inform the fisheries registration and licensing policies of the LGUs in the MKBAs such that the MKBA-wide targets and LGU gear configuration were incorporated into the integrated fisheries resource management (IFRM) plans.
The incorporation of vulnerability and risk assessments also needed to be able to consider not only climate change adaptation strategies, but also strategies to respond to destructive human activities. For this sub-deliverable, the project focused on coastal vulnerability assessment and relevant CTI themes, namely MPAs and climate change adaptation, as climate change is expected to exacerbate the declining condition of coastal and fisheries resources. In this regard, ECOFISH recognized that inter-LGU coastal and fisheries management-related planning workshops could initiate the first steps in addressing broad ecosystem-wide issues in a more collaborative and holistic manner, which in turn could promote adaptation strategies that address the potential impacts of climate change. The priority strategies and actions are part of the Inter-LGU Fisheries Management Plans.
TABLE 2.23. DELIVERABLE 10 – FISHERIES MANAGEMENT PLANS OF SELECT INTER-LGU ALLIANCES IN THE EIGHT MKBAS
Project Intervention/Activity Target (Scale) Accomplished Conduct integrated coastal and fisheries management planning for cluster of municipalities or LGU alliances
8 (1 per MKBA) 8
Provide scientific and technical support in the establishment of coastal and fisheries law enforcement teams (new sites)
19 LGUs 11*
Provide technical support to strengthen coastal and fisheries law enforcement teams (former FISH sites)
22 LGUs 30*
Build/strengthen inter-LGU regulatory compliance and enforcement capabilities
8 (1 per MKBA) 8
Develop marine spatial zoning plan 8 (1 per MKBA) 8 Establish appropriate fishing effort configuration for focal areas in the MKBAs 8 (1 per MKBA) 8 Utilize registration and licensing information in managing fishing effort (integrated into the management plans)
41 LGUs 44
ECOFISH COMPLETION REPORT 45

Project Intervention/Activity Target (Scale) Accomplished Conduct risk assessment and hazard mapping with partners for climate change adaptation
41 LGUs 41
Integrate climate change adaptation into the management plan 41 LGUs 60 Team Lead: Deputy Chief of Party, Senior Fisheries and Coastal Resource Specialist, Regulation and Enforcement Specialist Key Partners: BFAR regional and provincial offices, provincial governments and PNP
* These two deliverables have a combined total of 41. As 30 enforcement teams were already in existence, only 11 needed to be established.
KEY ACTIVITIES/ACCOMPLISHMENTS
In Years 1 and 2, ECOFISH revisited the implementation of the integrated management plans of former FISH sites and revived key elements of inter-LGU arrangements in the FISH focal areas, while initiating the establishment of inter-LGU alliances in the other four MKBAs. In Years 3 and 4, the project team accomplished inter-LGU fisheries management planning to cover all focal areas of the eight MKBAs. The planning workshops were conducted during the feedback discussion of baseline assessment and subsequent monitoring results to partners. With the baseline assessment results and EAFM governance benchmarks as foundations for planning, the team facilitated the identification of inter-LGU and individual LGUs’ specific coastal and fisheries resources management priority items. These then formed the backbone of the Inter-LGU Fisheries Management Plans and the creation/strengthening of inter-LGU fisheries management alliances (Box 5).
In partnership with BFAR and the National Oceanic and Atmospheric Administration (NOAA), the project pilot tested a standardized EAFM training curriculum in the Ticao Pass – Lagonoy Gulf – San Bernardino Strait MKBA focal area (Deliverable 5). The final output was a comprehensive EAFM Plan that is equivalent to an Inter-LGU Fisheries Management Plan for both the focal and non-focal LGUs of the Ticao Pass – Lagonoy Gulf – San Bernardino Strait MKBA. .
BOX 5: FORGING INTER-LGU ALLIANCES FOR INTEGRATED FISHERIES MANAGEMENT
As a result of the EAFM planning in the Ticao Pass – Lagonoy Gulf – San Bernardino Straits MKBA, ECOFISH assisted the Sorsogon TWG to convene and strengthen the Integrated FARMC covering the municipalities of Prieto Diaz, Gubat, Bulusan, Sta. Magdalena, Matnog, and Bulan. The assistance led to the establishment of the Sorsogon Pacific Coast Alliance (SoPCA), an inter-LGU fisheries management alliance composed of seven coastal LGUs of the Province of Sorsogon. The EAFM Plan of the Ticao Pass – Lagonoy Gulf – San Bernardino Straits MKBA is heavily referenced in the SoPCA’s manual of operations due for final review and approval by mid-2017.
In the Sulu Archipelago MKBA, the EAFM orientation and inter-LGU fisheries management planning resulted in the drafting of a memorandum of agreement between the three focal LGUs of Bongao, Simunul, and Panglima Sugala for collaborative fisheries management of Tawi-tawi Bay. Bongao and Simunul LGUs have already signed the MOA.
In March 2017, the SNCDMC in the South Negros Island MKBA organized a planning workshop to come up with their five-year Integrated Coastal Resource Management Plan incorporating the individual plans of the three member LGUs—Cauayan, Sipalay City, and Hinobaan. This served as an avenue for the project to present the Integrated Fisheries Resource Management Plan (IFRMP) as a planning framework. The priority management strategies identified in the IFRMP, including MPA networking, marine spatial planning, and right-sizing of fishing effort, were adopted as key strategies for management both at the level of the alliance and of
ECOFISH COMPLETION REPORT 46

Based on the baseline assessment conducted, many municipalities and cities have existing fishery enforcement programs in place, but mostly on an ad hoc basis. In response, ECOFISH focused on the creation of municipal enforcement units through an ordinance, a section within a fishery ordinance, or an executive order. The ECOFISH’s enforcement team likewise assisted the LGUs to improve on vague compliance promotion sections of their ordinances. For the training component to strengthen the enforcement teams, the project identified resource speakers and trainers from members of established enforcement groups in the MKBAs and former FISH sites with exemplary public speaking skills and actual field experience. In partnership with the National Mapping and Resource Information Administration (NAMRIA), the project was not only able to train municipal enforcement units on navigation and plotting but trainees were ultimately certified by the NAMRIA as proficient in the use
of global positioning system and plotting locations on charts. These new skills and corresponding authority enabled these enforcement teams to assist in the successfully prosecution of fishery law violations, especially those that involved unauthorized fishing.
Inter-LGU enforcement mechanisms were already in place in some of the MKBAs prior to ECOFISH assistance: the Coastal Law Enforcement Council (Danajon Reef), Batangas Bantay Dagat Network (VIP), Coastal Law Enforcement Council (Negros Oriental), and Coastal Resources Management and Development Alliance (Negros Occidental). The project worked with these existing arrangements to further strengthen ties among them. These resulted in increased budgetary allocations for enforcement activities, more efficient enforcement of the seasonal closure for small pelagics (particularly in the case of VIP), increased participation by provincial police, and increased prosecution of fishery cases (particularly in the case of Negros Oriental).
On the other hand, the project was directly responsible for the creation of the Lingayen Gulf Baywatch Alliance for Responsible Fisheries, Surigao Anti-Illegal Fishing Task Force, HIPADA Enforcement
Integrated fisheries resource management planning workshops identified priority coastal and fisheries management action items at both the inter-LGU and the individual LGU levels. Management actions were further classified by EAFM governance benchmarks.
ECOFISH COMPLETION REPORT 47

Alliance, and Provincial Anti-Illegal Fishing Taskforce of Tawi. The assistance provided by the project helped to build inter-LGU alliances delivered in the form of confidence-building meetings and workshops, drafting of MoUs, and training members on enforcement planning and carrying out joint operations.
In Years 1–3, ECOFISH revisited and reviewed the fisheries use zoning plans of LGU clusters in former FISH project sites. A series of workshops and site validation activities were carried out to incorporate revisions and updates in the marine spatial plans or municipal water zoning schemes of partner LGUs in CIG, Danajon Reef (Bohol and Southern Leyte), Sulu Archipelago (to include the three new LGUs), and Surigao MKBAs. MSP activities in the other four ECOFISH MKBAs commenced in Year 2, with the project’s Senior FCRM and GIS Specialists taking the lead. All MSP trainings were completed by Year 4, and the resulting MSP plans were adopted by the LGUs in various ways (Box 6).
During the course of project implementation, ECOFISH developed a novel approach of integrating CBA studies (complementary to Deliverable 8 and Deliverable 13) into the MSP process via an area-based valuation, whereby the use values of the different zones were computed.
Workshops on inter-LGU fishing effort configuration scenario evaluation, negotiation, and consensus-building were successfully conducted in the Danajon Reef (western and north LGUs), Calamianes Group of Islands, Surigao del Norte, Verde Island Passage (Balayan Bay), South Negros Island, Lingayen Gulf (La Union LGUs), Sulu Archipelago, and Ticao Pass – Lagonoy Gulf – San Bernardino Strait MKBAs to complete the right-sizing trainings and fishing effort allocation in all eight MKBAs. The workshops resulted in nine distinct fishing effort configurations (one for each MKBA except Danajon Reef, which had two). MKBA-wide fishing effort configuration targets were determined and agreed upon collectively by the partners during these workshops. Through an iterative process of scenario evaluations using the Ecosim module of EwE modelling package, the LGUs were able to weigh the ecological and socioeconomic tradeoffs depicted in the various scenario options to reach a consensus. With the agreed MKBA-wide targets as a base, the LGUs then set their own gear limits or caps through a facilitated gear trading and negotiation workshop. Box 7 highlights specific outcomes and agreements from the inter-LGU negotiations during the right-sizing workshops. In the end, 52 LGUs participated in the right-sizing workshops (including non-focal LGUs in some MKBAs) and have set their respective fishing gear allocation targets to inform their fisheries registration and licensing—the first ever effort-based fisheries license control intervention in the country—to address overcapacity in fisheries. Of the 52 LGUs, only
BOX 6: HIGHLIGHTS IN THE LOCAL ADOPTION OF THE MARINE SPATIAL PLANS
• The LGUs in Danajon Reef incorporated their updated municipal water zoning plans in their CRM Codes or comprehensive municipal fisheries ordinances, which underwent timely review and updating in 2015–2016.
• In the Calamianes Group of Islands MKBO, the water use zones as defined in the marine spatial plans were adopted by the Environmentally Critical Areas Network (ECAN) of Palawan as integral in its overall zoning strategy. Since then, the plans have been used as basis for the establishment of additional MPAs in Linapacan, Coron, and Busuanga. It also served as an instrument for conflict resolution between fishers and pearl farm operators, and between seaweed growers and dugong conservation activities in Busuanga. It likewise served as the basis for spatial delimitation of resource use in Coron (Basnig operations) and as a reference for the collection of environmental fees from MPA visitors.
• LGUs in the South Negros MKBA are testing the use values that were incorporated into the marine spatial plan in planning and policy work, particularly in determining penalties and fines for potential violations of zoning ordinances.
ECOFISH COMPLETION REPORT 48

44 LGUs either: (a) signed the joint declaration to support right-sizing of fishing effort as a strategic priority to sustain fisheries benefits via fisheries registration/licensing; or (b) incorporated into the inter-LGU fisheries management plans the right-sizing of fishing effort as a priority management action.
In September 2013, MEF facilitated a five-day training on coastal vulnerability assessment (VA) and CCA for fisheries experts to test and refine the coastal VA tools. Participating LGUs, site coordinators, and agency partners were oriented on basic CC and VA concepts and the potential effects of climate change on fisheries. They were also introduced to the coastal VA tools and were able to perform actual desktop exercises using these tools. Lastly, they were oriented on the process of mainstreaming CCA in their local plans. The participating LGUs mapped out their immediate next steps post-training. Significantly, participating partners from VIP were able to follow through with their outlined next steps, which resulted in a draft CCA plan dedicated to climate-proofing coastal resources management in the Batangas Province.
As a means of mainstreaming CCA, the IFRM plans (Deliverable 10.1) and the marine spatial plans (Deliverable 10.5) have inherently incorporated priority strategies and actions that promote inter-LGU collaboration under an integrated ecosystems-based management approach. The IFRM plans of the eight MKBAs include sub-sections that detail how it and the MSP respond to, complement, and/or operationalize the CCA priorities and strategies outlined by the National Climate Change Adaptation
BOX 7: RIGHT-SIZING OF FISHING EFFORT WORKSHOP AND POST-WORKSHOP HIGHLIGHTS
• In addition to setting the municipal fishing gear allocation, the South Negros Island LGUs also agreed to finally set a limited number of small-medium scale ring nets to operate within 10.1 km of municipal waters in LGUs where this is allowed via legislation. BFAR Regions 6 and 7 have agreed to work closely with the LGUs in South Negros Island regarding this matter and to provide them with information on which vessels have been issued licenses. This is the first demonstration of right-sizing application to cover both municipal and commercial fishing gear operating within a shared fishing ground.
• Following the right-sizing workshops in Surigao del Norte MKBA, ECOFISH and BFAR provided technical assistance to the LGUs of Gigaquit, Bacuag, Taganaan, and Placer to conduct consultations with fisherfolk, coastal barangay constituents, and other relevant stakeholders. The project presented the technical aspect of right-sizing, the effects of using appropriate fishing gears on the ecosystem and the fisheries in Hinatuan Passage, and the disparate distribution of benefits when illegal/destructive gear remain operational. Convinced by the results, the LGUs and fisherfolk agreed to move forward and adopt mechanisms in the implementation of fishing effort right-sizing in order to appropriate fisheries access to the rightful users and beneficiaries, such as municipal fisheries registration and licensing. The LGUs committed to providing alternative livelihoods to fishers who may be potentially displaced in the short term, following the implementation of the limited licensing scheme. For its part, the BFAR has committed to sponsoring a gear-swap program by which illegal fishing gear can be surrendered and swapped with appropriate fishing gear as identified in the right-sizing workshops. The bureau will also use the right-sizing outputs and agreements as reference for fishing gear distribution/replacement, as opposed to the usual distribution of fishing gear and boats as a form of livelihood assistance to LGUs.
ECOFISH COMPLETION REPORT 49

Plan, or in the case of VIP, its CCA plan for coastal resources management climate-proofing in the Batangas Province.
Finally, to initiate incorporation of CCA in MPA and MPA network establishment, ECOFISH contracted MERF to facilitate a training for MKBA site teams and local partners to help them design MPA networks based on suitability, sensitivity, and susceptibility criteria. With the assistance of Dr. Kitty Courtney, these were further detailed and refined to develop the applicable ecological design principles and useful decision-support criteria for MPA network establishment and strengthening (Deliverable 9.3). The adjusted MPA designs that fully reflect the application of ecological design principles have been incorporated in the MSPs.
ECOFISH conducted an additional inter-LGU fishing effort configuration workshop for the north LGUs of Danajon Reef (Talibon, Bien Unido, Ubay, and Pres. CPG). As former FISH project focal sites, these LGUs have already been oriented with the concept of fishing effort re-allocation in the infancy of the right-sizing concept in 2010. However, consensus-building and fishing effort negotiation workshops had not yet been developed at that time. During this revisit, the group finally reached consensus on the appropriate fishing gear configuration for the northern section of the Danajon Reef was finally, and the participants signed a similar joint declaration to support the implementation of
Partners from the Sulu Archipelago MKBA take part in a series of fishing games to learn about the dynamics of fish stock growth and decline and the importance of regulating fishing effort in the process.
The project designed innovative workshops to facilitate inter-LGU negotiations in setting the MKBA-wide fishing gear allocation and individual LGU’s fishing gear allocation targets. Here, LGU members using “trading chips” representing all their fishing gear types and in numbers equivalent to their latest fishing gear inventory data.
ECOFISH COMPLETION REPORT 50

fishing effort right-sizing in their respective municipalities.
The Senior Fisheries and Coastal Resource Management Specialist was invited to present advances made in the application of tools for fisheries management during the “Tropical Fisheries Workshop in a Changing World” in February 2017 at the Leibniz Center for Tropical Marine Research in Bremen, Germany. The ECOFISH staff member presented the project’s initiatives in promoting science-based decision-making through right-sizing of fishing effort, and academic and fisheries researchers expressed keen interest in the topic.
2.11 DELIVERABLE 11: REGISTRY OF USERS OF MUNICIPAL FISHING WATERS ESTABLISHED IN SELECT MUNICIPAL LGUS IN THE EIGHT MKBAS
Instead of working with individual LGUs to develop and implement fisheries registries in municipalities, ECOFISH worked with BFAR to establish a national registration system. This was determined to be a more cost-effective strategy for the project, as investing in policy adoption and implementation strategy would not only benefit partner LGUs, but all LGUs nationwide. In addition, BFAR covered all nationwide program implementation costs, including providing incentives for LGUs and fishers to complete the registration process.
The National Program for Municipal Fisherfolk Registration, more commonly known as FishR, was launched on May 22, 2013. ECOFISH assisted BFAR in the design of the program and monitoring of implementation in the project sites. The LGUs conducted the actual registrations and passed the data on to BFAR through an online registration system. ECOFISH also assisted BFAR’s Public Information Group in the conceptualization and design of FishR information materials. The project hosted the national launch of FishR in Manila that was attended by the DA Secretary, NAPC Secretary, and USAID Mission Director. The project also supported the development and production a short video on the FishR registration process as well as the production of a FishR jingle.
BFAR conducted national and regional trainings. All ECOFISH partner LGUs attended the trainings in their respective municipalities. By September 2015, FishR has registered more than 1.5 million of the estimated 1.8 million fishers nationwide. In April 2017, FishR has 1.789 million registrants in its database.
The national municipal fisherfolk registration (FishR) process is web-based, and the mobile application and automation contributed to its success. Here, a group uses TV White Space to register small scale-fishermen though the BFAR FishR system.
ECOFISH COMPLETION REPORT 51

TABLE 2.24. DELIVERABLE 11 – REGISTRY OF USERS OF MUNICIPAL FISHING WATERS ESTABLISHED IN SELECT MUNICIPAL LGUS IN THE EIGHT MKBAS
Project Intervention/Activity Target (Scale) Accomplished Registration and licensing training and drafting of ordinance 41 LGUs 41 Registration systems component of national database developed and deployed to LGUs in the MKBAs
1 (National) 1
Training on use of registration system in each MKBA 41 LGUs 41 Team Lead: Regulatory and Enforcement Specialist, Senior Fisheries and Coastal Resource Management Specialist Key Partners: BFAR, LMP, MKBA LGUs
KEY ACTIVITIES/ACCOMPLISHMENTS
Year 1 registration efforts were focused on helping LGUs to complete the municipal fisherfolk registration. There was no need to conduct trainings in the project sites because BFAR was conducting the trainings for all LGUs. ECOFISH site coordinators encouraged partner LGUs to participate in BFAR’s trainings and helped monitor FishR implementation progress.
TABLE 2.25. FISHR REGISTRATION DATA OF ECOFISH PARTNER LGUS IN SEPTEMBER 2015
Province Municipality No. fishers registered (9/2015)
Province Municipality No. fishers registered (9/2015)
Calamianes Group of Islands MKBA South Negros MKBA
Palawan
Busuanga 1,664 Negros Occidental
Cauayan 2,555 Coron 3,689 Hinoba-an 2,927 Culion 685 Sipalay 1,226 Linapacan 2,183
Negros Oriental
Basay 548 Danajon Reef MKBA Bayawan 464
Bohol
Buenavista 1,323 Santa Catalina 1,119 Clarin 1,209 Siaton 777 Getafe 1,447 Surigao del Norte and Surigao del Sur MKBA Inabanga 982
Surigao del Norte
Bacuag 158 Tubigon 1,568 Claver 465
Leyte
Bato 2,092 Gigaquit 121 Baybay 2,268 Placer 514 Hilongos 980 Surigao City 2,298 Hindang 876 Tagana-an 510 Inopacan 1,880 Sulu Archipelago MKBA Matalom 1,274
Tawi-Tawi
Bongao 9,440 S. Leyte Maasin 2,387 Panglima Sugala 5,661 Lingayen Gulf MKBA Sapa-Sapa 4,203
La Union
Agoo 1,070 Simunul 4,042 Aringay 639 South Ubian 4,481 Bauang 1,006 Tandubas 5,459 Caba 466 Verde Island Passage MKBA Rosario 288
Batangas Balayan 2,597
San Fernando City 1,715 Bauan 366
ECOFISH COMPLETION REPORT 52

Province Municipality No. fishers registered (9/2015)
Province Municipality No. fishers registered (9/2015)
Santo Tomas 1,584 Calaca 902 Pangasinan Alaminos 1,583 Calatagan 4,521 Ticao Pass – Lagonoy Gulf – San Bernardino Strait MKBA Lemery 3,723
Sorsogon Bulan 4,843 Mabini 1,507 Matnog 2,152 San Luis 254 Santa Magdalena 453 Taal 179
Northern Samar
Biri 442 Tingloy 714 Capul 108 San Vicente 557
FishR implementation was not uniform nationwide, as seen from the data from September 2015 presented in Table 2.25. Despite its remote location, Tawi-Tawi was among the first provinces to quickly accelerate registration, while Surigao del Sur and Northern Samar lagged, primarily due to technical constraints (lack of reliable internet access). ECOFISH provided feedback to BFAR to help improve the implementation of FishR.
LGUs invested significantly in the field implementation of FishR for community preparation and engagement on top of the incentives provided by BFAR for data collection. Overall, 13 ECOFISH partner LGUs were included in BFAR’s Top 100 list of LGUs that completed the fisherfolk registration in a timely manner. In Bohol, where ECOFISH piloted the use of TV White Space-enhanced fisherfolk registration, the Municipality of Carlos P. Garcia ranked twenty-fourth in BFAR’s national list and second in BFAR Region 7. This is especially remarkable because the only available internet connection in the municipality was through TV White Space, provided by DOST at no cost.
With the success of FishR, ECOFISH worked with BFAR to develop a complementary registration system for boats and gear, also known as BoatR. In anticipation of BoatR, ECOFISH advised partner LGUs in the project sites to refrain from developing an independent system of boat and gear registration. With BFAR taking the lead in BoatR, the issue of jurisdiction between the Department of Transportation and Communications Maritime Industry Authority (MARINA) and LGUs will hopefully be resolved, with BFAR taking the cudgels for the LGUs.
Early in the implementation of FishR, ECOFISH proposed registration and licensing provisions to be incorporated in local ordinances. Among the first to adopt were Tubigon, Bohol, and Mabini, Batangas. These LGUs included the provisions in their comprehensive fisheries codes. Many of the LGUs in the ECOFISH sites already had provisions on registration and licensing in their existing ordinances. There was no need to propose ordinances for registration and licensing in these LGUs as originally indicated in the work plan. However, by Years 4 and 5 of the project, LGUs worked on revising or drafting ordinances to conform with the revised Fisheries Code. ECOFISH pushed for the inclusion of economic instruments (user fees, auxiliary invoice, fines) in local legislation by proposing updated licensing provisions in local ordinances that linked to the national registration programs.
ECOFISH COMPLETION REPORT 53

2.12 DELIVERABLE 12: REVENUE GENERATION SYSTEM FOR FISHERIES MANAGEMENT ESTABLISHED AND EFFECTIVELY IMPLEMENTED IN SELECT LGUS
Revenue generation was vigorously pursued during the project’s lifetime as an important mechanism of the EAFM framework in pursuing sustainable fisheries management. Market-based instruments (MBIs) were created and enhanced to increase local revenues that would be used for the management of fisheries resources in the eight MKBAs. ECOFISH provided the economic basis for these instruments and initiated the drafting of the policy instruments in 46 LGUs.
TABLE 2.26. DELIVERABLE 12 – REVENUE GENERATION SYSTEM FOR FISHERIES MANAGEMENT ESTABLISHED AND EFFECTIVELY IMPLEMENTED IN SELECT LGUS
Project Intervention/Activity Target (Scale) Accomplished Cost-benefit analysis of LGU operations involved in fisheries management 41 LGUs 43 Establish fees and fines for coastal resource use 41 LGUs 46 Institute market-based financing instruments 41 LGUs 46 Establish collection mechanisms for revenue generation 41 LGUs 46 Team Lead: Senior Resource Economist, REECS, SSG Key Partners: LMP, LPP, LGUs
KEY ACTIVITIES/ACCOMPLISHMENTS
ECOFISH undertook a number of studies and activities to establish MBIs and user fees in focal and some expansion sites. The most common type of MBI established was the tourism entrance or user fee, sometimes referred to as the environmental fee for tourists, which the project established in 24 LGUs. For most of these schemes, the project conducted WTP surveys among users to establish the economic basis for fee amounts and generate information on preferences of users to make the scheme acceptable and sustainable. Five LGU ordinances and one Protected Area Management Bureau (PAMB) resolution reached the final stage of approval. Some LGUs started
collecting fees during Year 5. In Southern Negros, Sipalay and Hinobaan passed MPA ordinances that prescribed entrance fees for tourists, all based on the results of WTP studies conducted by ECOFISH. In Linapacan, the LGU started collecting environmental fees from tourists, also based on WTP studies of ECOFISH. In Tawi-Tawi, two LGUs passed MPA ordinances with user fees included. For the Surigao del
ECOFSIH provided technical support to design and update accountable and transparent user fees systems and regulations, providing sustainable support for conservation and tourism programs.
ECOFISH COMPLETION REPORT 54

Norte MKBA, ECOFISH worked with the PAMB of SIPLAS to formulate the PAMB resolution with prescribed entrance fees for tourists based on the WTP survey conducted by the project.
Fifteen LGUs in Danajon Bank and Lingayen Gulf updated and enhanced their auxiliary invoice schemes mostly through issuing executive orders (EOs). The project conducted focus group discussions (FGDs) among the LGUs, and helped reach agreements in drafting coordinated ordinances or EOs to allow for a concerted effort in monitoring fish landings. The policy instruments increased the amounts collected per species allowed for transport outside of the municipality, providing additional revenues for the LGUs. While the EOs were unsigned at ECOFISH close, local legislators and most mayors gave verbal approval of the latest version.
Four LGUs drafted comprehensive fisheries or CRM codes, which contained user fees for all types of uses allowed in the code. In Coron, the Municipal Fisheries Code (containing regulations, including fees, for all types of water uses allowed in their area) was signed into law in December 2016. Significant among these uses is the zoning of waters for tourism and pearl farms, both with the potential to generate millions of revenues (PhP) for resource management. Tourism-related fees were based on the results of the WTP survey conducted in CIG. Fisheries Codes were drafted in Bulan and Matnog, with fees prescribed for fishing activities and violations. In Mabini, a comprehensive CRM Code (containing specific fees and fines for the various uses allowed in the municipal waters) was signed into law in December 2015. The project provided the economic bases for all of the prescribed fees therein.
Finally, three more LGUs in VIP and one in South Negros MKBA drafted ordinances that imposed user fees for specific uses: violations of fishing laws, environmental fees charged against tourism establishments, anchorage fees for VIP LGUs, and fees for the collection of bangus fry in Cauayan. The idea of imposing these specific charges in VIP was the result of a user fees forum that featured the best practices of VIP’s coastal LGUs in generating local revenues through various user fee schemes. These three ordinances were all in draft stages upon project completion, but it should be noted that the assistance in drafting was requested by the LGUs themselves, hence the approval of the ordinances is almost certain.
TABLE 2.27. MARKET-BASED INSTRUMENTS AND USER FEES ESTABLISHED IN THE FOCAL AREAS AND SOME EXPANSION SITES OF ECOFISH
MKBA Tourism Entrance Fees
Auxiliary Invoice Schemes
Fees in Fisheries or CRM Code Other Fees Total No.
of LGUs
Calamianes Island Group
Approved: Linapacan Draft: Culion, Busuanga
Approved: Coron 4
Danajon Reef
Draft: Bien Unido, CPG, Getafe, Inabanga, Talibon, Tugibon, Ubay
7
Lingayen Gulf Draft: Alaminos
Draft: Alaminos, Aringay, Balaoan, Caba, Agoo, Bacnotan, Rosario, Sto. Tomas
9
Sulu Archipelago
Approved: Bongao, Panglima Sugala
2
ECOFISH COMPLETION REPORT 55

MKBA Tourism Entrance Fees
Auxiliary Invoice Schemes
Fees in Fisheries or CRM Code Other Fees Total No.
of LGUs Ticao Pass – Lagonoy Gulf – San Bernardino Strait
Draft: Gubat, San Vicente, Capul
Draft: Bulan, Matnog Draft: Sta. Magdalena MPA violations
6
Surigao del Norte
Approved: 9 LGUs of Siargao, Surigao del Norte
9
South Negros
Approved: Hinobaan, Sipalay Draft: Siaton, Basay, Sta. Catalina
Approved: Cauayan Bangus Fry
6
Verde Island Passage Draft: Taal Approved: Mabini
Draft: Balayan anchorage fees, Calaca EUF
4
Total No. of LGUs 24 15 4 4 47
Other revenue-generating mechanisms were introduced by the project based on the results of the economic valuation exercise conducted for 43 LGUs in seven of the project’s MKBAs (see Deliverable 8). Economic values of the various marine zones were estimated, based on the type and number of users of each zone. The values estimated how much the zones were worth for users, which could therefore become the basis for user fees. Generic fee schemes were recommended in the IFRM Business Plans formulated for all eight MKBAs (see Deliverable 13). For instance, estimated values of MPAs, mangrove forests, fishing grounds, or recreational zones can serve as basis for computing compensation for potential damages when violations within those zones occur. Moreover, estimated values of aquaculture or recreational zones can be used as the basis for charging user fees within those zones.
In determining how much revenues should be raised, costs of fisheries management were estimated through the business planning exercise for each MKBA (see Deliverable 13). A national workshop was conducted to determine detailed costs to implement fisheries management in each MKBA. The results were processed and summarized to come up with a rough estimate of how much will be needed to implement EAFM in the next seven to ten years. Finally, to complete the CBA of fisheries management, the team computed NPVs of marine zones in the MKBAs (see Deliverable 8). Results across all sites were positive, meaning that there are net benefits to be enjoyed when marine zones are managed in accordance with EAFM principles and strategies.
To sustain what ECOFISH began in revenue generation, finance, accounting, and budget, officers need to be more involved in fisheries management planning sessions. They should be made aware of the regular and long-term needs of CRM or fisheries resource management, as well as the increasing potential of conservation and sustainable fisheries management to earn revenues for LGUs. This way, sustainable fisheries management can be mainstreamed across the various departments of the LGU. The WTP studies and economic valuation results may be replicated across areas with similar features and uses to increase the number of LGUs earning revenues from sustainable management of coastal resources.
ECOFISH COMPLETION REPORT 56

2.13 DELIVERABLE 13: SUSTAINABLE FINANCING PROGRAMS FOR EAFM IMPLEMENTED IN SELECT LGUS IN THE EIGHT MKBAS
The initial approach of ECOFISH in designing and implementing sustainable financing schemes for EAFM was focused on revenue generation for LGUs and other government agencies with fisheries management mandates.. Hence, ECOFISH activities for this deliverable included setting up trust funds and coastal adaptation funds, conducting value chain studies, and formulating IFRM business plans. The rationale was that such funds and studies were needed to sustain investment in the management of municipal waters, and that ECOFISH would help capitalize these funds by increasing LGU contributions to the funds, leveraging other donor and private sector funds, and seeking increased revenues from resource permits and licenses (see Deliverable 12). The business plans would tell LGUs and inter-LGU alliances how much would be needed to implement the IFRM Plans (see Deliverable 10), while the value chain studies would redirect private sector investment in parts of the chain that are under-funded or under-capitalized. Finally, the trust funds and coastal adaptation funds created would help finance IFRM Plan implementation. In addition to contractual deliverables, the project provided four payments for ecosystem services (PES) schemes as part of sustainable financing mechanisms to fund fisheries management in the long term.
TABLE 2.28. DELIVERABLE 13 – SUSTAINABLE FINANCING PROGRAMS FOR EAFM IMPLEMENTED IN SELECT LGUS IN THE EIGHT MKBAS
Project Intervention/Activity Target (Scale) Accomplished Translate IFRM Plans into business plans 8 (1 per MKBA) 8 Develop social enterprises 8 (1 per MKBA) 8 Establish incentive schemes for MPA management 8 (1 per MKBA) 8 Conduct value chain analysis for local fisheries 8 (1 per MKBA) 8 Team Lead: Senior Resource Economics Specialist, REECS, SSG, SGIDS Key Partners: LGUs, private sector
KEY ACTIVITIES/ACCOMPLISHMENTS
During the course of ECOFISH planning and implementation, Deliverable 13 was modified, in part because of overlap with Deliverable 12. PES schemes are by definition other forms of market-based instruments. Existing literature on PES schemes make use of economic valuation to determine amounts or payments to be made. As discussed in Deliverable 12, the financial instruments introduced by the project made use of economic valuation techniques. Furthermore, user fees are also by definition “payments for ecosystem services.” Given this, there was redundancy in requiring PES schemes separate from the instruments that will be established under Deliverable 12. ECOFISH was able to demonstrate a modified PES scheme through the cash for work component of the Balayan Bay closed season in the VIP MKBA (although this did not fit in the definition of sustainable being as it was a one-time scheme).
The development of inter-LGU trust funds was initiated through the concept of development impact bonds. However, work on this was stalled due to difficulty in establishing such instruments in the greater environmental sector, let alone in the Philippines. Trust funds were likewise attempted through work with NAPC and the LMP, but the idea seemed far-fetched, given that inter-LGU alliances had yet to be established. The same held true for the capitalization of coastal adaptation funds. The People’s Survival Fund was already established nationwide under the management of the Climate Change Commission.
ECOFISH COMPLETION REPORT 57

In lieu of the funds and PES schemes, the project embarked on other sustainable financing interventions that were deemed to be more comprehensive in scope. Instead of aiming for more revenues, the sustainable financing mechanisms focused on providing incentives in fisheries management. Sustainable financing can be defined as either increasing regular sources of revenues, or decreasing habitual costs. Since Deliverable 12 focused on the former, Deliverable 13 was modified to demonstrate the latter. In providing incentives to those directly involved in or affected by fisheries management, strategies become less costly, or even increasingly feasible to
undertake. When economic incentives go beyond the financial, sustainability is better achieved. These interventions would have a more direct impact on the project outcomes. Social enterprise development will directly contribute to an increase in the number of people gaining employment, while the MPA management incentives will contribute to an increase in fish biomass. In addition, the proposed modifications were consistent with the findings and recommendations of the midterm evaluation report undertaken in 2015.
After contract modification, Deliverable 13 included four sets of interventions: value chain studies on flagship species, translation of IFRM plans into business plans, incentive schemes for MPA management, and conservation enterprises to be initiated in all eight MKBAs.
The project carried out value chain studies for the eight MKBAs, featuring each one’s flagship species as agreed on with BFAR and the concerned LGUs. ECOFISH conducted primary surveys with the various actors in the chain to come up with a comprehensive description of the chains, governance conditions, existing relationships, and costs and margins. All these fed into a suite of recommendations to support sustainable fisheries management in the eight MKBAs, including stricter regulations on harvest size limits, monitoring schemes, certification processes, post-harvest facilities, seasonal closures, social enterprises, credit facilities, and habitat protection. The project shared the results with other actors interested in investing in the Fisheries Improvement Project. The studies were used to inform design of CFLCs in those areas where they were being instituted, particularly regarding who should be involved and what services could be included to increase the value of catch for fisherfolk organizations. Finally, a journal article entitled “Value Chain Analysis and Small-Scale Fisheries Management” was published in Marine Policy containing the results of the value chain studies.
Selected fisherfolk organizations from Surigao del Norte MKBA participate in a technical training on coco-coir production jointly organized by ECOFISH and the Philippine Coconut Authority (PCA). Aside from training the participants on the necessary skills to weave the mats, PCA turned over decorticating, twining, and weaving machines to be shared among fisherfolk groups. The activity aimed to supplement livelihoods of marginal fisherfolk by adding value to an abundant resource on the island, as well as reducing the agricultural waste generated by copra production.
ECOFISH COMPLETION REPORT 58

TABLE 2.29. VALUE CHAIN ANALYSIS FOR FLAGSHIP SPECIES OF EACH MKBA CONDUCTED BY ECOFISH
MKBA Species Lingayen Gulf Siganids Verde Island Passage Round scad Calamianes Group of Islandsd Sea cucumber Ticao Pass – Lagonoy Gulf – San Bernardino Strait Sardines Danajon Reef Blue swimming crab South Negros Island Yellowfin tuna Surigao del Norte Mud crab Sulu Archipelago Blue swimming crab
The IFRM plans formulated under Deliverable 10 were translated into IFRM business plans. The main objective of the business plans was to determine the annual implementation of the IFRM plans, breaking down the strategies and activities into government accounting and budget classifications. Potential sources of revenues were likewise identified, derived mainly from the results of Deliverable 12 and the estimated economic values of marine zones (see Deliverable 8). The project conducted a national workshop to generate site-based information on costs and additional revenue sources, and carried out additional, more detailed workshops in CIG and South Negros in light of their advanced state of IFRM plan formulation and revenue generation. The participation of budget officers, accountants, and treasurers proved valuable not only in terms of generating accounting-related data, but also, and more importantly, in increasing their appreciation of expenditures related to sustainable fisheries management. The eight business plans were turned over to the LGUs and inter-LGU alliances during their respective MKBA summits in the last quarter of the project.
TABLE 2.30. TOTAL COST OF IFRM PLANS AND THE PROJECTED NUMBER OF YEARS OF IMPLEMENTATION RESULTING FROM A SERIES OF BUSINESS PLANNING SESSIONS CONDUCTED BY ECOFISH
MKBA Total IFRM Plan Costs (in PhP) No. of Years Covered Calamianes Group of Islands 110,111,000 7 Danajon Reef 141,398,000 5 Lingayen Gulf 123,151,000 7 Ticao Pass – Lagonoy Gulf – San Bernardino Strait
179,135,000 5
South Negros 144,943,000 10 Sulu Archipelago 26,123,000 5 Surigao del Norte 100,081,000 7 Verde Island Passage 157,115,000 7
ECOFISH supported initiation of conservation enterprises among 74 small-sized fisherfolk organizations across the MKBAs, representing 60–75 percent of the total number of organizations in the area. The main objective was to create opportunities in increasing non-harvesting income as a result of their participation in the enterprise, thereby reducing the need to increase, or at least maintain, current fishing effort. Particularly in MKBAs where economic rent is negative or almost nil, the enterprises formed part of the overall EAFM implementation of the project. Addressing overfishing and illegal, unregulated, and unreported fishing includes focusing on income sources as the main economic incentive to participation in sustainable fisheries management. Further, enterprises have the potential to catalyze fisheries management, given the dependence of their commodities on healthy marine ecosystems. The
ECOFISH COMPLETION REPORT 59

biggest contribution to this intervention’s design was in the realm of social capital (to gain community trust and confidence) for future interventions. The focus on organizational strengthening and social preparation, alongside skills development and financial management, meant there was a multiplier effect in building constituencies among the fishing households themselves in advocating and participating in EAFM.
The 74 conservation enterprises established ranged from adding value to marine or land-based harvests to providing ancillary services in the marine ecotourism industry. ECOFISH partnered with local NGOs to ensure sustainability of the enterprises beyond the life of project. The engagement called for the conduct of various trainings and workshops including the basic EAFM orientation of the project, as well as the whole gamut of social preparation trainings and organizational strengthening activities. The project usually carried out skills and financial management trainings with local resources such as universities onsite; local DTI, DOST, Department of Social Work and Development (DSWD), Department of Labor and Employment, or BFAR offices; local private sector entities; or experts from Manila willing to share their expertise with the project beneficiaries. The key was to find the right set of partners each time, as well as identify enterprises that POs perceived as contributing to local community development while putting in place measures that would not destruct marine habitats or increase resource extraction. It was also crucial to sustain the PO’s interest in working toward the success of the enterprise even beyond the project’s timeframe. In all cases, the project sought LGU buy-in to ensure continuous support to both the POs and partner NGOs in scaling up the enterprises and placing them under the appropriate supervision to ensure environmental rules are followed.
One concrete manifestation of LGU support was the inclusion of enterprise development as a major
Tagbanua people in Calauit carve wooden sculptures from fallen trees. ECOFISH provided enterprise development training to fishing communities to improve and sustain their livelihoods based on non-fishing endeavors.
ECOFISH COMPLETION REPORT 60

strategy in the formulation of their IFRM plans and business plans, as well as in the modified set of governance benchmarks being promoted by the project (see Deliverables 5 and 7). Partner POs signed letters stating their full commitment to working toward the success of their enterprise, supporting their LGU in implementing EAFM, abiding by fishing rules and regulations, and using their enterprise income for environment-friendly investments or expenditures. In case of monitoring later, baseline results could help determine whether enterprises improved the socioeconomic status of the fisherfolk beneficiaries and if they directly contributed to the build-up of social capital for EAFM.
Tourism, commercial, and fisheries-based enterprises have the fundamental goals of being environmentally sound and revenue generating. As importantly, these enterprises succeeded in gaining their communities’ belief in the EAFM approach to fisheries management and biodiversity conservation. For example, ECOFISH helped add value to flying fish food products, coco-coir production, mangrove crab fattening, and ecotourism services—all while sustaining the natural environment.
MPA management incentives were established by the project in the form of the SEAT. SEAT is a set of indicators meant to measure the effectiveness of MPAs in delivering socioeconomic benefits to local communities in an MPA’s immediate vicinity. It attempts to validate the claim that biodiversity conservation through MPAs directly contributes to improved human well-being. It further complements the existing MPA MEAT, which assesses governance effectiveness in managing Philippine MPAs. The SEAT results serve as incentives for managers to continue, expand, or even redesign their MPAs toward enhanced social and economic benefits. Concretely, the SEAT was used together with MEAT as the evaluation criteria in recognition awards for best-performing MPAs in selected MKBAs. These events at the MKBA level became useful tools for generating efficiency and inspiration in MPA management, as well as raising awareness among the general public.
TABLE 2.31. NUMBER OF MPAS THAT ADOPTED AND USED SEAT INSTRUMENT AS PART OF THEIR REGULAR MANAGEMENT EFFECTIVENESS ASSESSMENT
MKBA No. of MPAs with SEAT Results Calamianes Group of Islands 8 Danajon Reef N/A Lingayen Gulf 5 South Negros Island 13 Sulu Archipelago 9 Surigao del Norte 7 Ticao Pass – Lagonoy Gulf – San Bernardino Strait 4 Verde Island Passage 18
TOTAL 64
A total of 64 MPAs were subjected to the SEAT instrument. The scores are now in a database that has been forwarded to the MPA Support Network (MSN) being managed by UPMSI’s MERF. In four MKBAs, the SEAT results fed into the implementation of recognition awards: BRAVO Awards in VIP, RACE Awards in CIG, PANGGA Awards in South Negros, and SIGANID Awards in Surigao del Norte. In CIG and Surigao del Norte, socioeconomic baseline surveys were further conducted for households surrounding the MPAs. In Danajon Bank, MPA managers concluded that the SEAT was not yet applicable in their case given the early stages of their establishment, while Tawi-Tawi MPA managers expressed eagerness in conducting recognition awards in their MKBA as soon as possible. For San Bernardino and Lingayen Gulf, LGUs preferred establishing more MPAs before plans and discussions on recognition
ECOFISH COMPLETION REPORT 61

awards would be able to progress. Finally, SEAT has been adopted by MSN as part of the Para El Mar Awards, a national bi-annual event recognizing well-managed MPAs across the country.
An additional sustainable financing scheme explored by the project was the tapping of the government’s bottom-up budgeting process to provide more funds for fisheries management programs. ECOFISH worked with selected LGUs to ensure that proposals contained activities directly related to EAFM, e.g., MPA establishment and management, as well as initiation of conservation enterprises among fisherfolk POs. Unfortunately, the bottom-up budgeting process has been terminated under the current administration. Nevertheless, some focal LGUs were able to increase funding for fisheries management through this scheme.
2.14 DELIVERABLE 14: ADVANCED TRAININGS IN SPECIALIZED FISHERIES MANAGEMENT (SFM) INTERVENTIONS FOR IMPLEMENTATION/REPLICATION IN CORE GROUPS
Midway through Year 4, ECOFISH was granted an increase in total estimated cost primarily to fund advanced trainings in specialized fisheries management for inter-LGU alliances. The advanced trainings were designed for partner institutions in the eight MKBAs to include provincial and municipal governments, regional offices of the BFAR, the PNP-MG, local government alliances, NGOs, and academic institutions. The project target was to conduct eight specialized fisheries management trainings from any of the following themes: (1) advanced trainings in fisheries, MPAs, and socioeconomics; (2) national forum on EAFM, MPA, or CCA; (3) advanced trainings on fishery law enforcement; (4) fisheries summits; and (5) portfolios of communication materials produced and disseminated.
Advanced trainings in fisheries management targeted local partners in the MKBAs as participants, while BFAR partners in the regions took part both as
Danajon LGU technical partners and fishery technicians join the NSAP enumerators in practical exercises during an advanced fisheries training. Here, the participants are conducting gonad staging of prominently caught small pelagic and demersal fishes in the area. The information are typically used as basis for seasonal closure of fish species.
ECOFISH COMPLETION REPORT 62

participants and as resource persons. Advanced fisheries trainings in stock assessment were designed primarily for the LGUs’ technical personnel who are tasked to perform fisheries data collection, assessment, and management. Improved data collection and analysis were intended to refine local partners’ strategies in responding to fishing pressure and resource use issues and allow them to evaluate or test the effects of fisheries management measures.
Advanced MPA trainings were focused on enhancing the capacity of local partners to improve the effectiveness of their MPAs through the incorporation of ecological design principles, inclusion of other habitats into the protected areas, resource enhancement, development of capacity to adjudicate MPA cases, sustainable financing, improved coral cover and fish biomass monitoring techniques, and climate change-proofing principles and techniques.
TABLE 2.32. DELIVERABLE 14 – ADVANCED TRAININGS IN SFM INTERVENTIONS FOR INTER-LGU ALLIANCES
Project Intervention/Activity Target (Scale) Accomplished Advanced trainings in fisheries, MPA assessment, and socioeconomics 8 (1 per MKBA) 8 National forum on EAFM, MPA, or CCA 1 (National) 1
Advanced trainings in fishery law enforcement 8 (1 per MKBA)
2 (National) 8 2
Fisheries summits 8 (1 Per MKBA) 8 Portfolio of communication materials produced and disseminated 5 (Portfolios) 5 Team Lead: Deputy Chief of Party, Summit/Forum Coordinator, Senior Fisheries and Coastal Resource Management Specialist, Senior Governance and Institutional Development Specialist, Senior Resource Economics Specialist Key Partners: BFAR, LMP, MKBA LGUs
KEY ACTIVITIES/ACCOMPLISHMENTS
ECOFISH successfully conducted four advanced trainings on the reproductive biology of commercially important fish and invertebrates with BFAR/NFRDI in VIP, Danajon Reef, Calamianes, and the Ticao Pass – Lagonoy Gulf – San Bernardino Strait MKBAs. These advanced fisheries trainings aimed to strengthen the capability of the NSAP field enumerators and technical staff from partner LGUs in fisheries data collection and assessment, by gaining operational knowledge and skills in the conduct of reproductive biology studies for commercially important fish and invertebrate fishery species in the region. More specifically, the skills set gained by the enumerators would be useful for the continued conduct of gonadal maturity surveys in support of the seasonal closure in Balayan Bay, the blue swimming crabs management interventions in Danajon Reef, small pelagics monitoring in CIG, and future fishing effort controls in the harvest of “lawlaw” in the San Bernardino Ticao Pass.
Following the successful advanced training on MPA network design (in support of Deliverable 9) in the Danajon Reef MKBA midway through Year 4, its application was further tested in the South Negros Island, Lingayen Gulf, and the Calamianes Group of Islands network of MPAs. Trainings to replicate the application in potential MPA networks within the Sulu Archipelago, Surigao del Norte, and Ticao Pass – Lagonoy Gulf – San Bernardino Strait were also completed in Years 4 and 5.
The project successfully conducted a national forum on translating IFRM plans into business plans. The forum also served as an introductory course to business planning for the site teams and local partners.
ECOFISH COMPLETION REPORT 63

The actual business planning was conducted in all sites for local partners and POs, ultimately resulting in MKBA and LGU business plans.
Thirty-four individuals from provincial, municipal, and city-level enforcement units were invited to attend two successive advanced fishery and maritime law enforcement training workshops. The first advanced training was held inside the PNP headquarters. The objectives of the training workshop were: to gain deeper understanding of the nature and organizational set-up of the whole PNP; to be oriented on the PNP’s latest issuances and programs, especially those that affect enforcement of laws at the local level; to interact with key PNP squad staff (operations, community relations, intelligence, and investigation and detective management); to develop ideas on how to support police officers in the field in the hope of enhancing fishery law enforcement functions; and to learn the latest techniques and technologies employed by the police in gathering, managing, and disseminating information and how these technologies were utilized in the coastal environment.
The second advanced training was held inside the National Coast Watch Center. Similarly, the objectives of this training were: to understand the center’s role, functions, and programs; to gain practical understanding of the scope and limitations of the Philippine Coast Guard not otherwise known to the public; to interact with key officers of the Philippine Coast Guard; and to develop ideas on how to support and collaborate with the Coast Guard in the field. Like in the first training, the participants were oriented on the latest surveillance techniques and technologies that are available at the National Coast Watch Center. This included classified information that could affect the areas of operation of the local enforcement units they represent.
Both of these courses deviated from the usual skills enhancement trainings but focused on bridging information gaps between local government enforcers and these key national enforcement agencies. This training was designed to include a dialogue between local enforcers and key relevant officials of the two agencies. Discussion topics included graft and corruption, irregularities, and other sensitive topics.
Philippine Coast Guard and Maritime Police Patrols work with BFAR enforcement teams and community-level fisheries law enforcement units. ECOFISH supported training and catalyzed multi-sectoral cooperation and collaboration to combat illegal fishing. © Joel Policarpio.
ECOFISH COMPLETION REPORT 64

A total of eight advanced fishery and coastal law enforcement trainings, or one training per MKBA, were conducted. The training module was designed as an executive course targeting barangay, municipal, and provincial local government decision-makers. The objectives of the trainings were: (1) to serve as a venue for decision-makers to appreciate the technologies, processes, and outcomes of enforcement interventions over the course of the past five years; (2) to demonstrate progression of enforcement based on the EAFM benchmarking being promoted by the project; (3) to persuade executives and legislators to further improve and continue the program beyond ECOFISH assistance by way of policy and logistical support; and (4) to demonstrate other best practices in fishery and coastal law enforcement from other areas. A generic module was developed, but the delivery and content varied depending on the information need of each MKBA.
The project conducted eight fisheries summits with the objective of taking stock of all lessons learned during ECOFISH implementation, celebrating successes and milestones, recognizing contributors to these successes, and providing a venue through which to thank local partners and champions.
TABLE 2.33. THEMES OF ECOFISH MKBA FISHERY SUMMITS
Site Date of Summit
Theme/Topic Venue Number of Participants
Sulu Archipelago April 5 Sulu Archipelago: Stewards of the Sea’s Bounties
Rachel’s Hotel Bongao, Tawi
100
Lingayen Gulf April 19 Lingayen Gulf: Moving Forward with Alliance-Building
Hotel Ariana, Bauang, La Union
150
Verde Island Passage
April 25 Ecosystem Approach to Fisheries Management (EAFM) at Work!
Batangas Country Club, Batangas City
150
Surigao April 27 Surigao: Ocean’s Allies from All Front
Tavern Hotel, Surigao City 150
Danajon Reef April 27 Danajon Reef: Atong Ampingan Alang sa Malungtarong Panginabuhian
Reynas Haven and Garden, Tagbilaran City
150
South Negros May 4 Ang akong bahandi naa diri sa Southern Negros (My Treasure Lies in Southern Negros)
Bayawan City 150
Calamianes Group of Islands
May 11 A New Frontier for the Calamianes Group of Islands
Busuanga Convention, Busuanga
200
Ticao Pass – Lagonoy Gulf – San Bernardino Strait
May 17 An Yaman KO Yaon sa San Bernadino Strait-Ticao Pass
Legazpi City 280
To be cost effective, the project saw to it that the summits coincided with other remaining activities of the project, such as advanced fishery law enforcement trainings for MKBAs and the awards and recognition program promoted for MPAs. These were incorporated in the program.
The project team developed a communication plan to communicate project results to various audiences and produced five portfolios of communication materials (ECOFISH project information, fisheries management, fishery law enforcement, governance and institutional development, and conservation enterprises/PPPs). The goal was to build, through consistent messaging to different audiences, a strong constituency of support for the management of coastal and marine resources in the Philippines. (“Constituency of support” refers to stakeholders in government, communities, and civil society who
ECOFISH COMPLETION REPORT 65

will sustain EAFM actions and act as change agents to effectively address the threats to marine biodiversity.)
To accomplish this goal, the project team developed compelling and easy-to-understand communication materials for the various audiences, established a strong social media presence based on impact stories with high visual content, and produced collaterals with strong brand identity to support the project’s IEC activities in the MKBAs. The project team also conducted events to bring together stakeholders and partners, fisheries management experts, development practitioners, and the media to discuss policy issues, as well as project results and lessons learned.
Specifically, the team developed an infographic on the results of the ECOFISH Year 3 Monitoring Report and this was used in IEC activities in the MKBAs to communicate project results and ensure that the stakeholders and partners were on the same page throughout the project life cycle. A Project Information Kit (PIK), a type of brochure summarizing the challenges in each of the MKBAs and what the project has done to address these challenges, was also produced. The PIK was distributed to ECOFISH partners and influencers. It was handed out during courtesy calls or official visits, presentation meetings, consultations, briefings, and partner-organized meetings and events, such as local board, LGU leagues, and inter-agency meetings.
All PowerPoint presentations used in trainings and workshop activities were developed with a consistent visual style that reflected the project’s branding strategy. In addition, premium items including shirts, mugs, eco bags, umbrellas, and notepads with consistent branding and messages were distributed to stakeholders and partners during IEC activities and events. Facebook and Twitter accounts were created and their reach expanded throughout the project cycle. The Facebook account featured beautiful photos of the MKBAs and multiple daily posts about project activities in the various MKBAs, as well as impact stories and individual project champions. It has built a total of 2,609 followers. The Twitter account automatically shared the links to the Facebook posts and also served to post updates to promote activities and engage followers. The stories in the ECOFISH Facebook account were regularly picked up by the USAID Manila Environment Office Weekly Update, a weekly online newsletter distributed by USAID to its missions all over the world.
A learning and sharing forum called “Fish Talks” was conducted twice. The forum was conducted in partnership with BFAR and PaNaGaT Network with the goal of bringing together stakeholders, partners, and fisheries management experts to discuss policy issues in fisheries. Both forums were covered by the media. The first Fish Talks was held on January 25, 2017. It discussed the need to establish a community-based fish catch documentation system and LGU-friendly fish catch documentation and monitoring schemes that are supportive of EAFM principles. It sought to provide inputs to the standard fish catch documentation and monitoring scheme being planned by BFAR. BFAR Assistant Director Drusila Bayate gave the keynote address and three organizations—WWF, ISO, and Rare Philippines—presented their fish catch monitoring systems. BFAR expressed willingness to work with the civil CSOs to develop a universal catch documentation system focusing first on top commercially valued fish species and then on where a significant number of small-scale fisherfolk were involved. It was recommended that a TWG be convened to develop a standard protocol for community-based catch documentation systems and a joint DA-Department of Interior and Local Government (DILG) guideline on catch documentation system.
The second forum was held on April 11, 2017, and it sought to review existing and proposed poverty alleviation programs of BFAR and other key government agencies under the new administration. It focused on the needed poverty alleviation programs for municipal fishers and the gaps between the
ECOFISH COMPLETION REPORT 66

provisions of the Philippine Fisheries Code (R.A. 8550) and the Revised Fisheries Code (R.A. 10654) pertaining to poverty alleviation. The forum was attended by BFAR National Director Eduardo Gongona, who gave the keynote address, and Fisheries Policy and Economics Division Chief Melannie Guerra, who presented the poverty alleviation framework of BFAR. Basic sector representatives of the NAPC and fisherfolk from the provinces of Quezon and Batangas also attended the forum and discussed the lack of basic services for fisherfolk, including housing.
Before the end of the project, a special end-of-project report called “The Giving Seas” was produced. The report is a 45-page, full color photo book with short narratives describing what ECOFISH has done in the eight MKBAs based on the results chain of the project. This book was distributed during the ECOFISH National Summit held on May 25, 2017. The summit called “Pagbalong: From the Seas, Nourishing Life,” brought together 200 partners and stakeholders. The Vice-President of the Philippines gave the keynote address and the US Deputy Chief of Mission delivered the message of the US government. It engaged project stakeholders to present the lessons learned in the implementation of the project and the way forward in the MKBAs. Four selected ECOFISH champions gave TED Talks-style presentations on implementing inter-LGU enforcement of fishery laws, impact of conservation enterprises, right-sizing of fishing effort, and marine biodiversity conservation and indigenous peoples.
ECOFISH COMPLETION REPORT 67

3.0 PROJECT PERFORMANCE
ECOFISH facilitated delivery of service of BFAR to LGUs. In the Danajon Reef MKBA, ECOFISH worked with municipal and provincial governments, BFAR, and the Philippine Association of Crab Producers. Inc. (PACPI) to test the use of spawning potential ratio (SPR) method to assess the status of the blue swimming crab resources and provide guidance for its management. SPR is potential method to determine reference points for use by BFAR to roll out its national blue swimming crab management plan.
ECOFISH COMPLETION REPORT 68
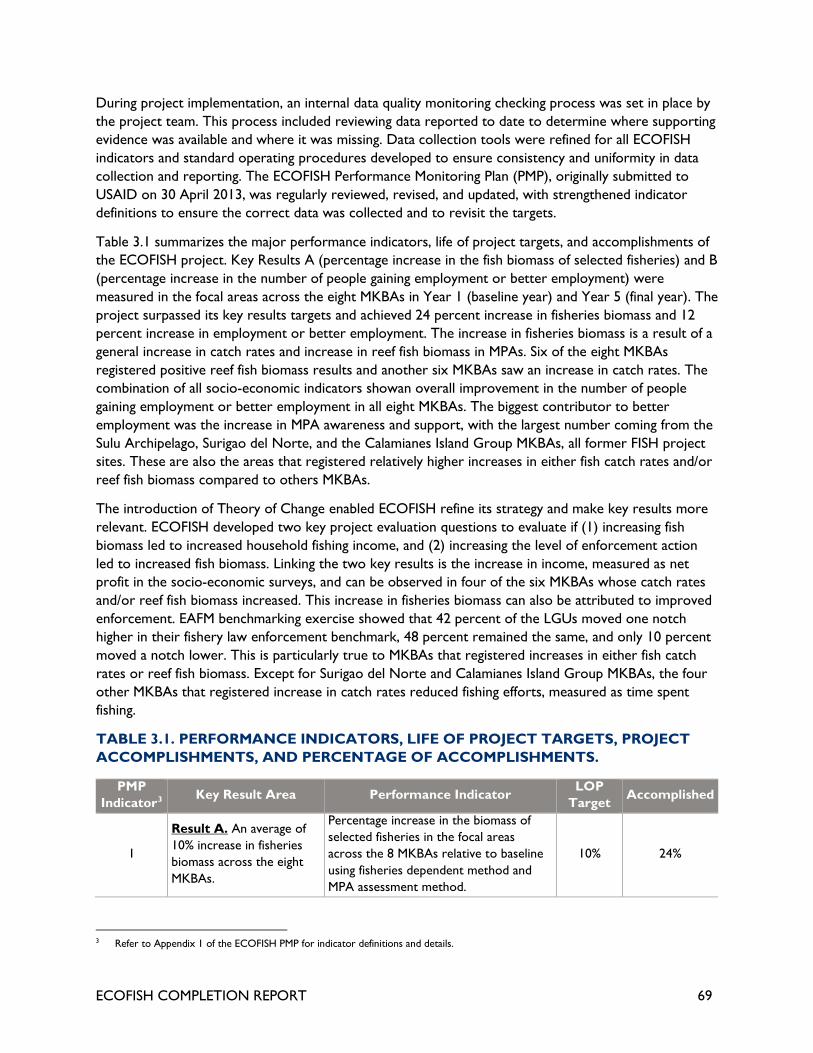
During project implementation, an internal data quality monitoring checking process was set in place by the project team. This process included reviewing data reported to date to determine where supporting evidence was available and where it was missing. Data collection tools were refined for all ECOFISH indicators and standard operating procedures developed to ensure consistency and uniformity in data collection and reporting. The ECOFISH Performance Monitoring Plan (PMP), originally submitted to USAID on 30 April 2013, was regularly reviewed, revised, and updated, with strengthened indicator definitions to ensure the correct data was collected and to revisit the targets.
Table 3.1 summarizes the major performance indicators, life of project targets, and accomplishments of the ECOFISH project. Key Results A (percentage increase in the fish biomass of selected fisheries) and B (percentage increase in the number of people gaining employment or better employment) were measured in the focal areas across the eight MKBAs in Year 1 (baseline year) and Year 5 (final year). The project surpassed its key results targets and achieved 24 percent increase in fisheries biomass and 12 percent increase in employment or better employment. The increase in fisheries biomass is a result of a general increase in catch rates and increase in reef fish biomass in MPAs. Six of the eight MKBAs registered positive reef fish biomass results and another six MKBAs saw an increase in catch rates. The combination of all socio-economic indicators showan overall improvement in the number of people gaining employment or better employment in all eight MKBAs. The biggest contributor to better employment was the increase in MPA awareness and support, with the largest number coming from the Sulu Archipelago, Surigao del Norte, and the Calamianes Island Group MKBAs, all former FISH project sites. These are also the areas that registered relatively higher increases in either fish catch rates and/or reef fish biomass compared to others MKBAs.
The introduction of Theory of Change enabled ECOFISH refine its strategy and make key results more relevant. ECOFISH developed two key project evaluation questions to evaluate if (1) increasing fish biomass led to increased household fishing income, and (2) increasing the level of enforcement action led to increased fish biomass. Linking the two key results is the increase in income, measured as net profit in the socio-economic surveys, and can be observed in four of the six MKBAs whose catch rates and/or reef fish biomass increased. This increase in fisheries biomass can also be attributed to improved enforcement. EAFM benchmarking exercise showed that 42 percent of the LGUs moved one notch higher in their fishery law enforcement benchmark, 48 percent remained the same, and only 10 percent moved a notch lower. This is particularly true to MKBAs that registered increases in either fish catch rates or reef fish biomass. Except for Surigao del Norte and Calamianes Island Group MKBAs, the four other MKBAs that registered increase in catch rates reduced fishing efforts, measured as time spent fishing.
TABLE 3.1. PERFORMANCE INDICATORS, LIFE OF PROJECT TARGETS, PROJECT ACCOMPLISHMENTS, AND PERCENTAGE OF ACCOMPLISHMENTS.
PMP Indicator3 Key Result Area Performance Indicator LOP
Target Accomplished
1
Result A. An average of 10% increase in fisheries biomass across the eight MKBAs.
Percentage increase in the biomass of selected fisheries in the focal areas across the 8 MKBAs relative to baseline using fisheries dependent method and MPA assessment method.
10% 24%
3 Refer to Appendix 1 of the ECOFISH PMP for indicator definitions and details.
ECOFISH COMPLETION REPORT 69

PMP Indicator3 Key Result Area Performance Indicator LOP
Target Accomplished
2
Result B. A 10% increase in the number of people gaining employment or better employment from sustainable fisheries management from a baseline established at the start of the project
Percentage increase in the number of people gaining employment or better employment in the focal areas across the eight MKBAs relative to baseline using socio-economic methods
10% 12%
3
Result C. Establishment of a national capacity development program to enhance the capacities of LGUs and relevant national agencies to apply ecosystem-based approaches to fisheries management
Number of EAFM training courses conducted (national, regional, and local)
120 199
4
Number of persons trained in EAFM, MPA and CCA (national, regional, and local) [FACTS 4.8.1-27: Number of people receiving USG supported training in natural resources management and/or biodiversity conservation]
1,800 8,226
5
Number of person hours of training on EAFM, MPA, and CCA (national, regional, and local) [FACTS 4.8.1-29: Number of person hours of training in natural resources management and/or biodiversity conservation supported by USG assistance]
24,000 198,954
6
Number of policy studies on EAFM, MPA, and CCA (national) [FACTS 4.8.2.28: Number of laws, policies, strategies, plans, agreements, or regulations addressing climate change and/or biodiversity conservation formally proposed, adopted, or implemented as a result of USG assistance]
8 14
7 Result D. Eight public- private partnerships supporting the objectives of the ECOFISH project created and operating
Number of strategic partnerships formally established and operating
8 8
8 Number of community partnerships actively engaged and mobilized
100 139
9
Result E. One million hectares of municipal marine waters under improved management.
Number of hectares of municipal waters under improved management [FACTS 4.8.1-26: Number of hectares of biological significance and/or natural resources under improved natural resource management as a result of USG assistance]
1,000,000 1,818,873
ECOFISH COMPLETION REPORT 70

PMP Indicator3 Key Result Area Performance Indicator LOP
Target Accomplished
10
Number of hectares of MPAs and network of MPAs established [FACTS 4.8.1-26: Number of hectares of biological significance and/or natural resources under improved natural resource management as a result of USG assistance]
320 2,258
11 Result F. A core of 30 LGUs across the eight MKBAs with improved capacity for implementing ecosystem approaches to fisheries management.
Number of inter-LGU/MKBA fisheries management plans developed
8 8
12 Number of LGUs that have achieved EAFM benchmark level 2 or higher
42 36
In the remaining key result areas, ECOFISH exceeded its contractual targets. The project exceeded set targets for the number of national and local EAFM training courses conducted; number of persons trained; and number of person-hours of training on EAFM, MPA, and CCA. This was due to a large number of orientation, assessment, and evaluation workshops that were converted into full-blown training programs. In response to the recommendation of the Midterm Performance Evaluation to enhance the enterprise development to be able to achieve the key result of an increase in employment, the team intensified training of peoples’ organizations in preparation for the establishment of conservation enterprises. Additionally, a number of LGUs replicated the training activities for their broader constituents, covered the major funding requirement, and requested ECOFISH support only for resource persons. The number of hectares of municipal waters under improved management largely exceeded the target, including specific interventions like establishment of new MPAs and networks of MPAs. ECOFISH exceeded its contractual target and improved the capacity for implementing EAFM of 36 LGUs across the eight MKBAs, but fell short of its life of project target of 42 LGUs. Although the contractual obligation of ECOFISH was only 30, the project targeted 42 LGUs to ensure that the 1,000,000 hectares of municipal waters under improved management was reached.
3.1 HIGHLIGHTING KEY THEMATIC RESULTS
Implementation of EAFM (Training). ECOFISH adapted the Essential EAFM Training Course developed by NOAA, CTI, and others for use in the Philippines. The Philippine version (Mainstreaming EAFM [M-EAFM] Planning Process) departed from a training course platform to a guide for conducting a stakeholders’ EAFM planning process. The focus of the process was preparing a workable and realistic EAFM plan that stakeholders could rally behind to implement. The resulting EAFM Plan covered a fisheries management area at an ecologically meaningful scale, guiding BFAR in aligning its regular programs and budget to support the identified strategies and management actions. The LGUs likewise are able to align their local policies, programs, and budgets to implement the plan in their respective jurisdictions. The M-EAFM Planning Process included specific Philippine context and examples to help stakeholders prepare the management actions appropriate for their fisheries management area.
Implementation of EAFM. In Year 2, during the review of baseline assessment results, the ECOFISH team initiated the inter-LGU EAFM framework planning. With the baseline assessment result as the background, the team facilitated the identification of inter-LGU fisheries management initiatives and individual LGU specific coastal resources management initiatives. These form the backbone of the
ECOFISH COMPLETION REPORT 71

development of the EAFM framework plan. In Year 3, ECOFISH completed the Inter-LGU Fisheries Management Plans for the LGU alliance of South Negros and the focal area municipalities in Surigao del Norte and Bohol municipalities of Danajon Reef. For South Negros, the alliances on the Negros Oriental and Negros Occidental sides oversaw the implementation. In Surigao del Norte, the province took the lead in the integrated implementation of management interventions. The Coastal Law Enforcement Council guided the integrated implementation of management interventions by the Bohol municipalities of Danajon Reef. As envisioned by ECOFISH, the inter-LGU management plans served as a guide for the implementation and development of future fisheries management interventions as either an inter-LGU initiative or individual LGU activities.
Improved Fisheries Management (Policy). Local governments and organizations involved in the management of the Verde Island Passage Marine Corridor tasked ECOFISH to provide scientific and technical advice for VIP fisheries initiatives, particularly on the establishment of a closed season for small pelagics in the area. The team designed and implemented an action research plan to determine the appropriate no-take period, develop the guidelines to set up the intervention, and provide scientific advice during its implementation. ECOFISH facilitated a series of forums for seasonal closure for small pelagics in the VIP to report the findings of the scientific study made by ECOFISH that narrowed the scope and period for the closed season. This was followed by individual LGU consultations, presentation to the provincial government, information forums to the public on the implementation of the closed season, and post-implementation forums to discuss the impact of the program. All LGUs in Balayan Bay drafted and passed ordinances to provide the enabling instrument for implementation of the closed season.
Early in project implementation, ECOFISH, through MERF, conducted review sessions and workshops with partners to draft various sections of the State of the Marine Resources Report to compile the first consolidated draft of the report. The team conducted writeshops with partners from BFAR and LGUs and agreed on the content and outline of the report. In collaboration with NSAP, the ECOFISH team conducted trainings for data analysts of NSAP to revisit and standardize procedures for estimation of fish population parameters and status of fish stocks. This information formed part of the SMRR that are intended to be updated on a regular basis. The project team finalized the draft of the report and presented to partners, co-authors, and stakeholders in a validation workshop for review and updating. Impact and Response components of the DPSIR framework as adopted by the SMRR were identified during the workshop and subsequently incorporated in the draft report.
ECOFISH provided technical and facilitation support for updating the Comprehensive National Fisheries Industry Development Plan (CNFIDP) at the request of BFAR. More than 500 participants from all sectors of the fisheries industry and coastal local governments took part in the review and amendment process in successive workshops over three months. The updated CNFIDP was launched February 3, 2016.
Improved Fisheries Management (Data Management). Recognizing the need for BFAR to establish a comprehensive national system for organizing several databases for fisheries related information, the BFAR-Fisheries Information Management Center teamed up with ECOFISH to share and collaborate. In the third quarter of 2015, the BFAR-Fisheries Information Management Center and ECOFISH co-designed a data management capacity package, complete with technical specifications on hardware, software, and basic data management protocols toward consolidating FishR, BoatR, FLEMIS, and PhilCatch databases under an EAFM database.
ECOFISH COMPLETION REPORT 72

Improved Fisheries Management (Resource Assessment). In Year 2, in partnership with the Philippine Association of Crab Processors, Inc. (PACPI) and the National Fisheries Institute (NFI), ECOFISH started the implementation of the “Species Specific Assessment and Piloting of Spawning Potential Ratio Method for the Blue Swimming Crab in the Danajon Reef.” Data collection resulted in one year’s worth of data, presented and analyzed with partners for potential interventions.
Improved Fisheries Management (Registration And Licensing). Fisher and fishing boat registration and licensing activities identified in the Life of Project Work Plan were reconfigured in light of BFAR’s action to take the lead in facilitating the registration of fisherfolk (FishR) and boats and gears (BoatR), and in providing technical assistance and incentives to LGUs. ECOFISH assisted BFAR in developing the concept and implementation mechanisms for the registration of fisherfolk in Year 1, and registration of boats and gear (initiated in Year 2 and implemented in Year 3). The technical assistance for registration of boats and gears was delayed due to the lingering issue of jurisdiction for registration of boats less than 3GT between MARINA and the LGUs. ECOFISH provided support for implementation of FishR in project MKBAs. This included regular monitoring of the progress of partner LGUs in registering fisherfolk in their area; sending feedback to BFAR in case of problems; finding means of improving registration efficiency through the use of modern technology (e.g., TV White Space and tablets in Bohol and offline data encoding system for areas without or with poor internet connections). With the success of FishR, the project team worked with BFAR to develop a complementary registration system for boats and gears (BoatR). This was fully rolled-out during Year 3.
Improved Fisheries Management (Right-Sizing and Fisheries Licensing). Inter-LGU fishing effort configuration scenarios, negotiation, and consensus-building workshops were successfully conducted in all MKBAs. Fishing effort configuration targets were determined and agreed upon collectively by participating partners during these workshops. Through an iterative process of scenario evaluations using the Ecosim module of the Ecopath with Ecosim modelling package, the LGUs were able to weigh the ecological and socio-economic trade-offs depicted in the various scenario options (ecosystem structure, fisheries profits, and fisher jobs), and reached a consensus on the most preferred scenario for the MKBA that the partners themselves deemed as an acceptable, workable, and implementable compromise of the ecological and socio-economic management objectives. With the agreed MKBA-wide targets as basis, the LGUs were then able to set their own gear limits or caps through a facilitated gear trading and negotiation workshop. These were continuously worked out by the ECOFISH team with LGUs to serve as bases for the limited issuance of fisheries licenses in the respective MKBAs—the first ever effort-based fisheries license control intervention in the world.
Improved Fisheries Management (MSP and Right-Sizing). The inter-LGU IFRM planning was done in parallel with the establishment and strengthening of the inter-LGU enforcement teams, including the strengthening of their regulatory and compliance capabilities. To consolidate the various efforts, ECOFISH continued to assist these clusters of LGUs in developing their water and fisheries use zoning plans through Marine Spatial Planning. In the first half of Year 4, the team developed the design for right-sizing of fishing effort. Orientation and consultation workshops with selected LGU clusters were initiated in second half of Year 4 to establish their fishing effort configurations, following a series of LGU and stakeholder consultations. These were later incorporated into their respective plans.
Improved Marine Protected Area Design and Implementation. ECOFISH, through MERF, completed the development of the dispersal models for the remaining MKBAs, namely Lingayen Gulf, Verde Island Passage, Ticao Pass – Lagonoy Gulf – San Bernardino Strait, and South Negros. These models guided the project staff and partners in developing their MKBA-specific MPA network designs.
ECOFISH COMPLETION REPORT 73

The prerequisites for the creation of the network of MPAs included the strengthening of previously established MPAs and establishment of new MPAs that will consist the network. ECOFISH supported partners in strengthening MPAs that remained idle for some time and in selecting, assessing, and establishing new MPAs. By the midterm, ECOFISH supported the establishment of a total of 192 hectares of new MPAs and assisted in strengthening about 1,650 hectares of previously established MPAs. An additional total of about 350 hectares of new MPAs were proposed by the partners across all project sites. They were assessed and evaluated for their viability and contributory role to the network of MPAs. Midway through project implementation, the team developed a case study to demonstrate the application of ecological, social, and governance principles to MPA and network of MPA designing process. The case study involved a tabletop geospatial analysis, a workshop to test the methodology, and documentation of the process and results. A standard guide or manual was developed for use in other focal ecosystems of the ECOFISH project and projects of interested institutions. The Danajon Reef MPA network was chosen as the pilot study area and a two-day training workshop was conducted with local partners in March 2016. The designing process was documented and replicated in South Negros MKBA in July 2016. The same activity was subsequently replicated in the other MKBAs.
Public-Private Partnerships. ECOFISH established eight strategic PPPs, which demonstrated the ability to deploy EAFM interventions by working with the private sector. ECOFISH provided assistance in the preparation of the FishR concept and implementation strategy, as well as technical support in one site to add connectivity using TV White Space technology. FishR continues to be a banner program of BFAR. The AMPA Project of the PNP-MG also proved successful, with PNP-MG linking with LGUs and local stakeholders to increase visibility and enforcement actions in the areas of the MPAs. ECOFISH worked with the PNP-MG to develop a monitoring and reporting system for assessing the effectiveness of the AMPA Project. The project facilitated the partnership between the PNP-MG and Smart Communications to develop DALOY, a mobile text-based reporting system for violations of fisheries laws. This platform was first piloted in Tawi-Tawi (Sulu Archipelago MKBA), and will be rolled out nationwide. The PNP-MG issued a Command Memorandum Circular No. 05-2014 (April 2014) to officially adopt and implement DALOY. The PPPs facilitated and executed by ECOFISH contributed toward mobilizing resources and deploying novel solutions to address challenges in fisherfolk registration, enforcement, stock assessment and management, livelihoods, capacity building, and organizational strengthening at both national and community levels.
Sustainable Financing. Focus Group Discussions (FGDs) for assessing and updating auxiliary invoice taxes and tourist user fees were conducted among Lingayen Gulf, Danajon Bank, and VIP LGUs. For LGUs with existing ordinances, collection and disbursement schemes were assessed, particularly whether the unit amounts were appropriately determined so that they would result in revenues, whether revenues were being collected efficiently, and whether collections were being used to fund fisheries management. Success stories were shared in the hopes of being replicated among their neighboring LGUs.
Conservation Enterprises and Livelihoods. Conservation enterprises and livelihoods activities were initiated in Year 3. In the Calamianes Island Group, several fisherfolk POs were provided with orientation workshops and assistance in proposal writing for rehabilitating their MPA, sea cucumber harvesting, mud crab fattening, and bamboo handicrafts. In South Negros, fisherfolk POs were assisted through orientation workshops and identification of potential projects for GPBP funding. In the Danajon Reef, orientation trainings were conducted for three POs in three municipalities. Finally, in the Verde Island Passage, four municipalities were assisted in project identification and proposal formulation.
ECOFISH COMPLETION REPORT 74

Business plans for those that are successfully funded were drafted through the project’s assistance under the enterprise development component.
Planning and scoping for social enterprise development was conducted for five MKBAs: South Negros, Calamianes Island Group, Verde Island Passage, Danajon Bank, and Surigao del Norte. Potential fisherfolk PO beneficiaries were identified in South Negros, VIP, and Surigao del Norte. Potential enterprises were identified in South Negros, CIG, VIP, and Surigao del Norte. Partner NGOs to help implement on-the-ground activities for social preparation and product development were identified in South Negros, VIP, and Danajon Bank. Coordination with other USAID projects working in similar sites and overlapping with the enterprise development work was initiated, particularly with COMPETE (for CIG and Danajon Bank) and CDI (for VIP). Finally, the partnership with the Asian Institute for Management (AIM) was established, wherein their Social Incubation Lab will work hand-in-hand with the establishment of social enterprises in ECOFISH sites.
Results of the value chain studies were presented to various LGUs and partners across the eight MKBAs. Results were utilized by partners to guide them in the establishment of social enterprises in selected communities (e.g., sea cucumber ranching in CIG and mud crab fattening in Surigao del Norte), and also to identify management interventions for fishery resources like the blue crab in Danajon Reef, tuna in Negros, and sardines in San Bernardino Strait.
For the special case of the ancestral domain of the Tagbanuas in Coron Island, the project continued to provide technical assistance in drafting their business plan for their tourist attractions located inside their ancestral domain. Financial processes were documented, strategic plans formulated, and their business plan finalized. Another special case is in Siargao Island of the Surigao del Norte MKBA, wherein user fees recommended by the project are to be implemented by the PAMB of Siargao Protected Landscape.
Conservation enterprises were implemented in all eight MKBAs. Social preparation commenced in all sites. Business plans were completed for Negros and VIP. EAFM orientation was provided to all PO beneficiaries except in CIG, workshops were held in November 2016. Finally, baseline surveys were conducted for all enterprise beneficiaries, in line with the requirements of the Theory of Change evaluation questions.
Use of Science in Various Aspects of the Project. The ECOFISH project is extremely proud of its extensive use of science, from simple to complex, in the many aspects of project implementation and activities. ECOFISH applied trophic systems modeling using the EwE software to establish base models for each focal area to investigate the potential impacts of various fisheries harvest scenarios and guide partners and stakeholders to agree on the right-size of fishing effort. Hydrodynamic studies, dispersal models, and fish plankton surveys characterized marine water circulation patterns in scales relevant to the dispersal of fish larvae within the MKBAs. These served as key inputs to determining the ideal location of individual MPAs to contribute and improve ecological functioning of the MPA networks. Geospatial analysis, GIS tools, and simple geometry were applied to develop and refine specific ecological design principles in order to improve MPA network performance, such as area, shape, compactness, distances, home range of key species, percent representation of different habitat types (reef, mangrove, or seagrass), and seasonal water temperature variability (to identify potential resilient reefs). MSP principles and GIS tools combined primarily with citizen science and local knowledge were applied to draft the zoning schemes in project areas. The pilot assessment of blue swimming crabs in the Danajon Reef applied Murdoch University’s Length-Based Spawning Potential Ratio (LB-SPR) as reference point to guide local government in its management and served as case study for BFAR’s
ECOFISH COMPLETION REPORT 75

National Blue Swimming Crab Management Plan. The project team facilitated reproductive biology studies and trainings primarily on the collection and analysis of gonadal maturity data, to support the various seasonal closure initiatives in different fishing grounds of the country. In partnership with NOAA, ECOFISH utilized the Visible Infrared Imaging Radiometer Suite (VIIRS) technology in capturing satellite images of night lights, particularly lights from fishing boats, as inputs to the design of fisheries management schemes (in Balayan Bay, Northern Palawan, and Ticao Pass) and verifying compliance to and effectiveness of the schemes.
On the social science side, the project conducted Willingness to Pay (WTP) studies to determine recreational values of MPAs that were used as the basis by LGUs for setting up user fees schemes for recreational use of MPAs. ECOFISH used economic valuation techniques to determine the economic values of identified use zones in the marine spatial plans. Local chief executives and resource managers became aware of the value of these resources and the need to optimize benefits derived from the current uses which translates into users fee or payments for potential damage. The project piloted the use of economic indicators of benefits derived from MPAs through the Socio-Economic Assessment Tool (SEAT). SEAT was used as basis for the MPA recognition awards conducted in the various MKBAs and the national recognition award of the MSN for MPA networks.
In the field of fishery law enforcement, ECOFISH used forensic science principles and actual experiences by forensic practitioners to improve BFAR’s existing methods in examining blasted fish. These new methods were incorporated into existing protocols to improve the accuracy of gathering and describing the necessary evidence caused by blasts. The ECOFISH enforcement team made practical use of analytical and planning tools (Porter Five Forces Analysis; Strengths, Weaknesses, Opportunities, and Threats Analysis; Scenario Planning) to understand the causes of coastal and fishery violations in communities, to map out threats, and to understand enforcement organizational responses, in order to conduct preventive and pre-emptive seaborne planning.
ECOFISH COMPLETION REPORT 76

4.0 IMPACTS, SUSTAINABILITY, AND LESSONS LEARNED
Coron Island, in the Calamianes Island Group MKBA, is a major tourist destination. ECOFISH provide technical assistance to the Tagbanua, the indigenous people of the island group, to adopt appropriate technology and management tools to supplement their traditional conservation practices.
ECOFISH COMPLETION REPORT 77

ECOFISH was designed to create an impact that would lead to achieving its goals by implementing an array of strategic interventions ensuring these goals were sustainable beyond the life of the project. The prioritization of the interventions—choosing partners, nurturing local champions, and impacting expansion areas—were among the approaches that ECOFISH set in place to have a significant impact, thereby increasing the probability of sustaining the interventions beyond the life of the project. Below we present lessons learned from implementing the ECOFISH project:
4.1 PUBLIC-PRIVATE PARTNERSHIPS
• A PPP are not an end in itself. It is a valuable tool to facilitate innovation, enterprise development, advocacy, and resource management.
• PPPs cannot form naturally, especially when there is a requirement to link biodiversity conservation to fisheries management. Social preparation must be conducted to prepare fishing communities to be receptive to PPPs. In the absence of the project, the private or the public sector should play this role.
• The private sector could expand its investment, not just in getting a contract signed, but in preparing the beneficiary community. Otherwise, the public sector partner should provide this component. There are also NGOs (Alter Trade and DEVMAX) that can do the social preparation and capacity building, but will still require outside finance for these interventions, as ECOFISH did for the conservation enterprises. Private sector investment can be utilized as critical in unlocking public investment. Strategic partnerships developed during the lifetime of ECOFISH highlighted the potential of private sector investments unlocking public sector investment.
• Technology is a tool that can be used to empower local stakeholders and partners.
4.2 SCIENTIFIC STUDIES
• Reliability and representativeness of data inputs were critical to develop an equally representative model (garbage in, garbage out). Support activities included the quality assurance/quality control of fish catch monitoring data; the conduct of supplementary fisheries inventories in the four new MKBAs (unplanned activity) to ensure accurate and updated information, and extensive literature review and gathering of secondary information on aspects of the biology and trophic ecology of the different interacting ecological groups that make up the models.
• With actual study results to inform and support management, partners were more confident in implementing policies with concrete scientific backing.
• Early engagement/participation of partners (via consultations, FGD, participatory gathering of local information) was very important to save time and resources in identifying focal species and gears. This approach also made science less intimidating to partners, and ultimately generated a strong demand for scientific information in the succeeding project interventions.
• Acquiring inter-LGU and inter-agency support lends to higher probability of success and sustainability, as clearly demonstrated in the examples highlighted.
4.3 ESTABLISHMENT OF MPAS AND NETWORKS OF MPAS
• Altogether, the hydrodynamic studies, larval dispersal models and fish plankton studies served as inputs to the development of MPA network designs, particularly in evaluating the appropriateness of the location of existing MPAs and in identifying potential sites for the establishment of additional MPAs. It was important to identify the appropriate partner institutions with the technical
ECOFISH COMPLETION REPORT 78

competencies to conduct such studies at the onset (project proposal phase). University networks and local academic institutions—particularly two main partner research institutions, UPVFI and UPMSI—played a key role in providing sustained services to support the technical needs of the project to accomplish this deliverable.
• Participatory process led to the development of a training/workshop design that is practical, user-friendly, and utilizes both local knowledge and sound scientific principles as equally important inputs to the evaluation of individual MPAs and MPA network effectiveness. The design process is a practical application of EAFM whereby partners were able to realize the system-wide scale of the biophysical factors that affect their MPAs and the inter-connectivity of their coastal and marine habitats. The workshops prompted partners to take on a more holistic outlook in evaluating their MPAs and stimulated inter-LGU planning and cooperative management.
• As a sustainability mechanism, the project saw the value in anchoring the management of MPA networks to existing inter-LGU governance alliances in the MKBAs. These MPA networks were further enhanced by setting up mechanisms to improve further through recognition awards.
• Technical support for MPA network design, implementation, and monitoring was conducted through local trainings. This will result in an expanded coverage of project impacts and sustainability with partners that have been trained in network design can continue monitoring and MPA trainings in non-ECOFISH sites.
• Early project interventions to revisit, assess, and provide technical assistance to strengthen existing MPAs and MPA networks have contributed to their improvements, such that many of these project-supported MPAs ended up either winning or ranking high in recognition awards for best managed MPAs in local, provincial/regional, and national settings.
4.4 INTER-LGU FISHERIES MANAGEMENT PLANNING
• Inter-LGU activities bring to the fore common issues shared by the LGUs. Eventually, the LGUs come to realize the system-wide scope of fisheries problems, and that collaboration with neighboring LGUs is the only effective way to address the severity of the problems. The interactive and highly participatory processes break the barriers between LGUs and promotes inter-LGU dialogue, negotiations, and planning.
• The use of the EAFM governance benchmarks provided planning focus and specific thematic targets for the LGUs. The benchmarks were useful in providing criteria so the LGUs can do self-assessment of their progress and accomplishments toward the application of EAFM.
4.5 MARINE SPATIAL PLANNING
• The planning officers of partner LGUs expressed their appreciation of the marine spatial planning process and tool as it now allows them to fulfill the national requirement to expand their existing Comprehensive Land Use Plans into a Comprehensive Land and Water Use Plan that includes the spatial planning of municipal waters. In addition, the estimated economic values of the water zones can now provide them with bases for fees, fines, and penalties. The use values can likewise serve as guide in determining priorities for the municipal waters with respect to their IFRM plans and Comprehensive Development Plans.
• The project has always held that MSP is only one part of the EAFM tool box for management and control measures. To be effective, it requires that fisheries law enforcement and other safeguarding arrangements are in place to support inter-sectoral policy and management.
ECOFISH COMPLETION REPORT 79

• In the initial stages of MSP, comprehensive, spatially explicit data on ecosystem characteristics, human uses and municipal water jurisdictions are required. However, this information is often not available for the majority of partner LGUs. While presenting a challenge, these data limitations should not serve as a reason for not pursuing MSP at all.
• In ECOFISH, data limitations were addressed by tapping into the local knowledge of LGU technical partners and resource users/stakeholders during the training workshops. This means that the participants themselves identified the use conflicts and compatible activities, defined and mapped out standard coastal and water use zones, and collectively agreed on the initial guidelines for each of the proposed water use zones. The information that the partners provided (e.g., rough table maps) were later refined in subsequent validation workshops and with external inputs from other technical partners. In the end, this process that was initially heavily reliant on stakeholder engagement and consensus-building, turned out to be the critical element for its acceptance.
• Also initially, the decision and policy-makers (i.e., LCEs and SBs) were not as ready as the technical planners to see the importance of MSP until the specific and or potential benefits were demonstrated by incorporating the zone values. The resource valuation studies conducted with local partners earlier in project implementation resulted in estimates of current and potential values of marine resources that included specific values identified during the MSP activities.
• The ECAN’s adoption of the MSP in CIG is viewed as a sound sustainability mechanism for its long-term implementation. This likewise provides a solid endorsement of the MSP as a tool of EAFM with demonstrable applications at various scales—from the LGU, to clusters of LGUs (MKBA), and to province-wide application.
4.6 RIGHT-SIZING OF FISHING EFFORT
• Before engaging the partners in stakeholder consultations to determine the appropriate MKBA-wide fishing effort configuration, there was first a need to develop among them the basic understanding of EAFM and the relevant biological concepts and ecological principles governing fishery stocks. Tailored learning activities worked best to simplify and popularize what would otherwise be highly complex scientific concepts. Through a combination of games, simulation workshops, and lectures, the participants were familiarized with EAFM, as well as on the foundation concepts and principles in fish stock assessment and trophic dynamics in marine ecosystems within a relatively short time. The terms “EAFM,” “ecological well-being,” “human well-being,” and “good governance” became common by-words and have seemingly become part of the participants’ vocabulary at the end of the right-sizing workshops. The use of best scientific information available, when communicated properly to stakeholders is highly appreciated and accepted for objective decision-making.
• We realized that right-sizing activities have to be put in the context of EAFM and not viewed merely as a means to regulate fishing effort. Creating awareness on the basics of EAFM was empowering for the participants as well, as they ultimately demonstrated more confidence in approaching or tackling other fishery resources related issues that the project is helping them address. In other words, while the foundation concepts of EAFM facilitated the smooth conduct of right-sizing activities (i.e., scenario simulations of fishing effort re-allocation and evaluation of their impacts, inter-LGU negotiation, and consensus-building), the process itself deepened the partners’ understanding of EAFM with increased appreciation of the human well-being component.
• The roll-out of right-sizing and presentation of fish catch monitoring results creates a lasting impact and increased participation by LGUs, coastal communities and partner agencies in the management of their coastal and fisheries resources. For example, national government agencies like the BFAR,
ECOFISH COMPLETION REPORT 80

DENR, DILG, and DSWD are now more objective in providing livelihood assistance to fisherfolk in coastal communities.
• Motorized and non-motorized boats were formerly indiscriminately distributed by these agencies, with no knowledge of the existing fishing effort configuration in these areas and its effects to the coastal and fisheries resources. In the end, more fishing gears and boats may have been distributed and added to the already high levels of fishing effort in these areas, or equally problematic is the distribution of fishing gears that are not appropriate for area (owing to oceanographic and other bio-physical conditions). With the technical information provided by ECOFISH project during the series of consultations and workshops, the partner agencies now have a basis on which fishing gears are appropriate for the area and how many can still be accommodated based on targets set by the LGU partners.
• The gear limits or caps set by LGUs through the right-sizing initiative of the project now serves as a basis for the limited issuance of fisheries licenses in the defined ecosystems of the MKBAs. This represents the first ever effort-based fisheries license control intervention in the country.
• However, translating the right-sizing outputs (MKBA-wide and LGU-based gear configuration targets) into enforceable policy instruments (e.g. fisheries ordinance) is not immediate. This will be highly dependent on the readiness of LGUs to apply economic instruments (e.g. gear swap, buy-back schemes, alternative livelihoods for displaced fishers, etc.), to enforce the license schemes, and to conduct monitoring. The partners also emphasized that they need some time to educate and conduct information dissemination campaigns prior to the full implementation of fisheries right-sizing.
• Therefore, supporting/complementary interventions will also need to be pursued (highlighting the inter-dependency of ECOFISH deliverables). Examples include: ‒ Economic factors (socioeconomic support and interventions), such as the development of
conservation enterprises (social enterprises) that can accommodate fishers that may be displaced when limited licensing schemes are implemented.
‒ Legal and regulatory factors, such as explicit and well-crafted fisheries ordinances and strong fisheries law enforcement.
‒ [Developing/Supporting] accountable and capable institutions, such as in ensuring that the IFRM plans (where the targeted licensing schemes are defined) are supported by business plans for their implementation, and that LGU partners are skilled in basic fish catch monitoring and in maintaining registration and licensing databases.
‒ [Building] constituencies for conservation, such as training partners in the academe and the NSAP in the use of ecosystems models to provide the necessary technical support to LGUs in subsequent monitoring and evaluation of future fishing effort configurations; and also to scale up application of fisheries right-sizing in regional fisheries contexts.
4.7 ADVANCED TRAININGS IN SPECIALIZED FISHERIES MANAGEMENT
• The advanced trainings in fisheries and in MPA assessment support the development of accountable and capable partner institutions, and at the same time, build constituencies for conservation that will scale up project interventions and ensure implementation in the long term.
• The NSAP is the obvious recipient of advanced trainings in fisheries to continue with the more detailed and comprehensive research surveys to support the monitoring and evaluation not only of the species-specific management interventions, but also of gear-specific management interventions and right-sizing of fishing effort at the inter-LGU or MKBA-wide level.
ECOFISH COMPLETION REPORT 81

• While the LGU partners are not expected to conduct the same level of detail and sophistication of fisheries monitoring, the advance trainings nevertheless provided the LGU partners with insights into the system-wide implications of their localized management interventions. Applying the same methods and standards even for the collection of basic fisheries information makes their data compatible and comparable with the same types of information that are collected by neighboring LGUs and by the NSAP on a regional scale.
4.8 ECONOMIC INCENTIVES FOR SUSTAINABLE FISHERIES
• One of the tracks the project attempted was the establishment of PPPs in support of enterprise development, which meant finding enterprises that would either wean fishers away from harvesting, or increase the value of harvests through the introduction of additional value added activities such as food processing. In the course of project implementation, what emerged as a gap in PPP implementation was finding partners who are willing to invest in social preparation activities. These types of partners were crucial in getting the POs ready to engage in enterprise development. Private sector partners were willing to invest if a viable business model was in place. However, getting there meant strengthening the POs beforehand. ECOFISH was able to fill in this gap in its project sites. In future endeavors, though, this funding gap should be addressed if PPPs are to be established in relation to enterprise development among fisherfolk POs.
• The economic studies initiated by the project included three innovative tools for policy-making: economic valuation of five major marine uses in the MKBAs: fishing, mariculture, recreation, MPAs and mangrove forests, with the inclusion of ancestral domain areas in CIG; WTP surveys that estimated the recreational value of selected tourist attractions, thereby serving as basis for setting user fees; and the SEAT designed to assess the level of socioeconomic benefits being provided by MPAs to the immediate communities surrounding them. In most cases, the tools designed by ECOFISH relied mainly on locally available data, i.e. data that is generated by the LGUs themselves, making it easy for them to provide the data and replicate the tools later. In other instances, the primary surveys of ECOFISH were used to inform the studies. Aside from making LGUs realize how valuable their marine resources are, the economic tools proved to be highly attractive because of their direct translation into higher revenues, while not having to resort to extraction or degradation. The economic tools allowed the LGUs to pursue conservation, and at the same time created new sources of local revenues for the government. The use of SEAT broadened the perspective of LGUs in viewing their MPAs, as direct links with socio-economic indicators were established.
• People, Process, Project—Engaging Communities as active champions of their own development rather than as beneficiaries. In order for partnerships to be sustainable and respectable at a local level, community partners need to be considered and encouraged as active and independent players and, more importantly, as champions of their own development—despite the unintentional tendency of government programs to treat them as beneficiaries.
ECOFISH COMPLETION REPORT 82

APPENDICES
In Siargao Island, many residents made a living cutting down mangroves to sell as firewood. USAID’s ECOFISH project helped community members start conservation enterprises in mangrove areas, such as ecosystem-friendly mud crab fattening.
ECOFISH COMPLETION REPORT 83

APPENDIX A. EAFM BENCHMARKING FOR LGUS IN THE ECOFISH MKBAS
EAFM as a process has already been practiced in the region. In the East Asia region as a whole, management of fisheries has been attempted at various ecological scales such as large marine ecosystems (LMEs), bays, gulfs, and other spatially defined seas. In many instances, specific fish or invertebrate species in these ecological scales have been the focus of management but due to the multi-species and multi-gear nature of fisheries the management approach has always been on multi-species scale. What have been lacking are the understanding of the interaction among the various components of the ecosystem that could have been a crucial input to management interventions and the establishment of a governance system or at least effective institutional mechanisms that implement management interventions.
As an ecosystem approach, EAFM tends to be complex. To make it workable, it is best for it to be disaggregated into its practical elements with corresponding expected results. At the national level, EAFM activities may only be limited to policy formulation, enactment of laws, or agreements on number and areas of geographies subject to fisheries management. At the site level, however, EAFM activities and expected results can be more specific. Below is a set of recommended generic results at the LGU and clusters of LGUs used during the FISH project that can also be applied by ECOFISH.
Generic results at the MKBAs include:
1. Delineated ecosystem boundaries that reflect institutional and political elements to manage the ecosystem as one management unit.
2. Determined the habitat need of important harvestable organisms that constitute the “significant food web”.
3. Incremental understanding of the components of the ecosystem and the dynamics of the entire ecosystem.
4. Developed and set in place a functioning network of MPAs. 5. Developed indices of ecosystems’ health as targets for management. 6. Assessed how removals affect the stock size, harvest, and trophic structure and gradually achieve an
appropriate overall fishing effort restrictions or configuration. 7. Assessed institutional elements of the ecosystem which most significantly affect fisheries and
developed appropriate institutional mechanisms to effectively implement management interventions. 8. Developed and implemented strategies such as management planning, zoning schemes, gear/species-
specific management, registration and licensing, law enforcement, and temporal and permanent no take zones.
9. Established governance system that is responsive to ecosystems approach (it should cover the boundary, scale and scope of the fishery system)
10. Developed and instituted monitoring schemes used for fisheries management.
These generic results were used as guide in developing specific benchmarks that cover as many EAFM elements as possible. This benchmarking follows the system developed by CRMP’s monitoring and evaluation guidelines for municipal/city CRM (DENR-CMMO 2003) and the proposed template for the development of a municipal fisheries management benchmarking system in the Philippines (FISH project, 2010). The levels of the benchmarking system follow the orders of governance outcomes described in Olsen (2003) wherein each level corresponds to the order of governance. Only in this case, levels 3 and 4 were lumped together. Each level is likewise considered a building block to subsequent levels.
ECOFISH COMPLETION REPORT 84

The purpose of setting the benchmarks is to provide a framework to guide implementers, particularly the fisheries managers, in effectively implementing EAFM programs primarily by providing guideposts for the various stages of their implementation. The benchmarks are subdivided into two major groups: (A) Basic requirement and (B) Site specific requirement. The first (A) covers the basic requirements and can be implemented across all priority geography sites, and the second (B) are site specific and may only be carried out in specific priority geographies. The EAFM Benchmarks are given in the table below (Table A-1) followed by the detailed benchmarks description at various levels of implementation (Table A-2).
Table A-1. EAFM Benchmarks
Benchmark Level 1
Programs Established
Level 2 Programs Functional
Level 3 Programs Sustained and Results Realized
A. Basic Requirements 1 Ecosystem
boundaries established
Ecosystem boundaries drawn and established
Formal agreement on ecosystem boundaries
Ecosystem boundaries legally recognized by the national government
2 Coastal marine habitat monitoring and management planning established
Coastal marine habitat baseline assessment conducted and habitat profile developed
Coastal marine habitat monitoring conducted regularly and feedback to stakeholders and resource users
Results of coastal marine habitat monitoring used in formulation of marine habitat management actions
3 Fisheries monitoring and early fisheries management planning established
Fisheries baseline assessment conducted and fisheries profile developed
Fisheries monitoring conducted regularly and feedback to stakeholders and resource users
Results of monitoring used in formulation of fisheries management plans and actions
4 Fisheries Law enforcement team and program established
Fisheries law enforcement team and law enforcement program established
Fisheries enforcement operations regularly conducted and enforcement database established
Fisheries enforcement operations sustained and enforcement effectiveness evaluated Collaborative enforcement with other participating local governments conducted (e.g. joint enforcement)
5 Comprehensive fisheries management plan conducted and regularly updated
Comprehensive fisheries management plan developed and adopted
Comprehensive fisheries management plan implemented (with corresponding legal and policy instrument) and programs in the plan continuously funded
Fisheries management plan revised or updated based on the monitoring results
6 Fisheries management office established and operational
Fisheries management office in each local participating government established with corresponding mandate and staff
Coordination among offices within the local government, institutional partners, and other participating local governments established
Leveraging support of programs with institutional partners and collaborative endeavors with participating local governments within the ecosystem boundary established.
ECOFISH COMPLETION REPORT 85

Benchmark Level 1 Programs Established
Level 2 Programs Functional
Level 3 Programs Sustained and Results Realized
7 Fisheries registration and licensing system established
Fishers, boats and fishing gears registration and licensing system established
Fishers, boats, and fishing gears registration and licensing system implemented and enforced
Fishers, boats, and fishing gears registration and licensing system implementation sustained and information from the database for fishing effort control and regulations
8 Network of Marine Protected Areas (MPA) established
Individual MPA or MPAs established, baseline data collected, MPA management plan implemented, and monitoring system established
Individual MPA or MPAs sustained and MPA network arrangements established
MPA network arrangements implemented, enforced and sustained
9 Fisheries use zoning plan established
Fisheries and other uses identified and zoning plan developed
Fisheries use zoning plan implemented (with corresponding legal or policy instrument) and monitored
Fisheries use zoning plan improved, sustained and objectives attained (e.g. conflict reduced)
10 Local constituencies for fisheries management organized and actively involved
Local constituencies for fisheries management organized
Local constituencies for fisheries management actively participated in program development and implementation
Local constituencies for fisheries management sustained and expanded
11 Multi-institutional collaboration on CFRM
Multi-institutional collaboration on CFRM established
Multi-institutional collaboration on CFRM effectively implemented programs and services
Multi-institutional collaboration on CFRM sustained and showing positive impacts
B. Site Specific Requirements 12 Species-specific
management measures established
Species that constitute the “significant food web” identified and baseline assessment conducted
Species-specific management measures developed, enforced and monitored
Species-specific management measure sustained and monitoring results show impacts
13 Gear-specific management measures established
Gear-specific management measure identified and baseline assessment conducted
Gear-specific management measures developed, enforced and monitored
Gear-specific management measure sustained and monitoring results show impacts
14 Mangrove management area established
Mangrove management area established and baseline data collected
Mangrove management plan developed, implemented and monitoring system established
Mangrove management sustained and monitoring results show impacts
15 Seagrass management area established
Seagrass management area established and baseline data collected
Seagrass management plan developed, implemented and monitoring system established
Seagrass management sustained and monitoring results show impacts
ECOFISH COMPLETION REPORT 86

Benchmark Level 1 Programs Established
Level 2 Programs Functional
Level 3 Programs Sustained and Results Realized
16 Revenue generation established
Revenue generation system on CRM/fisheries management initiated
Revenue-generating measures effectively implemented and enforced
Revenue-generating measures sustained showing positive impacts
17 Coastal environment-friendly enterprises established
Coastal environment-friendly enterprises initiated
Successful coastal environment-friendly enterprises expanded
Coastal environment-friendly enterprises sustained showing positive impacts
ECOFISH COMPLETION REPORT 87

TABLE A-2. DESCRIPTION OF THE EAFM BENCHMARKS AT VARIOUS LEVELS
Benchmark Benchmark Description 1. Ecosystem
boundaries established
Level 1: Ecosystem boundaries drawn and established • Ecosystem boundaries drawn incorporating institutional and political consideration Level 2: Formal agreement on ecosystem boundaries • Ecosystem boundaries agreed upon by the participating local governments through a memorandum of agreement or other
form of policy instrument Level 3: Ecosystem boundaries legally recognized by the national government • Ecosystem boundaries recognized by the national government as part of its Coral Triangle Initiative
2. Coastal marine habitat monitoring and management planning established
Level 1: Coastal marine habitat baseline assessment conducted and habitat profile developed • Marine habitat profile developed through compilation of secondary data and baseline assessment of the status of coral,
seagrass, and mangrove habitats • Issues and opportunities pertaining to coastal habitats, socio-economic, governance and other related issues identified • Key indicators for habitat, socio-economic and governance aspects developed as part of the future monitoring and
evaluation Level 2: Coastal marine habitat monitoring conducted regularly and feedback to stakeholders and resource users • Key habitat data collected analyzed and compared to baseline • Analyzed monitoring results presented to stakeholders and resource users Level 3: Results of coastal marine habitat monitoring used in formulation of marine habitat management plans and actions • Baseline and monitoring results analyzed and results used to formulate habitat management options • Habitat management options presented to stakeholders for formulation of habitat management plan or improvement of
existing habitat management plan • Habitat management plans enacted
3. Fisheries monitoring and early fisheries management planning established
Level 1: Fisheries baseline assessment conducted and habitat profile developed • Fisheries profile developed through compilation of secondary data and baseline assessment of the status of fishery
resources, fishers, and fishing effort (boats and gears) • Issues and opportunities pertaining to fisheries, socio-economic, governance and other related issues identified • Key indicators for fisheries, socio-economic and governance aspects developed as part of the future monitoring and
evaluation Level 2: Fisheries (catch and effort) monitoring conducted regularly and feedback to stakeholders and resource users • Key fisheries data collected analyzed and compared to baseline • Analyzed monitoring results presented to stakeholders and resource users Level 3: Results of fisheries monitoring used in formulation of fisheries early action plans
ECOFISH COMPLETION REPORT 88

Benchmark Benchmark Description • Baseline and monitoring results analyzed and results used to formulate initial fisheries management options • Fisheries management options presented to stakeholders for formulation of specific fisheries management intervention or
improvement of existing fisheries management interventions 4. Fisheries Law
enforcement team and program established
Level 1: Fisheries law enforcement team and law enforcement program established • Members of the fisheries law enforcement identified, trained and deputized • Law enforcement program developed and funded • Law enforcement assets (boats, radios, GPS, etc. procured) Level 2: Fisheries enforcement operations regularly conducted and enforcement database established • Fisheries law enforcement operation planning (Oplan) regularly conducted • Results of enforcement operations documented in a form of data base • Coordination mechanism with agencies (police, navy, coast guard) having coastal and fisheries law enforcement mandates
established Level 3: Fisheries law enforcement operations sustained and enforcement effectiveness evaluated. Collaborative enforcement with other participating local governments conducted • Fisheries law enforcement operations continuously funded • Training of fishery law enforcement team regularly updated • Effects of fisheries law enforcement evaluated and operations improved • Joint enforcement with other participating local governments conducted
5. Comprehensive fisheries management plan conducted and regularly updated
Level 1: Comprehensive fisheries management plan developed and adopted • Comprehensive fisheries management plan laid out programs and activities in response to issues identified in the baseline
assessment and profile • Comprehensive fisheries management plan incorporates habitat management plans and early fisheries management plans • Draft comprehensive fisheries management plan presented to stakeholders Level 2: Comprehensive fisheries management plan implement and programs in the plan continuously funded • Comprehensive fisheries management plan adopted through enactment of enabling policy instrument or legislation
(ordinance) • Programs and activities in the comprehensive fisheries management plan funded by the local governments Level 3: Fisheries management plan revised or updated based on the monitoring results • Comprehensive fisheries management plan reviewed, updated and revised following the results of the regular coastal
marine habitat and fisheries (catch and effort) monitoring schemes • Programs and activities in the comprehensive fisheries management plan regularly funded
6. Fisheries management office
Level 1: Fisheries management office in each local participating government established with corresponding mandate and staff
ECOFISH COMPLETION REPORT 89

Benchmark Benchmark Description established and operational
• Fisheries management office with mandate to implement and coordinate fisheries management activities established • Fisheries management office allocated with human and financial resources to perform mandated activities Level 2: Coordination among offices within the local government, institutional partners, and other participating local governments established • Staff of fisheries management office trained to effectively perform mandated activities • Linkages between fisheries management office, offices within the local government and institutional partners developed • Linkage between the fisheries management office and other participating local governments within the defined ecosystem
established Level 3: Leveraging support of programs with institutional partners and collaborative endeavors with participating local governments within the ecosystem boundary established. • Fisheries management office able to leverage financial and services support of programs with institutional partners and
other government agencies • Collaborative activities between the fisheries management office and other participating local governments in developing
common fisheries management policies, common ordinance and joint management planning established 7. Fisheries
registration and licensing system established
Level 1: Fishers, boats and fishing gears registration and licensing system established • Fishers, fishing boats, and fishing gear registration procedure established • Registration and licensing initiated • Fisheries registration and licensing data base developed Level 2: Fishers, boats, and fishing gears registration and licensing system implemented and enforced • Registration and licensing database functional and registration and licensing data stored and analyzed • Registration and licensing system fully functional Level 3: Fishers, boats, and fishing gears registration and licensing system implementation sustained and information from the database for fishing effort control and regulations • Database fully functional and information used to determine and monitor fishing effort • Fisheries and registration and licensing information used to revise and improve plans and policies on fisheries management.
8. Network of Marine Protected Area (MPA) established
Level 1: Individual MPA or MPAs established, baseline data collected, MPA management plan implemented, and monitoring system established • MPA site identified, boundaries delineated, zones (no-take and buffer zones) established • MPA baseline information (live hard coral cover, reef fish biomass, diversity, etc.) collected • MPA management plan and adopted (preferably supported by legal instrument), management body and enforcement team
trained and organized • Enforcement protocol operational, enforcement infrastructure established and enforcement assets procured and utilized
ECOFISH COMPLETION REPORT 90

Benchmark Benchmark Description • Management body and enforcement team conducted regular implementation and enforcement activities with funding
support from local government • MPA monitoring regularly conducted and compliance monitored Level 2: Individual MPA or MPAs sustained and MPA network arrangements established • Activities of the MPA Management body and enforcement team sustained • Implementation and enforcement activities funded by local governments • MPA monitoring sustained and impacts regularly presented to stakeholders • Components of the MPA network identified and MPA managers organized • Implementation and coordination arrangements established • Enforcement and monitoring protocols harmonized and agreed Level 3: MPA network arrangements implemented, enforced and sustained • MPA network management plan developed • Coordination meeting among MPA network management bodies regularly conducted • Programs in MPA network management plan implemented and funded • MPA bodies of members of the MPA network conduct collaborative MPA monitoring activities
9. Fisheries use zoning plan established
Level 1: Fisheries and other uses identified and zoning plan developed • Existing and potential municipal water uses identified and mapped, • Interaction among the various activities evaluated and conflicting uses identified and resolved • Proposed zonation map developed and regulatory mechanisms formulated Level 2: Fisheries use zoning plan implemented (with corresponding legal or policy instrument) and monitored • Fisheries use zoning plan presented to a broader stakeholder and resource users for approval • Enabling policy or zoning ordinance enacted and management and enforcement arrangement established Level 3: Fisheries use zoning plan improved, sustained and objectives attained (e.g. resource use conflict reduced) • Fisheries use zoning plan updated and revised • Implementation and enforcement zoning regulations sustained • Resource use conflict reduced
10. Local constituencies for fisheries management organized and actively involved
Level 1: Local constituencies for fisheries management organized • Fisheries management concerned organization formed Level 2: Local constituencies for fisheries management actively participated in program development and implementation • Fisheries management concerned organizations involved in policy formulation and review of management plan • Fisheries management concerned organization participated in program implementation and monitoring of results Level 3: Local constituencies for fisheries management sustained and expanded
ECOFISH COMPLETION REPORT 91

Benchmark Benchmark Description • Fisheries management concerned organizations actively lobby for the development of management measures and
implementation of the programs in the fisheries management plan 11. Multi-
institutional collaboration on coastal and fisheries resources management (CFRM)
Level 1: Multi-institutional collaboration on CFRM established • Potential partners from LGUs, NGAs, NGOs, academe, private sector and funding institutions identified • Potential arrangements among neighboring LGUs that form the ecosystem identified • MOAs and other instruments adopted through municipal legislative action or signed by collaborating partners and planning,
implementation coordination and monitoring arrangements established Level 2: Multi-institutional collaboration on CFRM effectively implemented programs and services • Multi-institutional CFRM program identified and plans for their implementation drafted • Multi-institutional CFRM activities coordinated, implemented, enforced and monitored Level 3: Multi-institutional collaboration on CFRM sustained and showing positive impacts • Multi-institutional CFRM program implementation sustained with measurable positive impacts to collaborating LGUs and
coastal communities • Multi-institutional collaborative mechanisms reviewed and improved contributing to effective management of coastal and
fishery resources 12. Species-
specific management measures established
Level 1: Species that constitute the “significant food web” identified and baseline assessment conducted • Economically important species that constitute to significant portion of the food web based on the fisheries profiling
process identified • Focus group discussion to identify early and immediate management action for identified economically important species
conducted • Baseline assessment of identified species conducted Level 2: Species-specific management measures developed, enforced and monitored • Species-specific management options for identified species drafted • Consultations on species-specific management options conducted • Selected species-specific management measure implemented (supported by legal instrument) • Fisheries monitoring protocol for identified species developed Level 3: Species-specific management measure sustained and monitoring results show impacts • Enforcement of species-specific management measure established and sustained • Fisheries monitoring of species-specific management intervention sustained and results regularly presented to stakeholders
and resource users 13. Gear-specific
management Level 1: Gear-specific management measure identified and baseline assessment conducted • Gear specific issues based on the fisheries profiling process identified • Focus group discussion to identify early and immediate management action for identified fishing gears conducted
ECOFISH COMPLETION REPORT 92

Benchmark Benchmark Description measures established
• Baseline assessment of identified fishing gears conducted Level 2: Gear-specific management measures developed, enforced and monitored • Gear-specific management options for identified fishing gears drafted • Consultations on fishing gear-specific management options conducted • Selected gear-specific management measure implemented (supported by legal instrument) • Fisheries monitoring protocol for identified fishing gears developed Level 3: Gear-specific management measure sustained and monitoring results show impacts • Enforcement of species-specific management measure established and sustained • Fisheries monitoring of gear-specific management intervention sustained and results regularly presented to stakeholders
and resource users 14. Mangrove
management area established
Level 1: Mangrove management area established and baseline data collected • Mangrove management site identified, boundaries delineated, zones (rehabilitation zones, aqua-silviculture zones, etc.)
established • Mangrove baseline information (mangrove species, mangrove cover, fish and invertebrate species, human activities)
collected • Mangrove management plan and adopted (preferably supported by legal instrument), management body and enforcement
team trained and organized Level 2: Mangrove management plan developed, implemented and monitoring system established • Enforcement protocol operational, enforcement infrastructure established and enforcement assets procured and utilized • Management body and enforcement team conducted regular implementation and enforcement activities with funding
support from local government • Mangrove monitoring regularly conducted and compliance monitored Level 3: Mangrove management sustained and monitoring results show impacts • Activities of the mangrove management body and enforcement team sustained • Implementation and enforcement activities funded by local governments • Mangrove monitoring sustained and impacts regularly presented to stakeholders
15. Seagrass management area established
Level 1: Seagrass management area established and baseline data collected • Seagrass management sites identified, boundaries delineated, zones (rehabilitation zones, rabbitfish protection zones, etc.)
established • Seagrass baseline information (seagrass species, seagrass cover, fish and invertebrate species, human activities) collected • Seagrass management plan and adopted (preferably supported by legal instrument), management body and enforcement
team trained and organized Level 2: Seagrass management plan developed, implemented and monitoring system established
ECOFISH COMPLETION REPORT 93

Benchmark Benchmark Description • Enforcement protocol operational, enforcement infrastructure established and enforcement assets procured and utilized • Management body and enforcement team conducted regular implementation and enforcement activities with funding
support from local government • Seagrass monitoring regularly conducted and compliance monitored Level 3: Seagrass management sustained and monitoring results show impacts • Activities of the mangrove management body and enforcement team sustained • Implementation and enforcement activities funded by local governments • Seagrass monitoring sustained and impacts regularly presented to stakeholders
16. Revenue generation established
Level 1: Revenue generation system on CRM/fisheries management established • Potential revenue-generating coastal and fishery management programs assessed and identified • Revenue-collection program established with clear purpose and implementation arrangements of how the funds will be
used in coastal and fisheries management activities • Specific-revenue ordinance enacted, or revenue clause (indicating use of funds) should be part of enacted fishery ordinance Level 2: Revenue-generating measures effectively implemented and enforced • Revenue-collection program implemented and compliance monitoring activities conducted • Revenues collected monitored, and program implementation evaluated and modified/adjusted if necessary Level 3: Revenue-generating measures sustained showing positive impacts • Revenue-collection program sustained implementation of revenue-generating measures • Revenue collection program and schemes for their use in the fisheries management program are already established
components of the local government’s Annual Investment Plan • Revenues from fisheries related interventions are plowed back to fisheries management activities
17. Coastal environment-friendly enterprises established
Level 1: Coastal environment-friendly enterprises initiated • Non-fishing livelihoods, low-impact mariculture, ecotourism established for fisherfolk/coastal communities to augment
incomes • Involvement and management arrangement defined • Socio-economic baseline and monitoring indicators established • Environmental carrying capacity Level 2: Successful coastal environment-friendly enterprises expanded • Environmental carrying capacity established and monitoring and control mechanisms set in place • Livelihood and enterprise development programs expanded employing fisherfolk/coastal communities in non-fishing
livelihoods Level 3: Coastal environment-friendly enterprises sustained showing positive impacts • Livelihood and enterprise development programs sustainably sustained.
ECOFISH COMPLETION REPORT 94

Benchmark Benchmark Description • Monitoring resulted in measurable socioeconomic benefits to fisherfolk/coastal communities
ECOFISH COMPLETION REPORT 95

APPENDIX B. ADDITIONAL INFORMATION
TABLE B-1. MUNICIPALITIES THAT CONSTITUTE THE FOCAL AREA OF ECOFISH PROJECT, AREA OF THEIR MUNICIPAL WATERS, AND LENGTH OF THEIR COASTLINES
Province Municipality
Area of Municipal Water (km2)
Length of
Coast- line
(km)
Province Municipality
Area of Municipal Water (km2)
Length of
Coast- line
(km) Calamianes Island Group MKBA South Negros MKBA
Palawan
Busuanga 1,895 243 Negros Occidental
Cauayan 854 55 Coron 3,241 550 Hinoba-an 557 47 Culion 1,581 454 Sipalay 390 44 Linapacan 3,661 344
Negros Oriental
Basay 302 16 Danajon Reef MKBA Bayawan 114 15
Bohol
Buenavista 81 12 Santa Catalina 292 26 Clarin 41 7 Siaton 788 43 Getafe 198 68 Surigao del Norte – Surigao del Sur MKBA Inabanga 144 22
Surigao del Norte
Bacuag 92 7 Tubigon 396 26 Claver 103 43
Leyte
Bato 331 4 Gigaquit 84 7 Baybay 345 42 Placer 69 41 Hilongos 109 11 Surigao City 507 193 Hindang 181 10 Tagana-an 211 1,389 Inopacan 348 10 Sulu Archipelago MKBA Matalom 113 16
Tawi-Tawi
Bongao 762 106 S. Leyte Maasin 272 22 Panglima Sugala 791 195 Lingayen Gulf MKBA Sapa 794 85
La Union
Agoo 83 6 Simunul 889 55 Aringay 112 7 South Ubian 2,209 213
Bauang 195 16 Tandubas 380 369
Caba 89 6 Verde Island Passage MKBA Rosario 61 4
Batangas
Balayan 26 10 San Fernando City
231 20 Bauan 127 14
Santo Tomas 148 11 Calaca 39 10 Pangasinan Alaminos 232 39 Calatagan 681 59 Ticao Pass - Lagony Gulf - San Bernardino MKBA
Lemery 44 9
Sorsogon
Bulan 359 35 Mabini 158 27 Matnog 226 51 San Luis 65 7 Santa Magdalena
139 14 Taal 28 2
Northern Samar
Biri 543 52 Tingloy 393 44
ECOFISH COMPLETION REPORT 96

TABLE B-2. ECOFISH CASE STUDIES
Subject Short Description
1. Limiting Basnigan Operations (Coron)
Basnigan operators of Coron agree to set limits on the number of operators to ensure sustainability. The voluntary measure is formalized in the local fisheries ordinance.
2. Siete Pecados Marine Park (Coron)
Siete Pecados Marine Park in Coron is a model for sustainable MPA management, which was further strengthened by adopting and faithfully implementing a management plan.
3. Tagbanua Indigenous Resource Management (Coron)
Enhancing Tagbanua indigenous resource management with science, conservation enterprises, and good governance
4. Combating Illegal Fishing in Danajon Bank
Addressing illegal fishing in Danajon Bank through better enforcement and re-allocating access to fisheries through the right-sizing of fishing effort
5. Blue Swimming Crab (Bohol) Improving stocks of blue swimming crabs through proper harvesting methods that takes into account the biology and ecology of the crab
6. Forum on the Impact of Natural Disasters (Bohol)
Improving understanding of natural disasters to enhance resilience of residents affected by the earthquake and Typhoon Haiyan in Bohol
7. La Union Baywatch Network Revitalizing inter-LGU cooperation for sustainable fisheries in Lingayen Gulf
8. Seaweed Farming in Capul Improving skills for seaweed enterprises in Capul as an example of conservation livelihoods; assisted by SPPI
9. Barangay Ipil (Bongao) Sustainable Dilis Enterprise
From a history of blast fishing, community members strengthened enforcement, which led to the recovery of fish stocks, including the anchovies that now bring income to fishers through high-value processed products.
10. Enforcement Sidebar-Radio (Bongao)
A radio show in Bongao raises awareness of the community on conservation initiatives
11. DALOY pilot (Bongao) PNP-MG successfully pilots DALOY text alert to improve fisheries law enforcement in Bongao
12. KAMAMANA (Siargao) From mangrove cutters, community members shift to mangrove crab fattening as livelihood, which prevents further destruction of the mangrove forest
13. Stopping Liba-Liba in Surigao Liba-liba operators challenge the BFAR regulation banning the operation of liba-liba (Danish seine and modified DS) and BFAR makes an effort to convince the operators of its negative impact
14. Prieto Diaz turtle conservation Prieto Diaz institutes incentive system to encourage fishers to release turtles caught in their nets.
15. PAPSIMCO (Siaton) Women’s group engage in mangrove crab fattening livelihood as an alternate to mangrove cutting
16. Conserving Siargao Protected Area
Conservation fees and enterprise development help shift resource use in Siargao Protected Area from illegal harvesting of mangroves to mangrove crab fattening to support tourism.
17. SNCDMC (South Negros Coastal Development Management Council)
The inter-LGU alliance in southern Negros Occidental is a model for sustainable governance at an ecological scale. SNCDMC provides important lessons for other inter-LGU cooperation.
18. Siargao TIFA and SIWA Associations
Supporting community volunteers against illegal fishing with livelihood options using indigenous materials (coco coir)
ECOFISH COMPLETION REPORT 97

Subject Short Description
19. BRAVO Award Batangas promotes MPA management by providing recognition and incentives to the best managed MPAs. BRAVO has become a model for other incentive schemes in other ECOFISH sites.
20. Closed Season in Balayan Bay Balayan Bay implements the first ever inter-LGU initiated closed season to allow recovery of dwindling fish stocks.
21. Women MPA Guards (Matnog) All-women volunteer guards of a marine protected area learn new skills to generate income from expanding tourism brought about by the improved condition of the marine environment.
22. Barongoy festival (Sipalay) Value-adding to increase income from barongoy (flying fish) and promoting a festival to celebrate and elevate its status; assisted by Alter Trade
23. Guiljungan Small Fisherfolk Association (Cauayan)
Guiljungan community is assisted by Alter Trade in developing sustainable livelihood alternative to fishing.
24. CENASADIA Coron Community organization starts a sustainable sea cucumber ranching enterprise science-based, ensuring good quality products that is biodiversity-friendly; assisted by PHILSSA.
25. Tagbanwas of Calawit Island Heritage Tourism (Busuanga)
Tagbanwas of Barangay Calawit, Busuanga (NTCQ) enhance their skills and improve community facilities to attract tourism in Calawit, a place rich in history and natural resources.
26. Batangas Ecotourism Circuit Several POs in San Juan, Lobo, and Batangas City created tour circuits to increase value of ecotourism services that complements coastal habitats management.
27. Wawa and Papaya (Nasugbu) Community organizations engaged in seaweed farming and conservation improve their livelihood income through seaweed chips processing; assisted by Pusod, Inc.
28. DEVMAX (Bohol) DEVMAX assisted several communities in Danajon Bank to establish conservation enterprises - many of the community participants in the past engaged in illegal activities (liba-liba, mangrove cutting) but shifted to biodiversity-friendly livelihoods.
TABLE B-3. FISH LANDING SITES SELECTED FOR THE FISHERIES-DEPENDENT SURVEY IN THE EIGHT MKBAS DURING THE BASELINE ASSESSMENT IN 2013 AND MONITORING IN 2015
Municipality/Landing Site Municipality/Landing Site Municipality/Landing Site Calamianes Island Group MKBA Lingayen Gulf MKBA Surigao del Norte and del Sur
MKBA Busunga Agoo Bacuag Bogtong Bani Poblacion Salvacion Damortis Claver Coron Alaminos Panatao Barangay 1-Bakawan Bolo Islands, Telbang Gigaquit Barangay 1-Comesaria San Fernando Gigaquit Public Market Barangay 2 Ilacanos Sur Nagubat Barangay 5-Bancuang Poro Punta Alambique Bintuan San Bernardino – Ticao Pass –
Lagonoy Gulf MKBA Placer
Bulalacao Banga
ECOFISH COMPLETION REPORT 98

Municipality/Landing Site Municipality/Landing Site Municipality/Landing Site Diguiboy Bulan Surigao City Maquinit Bulan Punta Bilar Tagumpay Matnog Taganaan Culion Tablac Cawilan Balala Santa Magdalena Sampaguita Bernabe Barangay 1
Verde Island Passage MKBA Chindonan Barangay 3 Culango Poblacion 4 Calatagan Jardin
South Negros MKBA Balibago
Libis Balombato Osmena Bayawan City Burot Sitio Pescadores Banga Poblacion 2
Danajon Bank MKBA Buyco Poblacion 4 Malabugas Mabini
Buenavista Pagatban Pantalan Anilao Asinan Suba Port Tingloy Clarin Tinago Santo Tomas Nahawan Santa Catalina Tingloy Getafe Cawitan
Tawi-Tawi MKBA Handumon Fatima Nasingin San Pedro Bongao Pandanon Siaton Chinese Pier Inabanga Agbagacay Kasulutan Cuaming Albiga Lamion Hambongan Malabuhan Public Market Lawis Maloh Panlima Sugala Sto Nino Nagba Batu-Batu Tubigon Nasipit Simunul Bagongbanwa Bakong Pandan Mastul Tinagan Pagasinan Sukah Bulan Tubig Indangan Ubol
TABLE B-4. CANDIDATE SPECIES IN EACH MKBA IDENTIFIED BY STAKEHOLDERS FOR SPECIES-SPECIFIC MANAGEMENT
MKBA Background Studies Compiled (Biological and Ecological Information, Fisheries Assessment Reports)
Lingayen Gulf • Malaga or reef rabbitfishes (Siganus vermiculatus, and other siganid species, such as S. canaliculatus) whose wild fry and juveniles are currently exploited as stocking material for mariculture and also marketed as padas or fish bagoong; espada or hairtail (Family Trichiuridae), the juveniles of which are marketed as dried fish products; mackerels (Rastrelliger spp.) and small tuna-like species in the area (e.g. Auxis spp.) that comprise a huge volume in the commercial fisheries catches
ECOFISH COMPLETION REPORT 99

MKBA Background Studies Compiled (Biological and Ecological Information, Fisheries Assessment Reports)
Calamianes Island Group
• Suno or leopard coral grouper (Plectropomus leopardus), which is an important commodity in the live reef fish trade; rabbitfishes (Siganus spp.), with a previous close-season initiative under FISH project; blue crabs (Portunus pelagicus), which comprise a significant portion of the catch particularly in Busuanga and Culion; squids (Loliginidae), which comprise a significant portion of the catch in CIG
Danajon Reef • Seagrass rabbitfish specifically, Siganus canaliculatus, blue swimming crab (Portunus pelagicus); small pelagics (Decapterus spp., Rastrelliger spp., Selar spp.) in the Visayas, especially in the Camotes Sea)
South Negros Island
• Tuna (Thunnus albacares, T. obesus); flyingfish (family Exocoetidae); other small pelagics in the Visayas
Tawi-tawi Bay • Blue swimming crab (Portunus pelagicus); abalone (Haliotis spp.); sea mantis (family Squillidae); “mameng” or humphead wrasse (Cheilinus undulatus)
Surigao del Norte
• Samo a species of Sargassum; tunas (Thunnus spp.); rabbitfish (Siganus spp.); banagan or lobsters (family Palinuridae)
Ticao- San Bernardino- Lagonoy Gulf
• Tunas (Thunnus spp.); rabbitfish (Siganus spp.); and blue crabs (Portunus pelagicus) • Reproductive biology study of lawlaw (Sardinella lemuru) that are primarily caught by the
municipal ringnets operating in the area • Lobsters (family Palinuridae)
Verde Island Passage
• Reproductive biology study of small pelagic fish species: Decapterus spp., Selar spp., Rastrelliger spp.
ECOFISH COMPLETION REPORT 100

APPENDIX C. PUBLICATIONS AND REPORTS
Record # Record Title
#4 - 2012 Quarterly Progress Updates (Year 1) Progress Report: Final Version (29 June-September 30, 2012)
#1 - 2013 Life of Project Work Plan: Final Version (July 2012-June 2017)
#2 - 2013 First Year Work Plan: Final Version (July 2012-September 2013)
#3 - 2013 Quarterly Progress Report: Final Version ( October 1, 2012-December 31, 2012)
#4 - 2013 ECOFISH Public-Private Partnership Strategy: Final Version
#5 - 2013 Rapid Public-Private Partnership Appraisal: Final Version
#6 - 2013 Performance Monitoring Plan: Final Version
#7 - 2013 Baseline Assessment Plan: Final Version
#8 - 2013 Year 1 Semi-Annual report ( 01 July 2012-31 March 2013)
#9 - 2013 Quarterly Update: Final Version (1April 2013-30 June 2013)
#10 - 2013 Year 2 Work Plan: Final Version ( 1 September 2013-31 October 2014)
#11 - 2013 Framework for the State of Marine Resources Report: Final Version
#12 - 2013 Environmental Mitigation and Monitoring Plan: Final Version
#13 - 2013 Climate Change and Sustainable Fisheries: Guiding Principles, Policy Recommendations and Opportunities for ECOFISH to Build on Regional Efforts in the Coral Triangle: Final Version
#14 - 2013 Annual Report- Year 1 (01 July 2012-30 September 2013)
#15 - 2013 Special Activity Fund Guidelines
#1 - 2014 Quarterly Update: Final Version ( 1 October-31 December 2013)
#2 - 2014 Year 2 Semi-Annual Report: Final Version (1 October-31 March 2014)
#3 - 2014 Quarterly Update: Final Version (01April -30June 2014)
#4 - 2014 Third Year Work Plan: Final Version (1 October 2014 -31 September 2015)
#4-A - 2014 Third Year Work Plan: (Revision 1) Final Version (01 October 2014-30 September 2015)
#5 - 2014 Baseline Assessment Report: Final Version
#8 - 2014 Annual Report – Year 2 ( 01 October 2013-30 September 2014): Final Version
#1 - 2015 Quarterly Updates: Final Version (01 October – 31 December 2014)
#2 - 2015 Mid-Term Report: Final Version (01 June 2012-31 March 2015)
#3 - 2015 Quarterly Updates: Final Version (01 April-30 June 2015)
#4 - 2015 Forth Year Work Plan: Final Version ( 1 October 2015- 31 September 2016)
#4-A - 2015 Forth Year Work Plan: (Revision 1) Final Version (01 October 2015– 30 September 2016)
#5 - 2015 Annual Report – Year 3 ( 01 October 2014 – 30 September 2015): Final Version
#1 - 2016 Quarterly Updates: Final Version (01 October-31 December 2015)
#2 - 2016 Year 4 Semi-Annual Report: Final Version (01 October 2015-31 March 2016)
ECOFISH COMPLETION REPORT 101

Record # Record Title
#3 - 2016 Year 3 Monitoring Report: Final Version
#4 - 2016 Quarterly Updates: Final Version (01 April-30 June 2016)
#5 - 2016 Communication Plan: Final Version
#6 - 2016 Updated Branding Implementation Plan and Marking Plan: Final Version
#7 - 2016 Fifth Year Work Plan: Final (01 October 2016 - 28 June 2017)
#8 - 2016 Annual Report – Year 4 (01 October 2015- 30 September 2016): Final Version
#1 - 2017 Fifth Year Work Plan: (Revision 1) Final Version (01 October 2016 - 28 June 2017)
#2 - 2017 Quarterly Updates: Final Version (01 October 2016 - 31 December 2016)
#3 -2017 Year 5 Semi-Annual Report Final (01 October 2016 - 31 March 2017)
#4 - 2017 Mending Nets
#5 - 2017 ECOFISH Closeout and Demobilization Plan
#6 - 2017 The Giving Seas Case Studies
#7 - 2017 EAFM Governance Benchmarking Report
#8 - 2017 Marine Network Design
#9 - 2017 Integrated Fisheries Resources Management (IFRM) Plan - The Calamianes Island Group
#10 - 2017 Integrated Fisheries Resources Management (IFRM) Plan - Danajon Reef
#11 - 2017 Integrated Fisheries Resources Management (IFRM) Plan - Southern Negros
#12 - 2017 Integrated Fisheries Resources Management (IFRM) Plan - Surigao Del Norte
#13 - 2017 Integrated Fisheries Resources Management (IFRM) Plan - Tawi Tawi
#14 - 2017 Integrated Fisheries Resources Management (IFRM) Plan - San Bernardino-Ticao Pass
#15 -2017 Towards Sustainable Municipal Fisheries: Start-Up Guide for Local Governments
#16 - 2017 Integrated Fisheries Resources Management (IFRM) Plan - Lingayen Gulf
Upload Pending Mainstreaming Ecosystems Approach to Fisheries Management (M-EAFM)
Upload Pending State of the Marine Resources Report
Upload Pending Fish Examiner's Training Manual
Upload Pending ECOFISH Completion Report
ECOFISH COMPLETION REPORT 102

APPENDIX D. ECOFISH FINAL MONITORING REPORT OF KEY PROJECT RESULTS A AND B
1 INTRODUCTION
The main objective of the ECOFISH Project is to improve the management of important coastal and marine resources and associated ecosystems that support local economies. It will conserve biological diversity, enhance ecosystem productivity and restore the profitability of fisheries in eight marine key biodiversity areas (MKBAs) using the ecosystem approach to fisheries management (EAFM) as a cornerstone of improved social, economic and environmental benefits.
The ECOFISH Project is designed to make an impact on eight MKBAs within the Philippines, namely: (1) the Calamianes Group of Islands MKBA, (2) Lingayen Gulf MKBA, (3) Ticao Pass – Lagonoy Gulf - San Bernardino Strait MKBA, (4) Danajon Reef MKBA, (5) South Negros MKBA, (6) Surigao del Sur and Surigao del Norte MKBA, (7) Sulu Archipelago MKBA, and (8) Verde Island Passage MKBA. These MKBAs represent all six marine bio-regions of the Philippines and were selected due to their extremely high need for marine biodiversity conservation.
This document is the Final Monitoring Report, which summarizes the materials and methods used and the computed values of the main parameters from the monitoring event in Year 5 in comparison to the established baselines in Year 1 of project implementation. The focus of this document is on the key performance indicators that describe the status of marine fish stocks and employment, i.e., the project’s key results to achieve:
(A) An average of 10% increase in fisheries biomass across the eight MKBAs; (B) A 10% increase in the number of people gaining employment or better employment from sustainable
fisheries management from a baseline established at the start of the Project;
This Final Monitoring Report is guided by the Performance Monitoring Plan (ECOFISH Document No. 06/2013), the Baseline Assessment Plan (ECOFISH Document No. 07/2013), the Baseline Assessment Report (ECOFISH Document No. 05/2014), and the Year 3 Monitoring Report (ECOFISH Document No. 03/2016).
2 MATERIALS AND METHODS
The Final Year Monitoring Report for Year 5 describes the materials and methods used during the baseline assessment in 2013, the monitoring event in 2015 and the final assessment in 2017, as well as corresponding results that were used as parameters for the key performance indicators. These parameters were used to measure increase in fisheries biomass and the number of people gaining employment or better employment resulting from ECOFISH management interventions.
2.1 FISHERIES AND MPA BASELINE ASSESSMENT AND MONITORING
The fisheries and MPA assessment methods utilized the most practical methods applicable for typical multispecies fish stocks in the tropics. The choice of methods and parameters measured was based on the following considerations:
• Use assessment and monitoring methods appropriate to project goals that are cost efficient. • Apply the best available scientific methods, and in particular, those methods previously used and
tested in USAID’s 7-year FISH Project.
ECOFISH COMPLETION REPORT 103

• Select and modify methods to build on already established Philippine data collection methods. • Fisheries dependent methods shall be used to measure increase in biomass across MKBAs for
purposes of cost efficiency. • Subsequent assessments to evaluate project result in 2015 and 2017 shall be carried out in the same
months when baseline data collections were conducted and taking into consideration the phase of the moon.
• To the extent possible (without unduly sacrificing the accuracy of results for project evaluation purposes), practical methods shall be selected or designed such that, these can be carried out by the stakeholders beyond the life of the Project.
2.1.1 Fisheries Baseline Assessment and Monitoring
Fisheries-dependent survey was the primary method used by ECOFISH to determine fisheries biomass in the focal areas across the eight MKBAs. This mainly involved catch and effort monitoring of all fishing activities during a definite period of time. In this case, a 3-month time series data was collected to determine catch per unit effort (CPUE) of municipal fishing gears operating in the focal areas. Landed catch of fishing gears were monitored for 3 straight months. The idea was to collect the same set of data during the baseline year in 2013 and repeated during subsequent project monitoring events conducted during the same 3-month period in 2015 and 2017. Enumerators were hired to do daily catch and effort monitoring in selected landing sites. The same months of the year were used in monitoring to determine increase or decrease in CPUE. The catch monitoring schedule followed a 3-day cluster scheme, designating the first 2 successive days for fieldwork and the third day as rest day. The scheme always starts on the first day of each month. This provides a higher likelihood of sampling both lean and peak days of fishing, covering holidays, weekends, and “must” fishing days, such as the eve of market days.
CPUE alone will only show the catch rate of a fisher operating a specific fishing gear. It does not, however, fully reveal the effect of changes in fishing pressure brought about by increase or decrease in the number of fishing gears or number of fishers. To determine this, additional sets of information were gathered including the total number of fishers operating in the focal areas, the total number and type of fishing gears being used, and the number of days of operation for the sampling duration. To get this information, an inventory of municipal fishing crafts (classified into motorized and non-motorized), fishing gears, and fishers in the focal areas was conducted. In addition, information about gear types, size, specifications, mode of operation, frequency of use, and seasonality of fishing operations were collected. These information, together with that on commercial fishing crafts (in case they are also operating in the area), provided a picture of the level of fishing effort in the area.
For catch monitoring purposes, the team identified major and minor municipal landing sites in the focal area. Sampling sites for catch data collection were selected in a manner that both major and minor landing sites are proportionately represented. Catch monitoring activities were conducted in the same landing sites.
Enumerators were assigned in sampling sites and provided with gridded maps to locate the source of the catch. Information collected included the following: sampling site, date, and time; fishing ground location (with reference to map grids); fishing boat size, propulsion, horsepower, number of fishers; fishing gear type, specifications (design, dimension, mesh or hook size, bait used and accessories); mode of operation, number of hauls, time of setting and hauling; total weight of catch; species composition by weight and number; and length frequency distribution of important species. Information like the number of operation, harvesting, or landing per day were likewise noted. For relatively large catches, samples were taken. Fish samples were
ECOFISH COMPLETION REPORT 104

bought so as not to bother the fishers and also enable the enumerators to process more catches. To ensure a standardized comparison, all catch data were converted into kilograms per day. Species landed were recorded using either the scientific names (as identified) or their local names. Identification of their scientific names was undertaken using the taxonomic guides provided in Rau and Rau (1980) and Masuda et al. (1984). The fishing area for each of the monitored landed catch were recorded with reference to a gridded map of the focal area. The location of the landing sites and the gridded map were retained during the monitoring event in 2015 and the final monitoring in 2017.
To get accurate results from the catch and effort monitoring activities, a field training of enumerators was conducted before the actual monitoring. The training tackled: introduction to the basic principles of sampling, elaboration of the project sampling design, catch sampling strategies, and proper behavior during the catch sampling process. Actual catch monitoring practice runs were conducted for several days for enumerators to practice and develop their skills following the proper sampling procedure.
The project result was measured as percentage change in the weighted average of CPUEs of the fishing gears operating in each focal area and weighted relative to the number of gears by gear type operating. The overall average for the 8 MKBAs were weighted relative to the area covered by the intervention, primarily represented by the selected focal area of each MKBA.
2.1.2 Marine Protected Area Baseline Assessment and Monitoring
A key activity prior to selection of MPAs was the inventory of existing MPAs in each MKBA. Existing MPAs, active or inactive, were evaluated using the MPA Management Effectiveness Assessment Tool (MEAT). MEAT as a tool have elements to gauge important threshold indicators and processes that help evaluate the management effectiveness of an MPA and, therefore guide the project in determining necessary inputs, interventions, or investments to promote effective MPA management.
Selection of Existing or Potential MPAs. The baseline assessments of MPAs were conducted in existing or potential MPAs that were likely to be included as an MPA. Some focal areas have existing MPAs that the project could build upon while no MPAs existed in other focal areas during the baseline assessment, thus requiring the identification of potential ones. Three MPAs within each focal area were selected for the surveys on the basis of information from discussions with local government officials, local fishers, and people’s organizations.
Reef Fish Biomass Inside and Adjacent to Selected MPAs. Reef fish biomass and density were measured in three MPAs within each focal area. Reef fish assemblages were surveyed using the standard visual census techniques in English et al. (1997). All fish (including juveniles) encountered within 5 meters of either side of the 50-m transect line were identified and counted, and their size (total lengths) were estimated to the nearest 1cm. A minimum of five transects were surveyed inside (if already established) and another five outside of each selected MPA (or other reef site). Length data were converted to biomass estimates by using length-weight relationships in the literature. Biomass of major, target, and indicator species were separately estimated. Biomass estimates are expressed in metric tons per km2 and density expressed as number of individuals per km2.
As part of reef fish assessment described above, the number of species encountered in each transect were noted down, thus providing data on species richness. Species richness is expressed as number of species per km2. The line-intercept transect (LIT) method (English et al. 1997) was used to obtain data on life form/genera that form the basis for assessing the percentage of living coral cover. In addition, the general characteristics of the reef site were also documented, such as depth, steepness of slope, general
ECOFISH COMPLETION REPORT 105

reef typology, and bottom rugosity. The baseline assessment of the benthic conditions were made simultaneously with reef fish assessment and along the same transect line.
2.1.3 Fisheries and MPA Baseline Assessment and Monitoring Activities and Schedule
Fisheries data were collected in selected sampling sites within each focal area. Two core teams were formed, one for the MKBAs in the four old FISH Project sites and the other for the four new MKBAs. The first group was led by the prime contractor (Tetra Tech ARD) while the other was led by MERF. A senior researcher supervised each core team supported by one junior researcher and 10 to 14 enumerators in each focal area. The two core teams collaborated to standardize the sampling method particularly learning from the lessons and knowledge gained during the catch monitoring by the FISH Project (FISH Project 2010).
Catch and effort monitoring in each focal area was conducted for a total period of 3 months. A coordinator was assigned to supervise the enumerators and perform weekly data encoding. Thematic leads and the site teams perform regular quality assurance and quality control (QAQC) process. Encoded data passed through a quality control prior to input into the performance monitoring database. Table D-1 summarizes the actual dates of the conduct of fisheries baseline assessment and monitoring in the focal areas of the eight MKBAs.
The baseline assessment team for the MPA assessment and monitoring was generally composed of two members that conducted fish visual census and four members that surveyed the benthic life forms. Table D-2 summarizes the actual dates of the conduct of MPA baseline assessment and monitoring in the focal areas of the eight MKBAs.
TABLE D-2. START AND END DATES OF YEAR 1 FISHERIES BASELINE ASSESSMENT, YEAR 3 MONITORING AND YEAR 5 FINAL ASSESSMENT IN THE FOCAL AREAS OF THE EIGHT MKBAS.
Marine Key Biodiversity Area Year 1 Baseline
Assessment (2013) Year 3 Monitoring
Event (2015) Year 5 Final
Assessment (2017) Start End Start End Start End
Calamianes Island Group 25 Mar 05 Jul 04 Dec 16 Mar 11 Feb 17 May Danajon Reef 16 Mar 23 Jun 25 Jan 07 May 11 Feb 17 May Lingayen Gulf 01 Jun 28 Aug 13 Feb 26 May 04 Feb 13 May Southern Negros Island 01 Jun 28 Aug 13 Feb 26 May 19 Jan 13 May Surigao del Norte and del Sur 25 May 04 Sep 04 Feb 17 May 11 Feb 17 May Sulu Archipelago 10 Jun 20 Sep 22 Feb 04 Jun 11 Feb 17 May Ticao Pass – San Bernardino 01 Jun 28 Aug 14 Mar 25 Jun 11 Feb 17 May Verde Island Passage 01 Jun 28 Aug 14 Mar 25 Jun 04 Feb 13 May
TABLE D-3. START AND END DATES OF YEAR 1 MARINE PROTECTED AREA BASELINE ASSESSMENT, YEAR 3 MONITORING, AND YEAR 5 FINAL ASSESSMENT IN THE FOCAL AREAS OF THE EIGHT MKBAS.
Marine Key Biodiversity Area
Year 1 Baseline Assessment (2013)
Year 3 Monitoring Event (2015)
Year 5 Final Assessment (2017
Start End Start End Start End Calamianes Island Group 23 Sep 26 Sep 25 May 27 May 05 Mar 09 Mar
ECOFISH COMPLETION REPORT 106

Marine Key Biodiversity Area
Year 1 Baseline Assessment (2013)
Year 3 Monitoring Event (2015)
Year 5 Final Assessment (2017
Start End Start End Start End Danajon Reef 05 Oct 08 Feb 13 Apr 15 Apr 20 Apr 25 Apr Lingayen Gulf 20 May 31 May 16 Mar 20 Mar 05 Feb 12 Feb Southern Negros Island 06 May 10 May 23 Mar 20 Mar 23 Feb 29 Apr Surigao del Norte and del Sur 11 Nov 16 Nov 24 Mar 26 Mar 30 Apr 04 May Sulu Archipelago 05 Dec 08 Dec 05 May 08 May 24 Mar 28 Mar Ticao Pass – San Bernardino 19 Aug 20 Aug 06 Mar 09 Mar 17 Feb 29 Apr Verde Island Passage 06 Aug 10 Aug 26 Feb 28 Feb 27 Jan 05 Mar
2.1.4 Estimation Procedure to Determine Change in Fisheries Biomass
The following describes the calculation processes in estimating the change in fisheries biomass during the Year 5 final assessment relative to the baseline established in Year 1. The calculation processes were used by the project to determine ECOFISH Project Result A, that is,
“An average of 10% increase in fisheries biomass across the eight MKBAs”.
This Project Result was computed as the difference between project results measured in 2017 and 2013 expressed as percentage change. The first component of Project Result A is the catch rate, in this case, the average catch per unit effort (CPUE) of selected fisheries in the focal areas. The average CPUE is the proxy estimate of fish biomass in the focal areas and the project estimated the percentage change in CPUE compared to baseline, using fisheries dependent methods. The basic parameters used to measure the change were the weighted averages of catch per unit effort of various fishing gears used during the 3-month catch and effort monitoring using the number of samples as weighing factor:
𝐶𝐶𝐶𝐶𝐶𝐶𝐶𝐶𝑏𝑏𝑏𝑏𝑏𝑏𝑏𝑏𝑏𝑏𝑏𝑏𝑏𝑏𝑏𝑏 =(𝐶𝐶𝐶𝐶𝐶𝐶𝐶𝐶1 ∙ 𝑛𝑛1) + (𝐶𝐶𝐶𝐶𝐶𝐶𝐶𝐶2 ∙ 𝑛𝑛2)+. . . +(𝐶𝐶𝐶𝐶𝐶𝐶𝐶𝐶𝑏𝑏 ∙ 𝑛𝑛𝑏𝑏)
𝑛𝑛1 + 𝑛𝑛2+. . . +𝑛𝑛𝑏𝑏
where: = proxy estimate of fish biomass represented by the weighted average catch per unit effort estimated using fishery-dependent surveys
CPUE1 = average catch per operation of 1st fishing gear type monitored
CPUE2 = average catch per operation of 2nd fishing gear type monitored
CPUEn = average catch per operation of nth fishing gear type monitored
n1 = number of samples of the 1st fishing gear type monitored
n2 = number of samples of the 2nd fishing gear type monitored
nn = number of samples of the nth fishing gear type monitored.
The change in biomass (∆CPUE) is measured as the change in the catch per unit of effort of fishing gears surveyed:
𝛥𝛥𝐶𝐶𝐶𝐶𝐶𝐶𝐶𝐶 =𝐶𝐶𝐶𝐶𝐶𝐶𝐶𝐶𝑚𝑚𝑚𝑚𝑏𝑏𝑏𝑏𝑚𝑚𝑚𝑚𝑚𝑚𝑏𝑏𝑏𝑏𝑚𝑚 − 𝐶𝐶𝐶𝐶𝐶𝐶𝐶𝐶𝑏𝑏𝑏𝑏𝑏𝑏𝑏𝑏𝑏𝑏𝑏𝑏𝑏𝑏𝑏𝑏
𝐶𝐶𝐶𝐶𝐶𝐶𝐶𝐶𝑏𝑏𝑏𝑏𝑏𝑏𝑏𝑏𝑏𝑏𝑏𝑏𝑏𝑏𝑏𝑏∙ 100
ECOFISH COMPLETION REPORT 107

where: ∆CPUE = change in CPUE estimated using fishery-dependent survey methods
= weighted average catch per unit effort of gears used in the fisheries-dependent survey during baseline assessment
= weighted average catch per unit effort of gears used in the fisheries-dependent survey during monitoring
100 = multiplier to express the result as percent change.
The second component of Project Result A is the reef fish biomass, in this case, the average reef fish biomass inside and adjacent to MPAs in the focal areas. The project estimated the percentage change in reef fish biomass, compared to baseline, using MPA assessment methods. Information to compute for these parameters were primarily collected through reef fish visual census method.
The basic parameters used to measure the change in reef fish biomass were the weighted averages of reef fish biomass using the area of the MPA as weighing factor:
𝑀𝑀𝐶𝐶𝑀𝑀𝑀𝑀𝑀𝑀𝑀𝑀𝑀𝑀𝑏𝑏𝑏𝑏𝑏𝑏𝑏𝑏𝑏𝑏𝑏𝑏𝑏𝑏𝑏𝑏 =(𝑅𝑅𝑅𝑅𝑀𝑀𝑅𝑅ℎ𝑀𝑀𝑀𝑀𝑀𝑀𝑀𝑀1 ∙ 𝑎𝑎1) + (𝑅𝑅𝑅𝑅𝑀𝑀𝑅𝑅ℎ𝑀𝑀𝑀𝑀𝑀𝑀𝑀𝑀2 ∙ 𝑎𝑎2)+. . . +(𝑅𝑅𝑅𝑅𝑀𝑀𝑅𝑅ℎ𝑀𝑀𝑀𝑀𝑀𝑀𝑀𝑀𝑏𝑏 ∙ 𝑎𝑎𝑏𝑏)
𝑎𝑎1 + 𝑎𝑎2+. . . +𝑎𝑎𝑏𝑏
where: = MPA fish biomass represented by the weighted average reef fish biomass estimated using MPA assessment methods
RFishBiom1 = average reef fish biomass of 1st MPA surveyed
RFishBiom2 = average reef fish biomass of 2nd MPA surveyed
RFishBiomn = average reef fish biomass of nth MPA surveyed
a1 = area of the 1st MPA surveyed
a2 = area of the 2nd MPA surveyed
an = area of the nth MPA surveyed.
The change in biomass (∆MPABiom) was measured as the change in the reef fish biomass of MPAs surveyed:
𝛥𝛥𝑀𝑀𝐶𝐶𝑀𝑀𝑀𝑀𝑀𝑀𝑀𝑀𝑀𝑀 =𝑀𝑀𝐶𝐶𝑀𝑀𝑀𝑀𝑀𝑀𝑀𝑀𝑀𝑀𝑚𝑚𝑚𝑚𝑏𝑏𝑏𝑏𝑚𝑚𝑚𝑚𝑚𝑚𝑏𝑏𝑏𝑏𝑚𝑚 − 𝑀𝑀𝐶𝐶𝑀𝑀𝑀𝑀𝑀𝑀𝑀𝑀𝑀𝑀𝑏𝑏𝑏𝑏𝑏𝑏𝑏𝑏𝑏𝑏𝑏𝑏𝑏𝑏𝑏𝑏
𝑀𝑀𝐶𝐶𝑀𝑀𝑀𝑀𝑀𝑀𝑀𝑀𝑀𝑀𝑏𝑏𝑏𝑏𝑏𝑏𝑏𝑏𝑏𝑏𝑏𝑏𝑏𝑏𝑏𝑏∙ 100
where: ∆MPABiom = change in MPA biomass estimated using MPA assessment methods
= weighted average of reef fish biomass of MPAs surveyed during baseline assessment
= weighted average of reef fish biomass of MPAs surveyed during monitoring
100 = multiplier to express the result as percent change.
ECOFISH COMPLETION REPORT 108

The average change in fisheries biomass (∆B) is the combination of both the catch rate (proxy estimate of fish biomass outside the reef areas) and reef fish biomass components and estimated using the following:
∆𝑀𝑀 =(∆𝐶𝐶𝐶𝐶𝐶𝐶𝐶𝐶 ∙ 𝑤𝑤𝑐𝑐) + (∆𝑀𝑀𝐶𝐶𝑀𝑀𝑀𝑀𝑀𝑀𝑀𝑀𝑀𝑀 ∙ 𝑤𝑤𝑚𝑚)
𝑤𝑤𝑐𝑐 + 𝑤𝑤𝑚𝑚
where: ∆B = change in fisheries biomass
∆CPUE = change in CPUE estimated using fishery-dependent survey methods
∆MPABiom = change in MPA biomass estimated using MPA assessment methods
wc = weighing factor for fishery-dependent survey methods
wm = weighing factor for MPA assessment methods
The weighing factors scaled the components relative to the area they cover in their respective focal areas (Table D-3) as well as the potential yield (Table D-4). For the estimation of the overall weighted average of all the focal areas of the eight MKBAs, weighing factors were likewise applied and the values are proportionate to the areas covered by the respective area of coverage of each focal area.
TABLE D-4. ESTIMATES OF AREAS OF MUNICIPAL WATERS, SOFT/HARD BOTTOM, AND CORAL REEFS IN THE FOCAL AREAS OF THE EIGHT MKBAS.
MKBA Area (in km2) of components in the focal area
Municipal waters Hard/Soft bottom Coral reefs Calamianes Island Group 11,109 10,651 458 Danajon Reef 2,769 2,380 388 Lingayen Gulf 1,172 1,158 13 San Bernardino - Ticao Pass - Lagonoy Gulf 3,152 3,050 102 South Negros Island 3,308 3,286 22 Sulu Archipelago 5,497 4,785 711 Surigao del Sur and Surigao del Norte 1,173 1,121 52 Verde Island Passage 2,746 2,711 35
TABLE D-5. ESTIMATES OF ANNUAL POTENTIAL HARVEST (TONS/KM2) OF VARIOUS MARINE HABITATS IN THE PHILIPPINES.
Bottom Type and Depth
Estimated Annual Average Harvest Source
0-200 meters 3.50 t/km2 (demersal species) Kvaran, 1971 0-200 meters 3.25 t/km2 (in-shore pelagic species) Kvaran, 1971 200 meters and deeper 0.20 t/km2 (off-shore pelagic species Kvaran, 1971 Reef area 15.6 t/km2 (all fishes) White & Trinidad 1998; Russ 1991.
Alcala & Gomez 1985. Estuary 17.0 t/km2 (all fishes) Pauly, 1982
The weighting factor for the catch rates (wc) was defined as the product of collective potential yields of demersal and pelagic stocks (Table D-4) and the area covered by the hard and soft bottom substrates (Table D-3). The potential yields of both the demersal and pelagic stocks were used since catch and
ECOFISH COMPLETION REPORT 109

effort of both demersal and pelagic fisheries were monitored. And similarly, hard and soft bottoms were not segregated because there are no reliable geological and hydrographic data to serve as reference.
wc=�PYdem+PYpel�×(Ahs)
2
where: wc = weighting factor for catch rates (proxy value for fish biomass)
PYdem = Potential yield (t/km2/yr) for the demersal stock
PYpel = Potential yield (t/km2/yr) for the pelagic stock
Ahs = Area (km2) of hard and soft bottom
2 = This divisor is needed, since both weighting factors cover the same area, to avoid double counting.
The weighting factor for reef fish biomass was the product of the potential yield of coral reef ecosystem (Table D-4) and the extent of the coral reef in each focal area (Table D-3). Only the area of the coral reef was used as basis since all MPA initiatives of the ECOFISH were focused on coral reef ecosystems and their associated communities such as sea grass beds.
𝑤𝑤𝑚𝑚 = 𝐶𝐶𝑃𝑃𝑐𝑐𝑚𝑚𝑚𝑚 ∙ 𝑀𝑀𝑐𝑐𝑚𝑚𝑚𝑚
where: wm = weighting factor for reef fish biomass
PYcor = Potential yield (t/km2/yr) for the coral reef
Acor = Area (km2) of coral reef
2.2 SOCIO-ECONOMIC BASELINE ASSESSMENT AND MONITORING
The socio-economic monitoring assessment was designed to measure the progress of ECOFISH in reaching the project’s target of a 10% increase in the number of people gaining employment or better employment from sustainable fisheries management.
Measurements were based on a combination of parameters including household incomes, household expenditures, resource uses, and employment. Percentage changes were used for the sample population directly relying on their coastal and marine resources for their primary livelihoods. Improvements were expected to come from increased incomes, which in turn come from increased savings, increased expenditures for improving standards of living, or decreased costs in fishing due to shorter distances of time spent fishing. The increase in the number of households with increased fish catch emanates from the FISH project results, wherein the increase in biomass translates into increases in fish catch, therefore increases in fish harvesting-related incomes. Income increases are complemented by decreases in costs including time travel, and length of fishing trips. It was also expected to come in the form of better employment opportunities, away from traditional catch harvesting. Finally, it can come in the form of improved health status or social standing in the community due to improvements in the status of their coastal and marine resources.
The project team developed a socio-economic survey to assess the effects of activities on all program outcomes. The survey included basic questions on social and economic indicators, which were used to measure impact against intended results. The survey was repeated in Years 3 and 5, and responses of the same households were measured and compared with the baseline. The survey unit is the household
ECOFISH COMPLETION REPORT 110

and the sample size was set at a minimum of 500 households per MKBA for eight project sites. Random sampling was employed in choosing the individual households. The survey area covers the same barangays covered by the biophysical surveys. In Years 3 and 5, the same individual households were covered for the monitoring event and final assessment, respectively. In cases where respondents were no longer fishers (due to change of livelihood or deceased), or have moved out of the area, they were not replaced. For the Sulu Archipelago (SA) MKBA, baselines had to be re-established in 2015 due to inconsistencies in data gathering and survey methods employed by the enumerators.
2.2.1 Socio-Economic Baseline Assessment and Monitoring Tool
The survey is divided into four major parts: social and demographic profile of the fishing household, general economic profile including household’s sources of income and expenditures, perceptions of the respondent with respect to conditions of, and threats to marine resources as well as perceptions on enforcement of fishing rules and regulations, and finally, the profile of fishing households with respect to fishing practices, income and expenditures.
The demographic profile contains basic information on family size, age, ethnicity, religion, number of females in the household, civil status and educational attainment of the respondent. It further asks about house and lot ownership, housing materials, amenities, appliances, cooking fuel and drinking water sources, sanitation facilities, and waste management practices. Finally, seafood consumption and health conditions are included as health indicators of fisherfolk households. Improved seafood consumption is used as a proxy of protein intake to indicate better health status, although admittedly this can be largely influenced by food preferences as well.
The economic profile consists of top livelihood sources, household expenditures, and the various sources of income for the household. Household expenditure items are made consistent with national surveys on family income and expenditures.
Perceptions of respondents were gathered, focusing on primary opportunities and challenges in their respective barangays, their own qualitative assessment of conditions and threats to marine resources, their knowledge and views of MPAs in their areas, and their subjective rating of the various parts of the enforcement chain.
The last part consisted of questions dealing with most common gears used and top species caught, fishing profiles, average volumes harvested and sold, incomes and costs from harvesting activities, and measurements of economic rent. Respondents were asked to rate the demand for the top species they catch, as well as the primary markets and buyers they cater to.
To complement the household surveys particularly in determining which barangays would have the highest concentration of marginal fisherfolk for the conduct of the household surveys, KIIs and FGDs were conducted with selected local government officials in the focal areas of the project. Discussions focused on population demographics, the presence of or potential for the establishment of MPAs, common issues regarding capture fisheries, mariculture and aquaculture, other major livelihood activities of the community, issues related to governance and enforcement of fishing rules and regulations, potentials for ecotourism or other marine-related enterprises, current and potential revenue generating schemes for the implementation of CRM, and species of interest for value chain studies.
ECOFISH COMPLETION REPORT 111

2.2.2 Socioeconomic Baseline Assessment and Monitoring Activities and Schedule
Training of ten to twelve hired enumerators were conducted in each MKBA consisting of orientation on ECOFISH project, purpose of socioeconomics baseline assessment activity, random sampling techniques, detailed discussion about the survey instrument, mock interviews, and tips in conducting household surveys. Surveys were typically completed in 30 to 45 days per MKBA. Data passed through a quality assurance quality control (QAQC) process prior to input into database. Table D-5 summarizes the actual dates of the conduct of socioeconomic baseline assessment and monitoring in the focal areas of the eight MKBAs.
TABLE D-6. START AND END DATES OF YEAR 1 SOCIOECONOMIC BASELINE ASSESSMENT, YEAR 3 MONITORING, AND YEAR 5 FINAL ASSESSMENT IN THE FOCAL AREAS OF THE EIGHT MKBAS.
Marine Key Biodiversity Area Year 1 Baseline
Assessment (2013) Year 3 Monitoring
Event (2015) Year 5 Final
Assessment (2017) Start End Start End Start End
Calamianes Island Group 25 Mar 05 Jul 04 Dec 16 Mar 13 Feb 07 Apr Danajon Reef 29 Apr 19 Jun 21 Jan 21 Feb 27 Feb 31 Mar Lingayen Gulf 14 May 07 Jun 27 Feb 20 Mar 17 Feb 24 Mar San Bernardino-Ticao Pass 22 Jun 28 Sep 09 Feb 24 Apr 07 Feb 21 Mar Southern Negros Island 22 Apr 28 May 21 Mar 18 Apr 27 Feb 14 Apr Surigao del Norte 08 Apr 09 May 20 Feb 17 Mar 10 Mar 31 Mar Sulu Archipelago 22 Mar 28 Apr 30 Mar 27 Apr 06 Mar 27 Mar Verde Island Passage 21 Feb 22 Mar 16 Feb 19 Mar 20 Feb 17 Mar
2.2.3 Estimation Procedure to Determine Change in People Gaining Employment or Better Employment
The following describes the calculation processes in estimating the change in people gaining employment or better employment during the Year 5 final assessment relative to the baseline established in Year 1. The calculation processes will enable the project to determine ECOFISH Project Result B, that is,
“A 10% increase in the number of people gaining employment or better employment from sustainable fisheries management from a baseline established at the start of the project”.
The change in the number of people gaining employment or better employment ΔE is measured from the following:
𝛥𝛥𝛥𝛥 = ∆𝑁𝑁𝐶𝐶 + ∆𝐻𝐻𝐻𝐻 + ∆𝐻𝐻𝑅𝑅 + ∆𝐶𝐶𝑅𝑅 + ∆𝑀𝑀𝐶𝐶𝑀𝑀 + ∆𝐶𝐶𝐸𝐸 + ∆𝐿𝐿𝑇𝑇 + ∆𝑇𝑇𝑇𝑇
where: ∆E = percent change in number of people gaining employment or better employment from sustainable fisheries management (number of people with net increase4 less number of people with net decrease5 among the indicators)
4 Net increase means respondent indicated more increases than decreases in the individual indicators, indicating the respondent is better off overall
5 Net decrease means respondent indicated more decreases than increases in the individual indicators, indicating respondent is worse off overall
ECOFISH COMPLETION REPORT 112

∆NP = percent change in number of people with higher net profits from fishing (number of people with higher net profits less the number of people with lower net profits from fishing)
∆HS = percent change in number of people with higher household savings (number of people whose savings increased less the number of people whose savings decreased)
∆SF = percent change in number of people eating seafood more regularly (number of people eating seafood more regularly less the number of people eating seafood less regularly)
∆EF = percent change in number of people with perceived improvements in enforcement (number of people with perceived improvements in enforcement less the number of people with perceived worsening of enforcement)
∆MPA = percent change in number of people with higher awareness and support for MPAs (number of people with higher awareness and support for MPAs less the number of people with lower awareness and support for MPAs)
∆EQ = percent change in number of people with higher perceptions of improved environmental quality (number of people with perceptions of improved environmental quality less the number of people with perceptions of worsening environmental quality)
∆LT = percent change in the number of people with shorter fishing trips (number of people with shorter fishing trips less the number of people with longer fishing trips)
∆TT = percent change in the number of people with shorter travel time to fishing grounds (number of people with shorter travel time to fishing grounds less the number of people with longer travel time to fishing grounds)
Two additional variables, ∆LT (percent change in the number of people with shorter fishing trip and ∆TT (percent change in the number of people with shorter travel time to fishing grounds), were included to represent the cost of time of the fisher. Shorter fishing trips are not accurately reflected in usual operating costs.
In measuring the changes particularly for enforcement and seafood diet, those that indicated the maximum value for both baseline and monitoring years were not treated as simply neutral trends. Those that gave the highest score for enforcement chain probabilities and those that indicated eating seafood every day were excluded from the total (for these particular indicators), given that there was no more possibility for them to indicate any further increase.
For changes in environmental perception, only those that had at least one positive improvement noted without any noted decrease in any of the five aspects of environmental quality were included as positive trends. In other words, if a respondent indicated any negative trend during the survey period for any of the five components of environmental quality, no matter how many positive trends were noted, the respondent is not considered to have experienced better employment.
ECOFISH COMPLETION REPORT 113

3 RESULTS AND DISCUSSION
3.1 MEASURING PROJECT KEY RESULT A USING FISHERIES AND MPA ASSESSMENT AND MONITORING TOOLS
During the Year 3 monitoring event and the Year 5 final assessment, fisheries and MPA surveys, similar to those conducted in Year 1, were performed. ECOFISH Project Result A (an average of 10% increase in fisheries biomass across the eight MKBAs) were estimated from the combined result of change in catch rates of selected fishing gears and change in reef fish biomass in selected MPAs.
3.1. Fisheries Assessment and Monitoring
A total of 84 landing sites (Table D-6) in 29 municipalities were selected for the catch monitoring in the focal areas across the eight MKBAs. As mentioned earlier the sampling sites for catch data collection were selected in such a manner that both major and minor landing sites are proportionately represented. Catch monitoring activities to evaluate the project result were conducted in the same sites selected and the same months of the year. A total of between 15,000 to 20,000 fisheries catch and effort data were collected and processed during each assessment and monitoring events
Catch samples were collected from between 16 to 42 fishing gear types in the selected landing sites, some encountered at least once while others at most 2,200 times during the 3-month sampling period. Commonly used fishing gears across the MKBAs were the simple hook and line, bottom-set gillnet, bottom-set longline, drift gillnet and multiple handlines. Table D-7 summarize the catch rates and the number of various fishing gears sampled for the fisheries dependent survey in the focal areas of the 8 MKBAs during the baseline assessment in 2013, mid-project monitoring event in 2015 and final assessment in 2017.
TABLE D-7. FISH LANDING SITES SELECTED FOR THE FISHERIES-DEPENDENT SURVEY IN THE EIGHT MKBAS DURING THE BASELINE ASSESSMENT IN 2013, MONITORING IN 2015 AND FINAL ASSESSMENT IN 2017.
Municipality/Landing Site Municipality/Landing Site Municipality/Landing Site Calamianes Island Group MKBA Lingayen Gulf MKBA Surigao del Norte and del Sur
MKBA Busunga Agoo Bacuag Bogtong Bani Poblacion Salvacion Damortis Claver Coron Alaminos Panatao Barangay 1-Bakawan Bolo Islands, Telbang Gigaquit Barangay 1-Comesaria San Fernando Gigaquit Public Market Barangay 2 Ilacanos Sur Nagubat Barangay 5-Bancuang Poro Punta Alambique Bintuan San Bernardino – Ticao Pass –
Lagonoy Gulf MKBA Placer
Bulalacao Banga Diguiboy Bulan Surigao City Maquinit Bulan Punta Bilar Tagumpay Matnog Taganaan Culion Tablac Cawilan Balala Santa Magdalena Sampaguita Bernabe Barangay 1 Verde Island Passage MKBA
ECOFISH COMPLETION REPORT 114

Municipality/Landing Site Municipality/Landing Site Municipality/Landing Site Chindonan Barangay 3 Culango Poblacion 4 Calatagan Jardin
South Negros MKBA Balibago
Libis Balombato Osmena Bayawan City Burot Sitio Pescadores Banga Poblacion 2
Danajon Bank MKBA Buyco Poblacion 4 Malabugas Mabini
Buenavista Pagatban Pantalan Anilao Asinan Suba Port Tingloy Clarin Tinago Santo Tomas Nahawan Santa Catalina Tingloy Getafe Cawitan
Tawi-Tawi MKBA Handumon Fatima Nasingin San Pedro Bongao Pandanon Siaton Chinese Pier Inabanga Agbagacay Kasulutan Cuaming Albiga Lamion Hambongan Malabuhan Public Market Lawis Maloh Panlima Sugala Sto Nino Nagba Batu-Batu Tubigon Nasipit Simunul Bagongbanwa Bakong Pandan Mastul Tinagan Pagasinan Sukah Bulan Tubig Indangan Ubol
TABLE D-8. AVERAGE CATCH PER UNIT EFFORT (CPUE), IN KG/DAY, OF FISHING GEARS IN THE EIGHT MKBAS DURING THE FISHERIES BASELINE ASSESSMENT CONDUCTED IN 2013, MONITORING IN 2015 AND FINAL ASSESSMENT IN 2017.
MKBA/Fishing Gear 2013 2015 2017
CPUE n CPUE n CPUE n Calamianes Island Group Bag net 228.38 129 155.26 88 83.75 148 Bottom set gillnet 9.53 665 13.61 256 9.06 391 Bottom set longline 9.41 402 9.34 208 9.79 141 Hook and line with float 4.79 5 7.87 257 Multiple handline 3.12 305 4.02 169 3.33 13 Simple hook and line 3.31 250 6.14 98 4.33 167 Spear with compressor 20.38 135 20.45 12 38.01 73 Squid jig 1.63 12 2.74 71 3.30 115 Trammel net 10.04 96 11.87 145 8.33 117 Troll line 18.40 268 13.33 130 11.46 98
ECOFISH COMPLETION REPORT 115

MKBA/Fishing Gear 2013 2015 2017
CPUE n CPUE n CPUE n Danajon Reef Bottom set gillnet 1.84 567 2.27 1888 2.74 2194 Bottom set longline 4.53 542 5.24 790 5.05 664 Crab gillnet 1.81 502 1.61 861 1.50 534 Crab pot 2.58 125 2.74 511 2.37 344 Diving 4.23 79 2.67 341 4.03 643 Drag handline 18.17 87 17.85 163 14.76 118 Drift gillnet 22.94 203 14.02 284 22.90 255 Drive-in gillnet 30.46 42 5.44 45 5.98 59 Dynamite 14.34 16 9.31 91 17.11 44 Fish corral 2.41 245 3.41 635 4.71 557 Fish trap 5.96 62 2.43 10 5.99 16 Hook and line with float 2.93 30 2.56 5 2.27 14 Multiple handline 2.61 265 1.95 527 2.72 466 Push/Scissor net 3.16 9 1.25 16 0.29 2 Ring net 546.41 82 203.80 46 185.90 59 Seine net 6.52 48 11.75 97 9.18 29 Set gillnet with plunger 6.24 25 2.90 28 7.82 10 Simple hook and line 2.19 248 1.99 404 2.48 355 Spear 4.07 127 1.40 356 1.93 558 Spear with compressor 26.02 222 25.13 58 25.81 98 Squid gillnet 6.77 127 9.17 93 6.47 121 Squid jig 1.34 27 1.40 114 2.34 26 Trammel net 7.69 62 2.60 36 5.09 86 Troll line 3.04 32 2.70 163 3.09 313 Troll line for garfish 2.00 4 2.37 29 Lingayen Gulf Bottom set gillnet 4.20 385 2.55 351 2.74 540 Bottom set longline 7.11 26 9.99 315 Drift gillnet 6.47 7 14.18 328 Multiple handline 16.78 174 5.70 167 11.60 105 Simple hook and line 15.87 176 18.18 422 San Bernardino Strait Bottom set gillnet 18.09 182 20.01 246 14.56 180 Crab gillnet 5.29 37 4.47 11 8.65 17 Fish trap 3.83 58 6.43 16 4.54 106 Multiple handline 4.75 127 2.38 4 5.20 5 Simple hook and line 9.71 565 5.79 34 1.80 35 Squid jig 1.24 70 3.75 6 1.70 25 South Negros Bottom set gillnet 6.00 27 12.35 149 15.07 140 Bottom set longline 3.10 88 12.00 1 Drift gillnet 19.67 6 27.77 78 32.59 85 Hook and line with float 96.88 42 19.97 111 10.31 135 Multiple handline 9.20 234 3.09 172
ECOFISH COMPLETION REPORT 116
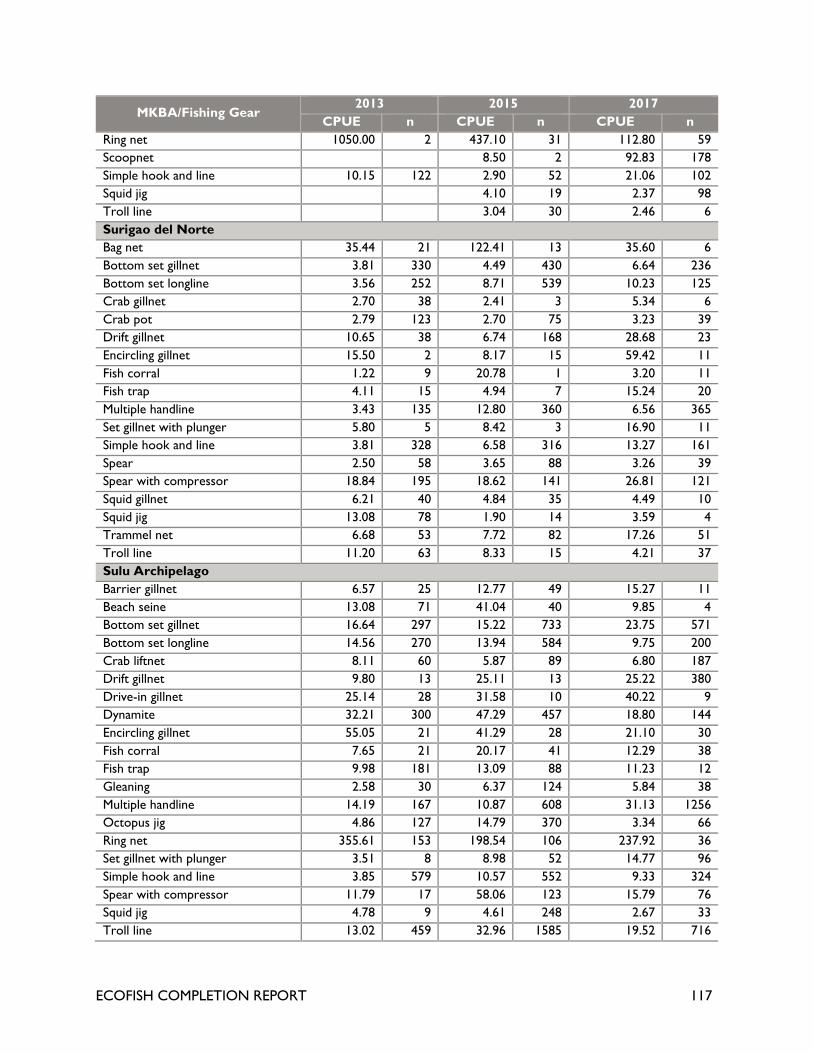
MKBA/Fishing Gear 2013 2015 2017
CPUE n CPUE n CPUE n Ring net 1050.00 2 437.10 31 112.80 59 Scoopnet 8.50 2 92.83 178 Simple hook and line 10.15 122 2.90 52 21.06 102 Squid jig 4.10 19 2.37 98 Troll line 3.04 30 2.46 6 Surigao del Norte Bag net 35.44 21 122.41 13 35.60 6 Bottom set gillnet 3.81 330 4.49 430 6.64 236 Bottom set longline 3.56 252 8.71 539 10.23 125 Crab gillnet 2.70 38 2.41 3 5.34 6 Crab pot 2.79 123 2.70 75 3.23 39 Drift gillnet 10.65 38 6.74 168 28.68 23 Encircling gillnet 15.50 2 8.17 15 59.42 11 Fish corral 1.22 9 20.78 1 3.20 11 Fish trap 4.11 15 4.94 7 15.24 20 Multiple handline 3.43 135 12.80 360 6.56 365 Set gillnet with plunger 5.80 5 8.42 3 16.90 11 Simple hook and line 3.81 328 6.58 316 13.27 161 Spear 2.50 58 3.65 88 3.26 39 Spear with compressor 18.84 195 18.62 141 26.81 121 Squid gillnet 6.21 40 4.84 35 4.49 10 Squid jig 13.08 78 1.90 14 3.59 4 Trammel net 6.68 53 7.72 82 17.26 51 Troll line 11.20 63 8.33 15 4.21 37 Sulu Archipelago Barrier gillnet 6.57 25 12.77 49 15.27 11 Beach seine 13.08 71 41.04 40 9.85 4 Bottom set gillnet 16.64 297 15.22 733 23.75 571 Bottom set longline 14.56 270 13.94 584 9.75 200 Crab liftnet 8.11 60 5.87 89 6.80 187 Drift gillnet 9.80 13 25.11 13 25.22 380 Drive-in gillnet 25.14 28 31.58 10 40.22 9 Dynamite 32.21 300 47.29 457 18.80 144 Encircling gillnet 55.05 21 41.29 28 21.10 30 Fish corral 7.65 21 20.17 41 12.29 38 Fish trap 9.98 181 13.09 88 11.23 12 Gleaning 2.58 30 6.37 124 5.84 38 Multiple handline 14.19 167 10.87 608 31.13 1256 Octopus jig 4.86 127 14.79 370 3.34 66 Ring net 355.61 153 198.54 106 237.92 36 Set gillnet with plunger 3.51 8 8.98 52 14.77 96 Simple hook and line 3.85 579 10.57 552 9.33 324 Spear with compressor 11.79 17 58.06 123 15.79 76 Squid jig 4.78 9 4.61 248 2.67 33 Troll line 13.02 459 32.96 1585 19.52 716
ECOFISH COMPLETION REPORT 117

MKBA/Fishing Gear 2013 2015 2017
CPUE n CPUE n CPUE n Verde Island Passage Bag net 79.85 10 63.33 33 Beach seine 35.33 6 3.23 11 Bottom set gillnet 44.32 118 4.10 10 6.37 290 Drift gillnet 225.10 87 48.27 68 6.54 198 Multiple handline 27.37 304 3.17 5 2.92 347 Ring net 406.73 104 436.20 973 276.49 830 Simple hook and line 6.23 112 6.12 179 2.58 104
3.1.2 MPA Assessment and Monitoring
Data and information gathered by the MPA baseline assessment teams included reef fish biomass, density, species richness, coral cover and other benthic forms. Details about the results were discussed in separate reports by the Monitoring teams from the University of the Philippines Visayas Foundation Inc. (UPVFI) and University of the Philippines Marine Science Institute’s Marine Environment and Resources Foundation (MERF). The results, aside from being primarily used as one of the basis for measuring the project results, were likewise used to communicate with stakeholders the effects of management, in general, and the positive impacts of protection, in particular. Data to estimate reef fish biomass and other MPA related information were collected in three representative MPAs in each MKBA (Table D-8).
TABLE D-9. MARINE PROTECTED AREAS SELECTED FOR THE CORAL REEF MONITORING SURVEY IN THE EIGHT MKBAS DURING THE BASELINE ASSESSMENT IN 2013, MONITORING IN 2015, AND FINAL ASSESSMENT IN 2017.
MKBA/MPA Site MKBA/MPA Site
Calamianes Island Group South Negros
Bugor Salag Concepcion Sagrada Siit/Andulay Site Pecados Tambobo
Danajo Reef Surigao del Norte
Cuaming Nagubat Nasingin San Isidro Pangapasan Tagana-an
Lingayen Gulf Sulu Archipelago
Alaminos-Telbang Batu-Batu/Kulape Canaoy/Kasay Tonggosong-Marua Lingsat Ungos-Ungos
San Bernardino – Ticao Pass – Lagonoy Gulf Verde Island Passage
Bulan-Butag Bagong Silang Calintaan/Subic Batalang Bato – Santo Tomas Santa Magdalena - Penafrancia Twin Rocks – San Teodoro
ECOFISH COMPLETION REPORT 118

Table D-9 summarizes the key parameters measured for each of the 8 MKBAs (such as mean reef fish biomass, their respective standard deviations, and number of replicates). Mean reef biomass ranged between 2 to 116 tons per square kilometer and was generally higher in the Calamianes Island Group, Sulu Archipelago and Verde island Passage MKBAs and quite low in the Danajon Reef and Lingayen Gulf MKBAs.
TABLE D-10. AVERAGE REEF FISH BIOMASS (RFB), IN TONS/KM2, OF MPAS IN THE EIGHT MKBAS DURING THE MPA BASELINE ASSESSMENT CONDUCTED IN 2013, MONITORING IN 2015, AND FINAL MONITORING IN 2017
MKBA/MPA 2013 2015 2017
RFB n RFB n RFB n Calamianes Island Group Bugor 28.13 9 48.00 10 68.73 10 Concepcion Sagrada 21.30 8 56.08 10 65.74 10 Site Pecados 41.19 10 50.69 10 116.22 10 Danajon Reef Cuaming 11.48 10 8.27 10 22.,05 10 Nasingin 7.19 10 8.52 10 21.67 10 Pangapasan 14.76 10 19.63 10 25.26 10 Lingayen Gulf Alaminos-Telbang 9.62 5 2.42 10 8.21 10 Canaoy/Kasay 10.80 9 7.81 10 24.12 9 Lingsat 21.44 4 20.90 8 24.20 8 San Bernardino – Ticao Bulan-Butag 7.00 10 10.82 10 10.14 10 Calintaan/Subic 20.36 8 20.38 8 2.10 8 Santa Magdalena - Penafrancia 14.77 1 11.22 2 South Negros Salag 35.83 2 20.30 2 15.46 7 Siit/Andulay 34.49 10 17.91 9 41.26 8 Tambobo 37.19 2 39.58 3 20.95 8 Surigao del Norte Nagubat 34.93 10 16.86 10 43.10 10 San Isidro 11.47 10 10.34 10 13.49 10 Tagana-an 16.78 10 28.01 10 28.34 10 Sulu Archipelago Batu-Batu/Kulape 14.27 10 29.43 10 16.80 10 Tonggosong-Marua 34.84 8 65.76 9 50.95 10 Ungos-Ungos 21.16 10 40.03 10 24.40 10 Verde Island Passage Bagong Silang 14.08 10 19.14 10 24.59 9 Batalang Bato – Santo Tomas 63.60 9 57.49 8 29.80 4 Twin Rocks – San Teodoro 60.10 8 58.10 8 66.44 8
ECOFISH COMPLETION REPORT 119

3.1.3 Project Key Result A - Increase in Fisheries Biomass
Table D-10 shows the computed weighted average percent change in both CPUE and reef fish biomass for each focal area of the eight MKBA, and the estimated weighted average percent change in fisheries biomass across the eight MKBAs. For the Project Key Result A, the percentage increase in fisheries biomass (∆𝑀𝑀) over the five-year period is 23.79%. The increase came from both fisheries and MPAs. Six of the 8 MKBAs registered positive changes in reef fish biomass results and increase in catch rates were also achieved 6 of the 8 MKBAs.
TABLE D-11. WEIGHTED AVERAGE PERCENT CHANGE IN CPUE AND REEF FISH BIOMASS IN THE FOCAL AREAS OF THE EIGHT MKBAS DURING THE FISHERIES AND MPA BASELINE ASSESSMENTS CONDUCTED IN 2013 AND FINAL ASSESSMENT IN 2017 AND THE ESTIMATED INCREASE IN FISHERIES BIOMASS
MKBA Average Percent Change
Weighing Factor
(wc, wm)
% Increase in Fisheries Biomass
Calamianes Island Group Catch Rates 6.58 4786.78
23.79
Reef Fish Biomass 192.04 2533.28
Danajon Reef Catch Rates 13.67 2220.75 Reef Fish Biomass 136.62 2159.20
Lingayen Gulf Catch Rates* 39.96 3909.16 Reef Fish Biomass 24.08 209.60
San Bernardino Strait Catch Rates* -31.76 8125.14 Reef Fish Biomass -27.03 986.39
South Negros Island Catch Rates* 36.32 11091.02 Reef Fish Biomass -33.12 343.06
Surigao del Norte and del Sur
Catch Rates 109.05 3781.76 Reef Fish Biomass 39.98 817.75
Sulu Archipelago Catch Rates 64.68 894.38 Reef Fish Biomass 21.99 2761.20
Verde Island Passage Catch Rates* -30.66 9150.88 Reef Fish Biomass 30.81 539.59
* 2015 was used as the reference point for catch rates in Lingayen Gulf, San Bernardino Strait, South Negros, and Verde Island Passage MKBAs to rectify sampling error incurred in 2013.
3.2 MEASURING PROJECT KEY RESULT B USING SOCIO-ECONOMIC ASSESSMENT AND MONITORING TOOLS
3.2.1 Socio-Economic Assessment and Monitoring
Household surveys were conducted to measure the achievement of Project Key Result B. Out of the initial 4,727 households surveyed in year 1, 3,800 remained as respondents by the end of the project. 927 respondents, or 20% were either deceased or transferred residences by the time of the last survey. Out of those remaining, 82% remained as fishing households while the rest transferred to other sources of income. Finally, among the remaining fishing households, 12% of municipal fishers changed their fishing operations: either they stopped operating a boat or they became crew members in commercial fishing
ECOFISH COMPLETION REPORT 120

operations. In Danajon Reef, there were some respondents who had left the fishing sector by 2015, but returned to fishing by 2017, hence the larger sample size in 2017 relative to 2015.
TABLE D-12. NUMBER OF SAMPLE HOUSEHOLDS IN SELECTED MUNICIPALITIES IN THE EIGHT MKBAS SURVEYED DURING THE BASELINE ASSESSMENT IN 2013, MONITORING EVENT IN 2015, AND FINAL ASSESSMENT IN 2017.
Marine Key Biodiversity Area No. of Sample Households
Year 1 Baseline Assessment 2013
Year 3 Monitoring Event 2015
Year 5 Final Assessment 2017
Calamianes Island Group 542 502 450 Danajon Reef 800 599 649 Lingayen Gulf 503 433 398 San Bernardino- Ticao Pass 720 594 579 Southern Negros Island 544 465 446 Surigao del Norte 507 386 352 Sulu Archipelago 537 537 522 Verde Island Passage 574 487 404 Total Sample 4,727 4,003 3,800
3.2.2 Project Key Result B – Increase in Employment or Better Employment
Measurement of the number of people gaining employment from increased profits from fishing, as well as better employment is shown in Table D-12. For the Project Key Result B, the percentage increase (average of the eight MKBAs) in number of people gaining employment or better employment (ΔE) is 12%. Six out of eight MKBAs registered positive changes in gaining employment or better employment. Out of eight indicators, two registered negative averages across all MKBAs: overall environment perception and seafood diet. All economic indicators6 registered positive changes, suggesting a net improvement in the economic status of the sample respondents across all 8 MKBAs. Finally, the two perception indicators referring to direct project interventions (MPAs and enforcement) were positive by the end of the project.
TABLE D-13. AVERAGE PERCENT CHANGE IN THE INDIVIDUAL INDICATORS IN THE FOCAL AREAS OF THE EIGHT MKBAS DURING THE SOCIOECONOMIC BASELINE ASSESSMENT IN 2013 AND FINAL MONITORING IN 2017 AND THE ESTIMATED INCREASE IN THE NUMBER OF PEOPLE GAINING EMPLOYMENT OR BETTER EMPLOYMENT
MK
BA
∆Net
pro
fit
∆Sav
ings
∆Sea
food
die
t
∆Enf
orce
men
t
∆MP
A
awar
enes
s an
d su
ppor
t
∆ E
nvir
onm
ent
perc
epti
on
∆Len
gth
of
fishi
ng t
rip
∆Tra
vel t
ime
∆E
CIG 4% -4% -33% 14% 32% -31% 16% 7% 11% DB -7% -3% 9% 1% 14% -60% 12% 12% -17%
6 Economic indicators include net profit, savings, length of fishing trip and travel time.
ECOFISH COMPLETION REPORT 121

MK
BA
∆Net
pro
fit
∆Sav
ings
∆Sea
food
die
t
∆Enf
orce
men
t
∆MP
A
awar
enes
s an
d su
ppor
t
∆ E
nvir
onm
ent
perc
epti
on
∆Len
gth
of
fishi
ng t
rip
∆Tra
vel t
ime
∆E
LG 9% 6% -10% -2% 13% -9% 19% 9% 20% SBTPLG 0.4% -9% -12% 24% -8% -36% 3% 1% -11% SN 28% 13% 28% -7% 3% -8% 34% 18% 35% SDN 1% 18% -18% 11% 33% -11% 21% 17% 39% SA -13% 18% -19% 2% 48% 16% 2% -1% 29% VIP 8% 1% -29% 6% 23% -1% 26% -18% 15% Average 3% 4% -8% 7% 18% -21% 8% 1% 12%
4 REFERENCES
Alcala, A. C., and E. D. Gomez. 1985. Fish Yields of Coral Reefs in Central Philippines. Proceedings of the 5th International Coral Reef Symposium, Tahiti 5:521-524.
English, S., C. Wilkinson and V. Baker (eds.). 1997. Survey manual for tropical marine resources. 2nd ed. Australian Institute of Marine Science, Townsville, Queensland, Australia. 390 p.
FISH (Fisheries Improved for Sustainable Harvest) Project. 2010. Completion Report. FISH Doc. No. 53-FISH/2010.
Kvaran, E.R. 1971. Marine fisheries potential in the Philippines and Southeast Asia. Fish. Newsl. Jul.-Dec.:8-17.
Masuda, H., K. Amaoka, C. Araga, T. Uyeno and T. Yoshino, 1984 The Fishes of the Japanese Archipelago. Tokai University Press, Tokyo, Japan. 437 p.
Pauly, D. 1982. The fishes and their ecology, p.15-33. In D. Pauly and A.N. Mines (eds.). Small-scale fisheries of San Miguel Bay, Philippines: biology and stock assessment. ICLARM Technical Report 7. 124 p.
Rau, N. and A. Rau. 1980. Commercial Marine Fishes of the Central Philippines (Bony Fishes). Eschborn, Germany. 1980, pp. 623 p.
Russ, G.R. 1991. Coral reef fisheries: Effects and yields; 601-635. In P.F. Sale (ed.) The ecology of fishes on coral reefs. Academic Press, Inc., New York. 754 p.
White, A.T. and A. Cruz-Trinidad. 1998. The Values of Philippine Coastal Resources: Why Protection and Management are Critical. Coastal Resource Management Project, Cebu City, Philippines, 96 p.
ECOFISH COMPLETION REPORT 122

ECOFISH COMPLETION REPORT 123

ECOFISH COMPLETION REPORT 124