Ecosystem Management, Content Supply, and Revenue …
41
Ecosystem Management, Content Supply, and Revenue Sharing in Advertising-driven Platforms Hemant K. Bhargava, * † December 15, 2020 Abstract This paper examines ecosystem management issues in multi-sided platforms that provide in- frastructure to coordinate the activities and interactions of creators, consumers and advertisers, and which motivate external creators through revenue-sharing of ad payments. It specifically focuses on content provision decisions and revenue-sharing when there are numerous (possibly thousands of) creators based on the interplay amongst them and between creators and the platform’s design parameters. We examine how the level of market concentration among creators depends on the distribution of creator capabilities, and how it can be influenced through elements of platform de- sign. We show that the platform’s advertising strategy and technical design must strike a careful balance between motivating greater supply from creators and the relative market concentration in the creator ecosystem. The revenue-sharing arrangement faces a similar dilemma, where design elements that help to increase platform scale can also cause greater concentration in the creator layer, possibly threatening the bargaining position of the platform. In contrast, actions that reduce viewer distaste for ads (e.g., better matching technology) create win-win-win effects throughout the ecosystem. Design tactics that level the playing field across creators (e.g., development toolkits) improve platform revenue while also reducing market concentration among creators. The revenue- split between the platform and creators is (only) partly a tug of war, because a moderate sharing formula will strengthen the overall ecosystem and profits of all participants. * Graduate School of Management University of California Davis † I’m grateful to Darin Laframboise (Auth0), Ramnik Arora (FTX), Mingdi Xin (UC Irvine), and Xinxue Qu (Notre Dame) for useful comments and Sanjana Sivakumar (UC Davis) for graphics support.
Transcript of Ecosystem Management, Content Supply, and Revenue …
Ecosystem Management, Content Supply, andRevenue Sharing in Advertising-driven Platforms
Hemant K. Bhargava,∗†
December 15, 2020
Abstract
This paper examines ecosystem management issues in multi-sided platforms that provide in-frastructure to coordinate the activities and interactions of creators, consumers and advertisers, andwhich motivate external creators through revenue-sharing of ad payments. It specifically focuseson content provision decisions and revenue-sharing when there are numerous (possibly thousandsof) creators based on the interplay amongst them and between creators and the platform’s designparameters. We examine how the level of market concentration among creators depends on thedistribution of creator capabilities, and how it can be influenced through elements of platform de-sign. We show that the platform’s advertising strategy and technical design must strike a carefulbalance between motivating greater supply from creators and the relative market concentration inthe creator ecosystem. The revenue-sharing arrangement faces a similar dilemma, where designelements that help to increase platform scale can also cause greater concentration in the creatorlayer, possibly threatening the bargaining position of the platform. In contrast, actions that reduceviewer distaste for ads (e.g., better matching technology) create win-win-win effects throughout theecosystem. Design tactics that level the playing field across creators (e.g., development toolkits)improve platform revenue while also reducing market concentration among creators. The revenue-split between the platform and creators is (only) partly a tug of war, because a moderate sharingformula will strengthen the overall ecosystem and profits of all participants.
∗Graduate School of Management University of California Davis†I’m grateful to Darin Laframboise (Auth0), Ramnik Arora (FTX), Mingdi Xin (UC Irvine), and Xinxue Qu
(Notre Dame) for useful comments and Sanjana Sivakumar (UC Davis) for graphics support.

Keywords: platforms, content, revenue-sharing, advertising, multi-sided markets, ecosystem,developers
2

1 Introduction
Platforms that provide technology infrastructure to enable and coordinate interactions among mul-
tiple groups of participants are dominating business and social activity today (Parker et al., 2016).
This paper discusses the economic interplay in multi-sided platforms that connect contributors (or
creators or developers), viewers (or consumers) and advertisers. Several large platforms attract
hundreds of millions of users with “goods” (or content, such as music, movies, games, TV shows,
blogs, recipes, how-to videos, apps, etc.) that are sourced from thousands of creators and whose
consumption is financed by advertising payments that are shared with creators. Such platforms
are booming in categories such as music, video entertainment, virtual sports, and casual gaming,
and are the dominant model in many countries (Westcott, 2020). Examples include Snap Games,
Twitch, Jinri Toutiao, Facebook’s in-stream videos, Pandora (free version), Plex, Amazon’s IMDb
TV, Comcast’s Peacock, Pluto TV, Xumo, Hulu, Crackle/Sony, The Roku Channel, and broadcast
TV. Even in platforms that feature user-generated content such as TikTok, Instagram or YouTube,
a substantial part of consumer traffic is driven by content from stars, celebrities, and other popular
figures.1 Conversely, these star creators are the dominant recipients of advertising revenues from
the platform, thus rendering a three-sided platform comprising consumers, creators and advertisers.
This paper develops a model to structure and analyze this kind of enterprise, and examines the
following questions. How do the economic characteristics of these three groups (creators, viewers,
and advertisers) determine the overall scale of such platform, including the magnitude of content
supplied by creators, demand generated by the platform, and the level of advertising featured on
it? How is this supply distributed amongst creators, and what is the likely level of fragmentation or
concentration in the creator ecosystem? And, how should these outcomes influence the platform’s
approach to internal investments and design decisions related to creator ecosystem management,
1About TikTok: “people flock to TikTok to watch scripted clips from talented creators, not communicate with theirfriends.” https://digiday.com/media/how-tiktok-is-taking-lessons-from-the-record-industry-in-in-building-a-media-business/
1

level of advertising, and revenue sharing with creators? The analysis pertains to platforms that are
free to consumers and monetize through advertising. Amaldoss et al. (2020) examine the related
question of whether platforms should pursue consumer fees, advertising, or both.
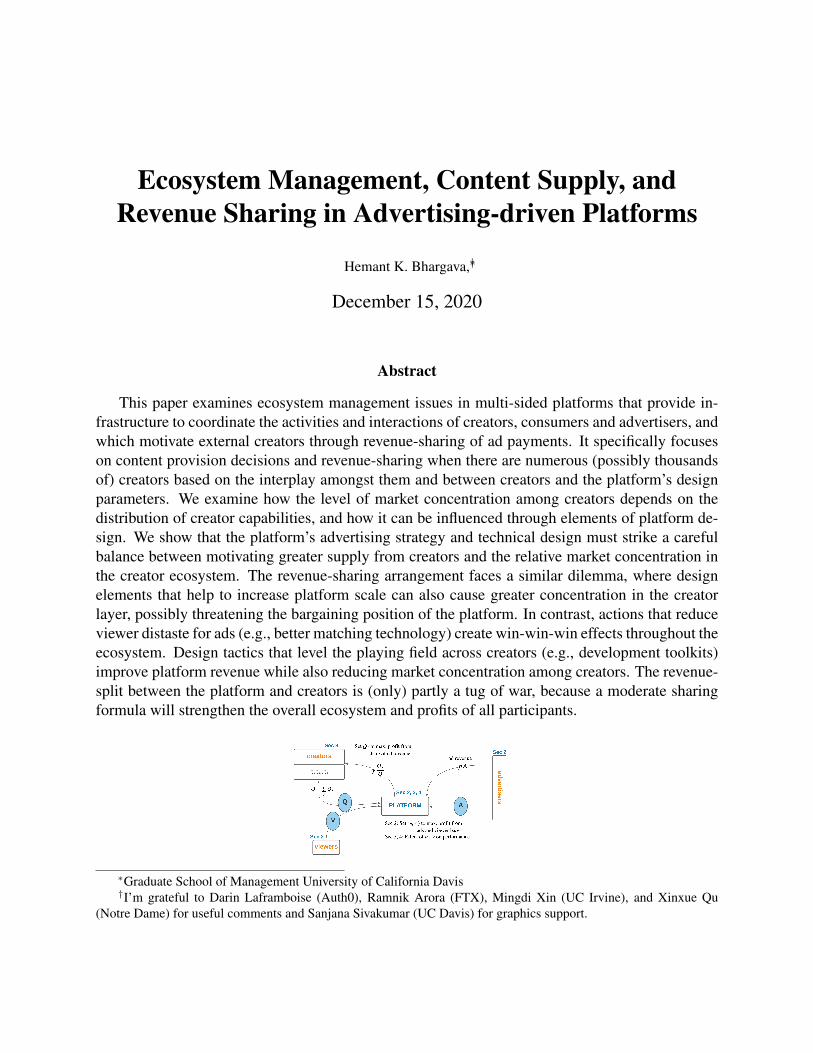
Figure 1: Stylized view of an advertising-driven 3-sided platform. The platform exhibits con-tent sourced from creators to consumers, displays ads against these views, and shares advertisingrevenues with creators to motivate them to supply content and to increase consumer visits.
Fig. 1 depicts the elements of the model. Creators collectively supply an amount Q of content
to the platform, with creator j’s output labeled asQj (andQ=∑
j Qj). Creators vary in their ability
to generate views and attract advertising, and this heterogeneity is captured by a unit creation cost
cj(> 0) for generating a unit view. Consumers are attracted by content and collectively generate V
views, with V increasing in Q (but at diminishing rate) and decreasing in the level of advertising
A chosen by the platform. The platform may also have first-party content Q0, including content
purchased or licensed directly and not subject to revenue sharing, which creates intrinsic value and
generates α0 views. Advertisers are attracted by the platform’s potential to reach customers, and
the aggregate demand from advertisers when the platform charges a per-view price p is written
as A(p). The platform earns advertising revenue R = p · A and returns a fraction γ to creators
2

with each creator receiving a share proportional to their contribution. Creator j’s output Q∗j is
chosen to maximize its payoff, its share of ad revenue net costs of content. The primary levers of
control for the platform are (i) the advertising level A (conversely, the per-view price p), (ii) the
revenue-sharing parameter γ and intrinsic value α0 (or, first-party content Q0), and (iii) additional
platform design variables that impact the exogenous parameters in the model (e.g., β, δ, θ that
affect price sensitivity of advertiser demand, viewer sensitivity to ads, and sensitivity of ad demand
to the quantity and variety of content). The revenue-sharing rate is considered identical across all
contributors (Oh et al., 2015). This is common in real-world platforms which, despite pressures and
incentives to set heterogeneous sharing rates, avoid doing so to prevent a floodgate of negotiations
around revenue-sharing, or to avoid the expense of negotiating with thousands of contributors to a
large bundle (Shiller and Waldfogel, 2013).
A key contribution of this paper is to incorporate the decision making and preferences of the
platform, its creators, and advertisers (with viewers addressed through an aggregate demand func-
tion) into a coherent framework, and to link the outcomes in this three-sided dance to platform de-
sign elements and the revenue-sharing framework. The inclusion of content creators as a strategic
element extends prior analyses of content platforms which have studied market power and industry
structure (Evans, 2008), monetization models (Peitz and Valletti, 2008; Calvano and Polo, 2020),
marketing allocations to the consumer and advertiser sides (Sridhar et al., 2011), and the balancing
of advertising and content (Dewan et al., 2002; Godes et al., 2009; Amaldoss et al., 2020). Com-
pared with analyses of creators’ outputs based on non-monetary motivations (Tang et al., 2012),
this paper endogenizes the level of incentives offered (by the platform) and adds the generation of
ad revenue to finance these payments.
The application of this framework generates several insightful contributions. First, it provides
a way to identify likely platform scale along multiple metrics, the content it would receive from
creators, what set of creators would supply content, and the level of advertising and ad revenues
that the platform would generate (§3.1). A second contribution is an analysis of alternate ways
3

in which the platform can alter its design to influence creators’ actions and platform scale (§3.2).
Platforms have multiple levers for influencing different parts of the ecosystem, and need to deploy
them astutely. For instance, a platform which has strong viewership may prioritize partnerships to
pull in advertisers (e.g., Facebook). Other platforms that need more content to bring in viewers
might prioritize creator support tools (e.g., Snap), or build media partnerships for more content
(e.g., Toutiao). Marketing to attract more viewers may be called for when the platform sees strong
demand from advertisers but lacks viewers. I show that interventions like development toolkits
and creator support programs will best promote the platform’s interest if they are easy to absorb
by all creators and level the playing field among them, thereby making creators more homoge-
neous and competitive. However, if such interventions involve a steep learning curve or significant
adoption costs, then they might well amplify differences among creators, which leads to greater
concentration in content supply.
Third, I study the manner in which the revenue-sharing tension between creators and the plat-
form intersects with the platform’s control over advertising policy (§4). I show that although
creators in general would desire higher revenue share γ (i.e., a greater percentage of ad revenues),
this desire is moderated by the knowledge that high γ would force the platform to raise ad prices,
thus lowering the amount of advertising and hence hurt their own advertising revenue share (§4.1).
Conversely, the platform is deterred from setting γ too low for that would reduce the contributions
of creators and cripple the basic content fuel of the ecosystem. More generally, the paper provides
a foundation for analysis of a range of issues in such 3-sided platforms, including those related to
platform competition, market power, industry concentration, and anti-competitive practices.
2 Model
The fundamental unit of interaction among the three types of platform participants is a “view.”
Views are driven by content from creators. A view creates an opportunity for the platform to
4

Figure 2: Key decisions and time sequence
display a paid ad by an advertiser. One of the key decision elements for the platform, having
sourced content Q, is to decide how much advertising, A∗, to inflict on viewers. This decision
(covered in §2.2) governs the ad revenue generated on the platform (revenue R(Q) = p(Q) ·
A(Q)), the share available to creators, and the magnitude of content they submit to the platform
(covered in §3.1), in turn influencing the number of views, advertising demand and ad revenue.
Anticipating this, the platform sets its revenue-sharing level, advertising policy, and other design
elements, pursuing its economic objective which combines its share of advertising revenue, its
value for the viewer base, and costs of serving viewers and managing the content supplied by
creators (formalized below in Eq. 1). I derive the overall equilibrium (p,A,Q) by first solving for
(p,A), given Q, in §2.2, and then for Q = {Q1, ..., Qk} in §3.1. The sequence of decisions is
depicted in Fig. 2. I develop insights regarding the choice of Q0 in §3.3, and regarding γ in §4.
§3.2 examines the relationship between other platform design elements (δ, θ) and outcome metrics,
and as moderated by several exogenous elements related to the ecosystem. Notation employed in
the figure and in the model development below is summarized in Table 1.
2.1 Demand from Viewers and Advertisers
Viewers are attracted to quantity and variety in the platform’s content base, and advertisers are
attracted by the presence of viewers. Similar to Jiang et al. (2019) and Bhargava (2020), each
5

Exogenous ElementsV (Q) = α(Q)− δA viewer demand function, when platform provides Q content with A adsA(Q) = β(Q)e−bp advertising demand function, against per-view price p
b > 0 price sensitivity of ad demand, reflects heterogeneity in advertisers’ utilityfrom ad views
β > 0 in β(Q) = βQθ, scaling parameter for ad demand, affected by platform’s adplacement and targeting techniques
λ ∈ R platform’s per-viewer cost of serving viewers [net of its per-viewer value]c(Q) platform’s cost of managing content [net of per-viewer value]
Platform Design Elementscj > 0 creator j’s “exogenous” cost to produce content capable of generating a
unit view, arranged in increasing order, so c1 is the most powerful creator(however, the platform can influence the magnitude and distribution of cj’sthrough interventions like developer toolkits, training programs, and how-tovideos)
θ ∈ (0, 1) in the setting β(Q) = βQθ, θ reflects elasticity of ad demand to contentscale Q, increased by diversity platform’s user profile and by improving adtargeting and matching of ads to users
δ > 0 consumer distaste for ads, lowered by improving ad placement and timing,and with better matching of ads to users
Decision VariablesA∗(Q, γ), p∗(Q, γ) (Platform) advertising level and price, to maximize Π(p;Q, γ)
Qj(γ) ≥ 0 (creator j) level of content contributed to platform, to maximize creatorprofit π(Qj;Q−j), given choices Q−j of other creators
γ ∈ (0, 1) (platform, creators) revenue-sharing parameter (creators get γ fraction of adrevenue)
Q0, α0 ≥ 0 (Platform) Own content, intrinsic value (= α(0)) provided to consumers
Outcome MetricsK number of feasible creators in equilibrium (i.e., make profit from contribut-
ing Qj)Q∗(γ)
∑Kj=1Qj
A, V Equilibrium level of views and ads A(Q∗, p∗), V (Q∗)R(Q∗) ad revenue generated, to be shared among creators and platformΠ(Q∗) platform’s profit
Table 1: Model Elements and Notation. Optimal values of p∗ and A∗ are computed knowing Qand γ; Qj’s are computed knowing γ; γ is set first. See Fig. 2.
6

viewer may consume multiple pieces of content. Collectively, viewers have a mix of preferences
for type and quality, and valuations across multiple items could be a mix of sub-additive or super-
additive. Alternately, with a linear transformation, V might be interpreted as the number of views
generated on the platform, with each consumer generating an identical number of views. The
following assumption embodies the two key forces on the magnitude of views V .
Assumption 1 (Viewer Demand). The platform’s demand for views is
V = α(Q)− δA with α0 = α(0) ≥ 0, α′(Q)>0, α′′(Q)≤0, α′′′(Q)≥0, and δ>0.
First, V is an increasing function of Q, due to increased variety, though at decreasing rate due
to substitution effects (McIntyre and Srinivasan, 2017). α(Q) is interpreted as the (maximum)
level of views that would occur if all content is served with no advertising. Second, in the presence
of advertising, and when viewers dislike advertising, V is decreasing in total number of ads dis-
played. The parameter δ reflects viewer dislike for ads, and its magnitude depends on the nature of
advertising, including the level of targeting and relevance of ads. The platform may have levers to
control δ, e.g., by improving ad targeting, improving its technology for matching ads to views, or
by carefully timing the ads to have the best effect on user engagement (Kumar et al., 2020).
The total advertising interest on the platform is the sum of ad demand across all advertisers.
Let u denote an advertiser’s utility for a single ad view by a single viewer, and let f(u) = be−bu be
the density of advertisers with utility level u. With b > 0, this allows for a range of distributions
in which higher utility levels have lower density. Let B be the total amount of ads that come in to
the platform if advertising were free. Then, with the above density function, the total advertising
demand A(p) if each ad were priced at p is A(p) = B(1−
∫ p0f(u)du
)= Be−bp, where the price
sensitivity parameter b reflects heterogeneity in per-view valuations. Although other functional
forms could be used to express advertising demand, the above form is suitable because the total
ad demand is an aggregate of the (downward-sloping) demand functions for individual advertisers.
Now consider how B relates to the scale of the platform (measured in Q or V ). Should the utility
7
u of a representative advertiser vary with either Q or V ? First, with respect to V , since u is a
primitive value of an advertiser for a single ad view, in principle it is independent of the number of
viewers at the platform. The platform’s advertiser demand function, which aggregates the primitive
single-view utilities u across advertisers, is therefore independent of V , although in equilibrium a
platform with more viewers (high V ) would be able to serve more ads. With regard to Q, more
content will attract a more diverse set of viewers (by gender, race, age, income, education, interests,
etc.), allowing the platform to make better matches between users and ads, thereby increasing
each advertiser’s valuation of each exposure. Hence the total ad demand received by the platform
may have positive sensitivity to Q due to this indirect effect, although less so than α(Q) does.
Accordingly we write B = β(Q), with the following properties.
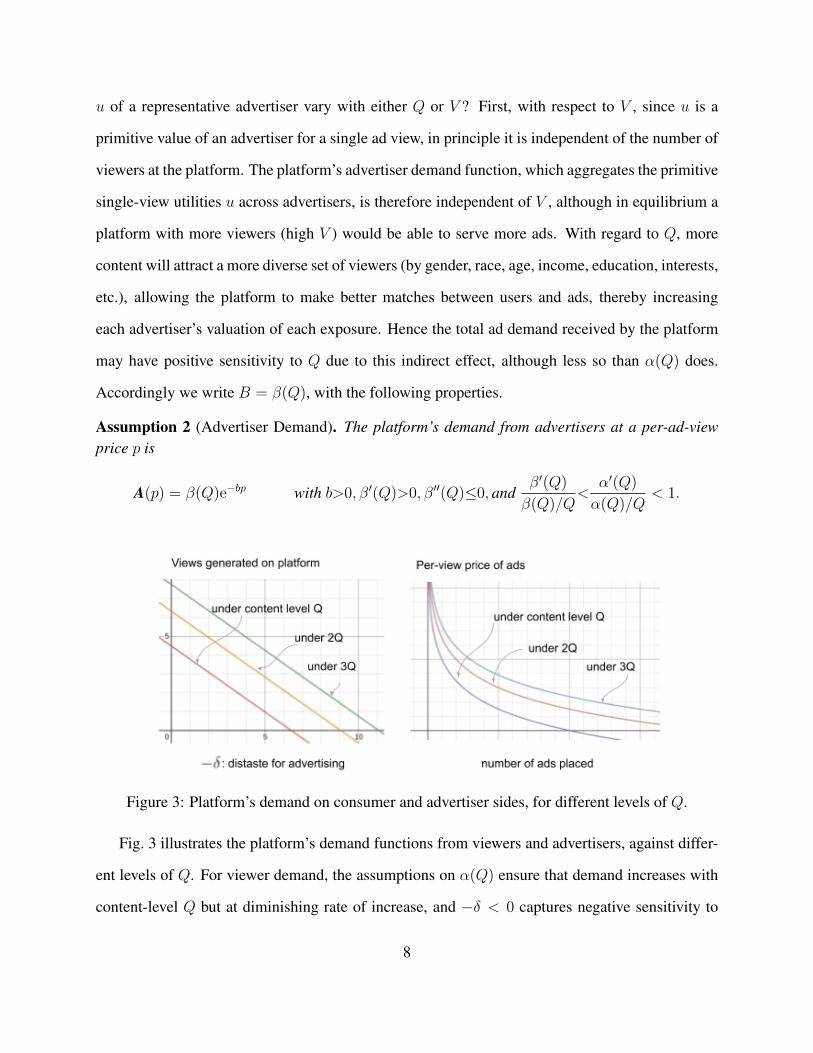
Assumption 2 (Advertiser Demand). The platform’s demand from advertisers at a per-ad-viewprice p is
A(p) = β(Q)e−bp with b>0, β′(Q)>0, β′′(Q)≤0, andβ′(Q)
β(Q)/Q<
α′(Q)
α(Q)/Q< 1.
Figure 3: Platform’s demand on consumer and advertiser sides, for different levels of Q.
Fig. 3 illustrates the platform’s demand functions from viewers and advertisers, against differ-
ent levels of Q. For viewer demand, the assumptions on α(Q) ensure that demand increases with
content-level Q but at diminishing rate of increase, and −δ < 0 captures negative sensitivity to
8

advertising, as in (Dewan et al., 2002). The advertising demand function ensures that ad supply in-
creases with Q but at diminishing rate. It implements the perspective that higher Q brings a mix of
consumers who are partially alike (i.e., substitutes, which drives β′(Q) towards zero) and diverse
(complements, higher β′(Q)). Finally the negative exponential demand for advertising reflects an
elasticity of supply bp at per-ad-view price p. The model setup reflects a posted-price environment,
but it is consistent with a mechanism where instantaneous price is discovered through a real-time
auction that reflects instantaneous demand for ad impressions.
Advertising imposes a cost to the platform, covering economic costs of selling and manag-
ing advertising placement and costs associated with long-term customer dissatisfaction. Thus, we
write this cost as λδA (with λ>0) so that it is increasing in both the amount of advertising and the
consumer distaste for advertising. The platform also has an operations and marketing cost c(Q)
(with c′(Q) > 0) in serving content to consumers, covering technology, curation, data privacy,
content policing, etc. Platforms often also place an intrinsic value on their user base (Gupta and
Mela, 2008; Gupta, 2009), which would amount to hV = hα(Q) − hδA. These terms are en-
capsulated into the cost terms c(Q) and λδA (by redefining λ as λ−h and c(Q) as c(Q)−hα(Q));
accordingly, the redefined λ and c(Q) can be negative if h is very high. Then, with content Q and
advertising level A leading to V views, the platform’s total payoff function combines its share of
advertising revenue and the adjusted costs of managing content and viewers.
Platform Profit Π = (1−γ)pA− λδA− c(Q) = ((1−γ)p− λδ) e−bpβ(Q)− c(Q). (1)
2.2 How Much Advertising?
The platform provides consumers a free service and finances itself through ad revenues. It must
balance the amount of advertising it inflicts on users: more ads have a first-order effect of di-
minishing the user experience and causing a reduction in views, but they also (by returning more
revenue to creators) incentivize creation of more content which then plays a positive role in en-
9

couraging more views. This section explores the tradeoffs and balance in advertising, primarily
as a stepping stone to examine additional issues in the ecosystem around content contribution and
revenue-sharing.
The platform’s choice of advertising level A∗ involves a tradeoff between greater monetization
of views and a reduction in number of views as advertising intrudes on the consumer experience
and causes a reduction in views. A feasible advertising level is one which maintains a positive
level of V (i.e., A ≤ α(Q)δ
). Beyond this, a platform may impose a stricter constraint such as no
more than one ad per n views, which places an upper bound on the equilibrium level of advertising.
Let A(Q) = α(Q)n+δ
denote this upper bound (when there is content Q), hence the equilibrium level
of advertising must be no more than A(Q). Given a revenue-sharing parameter γ and the cost
parameter λ, the platform maximizes its payoff subject to this constraint. Given Q, the advertising
equilibrium (A∗(Q), p∗(Q)) can be computed either by solving Eq. 1 for p or for A (where p(A)
can be obtained by inverting the expression in Assumption 2). Likewise, the solution can embody
an optimal posted price p∗ or a price discovered via an auction in which advertisers place bids once
the platform has chosen an optimal advertising level A∗.
The optimal per-view ad fee p should, in an interior solution, follow the classic rule inverse
price elasticity of advertising demand equals relative price markup. The elasticity term is ε(p) =
−∂A∂p/Ap
= bp. To compute the price markup, note that the platform earns revenue (1−γ)p from
a unit ad, while this ad imposes a cost λδ, yielding the markup term (1−γ)p−c(1−γ)p
. Now, substituting
and applying the optimal pricing rule yields that p∗ should satisfy the equation 1bp
= (1−γ)p−λδ(1−γ)p
.
This yields the following result about the platform’s optimal advertising strategy. A formal proof
is included in the appendix.
Lemma 1 (Optimal advertising). The platform’s optimal advertising strategy corresponding to
10

content magnitude Q has the following per-ad price and advertising level,{p∗ = 1
b+ λδ
(1−γ)
A∗(Q) = β(Q)e−bp∗ if α(Q) ≥ (n+δ)e−1− bλδ
1−γ β(Q), (2)
with Π∗(Q) =
(1−γb
)β(Q)e−bp
∗ − c(Q)
else there is a boundary solution[A =
α(Q)
n+δ, p =
1
bloge
(β(Q)(n+δ)
α(Q)
)].
While Lemma 1 provides guidelines for setting optimal price and advertising level, compar-
ative statics also provide additional insights regarding platform design and its implication on the
advertising ecosystem. For instance, if the platform can improve ad placement to reduce δ, it can
exploit this gain by showing more ads vice increasing the per-ad price, because although con-
sumers are more willing to see more ads there is no increase in advertisers’ payoff conditional on
ad display.2 The main solution stated in Eq. 2 is valid when viewer demand for content α(Q) is
sufficiently strong relative to advertiser demand. If α(Q)n+δ≥ βQθe−bp
∗ for all Q, then an interior
solution is guaranteed. If not, it must be that it fails at low values of Q but holds at higher values
(because α(Q) grows at a faster rate than β(Q)). Then, a boundary solution in the advertising
policy arises when, at the candidate Q, the platform faces relatively strong demand from adver-
tisers but does not generate enough views on which to display ads, or if viewers drop rapidly as
advertising increases (high δ). We discuss this further after computing the remaining piece (Q∗) of
the equilibrium specification in §3.1.
2.3 Properties of Advertising Equilibrium
Lemma 1 satisfies a few intuitive expectations about the optimal design of advertising. First, the
platform’s optimal advertising level A∗ is higher when it has a more attractive user profile or better
ad targeting technology (β′(Q) is higher or δ is low), when consumer sensitivity to advertising
(δ) is low (e.g., due to more relevant ads), when ads cost less to manage and do not strongly
2This is an implication of the negative exponential price function for advertising demand.
11

affect the platform’s installed base (low λ, e.g., when it is highly mature) or when the platform
keeps a higher share of ad revenues (low γ). Conversely, the optimal per-ad price is higher under
the opposite conditions, reflecting the desire to inflict less advertising on consumers rather than
reflecting greater market power for advertisements. Second, the platform’s optimal advertising
level is higher when Q is larger, and the effect of Q shows up in larger volume of ads rather than
higher price per ad. Fourth, if the platform increases creators’ share of revenue (γ) it will then
compensate by setting higher price, with less advertising overall. Thus, although creators prefer
greater share of ad revenue, advertisers’ interests are maximized when the platform keeps a higher
share. To summarize,
∂A∗
∂−δ> 0;
∂A∗
∂λ< 0;
∂A∗
∂b< 0;
∂A∗
∂Q> 0;
∂A∗
∂γ< 0;
∂p∗
∂−δ< 0;
∂p∗
∂λ> 0;
∂p∗
∂b< 0;
∂p∗
∂Q= 0;
∂p∗
∂γ> 0.
These properties are consistent with anecdotal and empirical observations regarding platforms
that are primarily financed by advertising. For instance, in the era of search advertising wars
between Google and Yahoo! (and Microsoft) it was understood that the average per-click prices
on Google were higher than those on competitors not because Google attracted more search users
but because ads were better targeted, reached a broader profile, and led to more conversions.3
When the matching between viewers and ads is superior, it can also reduce viewers’ distaste for
advertising (δ). This can be highly beneficial to ad-driven platforms because viewers’ attitude
towards ads is a critical factor in ecosystem performance. Indeed, combining the effects of δ on
price and advertising level, the equilibrium advertising revenue R(Q) is, ceteris paribus, higher as
δ decreases (because p∗ > 1b).
3https://instapage.com/blog/bing-ads-vs-google-ads.
12

3 Content Contribution
Content served on the platform is sourced from numerous creators (or their financers) who produce
different types of content so that the collection, which may include substitutes and complements
and unrelated goods, increases variety. Creators have costs for making content, and their primary
motivation for supplying content to the platform is the share of advertising revenue they receive
from the platform (Zhu and Q. Liu, 2018), rather than exposure, ego or reputation gains (as in, e.g.,
Tang et al. (2012) and Y. Liu and Feng (2020)). Creators compete with each other in generating
views and securing ad impressions. LetQj ≥ 0 represent creator j’s content supply to the platform,
with Q =∑
j Qj being the total content available to viewers, and R(Q) = p(Q)A(Q) the total
advertising revenue generated by the platform (specified in Lemma 1). Then creator j’s payoff
from sharing Qj is γQjQR(Q). In this section we specify how the economic and technological
characteristics of creators and the platform affect creators’ absolute and relative contribution to the
platform.
Creators are heterogeneous in their capability to make content (e.g., production technology
and skills), in talent and star power, or in intellectual properties they own (e.g., rights to stories
or characters). This heterogeneity manifests itself in different number of views captured for each
unit of effort or cost (Y. Liu and Feng, 2020). For instance, Disney Television studios’ StageCraft
system (which was used in creating The Mandalorians) is considered a technological marvel that
immerses the cast and production crew inside their computer-generated environments in real time
with the help of a massive wraparound LED screen. Content made with such technology is likely to
garner more views than content created by the average content creator with a standard camera and
production environment. Similarly, a 30-second clip featuring a celebrity is likely to capture more
views than a similar clip with an average college student. To model this heterogeneity between
creators’ ability to generate views on the platform, we index creators by their average unit cost
cj for generating a single view. Typically, creators with low cj (i.e., producers of highly popular
13
content such as Epic’s Fortnite or Electronic Arts’ Apex Legends) are likely to be sophisticated
studios, celebrities, and social media stars. Conversely, high cj corresponds to creators with low
quality or niche content, who will therefore generate fewer views for the same expenditure.
Each creator chooses a level of output based on its expected revenue share and its own costs or
capabilities. Without loss of generality, assume that creators are indexed according to increasing
cj (with c1 being the lowest-cost, i.e., most-efficient or most-popular creator). Let Q−j denote the
total content provided by all creators except j (with Q = =Qj+Q−j). Then creator j’s payoff
function is
πj(Qj, Q−j) = γQj
QR(Q)− cjQj =
γQjQ
(β(Q)p∗e−bp
∗)− cjQj (interior)
γQjQα(Q)n+δ
1b
log(β(Q)(n+δ)α(Q)
)(boundary)
(3)
where the interior and boundary cases correspond to the two possible advertising solutions in
Lemma 1. Creators’ output levels Qj to the platform are viewed as solutions to a Cournot-type
simultaneous game in which each creator picks Qj to maximizes its payoff subject to collective
output Q−j from other creators, and subject to boundary constraints Qj ≥ 0 and individual ratio-
nality (IR) constraints Πj(Qj, Q−j) > 0, i.e., cj ≤ γR(Q)Q
, hence (due to the index order on cj’s) the
marginal supplier K is the highest j that satisfies this condition given the remaining choices Q−j
for all j < K. The optimal output levels satisfy the property that marginal cost equals marginal
revenue, given the output choices of other creators.
3.1 How Much Content Will the Platform Attract and Who Will Supply It?
Creator j’s economic tradeoff when deciding output level Qj when other creators have output
Q−j is as follows. The incremental advertising revenue generated by an additional infinitesimal
increment ∆Q is R(Q+∆Q)−R(Q). If this incremental amount were added by creator j, whose
marginal cost is cj∆Q, its marginal revenue is γQj+∆Q
Q+∆QR(Q+∆Q)− γQj
QR(Q). Setting marginal
14

cost and revenue equal, then dividing by ∆Q, rearranging terms, and taking limits, we get the set
of conditions
cj = γR(Q)
Q− Qj
Q
(R(Q)
Q−R′(Q)
)≡ Qj =
1
γ
(γR(Q)
Q− cjQ
)/
(R(Q)
Q−R′(Q)
).
By definition, Q =∑
Qj, however this aggregation covers only those producers who can earn pos-
itive profit under the Qj vector. This leads to a set of creators 1...K who have cost no greater than
a threshold ck representing the highest-cost creator who can make positive profit. Let CK denote
the average of the cost indices of these top K creators. Then the content production equilibrium is
as follows. A formal proof is in the Appendix.
Proposition 1 (Equilibrium). The feasible number of creators (K) who make positive profit fromengaging with the platform, and the total content supplied by them (Q), satisfy the simultaneousequations
K = maxj
:
(cj ≤
γR(Q)
Q
), (4a)
Q = K
(1− CKQ
γR(Q)
)(R(Q)
R(Q)Q−R′(Q)
), (4b)
with outputs and output shares of each creator j being
Qj =
(1− cjQ
γR(Q)
)(β(Q)
β(Q)Q−β′(Q)
)=
(γR(Q)
Q− cjQ
)/
(γR(Q)
Q− γR′(Q)
), (5a)
Qj
Q=
1
K
(1− cjQ
γR(Q)
)/
(1− CKQ
γR(Q)
). (5b)
Eq. 4a-4b jointly indicate the equilibrium level of total content contributed to the platform and
the set of feasible producers (identified by the average cost parameter CK) who supply it. Then
the series of equations Eq. 5a identify the content levels of each of the feasible producers. The
IR constraint for all creators is of the form cj ≤ γR(Q)Q
(with the same RHS), hence it needs to
15

be verified only for creator K, and K can be computed uniquely once the form of R(Q) is fixed.
Procedurally, the highest k that satisfies the IR constraint with the value of Q given in Eq. 4b is the
equilibrium value of K, Eq. 4b then returns Q, and each Qj is obtained from Eq. 5b. We explain
this with an illustrative and suitable form for β(Q) below.
The term β(Q) in A(Q) captures sensitivity of ad demand to platform scale. Writing β(Q) =
βQθ (with θ < 1) yields an ad demand function A = βQθe−bp that exhibits a constant elasticity
factor θ (i.e., θ = ∂A∂Q/(A/Q)), and satisfies the requirements laid out in Assumption 2. The
platform can influence the scaling parameter β through tools (such as Hulu’s Ad Manager) that
help advertisers with ad placement, targeting, and analytics. With this additional specification, the
optimality conditions for creators’ choice of Qj (in case of the interior solution) are
∀ j πj(Qj, Q−j) = γQj
Q
(βQθp∗e−bp
∗)− cjQj (6a)(∂πj∂Qj
= 0
)≡ cj =
γβp∗e−bp∗
Q1−θ
(1− (1−θ)Qj
Q
)(6b)
≡ Qj =Q
1−θ
(1− cjQ
1−θ
γβp∗e−bp∗
)(6c)
where creators 1...K are the ones that have non-negative profit in equilibrium. This enables closed-
form solutions of the simultaneous equations Eq. 4a-4b and leads to the following specification of
the equilibrium outcome.
Proposition 2 (Equilibrium Level of Content). With β(Q) = Qθ, p∗(Q)=(
1b+ λδ
1−γ
)and revenue-
sharing parameter γ, the set of creators who can profitably supply content is {1...K} where
K = maxk
:
(ck ≤
Ckk
k−(1−θ)
), (7)
and the total content collected by the platform from these creators is
Q =
(γβp∗e−bp
∗
CK
K−(1−θ)K
) 11−θ
= (γp∗A∗)
(K−(1−θ)CKK
), (8)
16

Figure 4: Equilibrium with interior solution in (p∗, A∗, Q∗) occurs either if α(Q)n+δ≥ βQθe−bp
∗ forall Q, or if the intersection of Eq. 2 and Eq. 8 in (Q,A) space has Q ≥ Q which is defined byα(Q)n+δ≥ β(Q)e−bp
∗ .
while the proportional content share of individual creators is
Qj
Q=
1
1−θ
(1− cj
CK
K−(1−θ)K
), (9)
provided that Q from Eq. 8 ensures an interior advertising-pricing solution (Eq. 2), i.e.,
α(Q) ≥(
CKK
K−(1−θ)
)((n+δ)e
bλδ1−γ+1
γ
)Q (10)
otherwise, Q is a value Q that satisfies α(Q)n+δ
= βQθe−1− bλδ1−γ , yielding a lower value than given in
Eq. 8.
The main interior equilibrium solution applies when viewer demand for the platform is suffi-
ciently strong as a function of Q, so that the platform generates enough views on which to display
its supply of ads at p∗. As shown in Fig.4 this is the region where Q > Q (which demarcates the
boundary in Lemma 1). If this occurs, and ignoring the market failure solution (Q=0, A=0), there
is a unique (p∗, A∗, Q∗) solution because Eq. 8 provides a linear relation between A and Q while A
is concave in Q in Eq. 2. If the process yields Q < Q (e.g., the point marked x1 in the figure), then
the above solution is not valid. The alternate solution Q corresponds to saturation advertising, and
17

it must occur on the curve that marks A(Q)=α(Q)n+δ
. In this solution, though, Q will be less than that
indicated by point x1 because here the advertising revenue available to creators is lower than the
level conveyed by Eq. 2; the lower revenue implies that outputs are lower than the implied Q∗j ’s, in
turn causing lower demand from viewers, and feeding back into the loop of fewer ads and lower
ad revenue and lower content, until converging to a point x2 corresponding to (p, A, Q). Hence
this second situation underlines an urgency for the platform to deploy marketing tactics to attract
more viewers, develop partnerships with content creators, build higher standalone value into the
platform, or adopt a more user-friendly approach to advertising (in order to lower δ), at the expense
of sales efforts to attract more advertisers.
Corollary 1 (Proposition 2). The equilibrium level of Q increases in γ up to some threshold valueof γ (i.e., ∂Q
∂γ> 0 initially), then decreases. Trivially, ∂Q
∂β> 0, with ∂2Q
∂β2 > 0.
As noted previously in §2.2, the platform’s advertising policy intersects with its revenue-
sharing policy on account of its effect on creators outputs. From Eq. 4b we see that Q is in-
trinsically increasing in γ (i.e., if all other factors are constant). However, the platform’s pursuit of
optimal advertising causes it to raise ad price p as γ increases, reducing ad demand. Still, because
creators’ interest is in ad revenues rather than number of ads, Q initially increases with γ but then
drops as γ gets so high that a very high p causes a huge drop in ad volume.
3.2 Implications on Platform Design
Eq. 8 specifies how the total content made available on the platform—and consequently, consumer
views, advertising demand, platform revenue, and surplus of other participants—varies with vari-
ous platform design parameters. A platform seeking to increase scale or profit has multiple ways
to alter its design and influence the actions of platform participants. These include technological
factors that enhance targeting and matching of ads to views (which may reduce δ and/or increase
θ), attracting a more diverse user base (yielding higher θ), increased sales effort to reach advertiser
segments (higher β), better data about users’ preferences (which may improve λ), creator develop-
18

Figure 5: The top row shows cj’s of 400 potential creators on the x-axis (the black bullet marksc1, other cj’s are displayed as x-axis ticks), and the cumulative density on the y-axis. The next tworows show associated output shares %
QjQ
for θ = 0.3 (middle row) and θ = 0.1 (bottom row). Inscenario 1, the Qj’s are highly concentrated among a few creators whose costs are far lower thanall others.
ment programs and toolkits to assist with content creation and distribution, and better bargaining
power with creators (lowering the revenue-sharing parameter γ). We explore below the relative
merits of investments towards improving each of these parameters, on crucial outcome consider-
ations such as platform scale and level of concentration in creator-sourced content? Example 1
illustrates some insights by showing how the number of feasible creators, and their absolute and
relative outputs, varies with the nature of creator capabilities (cj’s), and with two levels of θ for
each scenario.
Example 1 (Distribution of creators’ outputs under different distributions of cost indices). Con-sider 4 scenarios, each with 400 potential creators whose cost indices are as indicated in thecumulative distribution functions in the top panel of Fig. 5. In Scenario 1—which has the sharpestdifference between low-cost and high-cost creators—a few creators (cj ∈ [4, 6]) have far lowercost than others (distributed in [6, 15]). The cj’s in Scenario 2 are quite homogeneous, huddled in[14, 16]. The cj’s in Scenario 3 are in [4, 16] as in Scenario 1, but spaced out uniformly. In Sce-
19

nario 4, a few creators have lower costs than others, but the differences between them and highercost creators are not as amplified in Scenario 1. Scenario 1 features lowest cj’s but also greatestheterogeneity.
1. In Scenario 1, the sharp heterogeneity between a few lowest-cost creators (with cj ∈ [4, 6])leads to their domination and heavy concentration of output.
2. Creators’ cj’s in Scenario 2 are relatively homogeneous (all huddled in the [14,16] interval),hence output is distributed among many more creators (higherK, although totalQ is lower),with even the lowest c1 garnering only a small fraction of viewers.
3. Scenario 3 also has a few low-cost creators (cj ∈ [4, 6]) however there are several of themin this range, leading to a more even distribution of output, and the higher K leads to higherQ overall (overproduction).
4. In Scenario 4 a few lower-cost creators stand out, like in Scenario 1 but they are less extreme,causing higher K, less concentration, and lower Q.
5. Across all 4 panels, the middle row, with θ = 0.3, has more concentration relative to thelower row with θ = 0.1.
The examples convey two primary insights. First, when creator capabilities (cj’s) are more ho-mogeneous, then K will be higher and market concentration lower because homogeneity createsmore competition among creators. Second, higher θ will lead to more concentration of contentand rewards among fewer creators. The intuition is that already-powerful creators will be betterable to leverage the higher scale enabled by higher θ (i.e., the rich get richer). Thus, platformdesign changes that enhance θ (e.g., more diverse user profile) can lead to greater concentrationamong creators. Conversely, innovations that limit consumer ad distaste (i.e., lower δ) or improvead targeting will increase platform scale and profits without affecting the distribution of marketshare among creators.
3.2.1 Creator support programs and developer toolkits
The size of the platform ecosystem (K, the number of feasible creators that earn positive profit
from their participation in the platform), is an important indicator of the health of the platform
ecosystem. It exerts influence on consumer demand for the platform, total content offered on it,
and potentially the relative bargaining power between the platform and creators. Intuitively, the
platform can achieve higher K by lowering creators’ cj’s. This path is often pursued by platforms
20

through toolkits for design and editing of content. YouTube runs a creator academy, offers or en-
courages creation of masterclasses and tips for growing one’s YouTube channel. Similarly, various
and software platforms run workshops and certification programs. These interventions lower the
cj’s, however the results can be counter to intuition. From Eq. 7 in Proposition 2, the distribution
of cj’s is a crucial determinant of K, hence whether or not K increases with a reduction in cj’s
depends on how the reduction alters the heterogeneity in cj’s. Example 1, discussed earlier, shows
this vividly. We discuss below the more general point that the effect of these resources depends on
whether they help make cj’s more (or less) dissimilar vs. just lower.
Two other important metrics for the platform are total content in the ecosystem (Q, because it
affects consumer views, advertising demand, platform revenue, and surplus of all participants) and
the distribution of content and advertising revenues across creators (the ratios QjQ
) which affects
relative market power between the creator ecosystem and the platform. How are these metrics
altered with changes in cj’s? Fig. 5 illustrates the joint effect of the magnitude of cj’s and the degree
of homogeneity among them onK. As highlighted in the second part of Corollary 2, below, greater
homogeneity leads to larger K, because from Eq. 7, K is identified by the first cj that is “relatively
distant” from the previous one. It also spreads output more uniformly across creators, reducing
dominance of the most powerful ones. This suggests that the platform would be better served by
creating technologies that not only lower cj’s but also level the playing field among creators (i.e.,
the new cj’s are more homogeneous). Hence, interventions like training programs and toolkits that
contain specialized features for making content creation and distribution more efficient will best
promote the platform’s interest if they are easy to absorb by all creators and level the playing field
among them (i.e., they are most novel and useful to the smaller or higher-cost creators), thereby
making creators more homogeneous and competitive. However, if these interventions involve a
steep learning curve or significant adoption costs, then they might well amplify differences among
creators because only the more capable creators can take advantage of these resources, and this
leads to greater concentration in content supply.
21

Corollary 2 (Proposition 2). A reduction in cj’s leads to an increase in Q. Interventions thatreduce all cj’s by a constant amount ∆c, thus amplifying the cost differences between creators,lead to lower K and greater concentration in the creator ecosystem, with an increase in the shareQjQ
of the lower-cost creators. Conversely, interventions that make creators more homogeneous(e.g., by reducing variance, relative to mean, between cj’s) lead to higher K and to more uniformdistribution of market share across creators.
3.2.2 Viewer diversity and ad targeting technology
The platform can also improve its scale by increasing θ (trivially, ∂Q∂θ
> 0), for instance by at-
tracting more diverse viewers and creators, and in complement to that, developing better matching
technology that serves more suitable ads to each viewer. Proposition 2 illuminates the tension faced
by the platform in doing so. The platform’s advertising demand increases with θ (which captures
sensitivity of advertisers’ value per-exposure to total Q or V ), which it can achieve by improving
consumer diversity and its technology for targeting or matching ads to consumers. Total content
supplied, and flow of advertising revenue, should increase with higher θ. Counter to intuition,
though, doing so leads to fewer viable creators: higher θ leads to lower K. This is because higher
θ implies higher gains from producing more content, making the most powerful creators (ones
with lower cj) highly aggressive in supplying content to the platform and leaving little room for
higher-cost creators in the revenue-splitting game.
Corollary 3 (Proposition 2). Increase in θ (weakly) causes greater concentration of content con-tribution among fewer creators, with an increase in share of the more powerful creators (low cj’s),and overall increase in output Q. Formally, ∂K
∂θ≤ 0, and ∂Qj/Q
∂θ≷ 0 when cj ≶ Ck.
Thus, although the platform would like to increase θ and improve the economics of the ecosys-
tem, doing so will make the most powerful creators highly aggressive in supplying content, thereby
increasing their market share (QjQ
). This increase in degree of concentration among creators not
only affects social dominance in the consumer market but also influences the bargaining power of
the platform relative to creators. For a given distribution of cj’s an increase in θ can potentially
increase the bargaining power of a few dominant creators, which raises the risk for the platform of
22
demands for lower γ (if K gets sufficiently low).
3.2.3 Changes in the creator ecosystem
Interventions that increase K by compressing the differences between cj’s can also increase com-
petition among creators and make them more aggressive in supplying content to the platform. This
leads to higher Q, increasing platform scale and ad revenues. Interventions such as toolkits and
training academies have a substantial positive spillover effect on the platform, not only attracting
more creators and higher output, but excessively higher output because more of them simultane-
ously compete to capture a greater fraction of advertising eyeballs and revenues. Of course, the
distribution of cj’s can also be altered on account of events external to the platform, for instance
mergers between creators. To illustrate the effect, imagine two scenarios which differ in the num-
ber of creators and their cj’s but have the same mean. Proposition 2 provides the insight that,
normalizing across cost, more creators implies greater content, reflecting the “overproduction”
insight mentioned earlier in Example 1 (comparing Scenarios 1 and 3).
Proposition 3 (Overproduction by competing creators). Other things being the same (γ, β, b, θ, δ),the total output in an ecosystem with creators 1...K whose cost indices c1, ..., cK satisfy cK ≤
CKKK−(1−θ) (where CK is the average of cj’s) exceeds the output from fewer creators with the sameaverage cost.
The crucial aspect of the result, having normalized for mean cost, is that existence of multiple
creators increases competition among them for share of advertising eyeballs, causing each of them
to supply excessive content on the platform. This is good for consumers (assuming content is a
“good”) and for the platform. Thus interventions such as toolkits and training academies have a
substantial positive spillover effect on the platform, not only attracting more creators and higher
output, but excessively higher output because more of them simultaneously compete to capture a
greater fraction of advertising eyeballs and revenues.
23

3.3 First-Party Content and Intrinsic Value
The discussion thus far assumes that the platform relies on third-party creators to provide all the
value that brings in viewers. However, α(Q) in the viewer demand function V=α(Q)−δA can
include an order-zero component α0 that represents standalone or intrinsic benefit from the plat-
form due to features (e.g., file storage, profile development, single-sign-on to other sites, calendar,
etc.) that are valued by users independent of their content preferences or advertising. Moreover,
Q might include, along with the other Qj’s, a component Q0 which represents first-party content
developed by the platform or other content it purchases or licenses that is not subject to ad revenue
sharing. How do these two factors α0 and Q0 influence ecosystem performance, advertising, and
content provision by external creators?
First consider the effect of α0 under a boundary solution (p, A, Q). Since advertising is limited
to A = α(Q)n+δ
(on account of insufficient viewers to deploy ad level A∗), causing the platform
to sacrifice some ad revenue, specifically p∗A∗ − p∗A. An increase ∆ in α0 would extend the
advertising constraint by ∆n+δ
and directly increase ad revenue by p∆ to offset the cost of increasing
α0. However, there are additional spillover effects. The higher ad revenue would motivate creators
to increase Qj , bringing in more viewers, stretching the advertising constraint further, feeding the
cycle again. If the investment in α0 exceeds a tipping point (which would depend on a specific
function for α(Q)), then this process converges to an interior equilibrium (p∗, A∗, Q∗) where the
constraint just no longer binds (i.e., A∗=A), creating substantial payoff from the investment in
standalone benefits. The effect of investing in Q0 (first-party content) has similar effects because
the platform can direct all possible advertising to third-party content views (because there is a
scarcity of views). Finally, the effects of investing in α0 or Q0 are weaker when the problem has an
interior solution because the advantage from increasing views is lower in the absence of sufficient
advertising to exploit the extra views. This discussion confirms the intuition that investments in
standalone benefit and first-party content are most consequential at the early stages of the platform
when its scale is relatively low and when it has greater urgency to attract more views.
24

4 Sharing Advertising Revenue with Content Creators
Our analysis thus far has considered the platform’s advertising strategy and content creators’ supply
strategy given that the platform passes γ fraction of advertising revenues to creators. The optimal
or equilibrium level of γ is subject to multifaceted issues including relative market power and co-
dependence. On one hand, each creator is tiny and relatively inconsequential to the platform. On
the other, the platform’s business model depends on creators and they potentially have an ability
to create coalitions. These factors create alternative possibilities for the revenue-sharing game (Oh
et al., 2015). Our focus therefore is mainly to shed light on how γ affects the overall activity levels
and payoffs of different actors. and the overall health of the ecosystem.
The platform’s payoff function given a revenue-sharing parameter γ, and using the advertising
demand function A(Q) = βQθe−bp is
Π(γ) = (1−γ)R(Q)− λδA− c(Q) = ((1−γ)p∗ − λδ) βQθe−bp∗ − c(Q) (11a)
=
(1−γb
)βQθe−bp
∗ − c(Q) (11b)
where, with optimal advertising and content creation, the optimal values of p and Q and K are
p =1
b+
λδ
(1−γ),
∂p
∂γ=
λδ
(1−γ)2(12a)
Q =
(γβpe−bp
CK
K−(1−θ)K
) 11−θ ∂Q
∂γ=
Q
1−θ
[1
γ+
(1−bpp
)∂p
∂γ
](Eq. 15) (12b)
K = maxk
:
(ck ≤
Ckk
k−(1−θ)
)(12c)
The revenue-share parameter γ determines what fraction of revenue is kept by the platform
(1−γ) vs passed on to creators. However, the choice of γ is not a zero-sum game where creators
prefer γ=1 while the platform wants γ=0. For creators, the penalty from a very high γ is that
it would cause the platform to shift ad prices higher, causing lower ad volume and thereby drive
25

down creator revenues down. For the platform, if it sets γ too low then the low rewards to creators
will cripple content contribution, the basic fuel that drives the entire engine. Therefore, a judicious
choice of γ would consider effects throughout the ecosystem, including implications on long-term
health and scale.
The identification of the optimal revenue-sharing level—from the platform’s perspective while
also including interests of other ecosystem participants—requires some consideration of the plat-
form’s underlying objectives. One obvious objective is to maximize the profit function in Eq. 11.
However, due to c(Q) and λδA, the profit-maximizing choice of γ would negatively distort the to-
tal ad revenue passing through the platform, which is an important objective for the platform and a
metric of overall scale. Another measure of platform scale is the total volume of content available
on the platform, Q. Hence, it is meaningful to consider the implications on platform performance
with regard to each of these metrics.
4.1 Maximizing Platform Scale
The revenue-sharing parameter has multiple impacts throughout the platform ecosystem, including
on the levels of contributed content, viewership, advertising revenue flowing into the ecosystem,
and the platform’s share of the revenue. There are two key forces to consider. One, higher γ
naturally motivates creators to provide more output per dollar of advertising revenue that it gener-
ates. The consequent increase in views has a positive impact on advertising demand. This exerts
a positive effect on ad revenue into the ecosystem. Second, however, since the platform sets per-
exposure advertising price to maximize its ad revenue payoff (adjusted for intrinsic value placed
on viewership), it then sets a higher ad price thereby depressing advertising demand and conse-
quently exerting a negative force on content creators. The interaction of these two forces leads to
a first-positive and then-negative effect of γ on Q, so that Q peaks at an interior value of γ. As for
the effect on R(Q), note that the revenue grows as a multiple of price and advertising, hence the γ
at which R(Q) peaks should be lower than the peak for Q but higher than for A(Q). These ideas
26

Figure 6: Effect of γ on Q, A(Q), and R(Q) for higher and lower values of θ (top and bottomrows) and with two values of δ = 0.1 (black, dashed) and δ = 0.2 (red).
are formalized in the result below.
Lemma 2 (Optimal γ to maximize Q and R(Q)). The values of γ that maximize total content onthe platform and, respectively, total ad revenue, are
for Q : γQ = Sol.[(1−γ)3 + (bλδ)(1−γ)2 + (bλδ)2(1−γ)− (bλδ)2 = 0
](13a)
for R(Q) : γR(Q) = Sol.
[(1−γ)3 + (bλδ)(1−γ)2 +
(bλδ)2
θ(1−γ)− (bλδ)2
θ= 0
](13b)
and each equation yields a unique value inside the feasible region (0, 1).
Corollary 4 (Lemma 2). The value of γ that maximizes Q is decreasing in b, λ, and δ. The sameis true for γ that maximizes R(Q), and this value is increasing in θ.
Fig. 6 demonstrates the effect of γ on Q and R(Q) (and, additionally, A(Q), the scale of
advertising on the platform) for multiple illustrative values of problem parameters (specifically, θ
= 0.3 and 0.1, and δ = 0.1 and 0.2). A useful insight from the Lemma and illustrated in Fig. 6 is
that an improvement in ad targeting, which can help reduce δ (consumer distaste for advertising),
increases γR(Q) (i.e., ∂γR(Q)
∂δ< 0). A reduction in δ is the platform’s core desire and responsibility,
and eliminates a “waste” from the ecosystem. It is notable that in order to optimally leverage the
gains from improving δ the platform should increase the share of ad revenue that goes to creators!
27

This creates a win-win-win situation with regard to investments needed to reduce δ.
Corollary 5 (Lemma 2). γR(Q) < γQ, and the gap between the two gets wider as b, λ, δ increase,and narrower as θ increases.
It is notable too that the optimal value of γ depends only on b, λ, δ which are exogenous parame-
ters in the model. Moreover, the platform’s other decision variable, the per-ad price p∗ also depends
only on these three parameters (besides γ). Consequently, the platform can set and announce its op-
erational policy once it has sufficiently accurate market research information regarding consumer
demand (δ) and advertising demand (b).
4.2 Differential Revenue-Sharing and Platform-creator Conflict
Lemma 2 identifies the revenue-sharing parameter that maximizes total content on the platform
and, respectively, total ad revenue. These two metrics are not only a measure of the vibrancy of
the overall platform ecosystem, maximizing them might well be in the interest of the platform
because generally it is understood that, in the long run, platforms do well when their ecosystem
partners do well. Although this perspective of maximizing R(Q) ignores the costs included in
the model, namely bλδA and c(Q), it is still meaningful because company leadership and analysts
pay attention not just to bottom-line profit but also to top-line revenues and total volume flowing
through the platform. Nevertheless, it is useful to examine how a platform would pick γ when
purely maximizing its short-term self-interest as stated in Eq. 11, i.e., (1−γ)R(Q)− bλδA− c(Q).
It is obvious that, due to these additional costs, and because the platform collects only a fraction
(1−γ) of ad revenues R(Q), the profit-maximizing value γ∗ would be less than γR(Q), with the
exact form and value depending on the form of c(Q) function and λ.
The fact that γ∗ < γR(Q), combined with the effects of γ on Q (i.e., ∂Q∂γ
) suggests that if the
platform were to pursue its short-term self-interest in choosing γ, this would lead to a reduction
in platform scale, including in Q, V and A. This disconnect is partly a result of the fact that
the model assumes—consistent with the practice of all dominant platforms that employ revenue-
28

sharing business models—a uniform non-discriminatory linear revenue-sharing scheme. That is,
a single per-unit commission parameter is defined (i.e., 1−γ, such as the 20%-30% rate that is
observed in many platforms), multiplied with the value or scale of each creator, and applied iden-
tically to all creators regardless of size or nature of business. In Congressional testimony on July
29, 2020 (in the so-called “Big Tech hearing” before the House Antitrust Subcommittee4), con-
tradicting charges that Apple offered powerful app developers a larger revenue share, Apple CEO
Tim Cook reemphasized the uniform revenue sharing policy, saying “it treats all apps the same.”
This non-discriminatory policy protects platforms from potential haggling with each creator, how-
ever it can cause conflict with a) large creators who feel that the rate is excessive given their
scale, b) creators for whom the platform’s enablement appears insubstantial (e.g., ClassPass and
Airbnb’s complaints in the “Big Tech hearing” against Apple’s 30% rate applied to virtual events)5,
and c) creators with low margins for whom a 30% revenue share can cripple their business.6
How might the platform avoid such conflict while still retaining the benefits of a simple, com-
pact and non-discriminatory policy? This dilemma is analogous to pricing problems involving het-
erogeneous participants or coordination problems with asymmetric information and/or misaligned
incentives. One common solution to mitigate the problem is to use coordination techniques such
as two-part tariffs. For instance, a firm that is facing efficiency loss because it sets a uniform
per-unit price to both light and heavy users of a product can avoid some of this loss by adding a
fixed access fee that applies to all users regardless of scale, and then lowering the per-unit price
charged for usage. In the case of our 3-sided platform that thrives on network effects and posi-
tive dependence, an access fee would have the detrimental effect of disadvantaging some creators
(with high cj’s, who produce low Qj), and increasing the power of the already dominant creators.
4https://www.cnbc.com/2020/07/29/apple-tried-to-lure-amazon-video-app-with-lower-15percent-fee-eddy-cue-email.html
5https://www.nytimes.com/2020/07/28/technology/apple-app-store-airbnb-classpass.html
6https://www.cnbc.com/2020/07/24/epic-games-ceo-tim-sweeney-apple-crippled-app-store-with-30percent-cut.html
29

Similarly, a typical two-part or two-block tariff—one that offers a higher revenue share γ+ once
Qj exceeds threshold—would also favor the most powerful creators. The platform could do the
reverse: reduce the rate to γ− after some threshold, but this would appear as a blatant attack against
creators with highest outputs. Alternately, the platform could turn a two-part tariff on its head and
convert the fixed access fee into a subsidy S. For example, it could offer all creators free use of
its development or production resources up to some scale q, while simultaneously increasing the
platform’s share of revenues (i.e., lowering γ) for the residual revenues. That is, creator j’s payoff
from supplyingQj output to the platform would change from γQjQR(Q) to S+(γ−∆γ)
Qj−qQR(Q).
Ultimately, the challenges caused by a single non-discriminatory rate may well cause platforms to
adopt full nonlinear pricing or, more likely, an efficient form of traditional nonlinear pricing such
as tiers of two-part or three-part tariffs (Bagh and Bhargava, 2013).
5 Conclusion
This paper presents a a general framework to model and analyze the economics of three-sided
platforms that mediate between consumers, creators and advertisers. These platforms attract con-
sumers on the strength of outputs from creators, thereby attracting advertisers who wish to reach
these consumers, and motivating creators with a revenue-sharing arrangement on ad payments. The
model particularly focuses on the interplay amongst numerous (possibly thousands of) creators and
between creators and the platform’s design parameters. Useful results are obtained about the plat-
form’s advertising strategy, creators’ content provision strategy and how the level of concentration
in the creator layer relates the creator characteristics and platform design factors. I also discuss
how the platform’s decision on various design parameters affect the performance of this three-sided
platform ecosystem. This framework generates several useful results about the interaction between
a platform’s advertising-level strategy, revenue-sharing strategy, and various design elements that
affect incentives or performance of ecosystem participants. The framework provides a foundation
30

for analysis of a range of additional issues in such 3-sided platforms, including those related to
platform competition, market power, industry concentration, and anticompetitive practices.
The framework has several limitations that create opportunities for additional research. The
model implicitly assumes that higher scale automatically brings more diversity: e.g., that more
content and more creators attract more diverse viewers, which in turn brings in more advertisers;
to close the loop, more advertising revenue brings in more creators and attracts more viewers.
However, the model does not explicitly consider alternate genres of content, or whether scale can
have different effects on different genres, e.g., educational content or violent content. It would
be useful to examine if the framework can be extended and remain tractable if extended to cover
content type. Also, while the paper discusses the impact of providing standalone benefit or first-
party content, it would require more specificity and extensions to identify the optimal level of
investments on these factors. A related issue is that the paper assumes a fully economic-driven
rational creator who makes provision decisions solely on the basis of revenue share, whereas some
platform have many “free” creators who co-exist with a relatively smaller cadre of paid creators.
With regard to ad revenues, the exposition is laid out in a setting of pay-per-impression advertising.
Under certain conditions this is equivalent to a pay-per-click or pay-per-action advertising model
(Dewan et al., 2002), however it might be enriching to explicitly analyze alternative ad payment
models under broader conditions involving incomplete information or asymmetric risks, or when
intermediaries are involved to manage advertising (Dellarocas, 2012). Additional issues to con-
sider are the dynamics of revenue-sharing between the early vs. mature stages of the platform,
and multi-dimensional creators who produce multiple groups of content under a single strategic
decision maker.
31

A Appendix
A.1 Some Simple Numerical Examples
Example 2 (creator’s costs from uniform distribution). Suppose there are 9 creators in the ecosys-tem, with cost indices distributed uniformly in the interval [4, 6]. Also, suppose θ=1
2in A =
βQθe−bp, so that A = β√Qe−bp. Then, in equilibrium K=5, and the highest-cost creators are
unable to earn a profit from supplying content to the platform. The 5 lowest-cost creators haveoutput shares Qj
Q= {0.4, 0.3, 0.2, 0.1, 0} (the final one, 0, is included for completeness).
Example 3 (More homogeneous creators). Suppose there are 9 creators in the ecosystem, with costindices distributed uniformly in the interval [14, 16], and withA = β
√Qe−bp. Then, in equilibrium
K=8, and only the highest-cost creator is excluded. Total content level supplied is Q = The first 8creators’ output shares are Qj
Q= {0.235, 0.204, 0.172, 0.141, 0.109, 0.078, 0.046, 0.015}.
Example 4 (Costs from right-skewed distribution). Suppose there are 9 creators in the ecosystem,with cost indices (3,4,5,7,9,12,15,19,24), and A = β
√Qe−bp. Then, in equilibriumK=2, and only
the two lowest-cost creators can profitably supply content, with output shares QjQ
= {57, 2
7}.
A.2 Technical Details and Proofs
Proof of Lemma 1. Starting with Π(p;Q) = ((1−γ)p− λδ) e−bpβ(Q) − c(Q), compute the
optimality condition ∂Π∂p
= 0. This yields e−bpβ(Q) ((1−γ)− b(1−γ)p− λδ)) = 0, leading to
the result p∗(Q)=1b+ λδ
1−γ , and the corresponding A∗(Q)=β(Q)e−bp∗ , which holds when A∗(Q) is
below the threshold A(Q), i.e., α(Q) ≥ (n+δ)e−1− bλδ1−γ β(Q). When this fails to hold then the
equilibrium is a saturation advertising level with[A=α(Q)
n+δ, p=1
bloge
(β(Q)(n+δ)α(Q)
)]. The boundary
solution A∗ = 0 is avoided because the negative exponential advertising demand function implies
non-zero density at arbitrarily high p. Alternately, if the platform were to auction off the ads, then
the expected per-ad price p discovered in a second-price auction when A ads are shown in a unit
time interval is the Ath order statistic arising from the density function f(u), i.e., the value p such
that A =∫∞pf(u)du. Maximizing p · A using this relationship yields the equilibrium result.
Proof of Proposition 1. Using Eq. 3 compute the simultaneous set of first-order optimalityconditions for the platform’s creators, ∂πj
∂Qj(Qj, Q−j) = 0. This yields the set of j simultaneous
32

equations,
∀j : cj =γp∗e−bp
∗
Q
[β(Q)−Qj
(β(Q)
Q−β′(Q)
)](14a)
Qj =1
β(Q)Q−β′(Q)
(β(Q)− cjQ
γp∗e−bp∗
)=
β(Q)β(Q)Q−β′(Q)︸ ︷︷ ︸
≥0, Assumption 2
(1− cjQ
γR(Q)
)︸ ︷︷ ︸≥0, IR constraint
(14b)
Since R(Q) = β(Q)e−bp, the ratio β(Q)β(Q)Q−β′(Q)
equals the ratio R(Q)R(Q)Q−R′(Q)
. Note that the IR require-
ment cj ≤ γR(Q)Q
is an implicit statement because the Qj equations above are valid only for those
creators that satisfy the IR constraint given the Q−j choices of all other creators who are “feasible”
in this way. AndQmust be computed by aggregating across only those creators that earn a positive
payoff. Denote the number of such feasible creators asK, so that (since the cj’s are arranging from
lowest to highest cost), the set of feasible creators is {1, ..., K}. Further, let CK denote c1+...+cKK
,
the average cost parameter across these creators. With that in mind, adding up all the equations
represented by Eq. 14b across all feasible creators, we get the result.
Proof of Corollary 1. We employ the chain rule ∂Q∂γ
= ∂Q1−θ
∂γ/∂Q
1−θ
∂Q, and note that, at optimal
per-ad price, ∂p∂γ
= λδ(1−γ)2
and 1−bpp
= −λδ(1−γ)(1−γ)+bλδ
, valid when p is bounded, i.e., b > 0, γ < 1.
Writing Q from Eq. 4b as Q =(γZpe−bp
) 11−θ , where Z = β(K−(1−θ))
KCK,
∂Q1−θ
∂γ= Zpe−bp
(1 +
γ
p
∂p
∂γ(1− bp)
)= Zγpe−bp︸ ︷︷ ︸
Q1−θ
[1
γ+
(1−bpp
)∂p
∂γ
](15a)
∂Q
∂γ=∂Q1−θ
∂γ
(∂Q1−θ
∂Q
)−1
=Q
1−θ
[1
γ+
(1−bpp
)∂p
∂γ
](15b)
=Q
1−θ
[1
γ−(
1
(1−γ) + bλδ
)(bλδ
1−γ
)2]
(15c)
Trivially, the above expression is positive at γ=0, negative at γ=1, and the second derivative
∂2Q∂γ∂γ
< 0, implying that the first derivative is monotonically decreasing, positive until some thresh-
old γ and then negative.
33

Proof of Proposition 2. For convenience, write Z = βp∗e−bp∗ . Solving the simulta-
neous decisions game yields the series of first-order optimality conditions of the form Qj =Q
1−θ
(1− cjQ
1−θ
γZ
), valid for all creators j that get non-negative profit in equilibrium, i.e., cj ≤
γQ
(QθZ
). Aggregating these over the feasible creators yields
Q =Q
1−θK
(1− CKQ
1−θ
γZ
)(16a)
≡(
1−θK
)=
(1− CKQ
1−θ
γZ
)(16b)
≡ Q =
[γZ (K − (1−θ))
KCK
] 11−θ
(16c)
≡ Q1−θ =(K−(1−θ))γZ
KCK. (16d)
Now, the IR constraints are of the form cj ≤ γZQ1−θ . Plugging in Q1−θ from above yields the
requirements cj ≤ KCK(K−(1−θ) . Because the cj’s are arranged in increasing order, it is sufficient that
this equation be satisfied for creator K, yielding the result.
The condition for an interior advertising solution is A ≤ α(Q)n+δ
, i.e., βQθe−bp∗ ≤ α(Q)
n+δ. If
this holds for all Q, then an interior solution is guaranteed. If not, i.e., fails at low values of Q
but holds at higher values (this is the only possibility because α(Q) grows at a faster rate than
β(Q)) then it must be verified at Q given in Eq. 8. Using the first form of Q and rewriting it
as(γp∗A∗
QθK−(1−θ)
CKK
) 11−θ
yields the reduction Q = (γp∗A)(K−(1−θ)
CKK
). Combining this with the
requirement A ≤ α(Q)n+δ
, and plugging in for p∗, yields the Eq. 10 condition for the interior solution.
When this condition is not satisfied, then for given Q, the optimal advertising level is A = α(Q)n+δ
which is less than A∗(Q) given in Eq. 2, and the ad revenue p ·A available for sharing with creators
is also lower than p∗ · A∗. Due to this, creators’ outputs are also lower, leading to a content level
Q < Q, due to which the platform attracts fewer viewers, further lowering the maximum level of
advertising it can support.
Proof of Corollary 3. ∂K∂θ≤ 0 follows from Eq. 7 because the RHS term (on the right of the
≤ sign) gets smaller as θ increases. For ∂Qj/Q
∂θ, rewrite Eq. 9 as Qj
Q= 1
1−θ −cjCk
(1
1−θ−1). The
34

derivative with θ is 1(1−θ)2
(1− cj
Ck
), proving the result. ∂Q
∂θ> 0 follows trivially from Eq. 8.
Proof of Lemma 2. To identify the value of γ that maximizes Q, set the first-order optimality
condition ∂Q∂γ
= 0 from Eq. 15. Rearranging terms, and solving (and ruling out Q=0) we see that
the Q-maximizing value of γ is
γQ = Sol.[(1−γ)3 + (bλδ)(1−γ)2 + (bλδ)2(1−γ)− (bλδ)2 = 0
](17)
where the computations are valid as long as θ > 0, p is bounded (i.e., b > 0 and γ < 1 which
works so long as b > 0, λ > 0, δ > 0). The first 3 terms in the cubic equation are positive, while
the last term is negative, with a single change in sign. Therefore, using Descartes’ rule of sign for
polynomial functions, both equations yield a unique optimal value of γ in the feasible range (0,1).
Hence the cubic equation yields a unique feasible value γQ.
Now consider the value of γ which maximizes total ad revenue across the platform and creators,
with R(Q) = βQθp∗e−bp∗ . The analysis proceeds in a similar way.
∂R(Q)
∂γ= R(Q)
[∂p
∂γ
(1− bpp
)+θ
Q
∂Q
∂γ
]= 0 (18a)
≡ R(Q)
{∂p
∂γ
(1− bpp
)+
θ
1−θ
[1
γ+∂p
∂γ
(1− bpp
)]}= 0 (from Eq. 15) (18b)
≡ R(Q)
[∂p
∂γ
(1− bpp
)(1
1−θ
)+
θ
γ(1−θ)
]= 0 (18c)
θ
γ−(bλδ
1−γ
)21
(1−γ) + bλδ= 0 (using Eq. 12) (18d)
again yielding a cubic equation in γ,
θ(1−γ)3 + (bλδθ)(1−γ)2 + (1−γ)(bλδ)2 − (bλδ)2 = 0. (19)
which has a single change of sign, thus assuring a single feasible optimal value γR(Q).
35

Figure 7: How Eq. 13b as a function of γ changes with an increase in θ (left panel) and b, λ, δ(right panel).
Proof of Corollary 4. First, to see the effect of changes in θ, write the last two terms in Eq. 13b
(i.e., (bλδ)2
θ(1−γ) − (bλδ)2
θ) as −γ (bλδ)2
θ. These are the only two terms involving θ, and trivially,
increasing in θ. Now consider how Eq. 13b yields γR(Q). Note that at γ=0 the equation evaluates
to 1+bλδ > 0, and at γ=1 it is − (bλδ)2
θ, and has a higher value as θ increases (see left panel
of Fig. 7). Hence, the point at which it cuts the horizontal axis (i.e., the optimal value of γ) is
increasing in θ.
Next, consider the effect of b, λ, δ. Because these are all positive and all occur together in
multiplicative form in Eq. 13b, the optimal value γR(Q) varies identically across all three. Consider,
for illustration, a change in b. The expression in Eq. 13b evaluates to 1+bλδ > 0 at γ=0 and
increases with b. At γ=1 the expression is − (bλδ)2
θand therefore reduces as b increases (see right
panel of Fig. 7), therefore the intersection with horizontal axis reduces because the equation’s joint
derivative with γ and b is positive.
Proof of Corollary 5. As in the proof for Corollary 4, consider the behavior of Eq. 13b against
γ. The solution γQ is identical to γR(Q) for θ=1. For lower values of θ, γQ remains the same
while γR(Q) falls, hence widening the gap between the two (or, conversely, getting narrower as θ
increases).
36

References
Amaldoss, Wilfred, J Du, and W Shin (2020). “Media Platform’s Content Provision Strategy and
Source of Profits”. In: Marketing Science (forthcoming).
Bagh, Adib and Hemant K. Bhargava (Jan. 2013). “How to Price Discriminate when Tariff Size
Matters”. In: Marketing Science, pp. 111–126.
Bhargava, Hemant K. (Feb. 2020). “Bundling for Flexibility and Variety: An Economic Model for
Multiproducer Value Aggregation”. In: Management Science (accepted, forthcoming).
Calvano, Emilio and Michele Polo (Jan. 2020). “Strategic Differentiation by Business Models:
Free-To-Air and Pay-TV”. In: Econ J 130.625, pp. 50–64.
Dellarocas, Chrysanthos (June 2012). “Double Marginalization in Performance-Based Advertis-
ing: Implications and Solutions”. In: Management Science 58.6, pp. 1178–1195.
Dewan, R, M Freimer, and Jie Zhang (Jan. 2002). “Managing Web sites for profitability: balancing
content and advertising”. In: Proceedings of the 35th Annual Hawaii International Conference
on System Sciences. ieeexplore.ieee.org, pp. 2340–2347.
Evans, David S (2008). “The economics of the online advertising industry”. In: Review of Network
Economics 7.3.
Godes, David, Elie Ofek, and Miklos Sarvary (Jan. 2009). “Content vs. Advertising: The Impact
of Competition on Media Firm Strategy”. In: Marketing Science 28.1, pp. 20–35.
Gupta, Sunil (2009). “Customer-based valuation”. In: Journal of Interactive Marketing 23.2, pp. 169–
178.
Gupta, Sunil and Carl F Mela (2008). “What is a free customer worth? Armchair calculations of
nonpaying customers’ value can lead to flawed strategies.” In: Harvard Business Review 86.11,
pp. 102–9.
37

Jiang, Baojun, Lin Tian, and Bo Zhou (Dec. 2019). “Competition of Content Acquisition and Dis-
tribution Under Consumer Multipurchase”. In: Journal of marketing research 56.6, pp. 1066–
1084.
Kumar, Subodha, Yinliang (ricky) Tan, and Lai Wei (June 2020). “When to Play Your Advertise-
ment? Optimal Insertion Policy of Behavioral Advertisement”. In: Information Systems Re-
search 31.2, pp. 589–606.
Liu, Yuewen and Juan Feng (May 2020). “The Impact of Monetary Incentives on User-Generated
Content Contributions”. In: Information Systems Research (forthcoming).
McIntyre, David P and Arati Srinivasan (Jan. 2017). “Networks, platforms, and strategy: Emerging
views and next steps”. In: Strat. Mgmt. J. 38.1, pp. 141–160.
Oh, Jungsuk, Byungwan Koh, and Srinivasan Raghunathan (Sept. 2015). “Value appropriation
between the platform provider and app developers in mobile platform mediated networks”. In:
Journal of Information Technology Impact 30.3, pp. 245–259.
Parker, Geoffrey G., Marshall W. Van Alstyne, and Sangeet Paul Choudary (2016). Platform Revo-
lution: How Networked Markets Are Transforming the Economy–And How to Make Them Work
for You. 1st. W. W. Norton & Company. ISBN: 0393249131, 9780393249132.
Peitz, Martin and Tommaso M Valletti (July 2008). “Content and advertising in the media: Pay-tv
versus free-to-air”. In: International Journal of Industrial Organization 26.4, pp. 949–965.
Shiller, Benjamin and Joel Waldfogel (2013). The challenge of revenue sharing with bundled pric-
ing: an application to music.
Sridhar, Shrihari, Murali K Mantrala, Prasad A Naik, and Esther Thorson (Dec. 2011). “Dynamic
Marketing Budgeting for Platform Firms: Theory, Evidence, and Application”. In: Journal of
Marketing Research 48.6, pp. 929–943.
Tang, Qian, Bin Gu, and Andrew B Whinston (Oct. 2012). “Content Contribution for Revenue
Sharing and Reputation in Social Media: A Dynamic Structural Model”. In: Journal of Man-
agement Information Systems 29.2, pp. 41–76.
38

Westcott, Kevin (2020). 2020 Media and Entertainment Industry Outlook. Tech. rep. URL: https:
//www2.deloitte.com/us/en/pages/technology-media-and-telecommunications/
articles/media-and-entertainment-industry-outlook-trends.html.
Zhu, Feng and Qihong Liu (2018). “Competing with complementors: An empirical look at Ama-
zon.com”. In: Strategic Management Journal 39.10, pp. 2618–2642. DOI: 10.1002/smj.
2932. eprint: https://onlinelibrary.wiley.com/doi/pdf/10.1002/smj.
2932. URL: https://onlinelibrary.wiley.com/doi/abs/10.1002/smj.
2932.
39