

Ecosystem Ecology the movement of materials and energy through an ecosystem Section 22-1 Pages...
24
Ecosystem Ecology Ecosystem Ecology the movement of materials and energy through an ecosystem Section 22-1 Pages 415-419
-
Upload
monica-boyd -
Category
Documents
-
view
217 -
download
3
Transcript of Ecosystem Ecology the movement of materials and energy through an ecosystem Section 22-1 Pages...

Ecosystem EcologyEcosystem Ecology
the movement of materials and energy through an ecosystem
Section 22-1
Pages 415-419

Producers
• Manufacture their own food
• Capture energy and use it to make organic molecules
• There are two types:– Photosynthetic = use energy from light– Chemosynthetic = use energy from inorganic
chemicals
• Examples = plants, protists, and bacteria

Gross Primary Productivity
- is the rate at which producers in an ecosystem capture energy

Biomass
- is the organic material in an ecosystem
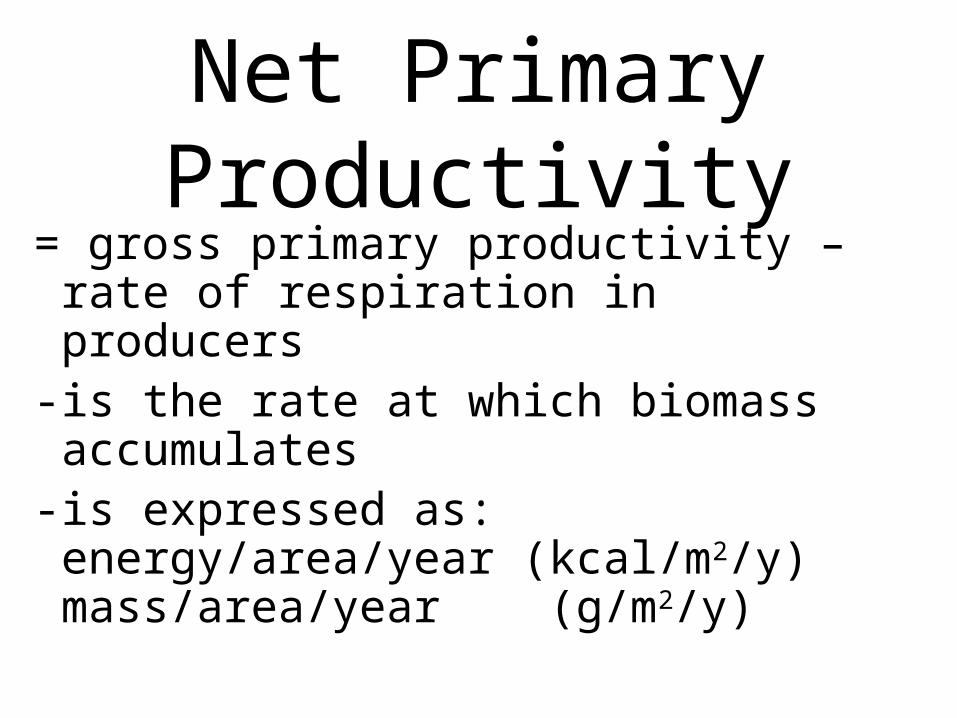
Net Primary Productivity
= gross primary productivity – rate of respiration in producers
- is the rate at which biomass accumulates
- is expressed as: energy/area/year (kcal/m2/y) mass/area/year (g/m2/y)

Prim
ary
Pro
duct
ivity
of
Diff
eren
t Eco
syst
ems

Consumers• obtain energy by ingesting or consuming
organic molecules made by other organisms• grouped according to the food they eat
– Herbivores = eat producers– Carnivores = eat consumers– Omnivores = eat both producers and
consumers– Detritivores = eat garbage– Decomposers = break down dead tissues
and waste into smaller molecules

Movement of Stuff Through Ecosystems

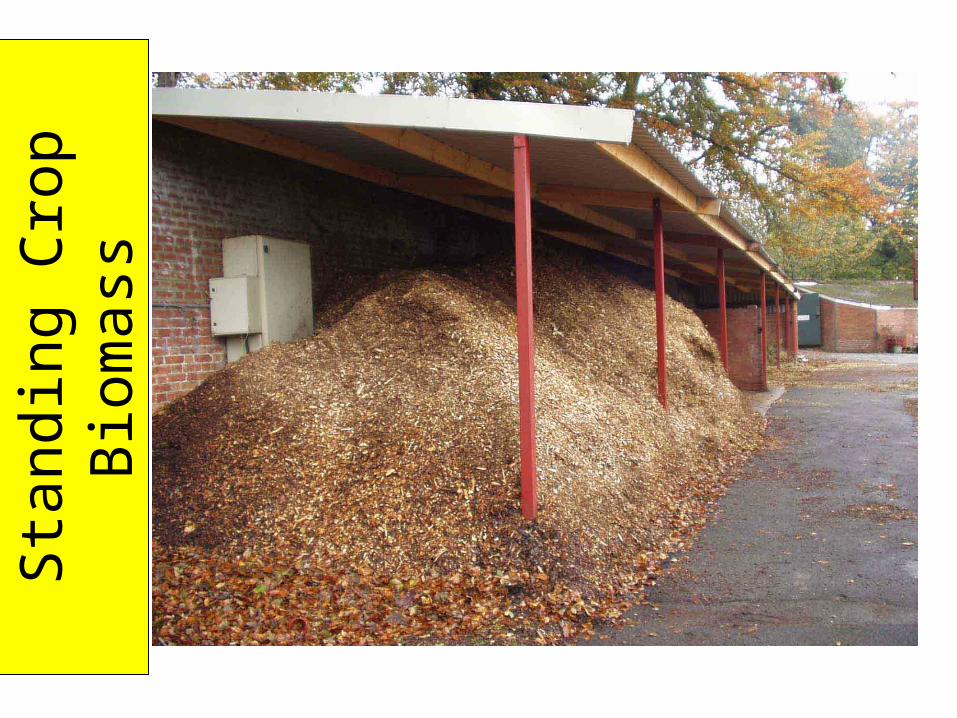
Trophic Levels• an organism’s position in the
sequence of energy transfers• most ecosystems contain only
three or four trophic levelsProducers = 1st levelHerbivores = 2nd level
Carnivores = 3rd level +
Food Chain
• a pathway of feeding relationships
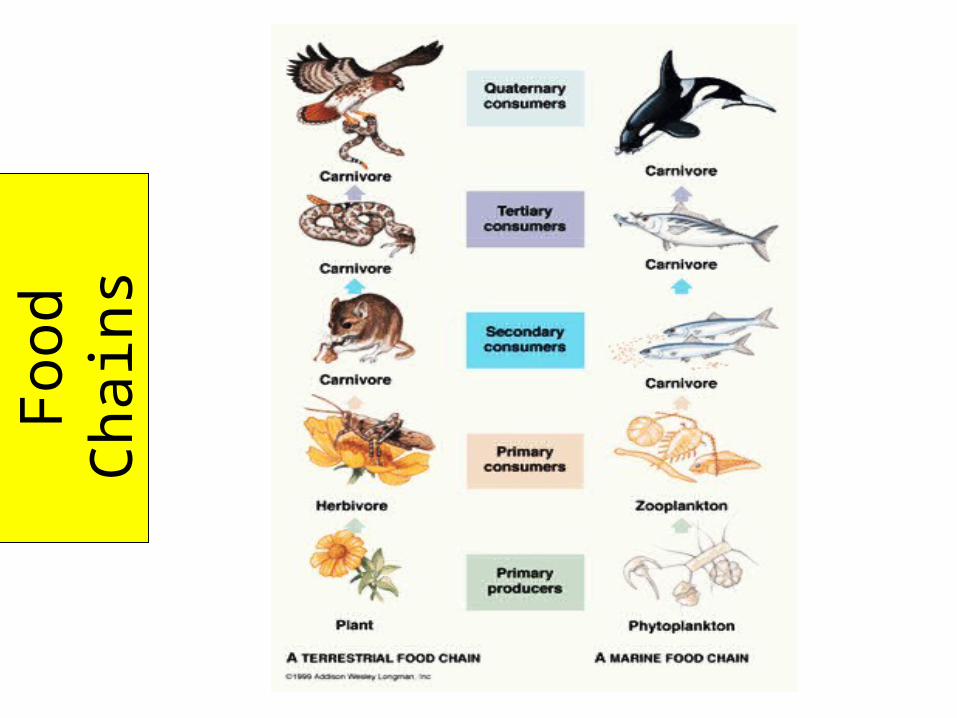
Foo
d C
hain
s
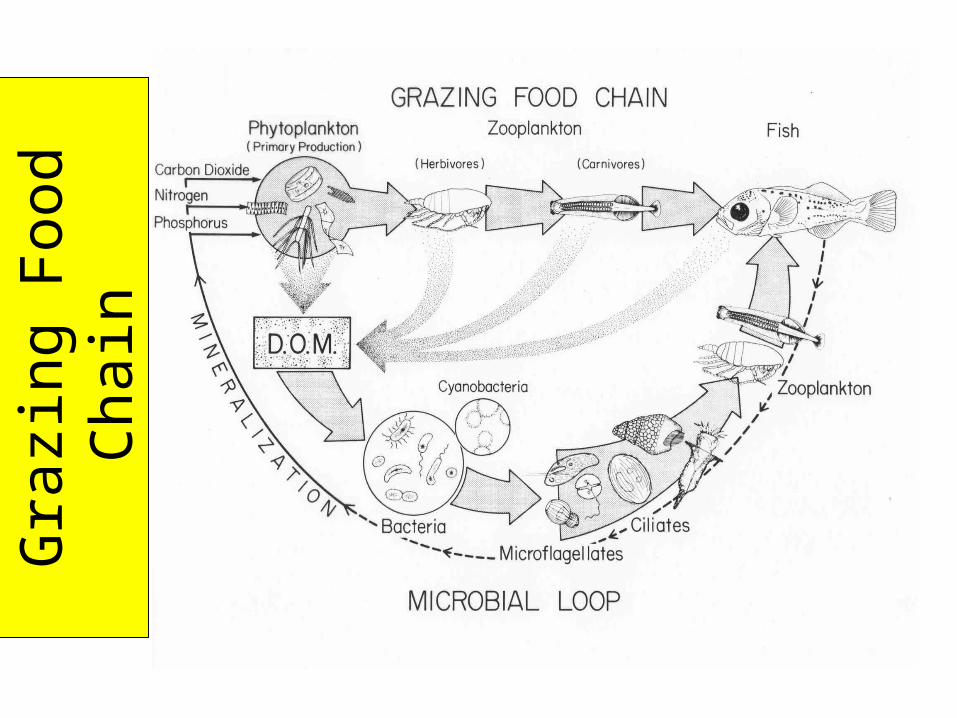
Gra
zing
Foo
d C
hain

Foo
d W
eb

Energy Movement & Nutrient Cycling

Pyr
amid
of N
et P
rodu
ctio
n

Why is energy transfer so low?
• Energy is reflected.
• Energy is lost when some parts cannot be digested.
• Energy is lost as waste.
• Energy is lost in cellular respiration.
• Energy is lost as heat.
• Organisms die without being eaten.

Eco
logi
cal E
ffici
ency
100 * 3,368 / 20,810 = 17%
100 * 67 / 1478 = 4.5%
100 * 6 / 67 = 9%

Pyramid Shape• A diagram of trophic level
relationships• Width of bar correlates with the
number • Three primary types of diagrams
–Energy–Biomass–Population numbers

Pyr
amid
of N
umbe
rs

Eco
logi
cal B
iom
agni
ficat
ion