Economy watch (March 2018) in January due to a fall in food and fuel based inflation. 5. WPI-based...
34
Economy Watch Monitoring India’s macro-fiscal performance March 2018
Transcript of Economy watch (March 2018) in January due to a fall in food and fuel based inflation. 5. WPI-based...

Economy Watch Monitoring India’s macro-fiscal performance
March 2018

Contents
Foreword ____________________________________________________________________________________________ 3
1. Growth: Real GDP growth increased to 7.2% in 3QFY18 ____________________________________________ 4 2. Inflation: CPI inflation eased to a four-month low of 4.4% from 5.1% in January _______________________ 6 3. Fiscal performance: Fiscal deficit was at 114% of the annual revised target during April-January FY18 __ 7 4. India in a comparative perspective: Status and prospects __________________________________________ 9 5. In focus: On the health of India’s health sector ___________________________________________________ 12 6. Money and finance: Credit growth remained close to 10% in January 2018 __________________________ 17 7. Trade and CAB: CAD rose to 2% in 3QFY18 even as exports growth eased further to 4.5% in February _ 19 8. Global growth: UN estimates a strengthening of global growth driven by an investment recovery ______ 20 9. Index of macro imbalance (IMI): Macro balance deteriorated in 3QFY18 _____________________________ 22 10. Index of aggregate demand (IAD): Aggregate demand weakened in January 2018 ___________________ 22 11. Special feature: Expansionary potential of the Center’s FY19 Budget — Sectoral impact ______________ 23 12. Capturing macro-fiscal trends: Data appendix ____________________________________________________ 28
Prepared by Macro-fiscal Unit, Policy Advisory Group, EY India D. K. Srivastava, Chief Policy Advisor, EY: [email protected] Muralikrishna Bhardwaj, Manager, EY: [email protected] Tarrung Kapur, Manager, EY: [email protected] Ragini Trehan, Senior Consultant, EY: [email protected]

Economy Watch: March 2018 2
Highlights 1. The Second Advance Estimates of National Income
indicate a further strengthening of GDP growth in 3QFY18 led by sustained pick-up in investment and government spending.
2. The World Bank projects India’s growth at 6.7% in 2017-18 and expects it to accelerate to 7.3% in 2018-19 and 7.5% in 2019-20.
3. By posting above 7% growth for the third straight month, overall IIP growth pointed to a sustained growth momentum in the industrial sector.
4. Overall CPI inflation declined to 4.4% in February from
5.1% in January due to a fall in food and fuel based inflation.
5. WPI-based inflation declined to a seven-month low of
2.5% in February from 2.8% in January 2018 on account of easing of inflation in vegetables and fuel and power.
6. As per CGA data, gross central tax revenues grew by
17% during April-January FY18, while non-tax revenues contracted sharply by (-) 36% during this period.
7. Fiscal deficit during April-January FY18 stood at
113.7% of the annual revised estimate, while the revenue deficit was at 109.4% of the annual revised estimate.
8. Credit by scheduled commercial banks grew by 10.2%
(y-o-y) in January 2018. Non-food credit growth also remained close to 10% in January 2018.
9. Growth in merchandise exports fell to a four-month low
of 4.5% in February 2018 from 9.1% in January — the third successive month of decline from a six-year high of 30.5% in November 2017.
10. CAB as a percentage of GDP reached (-) 2.0% in
3QFY18 from (-) 1.2% in 2QFY18.

Economy Watch: March 2018 3
Foreword Growth prospects brighten but declining export growth casts a shadow
As per the Second Advance Estimates, a robust growth recovery seems on its way with the 3QFY18 GDP growth estimated at a 7.2%. It is heartening that private investment has shown sustained recovery, with the growth rate of gross fixed capital formation at 12% in this quarter. Other complementary growth signals also appear positive, with IIP showing a healthy growth rate while the global crude prices appear to be moderating. Credit growth has also remained close to 10%. Inflation rates, both CPI- and WPI-based, have moderated. With the core CPI- and WPI-based inflation rates remaining high and the global interest rates firming up, the possibility of an interest rate increase in India in the near future may not be ruled out.
Only the trade data is somewhat of a dampener in this brightening narrative. Recent trade data shows a slowing down of India’s export growth. A high positive export growth is considered essential for sustaining a high level of overall growth. A study of India’s growth profile indicates, however, that the contribution of “net exports” to growth has been negative even when export growth was relatively higher since in these years import growth was also higher. But high levels of export sector activities also uplift domestic production activities and employment. Thus, we may have to pay attention to the adverse effects of the recent wave of increased protectionism in the world led by the US, which may eventually slow down growth of world trade.
While the US trade with China is at the forefront, trade with India has also come on the US radar. The US President in his Annual Trade Report to the Congress on 28 February 2018 said the US would use “all available tools” to prevent China’s state-driven economic model from undermining global competition. The US President on 8 March signed an order to impose special tariffs of 25% on imports of foreign steel and 10% on import of aluminum into the US. Other major import items from China are aluminum foils, on which a tariff of 106% has been imposed. These tariff impositions are the product of a sweeping investigation initiated under Section 232 of the Trade Expansion Act of 1962 to determine whether Chinese and other countries’ imports threaten US national security.
India is also on the receiving end. Recently, India’s tariff levy on the high-end Harley Davidson motorcycles was in the news. More seriously, the US has challenged a number of India’s export subsidies. It has filed a complaint at the WTO to this effect relating to the Export Oriented Units Scheme and sector-specific schemes, including the Electronics Hardware Technology Parks Scheme, special economic zones, Export Promotion Capital Goods Scheme and a duty-free imports for exporters program. It is being argued that these export subsidy programs harm the American workers by creating an uneven playing field for them. India’s exemption under the WTO’s special and differential provisions for developing countries expired in 2015. India introduced the Merchandise Exports from India Scheme in 2015, which has rapidly expanded to include more than 8,000 eligible products, nearly double the number of products covered at its inception.
The US Fed rate was increased by 25 basis points in its Monetary Policy Review on 21 March 2018. In the Fed’s assessment, the US growth outlook is positive with an expected real growth of 2.4% in 2019 and 2% in 2020. Inflation is projected to be 1.9% in 2018, 2% in 2019 and 2.1% in 2020. With inflation inching up to the target of 2%, the possibility of incrementally increasing the federal funds rate in the remaining part of 2018 and 2019 seems positive.
In the context of the domestic economy, we take note of the fact that as per recent RBI data, currency in circulation has reached its pre-demonetization levels. However, the currency-to-GDP ratio, which had dipped to 8.8% by the end of FY17, is still lower at 10.7% as compared to the pre-demonetization level of 12.1%.
D.K. Srivastava Chief Policy Advisor, EY India
Home

Economy Watch: March 2018 4
► As per the Second Advance Estimates of National Income, real GDP growth for FY18 has been marginally revised upward to 6.6% (6.5% as per earlier estimates) as compared to 7.1% in FY17. Growth strengthened further to 7.2% in 3QFY18 from 6.5% in 2QFY18.
► On the demand side, growth in gross fixed capital formation (GFCF) accelerated to 12.0%, a 12-quarter high, and that in government consumption expenditure (GCE) increased to 6.1% in 3QFY18 (Table 1). However, private consumption expenditure (PFCE), with a share of nearly 56% in overall GDP, grew by 5.6% in 3QFY18, its slowest pace since 2QFY16. From a recent peak of 9.3% in 3QFY17, growth in PFCE has been falling in each successive quarter.
► Export growth fell to a five-quarter low of 2.5%, while import growth increased to 8.7%, leading to a negative contribution of net exports in overall growth to the magnitude of (-)1.4 percentage points during 3QFY18.
► Even though the implied estimates point to a sharp deceleration in the growth of PFCE in 4QFY18, the overall GDP growth momentum is expected to be sustained by continued acceleration in the growth of GFCF and GCE during 4QFY18.
► On the output side, despite a subdued start in 1QFY18, GVA growth, which in 2QFY18 reversed its falling trend, gained further momentum and improved to 6.7% in 3QFY18. It is estimated to increase further and reach 7.5% in 4QFY18.
► Growth in the output of the manufacturing sector increased to 8.1% while that in construction improved sharply to 6.8% in 3QFY18 as compared to the growth seen in 2QFY18 (Table 2).
► Similarly, among services, growth in financial services and public administration and defense services increased to 6.7% and 7.2% respectively in 3QFY18.
Growth in the output of the agricultural sector, having remained subdued during the first two quarters, increased to 4.1% in 3QFY18. This may provide much-needed support to the rural sector while reducing some pressure on CPI inflation.
1. Growth: Real GDP growth increased to 7.2% in 3QFY18
A. GDP growth: Real GDP growth showed sustained recovery in 3QFY18
The Second Advance Estimates of National Income released by the CSO indicate a further strengthening of GDP growth in 3QFY18 led by a sustained pick-up in investment and government spending.
Table 1: Real GDP growth (%) Aggregate demand (AD) component
FY16 FY17 FY18* 1Q FY17
2Q FY17
3Q FY17
4Q FY17
1Q FY18
2Q FY18
3Q FY18
4Q FY18**
PFCE 7.4 7.3 6.1 8.3 7.5 9.3 7.3 6.6 6.6 5.6 1.7 GCE 6.8 12.2 10.9 8.3 8.2 12.3 31.9 17.1 2.9 6.1 12.1 GFCF 5.2 10.1 7.6 15.9 10.5 8.7 -2.1 1.6 6.9 12.0 16.9 EXP -5.6 5.0 4.4 3.6 2.4 6.7 10.3 5.9 6.5 2.5 -0.4
IMP -5.9 4.0 9.9 0.1 -0.4 10.1 11.9 16.0 5.4 8.7 4.8 GDP 8.2 7.1 6.6 8.1 7.6 6.8 6.1 5.7 6.5 7.2 7.1
Source (Basic Data): MOSPI., *Second Advance Estimates, ** Derived based on second annual advance estimates
Table 2: Sectorial real GVA growth (%)
Sector FY16 FY17 FY18* 1Q FY17
2Q FY17
3Q FY17
4Q FY17
1Q FY18
2Q FY18
3Q FY18
4Q
FY18**
Agr. 0.6 6.3 3.0 4.3 5.5 7.5 5.2 2.7 2.7 4.1 3.3 Ming. 13.8 13.0 3.0 10.5 9.1 12.1 6.4 1.8 7.1 -0.1 17.9 Mfg. 12.8 7.9 5.1 9.9 7.7 8.1 5.3 -1.8 6.9 8.1 9.6 Elec. 4.7 9.2 7.3 12.4 7.1 9.5 6.1 7.1 7.7 6.1 10.4 Cons. 3.7 1.3 4.3 3.0 3.8 2.8 -3.7 1.5 2.8 6.8 4.5 Trans. 10.3 7.2 8.3 8.9 7.2 7.5 6.5 8.4 9.3 9.0 6.0 Fin. 10.9 6.0 7.2 10.5 8.3 2.8 2.2 8.9 6.4 6.7 5.2 Publ. 6.1 10.7 10.1 7.7 8.0 10.6 17.0 13.2 5.6 7.2 13.7 GVA 8.1 7.1 6.4 8.3 7.2 6.9 5.6 5.6 6.2 6.7 7.5
Source (Basic Data): MOSPI., *Second Advance Estimates, ** Derived based on second annual advance estimates
Home

Economy Watch: March 2018 5
B. Industry growth: Overall IIP and core IIP growth strengthened in January 2018
► Growth in IIP increased to 7.5% in January 2018 from 7.1% (y-o-y) in December 2017 (Chart 1) driven by higher growth in both manufacturing and electricity output.
► The manufacturing sector output (accounting for 77.6% of overall IIP) grew by 8.7% in January 2018 increasing from 8.5% in December 2017. Growth in the output of electricity accelerated to 7.6% in January 2018 from 4.4% in December 2017.
► Growth in the output of the capital goods industry (a proxy for investment demand) marginally increased to 14.6% in January 2018 from 14.4% (revised) in December 2017. Growth in consumer non-durables slowed to 10.5% in January 2018 from 16.6% in December 2017, while that in consumer durables increased to 8.0% as compared to 1.5% in December 2017. Growth in the infrastructure/construction sector increased marginally to 6.8% in January 2018 from 6.6% in December 2017.
► Growth in the output of eight core infrastructure industries increased to 6.7% (y-o-y) in January 2018 from 4.2% in December 2017. This was led by higher growth in the output of cement (20.7%), petroleum refinery products (11.0%), electricity (8.2%), steel (3.7%) and coal (3.0%).
Chart 1: IIP growth (% y-o-y)
Source: Office of the Economic Adviser, Ministry of Commerce and Industry.
Chart 2: IHS Markit PMI
Source: IHS Markit PMI, Markit Economics.
C. PMI: Signaled slower expansion in manufacturing and a contraction in services
Manufacturing PMI fell marginally to 52.1 in February 2018 from 52.4 in January 2018. Although it continued to expand for the seventh consecutive month, it remained lower than the recent peak in December 2017. On the other hand, services PMI contracted sharply during the month.
► In February 2018, headline manufacturing PMI (sa) remained above the threshold of 50 for the seventh consecutive month. However, it fell to 52.1 in February from 52.4 in January 2018 (Chart 2). Output and new orders increased but at a slower pace during the month.
► Headline services PMI (sa) fell from 51.7 in January 2017 to 47.8 in February, its lowest level since August 2017. New orders and output declined for the first time since November 2017, with rates of contraction the fastest since August 2017.
► Composite PMI Output Index (sa) fell from 52.5 in January 2018 to 49.7 in February 2018, as the fall in service sector activity outweighed an upturn in manufacturing production.
-2
1
4
7
10
Jan-
16
Mar
-16
May
-16
Jul-1
6
Sep-
16
Nov
-16
Jan-
17
Mar
-17
May
-17
Jul-1
7
Sep-
17
Nov
-17
Jan-
18
IIP (overall) IIP (core)
44
46
48
50
52
54
56
PMI (mfg.) PMI (ser.) Benchmark
By posting above 7% growth for the third straight month, overall IIP growth pointed toward a sustained growth momentum in the output of the industrial sector.
Home

Economy Watch: March 2018 6
► Growth in vegetable prices declined to a four-month low of 17.6% from 27.0% in January, accounting for nearly 85% of the 0.7% point decline in overall CPI growth. It had earlier reached a four-year high of 29.1% (y-o-y) in December. The decline was led by inflation in tomatoes easing to an eight-month low of 14.1% (51.4% in January) and that in onions to 112.6% (153.3% in January) in February.
► As a result, the Consumer Food Price Index based inflation moderated to 3.3% from 4.7% in January 2017.
► Fuel and light-based inflation eased to 6.8% in February from 7.7% in January as inflation in LPG moderated to 15.8% from 19.7% in January. This was primarily due to base effect.
► Core CPI inflation (excluding food and fuel and light) remained high and stable at 5.0% in February, the same level seen in January, due to persistently high levels of housing-based inflation at 8.3% and an uptick in inflation in transportation and communication services to 2.4% from 2.0% in the previous month.
► Inflation in transportation was driven by an increase in the price of petrol used for vehicles and of bus and tram fare services.
Chart 3: Inflation (y-o-y; %)
Source: MOSPI.
WPI-based inflation declined to a seven-month low of 2.5% in February from 2.8% in January 2018 on account of easing of inflation in vegetables and fuel and power.
► Inflation in vegetables declined to an eight-month low of 15.3% in February from 40.8% in January led by a fall in inflation in onion and tomato prices. Inflation in tomatoes turned negative at (-) 13.3% after seven successive months of high positive growth ending at 31% in January 2018, partly due to base effect. Inflation in onions moderated considerably to 119.0% in February from 193.9% in January.
► As a result, inflation based on the newly constructed WPI Food Price Index declined for the fourth consecutive month to an eight-month low of 0.1% in February from 1.6% in January 2018.
► Fuel and power based inflation moderated further to a seven-month low of 3.8% in February from 4.1% in the previous month as inflation in coal, LPG and naptha eased considerably to 5.8%, 8.5% and 6.4% from 6.7%, 19.9% and 14.1% respectively in the previous month.
► WPI core inflation, however, increased to a 43-month high of 3.9% from 3.5% in January as inflation in the manufacture of basic metals reached 15.2% from 12.9% in January.
-4
-2
0
2
4
6
8
Feb-
16
Apr
-16
Jun-
16
Aug
-16
Oct
-16
Dec
-16
Feb-
17
Apr
-17
Jun-
17
Aug
-17
Oct
-17
Dec
-17
Feb-
18
New CPI inflation Core CPIWPI inflation Inflation target: upper endInflation target: lower end Core WPI
2. Inflation: CPI inflation eased to a four-month low of 4.4% from 5.1% in January
Overall CPI inflation declined to 4.4% in February from 5.1% in January due to a fall in food and fuel based inflation. Core inflation remained stable at an elevated level of 5.0%.
Although overall CPI inflation fell to 4.4%, core CPI continued to remain high at 5.0% due to persistence in housing and transportation-based inflation.
Home

Economy Watch: March 2018 7
► Gross central taxes grew by 17.0% during April-January FY18, slightly lower than 17.7% in the corresponding period of the previous year (Chart 4).
► However, gross central taxes up to January 2018 stood at 74.8% of the FY18 revised estimates as compared to the three-year average of 71.7% achieved up to January as a percentage of the annual actuals.
► Growth in direct taxes (comprising personal income tax and corporation tax) during April-January FY18 was higher at 18.4% as compared to 9.7% in the same period of FY17 (Chart 5).
► Among the direct taxes, growth in personal income tax during April–January FY18 was at 17.5% as compared to 19.7% in the corresponding period of the previous fiscal year. Corporation tax revenues grew sharply by 19% during this period as compared to just 3.2% in the corresponding period of FY17.
► Growth in indirect taxes (comprising union excise duties, service tax, customs duty, CGST, UTGST, Center’s share of IGST and GST compensation cess) was at 15.6% during April-January FY18, lower than the corresponding value of 24.5% in FY17.
► Cumulated tax collection on account of GST (CGST, Center’s share of IGST and GST compensation cess) up to January FY18 amounted to INR354,985 crore, which was 79.8% of the annual revised estimates.
► The Center’s non-tax revenues contracted by (-) 35.6% during April-January FY18 as compared to a contraction of (-) 4.6% in the same period of FY17. This was largely due to a fall in the Center’s dividends and profits.
► The Center’s non-tax revenues up to January 2018 stood at 52.7% of the FY18 revised estimates, which was lower than the budgeted target. This was lower than the three-year average of 77.1% achieved up to January as a percentage of the annual actuals.
► The revised estimate of total receipts from disinvestment for FY18 stood at INR100,000 crore, overachieving the budgeted target of INR72,500 crore. According to the Department of Disinvestment, disinvestment proceeds as on 8 March 2018 stood at INR92,744.6, which was close to 93% of the annual revised estimate.
3. Fiscal performance: Fiscal deficit was at 114% of the annual revised target during April-January FY18
A. Tax and non-tax revenues
As per CGA data, gross central tax revenues grew by 17% during April-January FY18, while non-tax revenues contracted sharply by (-) 36% during this period.
Chart 4: Growth in cumulated gross tax revenues up to January 2018
Chart 5: Growth in cumulated tax revenues up to January 2018
12.9 14.5
6.011.2 9.7
18.417.8
5.1 6.0
33.8
24.5
15.6
0
10
20
30
40
FY13 FY14 FY15 FY16 FY17 FY18Direct taxes Indirect taxes
Home
Source: Monthly Accounts, Controller General of Accounts, Government of India
Source: Monthly Accounts, Controller General of Accounts, Government of India Note: Direct taxes include personal income tax and corporation tax, and indirect taxes include union excise duties, service tax, customs duty and CGST, UTGST, IGST and GST compensation cess from July 2017 onward
14.9
10.0
6.2
21.317.7 17.0
0
5
10
15
20
25
FY13 FY14 FY15 FY16 FY17 FY18

Economy Watch: March 2018 8
B. Expenditures: Revenue and capital ► Total expenditure grew by 13.7% during April-January FY18 as compared to the corresponding value of 12.6% in FY17.
► Growth in revenue expenditure fell to 11.4% up to January 2018 from 15.2% in the same period of FY17 (Chart 6). Revenue expenditure up to January 2018 stood at 81% of the FY18 revised estimates, close to the three-year average of 81.9% achieved up to January as a percentage of the annual actuals.
► Growth in the Center’s capital expenditure was at 29.9% during April-January FY18 as compared to a contraction of (-) 2.7% in the corresponding period of FY17 (Chart 7). Capital expenditure up to January 2018 stood at 96.6% of the FY18 revised estimate (annual revised estimate was lower than the budgeted estimate) as compared to the three-year average of 78.6% achieved up to January as a percentage of the annual actuals.
► The Center’s total major subsidies (food, nutrient-based fertilizer, urea and petroleum subsidy) grew by 1.1% during April-January FY18. Total subsidies up to January 2018 stood at 90.9% of the FY18 annual budgeted target.
The Center’s total expenditure up to January 2018 stood at 83% of the FY18 (RE) (which was higher than the BE), close to the three-year average of 81.9% achieved up to January as a percentage of the annual actuals.
C. Fiscal imbalance ► Fiscal deficit during April-January FY18 stood at 113.7% of the annual revised estimate as compared to 105.6% in the
corresponding period of FY17 (Chart 8).
► The Center’s revenue deficit up to January 2018 stood at 109.4% of the annual revised estimate as compared to 130.2% during the corresponding period of FY17 (Chart 9).
The Center’s FY18 fiscal deficit estimate was revised upward to 3.5% of GDP. The fiscal deficit target of 3% of GDP as recommended by the FRBM Review Committee has been shifted to end-March 2021. The revenue deficit estimate was also revised upward from 1.6% to 2.6% of GDP.
Chart 8: Fiscal deficit up to January 2018 as a % of annual budgeted estimate for FY18
Chart 9: Revenue deficit up to January 2018 as a % of annual budgeted estimate for FY18
89.4101.6
110.899.5 105.6
113.7
0
20
40
60
80
100
120
FY13 FY14 FY15 FY16 FY17 FY18
90.0102.3
121.8101.3
130.2109.4
0
20
40
60
80
100
120
140
FY13 FY14 FY15 FY16 FY17 FY18
Chart 6: Growth in cumulated revenue expenditure up to January 2018 (%, y-o-y)
Chart 7: Growth in cumulated capital expenditure up to January 2018 (%, y-o-y)
11.012.2
8.5
2.7
15.2
11.4
02468
101214161820
FY13 FY14 FY15 FY16 FY17 FY18
29.4 29.6
-15.1
45.5
-2.7
29.9
-20
-10
0
10
20
30
40
50
FY13 FY14 FY15 FY16 FY17 FY18Source: Monthly Accounts, Controller General of Accounts, Government of India
Source: Monthly Accounts, Controller General of Accounts, Government of India
Home

Economy Watch: March 2018 9
GDP growth: India’s growth outlook is projected to be strong during 2018-19 ► As per the UN, global GDP growth is expected to strengthen from 2.4% in 2016 to 3% in 2017 and beyond. The recovery
in growth is projected to be led by developing economies, which as a group is forecasted to grow by 4.6% and 4.7% in 2018 and 2019 respectively.
► GDP growth in India is expected to be the highest among the major developed and developing economies in 2018 and 2019 respectively at 7.2% and 7.4%.
► China’s growth is estimated at 6.8% in 2017 but is expected to fall to 6.5% and 6.3% in 2018 and 2019 respectively as the impact of the policy stimulus witnessed in 2017 wanes.
► In selected developed economies, growth is projected to slow down during 2018 and 2019 relative to 2017.
Inflation: CPI-based inflation in India is projected to be the highest among BRICS countries excluding South Africa ► In developed economies, a recovery in GDP growth has been associated with an easing of deflationary pressures. CPI-
based inflation is expected to increase from 0.7% in 2016 to 1.5% in 2017 and further to 2.1% in 2019. ► In the US, inflation is projected to be closer to the central bank’s long-term target of 2% during 2018 and 2019,
contingent on the acceleration in wage growth. ► Considering developing economies as a group, CPI inflation is expected to ease during the period from 2017 to 2019. ► In India, after falling to 3.5% in 2017, inflation is expected to rise to 4.5% and 4.8% in 2017 and 2018 respectively, the
highest among BRICS countries excluding South Africa.
4. India in a comparative perspective: Status and prospects
Table 3: GDP growth (%)
Country 2016 2017 (e)
2018 (f)
2019 (f)
Developed economies of which 1.6 2.2 2.0 1.9
US 1.5 2.2 2.1 2.1 EU 1.9 2.2 2.1 1.9 Russia -0.2 1.8 1.9 1.9 Japan 1.0 1.7 1.2 1.0 UK 1.8 1.7 1.4 1.4 Developing economies of which 3.8 4.3 4.6 4.7
China 6.7 6.8 6.5 6.3 India* 7.1 6.7 7.2 7.4 Brazil -3.6 0.7 2.0 2.5 South Africa 0.3 0.6 1.8 2.1 World 2.4 3.0 3.0 3.0
Chart 10: GDP growth — selected countries
Table 4: CPI (annual % change)
Country 2016 2017 (e)
2018 (f)
2019 (f)
Developed economies of which 0.7 1.5 1.9 2.1
Russia 7.1 3.9 4.4 3.9 UK 0.7 2.8 2.7 2.9 US 1.3 1.7 2.1 2.1 EU 0.3 1.6 1.8 2.1 Japan -0.1 0.3 1.4 1.8 Developing economies of which 5.2 4.4 4.3 4.2
South Africa 6.6 5.6 5.7 4.9 India* 4.9 3.5 4.5 4.8 Brazil 8.7 3.4 3.7 4.1 China 2.0 1.5 2.5 2.8
Chart 11: CPI (annual % change) — selected countries
6.7
6.8
6.5 6.3
7.1
6.7
7.27.4
1.52.2 2.1
2.12.4
3.0 3.03.0
0
1
2
3
4
5
6
7
8
2016 2017 2018 2019
China India US World
2.0 1.5
2.5
2.8
4.9
3.5
4.54.8
1.31.7
2.1
2.1
-0.1 0.3
1.41.8
6.65.6 5.7
4.9
-1.0
0.0
1.0
2.0
3.0
4.0
5.0
6.0
7.0
2016 2017 2018 2019
China India USJapan South Africa
Source (Basic Data): UN World Economic Situation and Prospects 2018;*Data is based on fiscal year, (e) indicates an estimate and (f) indicates forecast.
Source (Basic Data): UN World Economic Situation and Prospects 2018;*Data is based on fiscal year, (e) indicates an estimate and (f) indicates forecast.
Home

Economy Watch: March 2018 10
State of global happiness: India ranked behind most nations in the World Happiness Index 2018 ► The World Happiness Report is a survey of the state of global happiness. The World Happiness Report 2018 has ranked
156 countries by their happiness levels based upon six key variables that have been found to support well-being, namely, income, healthy life expectancy, social support, freedom, trust and generosity.
► Finland has the highest rank with a happiness score of 7.63 (Table 5).
► India was ranked 133 among the 156 countries.
► The Report also analyzed the change in the level of happiness from 2008-10 to 2015-17. The happiness score has increased for Finland, Germany, Russia and China, with the strongest improvement witnessed in China.
► The level of happiness in the US, the UK, Japan, South Africa and India has fallen from 2008-2010 to 2015-2017.
Table 5: Ranking of happiness — selected countries Country Happiness score Change in happiness score Rank in 156 countries Finland 7.63 0.10 1 Germany 6.96 0.37 15 US 6.89 -0.31 18 UK 6.81 -0.16 19 Japan 6.42 -0.01 28 Brazil 5.91 -0.42 54 Russia 5.81 0.42 59 China 5.25 0.59 86 South Africa 4.72 -0.35 105 India 4.19 -0.70 133
Source: World Happiness Report, 2018
Immunization, DTP: India crossed the average level for middle income economies in 2016 ► Three doses of diphtheria-tetanus-pertussis (DTP3) vaccine is taken as a proxy by WHO for full immunization.
► The immunization level of children in India improved significantly from 70% in 1990 to 88% in 2016 (Table 5). Although it is higher than in Brazil and South Africa, it is significantly lower than the level achieved by China, which is at 99%, the highest among selected EMEs and advanced economies.
► The immunization level in India reached at par with the average for middle-income economies only in 2015 and exceeded it in 2016.
► At 95.8%, the average immunization level of children in high-income economies in 2015 was much higher than that in middle income economies at 86.4%.
Table 6: Immunization, DTP (% of children aged 12-23 months) – selected countries Country 1990 2000 2010 2016 South Africa 72.0 73.0 72.0 66.0 Brazil 66.0 98.0 99.0 86.0 India 70.0 58.0 79.0 88.0 UK 84.0 91.0 94.0 94.0 US 90.0 94.0 95.0 95.0 Russian Federation NA 96.0 97.0 97.0 China 97.0 85.0 99.0 99.0 World 76.8 72.8 85.0 85.8 High income 88.4 92.7 95.6 95.8 Middle income 78.1 73.9 85.9 86.4
Chart 12: Immunization, DTP (% of children aged 12-23 months) – selected countries
70.0 71.0
58.065.0
79.0
87.0 88.0
97.0
80.085.0 87.0
99.0 99.0 99.0
88.491.6 92.7
95.7
78.173.9 77.9
85.9 86.4
50
60
70
80
90
100
110
1990 1995 2000 2005 2010 2015 2016
India China High Income Middle Income
Source (Basic Data): World Health Organization
Home

Economy Watch: March 2018 11
Ease of Doing Business: India has shown considerable improvement in Ease of Doing Business ► The Ease of Doing Business is a measure released by the World Bank to assess the conduciveness of the regulatory
environment to start and operate a business within a particular country. Countries are ranked on 11 parameters, including ease of obtaining construction permits, access to electricity, registering property and obtaining credit.
► The 2018 release ranks all countries based on a revised methodology. A higher rank signifies greater ease of doing business.
► As per Table 7, India’s performance has been exceptional during 2016-18 as its rank has improved from 129 to 100 over the period. It is one of the 10 economies that have shown the maximum improvement in the areas measured by the Survey.
► Despite the substantial improvement, India still lags behind other BRICS economies in the ranking except Brazil. Among BRICS, Russia has the highest ranking of 35.
► Fourteen of the top 20 ranked economies are OECD high-income economies. New Zealand has consistently ranked the highest among all economies in terms of Ease of Doing Business.
Table 7: Ease of Doing Business: Ranking as per 2017-18 methodology
Country 2016 2017 2018 Change (2018-16) New Zealand 1 1 1 0 US 6 6 6 0 UK 7 8 7 0 Germany 16 19 20 4 Russia 36 35 35 -1 China 75 74 78 3 South Africa 70 73 82 12 India 129 123 100 -29 Brazil 117 122 125 8
Source: Ease of Doing Business 2018, World Bank
Home

Economy Watch: March 2018 12
Introduction
In India’s federal set-up, health is very largely a responsibility of the state governments with public health and sanitation and hospitals and dispensaries being part of the State List. In the Union List, most of the responsibilities relate to research and teaching in institutions of higher learning and setting up of standards. It is well known that for a low-income country like India, the Government will have to play a key role in providing health services, which are merit services since they are associated with large positive externalities. The provision of health services in India is highly unsatisfactory, mainly due to supply-side deficiencies reflected in the inadequacies of availability of hospitals, beds and doctors especially in the government sector. These shortages are particularly sharp for rural areas. While the incidence of diseases is high across the country, the supply-side deficiencies result in highly undesirable outcomes. First, the inadequacy of publically provided services drive people to costly private hospitals and doctors. Second, a strong migration from rural to urban areas is triggered around incidences of a family member falling ill. Often in these cases, the financing of health expenses is done based on borrowing, which leads to a vicious cycle.
In the Union Budget of FY19, a strong emphasis on health services has been provided with an umbrella scheme under the name of Ayushman Bharat, which envisages setting up of a large number of Wellness Centres and extending coverage to more than 10 crore poor and vulnerable families for providing up to INR5 lakh per family per year for secondary and tertiary care hospitalization. In addition, there is a considerable supply-side thrust with plans for opening 24 new government medical colleges and hospitals. These initiatives are meant to supplement some of the earlier schemes of the present Government such as Pradhan Mantri Jeevan Jyoti Bima Yojana (PMJJBY), Pradhan Mantri Suraksha Bima Yojana (PMSBY) and Atal Pension Yojana (APY).
In this write-up, we look at the (a) allocation of government resources for the health sector in the light of international norms, (b) status of health-related facilities, (c) progress in terms of achieving the health-related Sustainable Development Goals (SDGs) and (d) health sector prospects.
Budgetary resources for health sector in India
As a percentage of GDP, the Center’s expenditure is estimated to fall from 0.46% in FY11 to 0.12% in FY19 (BE). The average expenditure level since FY15 has been much lower as compared to the average level that prevailed in the 90s. As far as states are concerned, their expenditures on health was close to 1% during FY11 to FY14. They are estimated to increase to just above 1.3% in FY15 and FY16. In terms of combined expenditure, it has ranged from 1.27 to 1.42 over the period from FY11 to FY16 (BE).
Chart 13: Center’s health expenditure as a % of GDP
Chart 14: All states’ health expenditure as a % of GDP
Chart 15: Combined health expenditure as a % of GDP
Source: Indian Public Finance Statistics, Union Budget, various years
Chart 16 shows inter-state variations in state government health-related expenditure relative to GDP. It indicates that some of the smaller states, particularly the north-eastern states, show a relatively larger share of health expenditures in their GSDP whereas some of the larger states like Bihar and Uttar Pradesh show the lowest expenditure shares of 0.9% and 0.8% respectively in their respective GSDP. Some of the higher income states devote an even lower share of their GSDP toward health expenditure. States with a share of less than 0.7% of GSDP are Punjab, Gujarat, Karnataka, Tamil Nadu, Maharashtra, Haryana, West Bengal and Telangana.
0.46 0.42 0.410.37
0.09 0.120.18
0.14
0.120.0
0.1
0.2
0.3
0.4
0.5
FY11 FY13 FY15 FY17 FY19(BE)
0.96 0.93 0.94
0.95
1.32
1.31
0.8
0.9
1.0
1.1
1.2
1.3
1.4
FY11 FY12 FY13 FY14 FY15(RE)
FY16(BE)
1.35
1.29 1.29
1.27
1.42
1.41
1.15
1.20
1.25
1.30
1.35
1.40
1.45
FY11 FY12 FY13 FY14 FY15(RE)
FY16(BE)
5. In focus: On the health of India’s health sector
Home

Economy Watch: March 2018 13
Chart 16: State government’s expenditure on medical and public health as a % of respective GSDP
Source (Basic Data): RBI, MOSPI Note: State government’s health expenditure as % of GSDP is the average over the period from FY15 to FY17 Table 8: Private and public expenditure on health — cross-country comparison
Country Domestic private health expenditure
Domestic government health expenditure incl. capital expenditure
Total health expenditure
2000 2005 2010 2015 2000 2005 2010 2015 2000 2005 2010 2015 Brazil 4.8 4.7 4.4 5.0 3.5 3.3 3.6 3.8 8.3 8.0 7.9 8.8 China 3.5 2.9 2.1 2.1 1.1 1.7 2.8 3.7 4.6 4.6 4.9 5.9 Indonesia 1.4 1.9 2.4 2.0 0.6 1.0 1.2 1.5 2.0 2.9 3.5 3.5 South Africa 4.6 3.9 3.3 3.6 2.9 2.9 4.2 4.6 7.4 6.8 7.4 8.2 EME average (selected countries)
3.6 3.4 3.1 3.2 2.0 2.2 3.0 3.4 5.6 5.6 5.9 6.6
Canada 2.2 2.4 2.9 2.8 6.4 7.1 8.3 8.1 8.6 9.5 11.2 10.9 Germany 2.0 2.4 1.8 1.7 7.8 7.8 9.2 9.4 9.8 10.3 11.0 11.2 UK* 1.1 1.2 1.3 1.9 5.2 6.4 7.6 8.3 6.3 7.6 8.9 10.2 USA 7.0 7.9 8.4 8.4 6.1 7.2 8.6 9.1 13.1 15.2 17.0 17.4 Average- selected advanced countries
3.1 3.5 3.6 3.7 6.4 7.1 8.4 8.7 9.5 10.7 12.0 12.4
Source (Basic Data): World health Organization *includes Northern Ireland Note: Capital expenditure is assumed to be undertaken by the Government and as such clubbed with it Table 8 gives estimates of private and government health expenditure relative to GDP for selected emerging market and advanced economies. Two patterns are clear. First, advanced economies spend a relatively larger share of their GDP on health compared to EMEs. Second, most of this difference is due to government expenditure on health. Thus, as far as private expenditures are concerned, the average health expenditure for EMEs was 3.2% of GDP in 2015 while in advanced economies it was only slightly higher at 3.7% of GDP. In the case of government expenditure, the EME average was 3.4% of GDP in 2015 while that of the advanced economies was much higher at 8.7%. In India’s case, government health expenditure at about 1.5% of GDP is lower by at least 2 percentage points from the comparable EME average.
Status of key health indicators in India
Deficiency of finances as well as the size and age structure of population constrained further by limited access to health services of reasonable quality in the rural areas has led to this situation where on various critical parameters, India is still tangibly behind international norms. For this purpose, we look at the following indicators: Infant mortality rate (IMR), life expectancy, number of physicians and number of hospital beds per 1,000 population.
2.8
2.7
2.6
2.2
2.1
2.0
1.9
1.7
1.6
1.5
1.2
1.2
1.1
0.9
0.9
0.9
0.9
0.9
0.8
0.8
0.8
0.8
0.7
0.7
0.6
0.6
0.6
0.5
0.5
0.5
0.5
0.3
0.0
0.5
1.0
1.5
2.0
2.5
3.0
Home

Economy Watch: March 2018 14
Table 9: IMR (per 1,000 live births) – selected countries Country 1990 2000 2010 2016 India 88.4 66.6 45.5 34.6 South Africa 44.6 46.3 37.3 34.2 Brazil 53.4 31.3 17.7 13.5 China 42.2 30.1 13.5 8.5 Russia 18.4 16.6 8.6 6.6 US 9.4 7.1 6.2 5.6 UK 7.9 5.5 4.4 3.7 World 64.8 53.9 37.4 30.5 High income 10.3 6.5 5.1 4.5
Middle income 65.2 52.8 36 29.1
Table 10: Life expectancy, total (years) – selected countries Country 1990 2000 2010 2016 India 57.9 62.6 66.6 68.3 South Africa 62.1 56.4 55.9 61.9 Brazil 65.3 70 73.8 75.2 China 69.3 72 75.3 76.1 Russia 68.9 65.5 68.8 70.9 US 75.2 76.6 78.5 78.7 UK 75.9 77.7 80.4 81.6 World 65.4 67.7 70.7 71.9 High income 75.4 77.6 79.8 80.7 Middle income 64.2 66.8 69.9 71.1
Source (Basic data): World Bank
With respect to IMR, in comparison to the world average at 30.5 in 2016, India’s 34.6 is still higher. However, time-series data indicate that India has been improving fast and may soon catch up with the world average. High-income countries show a low IMR at 4.5 only. China among the EMEs shows a performance that is only slightly lower than that of advanced economies. With respect to life expectancy, India has improved considerably over time to 68.3 in 2016 compared to 57.9 in 1990. In this case also, it has come close to the world average of 71.9 years. In advanced countries, life expectancy tends to be higher by nearly 9 years compared to the world average. These differences are partly due to supply-side constraints. We look at some of the supply-side indicators as reflected in Charts 17 and 18. In terms of availability of physicians per 1,000 population, India is shown to have a relatively disadvantaged position with only 0.7 physicians per 1,000 population (2012-14) as compared to 2.9 for high-income countries and 1.5 for the world. Similarly, in case of hospital beds per 1,000 population, India has 0.7 beds (2005-16). This compares quite unfavorably in relation to the world average at 2.9 and 4.2 for high-income countries.
Chart 17: Number of physicians per 1,000 population – 2012-14
Chart 18: Number of hospital beds per 1,000 population – 2005-16
Source (Basic data): World Bank
0 2 4 6 8 10
WorldHigh income
Middle incomeRussia
GermanyFrance
European UnionAustralia
ChinaNorway
United KingdomUnited StatesSouth Africa
CanadaBrazil
New ZealandMalaysia
MexicoIndonesia
IndiaPakistan
0 1 2 3 4 5
WorldHigh income
Middle incomeNorway
GermanyEuropean Union
AustraliaRussiaFrance
New ZealandUnited Kingdom
United StatesCanada
JapanMexico
ChinaBrazil
PakistanSouth Africa
IndiaIndonesia
Home

Economy Watch: March 2018 15
SDGs: India’s progress
India is making steady progress toward achieving the health-related SDGs. Table 11 indicates the SDG list under Goal 3 covering health-related targets vis-à-vis an overview of the current status as per the Civil Society Report, 2017 (Sustainable Development Goals: Agenda 2030).
Table 11: Health targets under SDG Goal 3 and current status
# SDG target Current status1
1. Reduce the global maternal mortality ratio to less than 70 per 100,000 live births by 2030
Maternal mortality ratio has declined from 254 (2004-06) to 167(2011-13) per 100,000 live births; however, there are large inequities and variations between and within states, and across social and economic groups.
2
By 2030, end preventable deaths of newborns and children under 5 years of age, with all countries aiming to reduce neonatal mortality to at least as low as 12 per 1,000 live births and under-5 mortality to at least as low as 25 per 1,000 live births
The current rate of under-five mortality in India is 48 per 1,000 live births, IMR is 39 per 1000 live births and neonatal mortality is 28 per 1,000 live births. Infant mortality accounts for over 80% of under-five mortality; and neonatal mortality accounts for over 71% of IMR.
3
By 2030, end the epidemics of AIDS, tuberculosis, malaria and neglected tropical diseases and combat hepatitis, water-borne diseases and other communicable diseases
1. India had 1.96 lakh new cases of HIV infection in 2015. 2. Incidence of malaria in India in 2014 was 0.89 per 1,000 population at risk per year. It also states that the total malaria cases decreased by 42% since 2004. 3. Tuberculosis incidence per lakh population decreased from 216 in 1990 to 167 in 2014. India has framed its TB strategic plan in alignment with the WHOs End TB Strategy, which promotes improvement of TB reporting, engaging private sector and also reducing the MDR regimen.
4
By 2030, reduce by one-third premature mortality from non-communicable diseases through prevention and treatment and promote mental health and well-being
Data from poor parts of the country clearly states that the predominant diseases of poor are not confined to ischemic heart diseases, cancer and diabetes but also encompass diseases such as rheumatoid disorders, sickle cell anemia and epilepsy.
5 Strengthen the prevention and treatment of substance abuse, including narcotic drug abuse and harmful use of alcohol
----
6 By 2020, halve the number of global deaths and injuries from road traffic accidents
1. In 2015, 146,133 deaths due to road traffic accidents were reported, an increase of 53% since 2005. This represents more than half of the total injury mortality burden in India. 2. Studies show that these figures are underreported, with the WHO estimating nearly 111% underreporting.
7
By 2030, ensure universal access to sexual and reproductive health-care services, including for family planning, information and education, and the integration of reproductive health into national strategies and programmes
1. Although abortion is legal in India, safe abortion continues to be inaccessible to a large number of women. It is believed that unsafe abortions contribute to 9%–13% of the maternal mortality in India and as much as 50% of the maternal mortality in some of the districts. 2. There is a gross dearth of safe abortion facilities, which is a major reason why women resort to informal untrained providers.
8
Achieve universal health coverage, including financial risk protection, access to quality essential healthcare services and access to safe, effective quality and affordable essential medicines and vaccines for all
In India, the Government bears less than a fourth of health spending — among the lowest in the world — while households spend two-thirds. The Union Government is continuously cutting back the health budget — what has been allocated for 2017-18 is less than the expenditure for the year 2011-12, when adjusted for inflation. Though the government-sponsored insurance schemes continue to remain popular among policy makers and politicians, evidence suggests that their impact on financial protection has been minimal.
9
By 2030, substantially reduce the number of deaths and illnesses from hazardous chemicals and air, water and soil pollution and contamination
Air pollution is a major health concern in India. Mortality due air pollution (indoor and outdoor) is high: Estimated at over 2.3 million deaths in the year 2015 (out of a total of 9.57 million deaths in India), constituting a staggering 24% of all deaths in India, making it a top risk factor. Of the 15 most polluted cities worldwide, 7 are located in India.
Water pollution of surface and ground water is rampant, with over 50% of rivers declared polluted, mainly due to sewage. Diarrheal diseases cause approximately 1.2 lakh deaths of under-five children each year.
1 Sustainable Development Goals: Agenda 2030 – India (2017), Civil Society Report
Home

Economy Watch: March 2018 16
Future prospects
To realize its growth potential to a fuller extent and also align its growth priorities not only to its own changing age profile but also that of the world, India might have to shift gears in prioritizing the health sector. A healthier population will uplift economic activity and increase potential growth. Further, as India’s population begins to age, it will require larger health-related expenses from the governments.
The global population has already begun to age at a significant pace. It will require health services from countries where a surplus of trained and skilled health service personnel would be available. It is some of the service sectors like health services that would not be crowded out by the growing shadow of robotics on the world economy. India should therefore strategize to invest heavily in the supply side of the health sector not only to cater to the domestic needs but also for exporting the health services abroad particularly to the advanced countries and to the relatively rich middle-eastern countries. In this context, the Central Government’s announcements to increase health expenditure from 1.15%2 of GDP to 2.5% of GDP by 2025 and increase the spending by the states so as to account for 8% of their budgets by 2020 are timely initiatives.
2 National Health Mission, 2017
Home

Economy Watch: March 2018 17
A. Monetary sector
Monetary policy
► Given elevated core CPI inflation, the RBI may retain a neutral stance during its upcoming policy review to be held in April 2018, although the headline CPI inflation moderated in February 2018, (Chart 19). In the policy review held on 7 February 2018, five out of the six members of the monetary policy committee voted in favor of retaining the repo rate at 6.0%, while one member voted for increasing the repo rate by 25 basis points.
► The RBI forecasted CPI inflation to surge further and be in the 5.1%—5.6% range in 1HFY19 and 4.5%—4.6% in 2HFY19. Upside risks to inflation may emerge on account of (i) higher international crude prices, (ii) fiscal slippage, and (iii) a upward revision to minimum support prices for Kharif crops, but the magnitude of its impact on inflation is less known at the moment.
Money stock
► Growth in broad money stock (M3) marginally increased to 10.8% (y-o-y) in January 2018 from 10.4% in December 2017 (Chart 20). Time deposits (accounting for over 76% of the broad money stock) rose to 4.8% in January 2018 as compared to 3.5% in December 2017 but remained well below its 10-year average growth of around 15.0%.
► Driven by a favorable base effect, narrow money (M1) growth continued to post a double-digit growth of 39.3% (y-o-y) in January 2018, although falling from 45.8% (y-o-y) in December 2017. Currency in circulation (excluding non-demonetized currency) as a percentage of the total demonetized currency (indicating the extent of re-monetization) was at 100.5% by 2 March 2018, indicating that the re-monetization process was completed in nearly 15 months. Currency intensity, measured as the currency-to-GDP ratio, rose to 10.7% by 2 March 2018. Due to demonetization, it had earlier fallen to 8.8% by the end of FY18 from a four-year high of 12.1% by end of FY16.
Aggregate credit and deposits
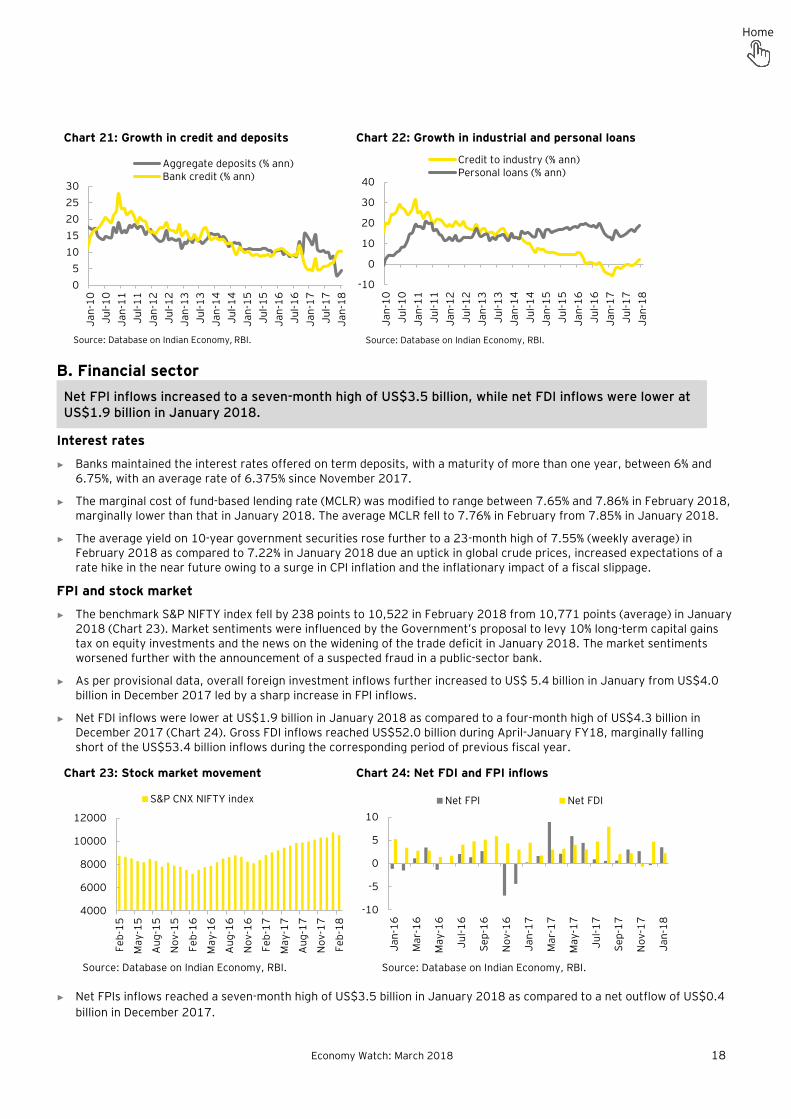
► Credit by scheduled commercial banks grew by 10.2% (y-o-y) in January 2018 but was marginally lower than 10.3% growth seen in December 2017 (Chart 21).
► Non-food credit growth moderated to 9.5% in January 2018 from 10.0% in December 2017 owing to a moderation in the credit offtake in services and industrial sector. Growth in credit to the services sector and industries fell to 13.2% and 1.1% respectively in January 2018 from 14.7% and 2.1% in December 2017.
► Personal loans, a key driver of retail sector credit, grew to a seven-year peak of 20.0% in January 2018 from 18.9% in December 2017 led by a surge in the demand for housing loans (Chart 22).
► Growth in aggregate bank deposits improved marginally to 4.6% (y-o-y) in January 2018 from 3.4% in December 2017, but continued to remain subdued owing to unfavorable base effect.
6. Money and finance: Credit growth remained close to 10% in January 2018
With continued upside risks to CPI inflation, the RBI is expected to maintain its policy repo rate at 6.0% during its next policy review to be held in April 2018.
Chart 19: Movements in repo rate
Chart 20: Growth in narrow and broad money
6.00
456789
10
Feb-
12
Aug
-12
Feb-
13
Aug
-13
Feb-
14
Aug
-14
Feb-
15
Aug
-15
Feb-
16
Aug
-16
Feb-
17
Aug
-17
Feb-
18
Repo rate
-30-20-10
01020304050
Jan-
11
Jul-1
1
Jan-
12
Jul-1
2
Jan-
13
Jul-1
3
Jan-
14
Jul-1
4
Jan-
15
Jul-1
5
Jan-
16
Jul-1
6
Jan-
17
Jul-1
7
Jan-
18
Narrow money (M1) Broad money (M3)
Source: Database on Indian Economy, RBI.
Home
Economy Watch: March 2018 18
Chart 21: Growth in credit and deposits
Chart 22: Growth in industrial and personal loans
B. Financial sector
Interest rates
► Banks maintained the interest rates offered on term deposits, with a maturity of more than one year, between 6% and 6.75%, with an average rate of 6.375% since November 2017.
► The marginal cost of fund-based lending rate (MCLR) was modified to range between 7.65% and 7.86% in February 2018, marginally lower than that in January 2018. The average MCLR fell to 7.76% in February from 7.85% in January 2018.
► The average yield on 10-year government securities rose further to a 23-month high of 7.55% (weekly average) in February 2018 as compared to 7.22% in January 2018 due an uptick in global crude prices, increased expectations of a rate hike in the near future owing to a surge in CPI inflation and the inflationary impact of a fiscal slippage.
FPI and stock market
► The benchmark S&P NIFTY index fell by 238 points to 10,522 in February 2018 from 10,771 points (average) in January 2018 (Chart 23). Market sentiments were influenced by the Government’s proposal to levy 10% long-term capital gains tax on equity investments and the news on the widening of the trade deficit in January 2018. The market sentiments worsened further with the announcement of a suspected fraud in a public-sector bank.
► As per provisional data, overall foreign investment inflows further increased to US$ 5.4 billion in January from US$4.0 billion in December 2017 led by a sharp increase in FPI inflows.
► Net FDI inflows were lower at US$1.9 billion in January 2018 as compared to a four-month high of US$4.3 billion in December 2017 (Chart 24). Gross FDI inflows reached US$52.0 billion during April-January FY18, marginally falling short of the US$53.4 billion inflows during the corresponding period of previous fiscal year.
► Net FPIs inflows reached a seven-month high of US$3.5 billion in January 2018 as compared to a net outflow of US$0.4 billion in December 2017.
05
1015202530
Jan-
10Ju
l-10
Jan-
11Ju
l-11
Jan-
12Ju
l-12
Jan-
13Ju
l-13
Jan-
14Ju
l-14
Jan-
15Ju
l-15
Jan-
16Ju
l-16
Jan-
17Ju
l-17
Jan-
18
Aggregate deposits (% ann)Bank credit (% ann)
Source: Database on Indian Economy, RBI.
-10
0
10
20
30
40
Jan-
10Ju
l-10
Jan-
11Ju
l-11
Jan-
12Ju
l-12
Jan-
13Ju
l-13
Jan-
14Ju
l-14
Jan-
15Ju
l-15
Jan-
16Ju
l-16
Jan-
17Ju
l-17
Jan-
18
Credit to industry (% ann)Personal loans (% ann)
Source: Database on Indian Economy, RBI.
Net FPI inflows increased to a seven-month high of US$3.5 billion, while net FDI inflows were lower at US$1.9 billion in January 2018.
Chart 23: Stock market movement
Chart 24: Net FDI and FPI inflows
4000
6000
8000
10000
12000
Feb-
15
May
-15
Aug
-15
Nov
-15
Feb-
16
May
-16
Aug
-16
Nov
-16
Feb-
17
May
-17
Aug
-17
Nov
-17
Feb-
18
S&P CNX NIFTY index
-10
-5
0
5
10
Jan-
16
Mar
-16
May
-16
Jul-1
6
Sep-
16
Nov
-16
Jan-
17
Mar
-17
May
-17
Jul-1
7
Sep-
17
Nov
-17
Jan-
18
Net FPI Net FDI
Source: Database on Indian Economy, RBI. Source: Database on Indian Economy, RBI.
Home

Economy Watch: March 2018 19
A. CAB: Sharp deterioration over 2QFY18
The decline in CAB over 2QFY18 was due to the combined effect of a slowdown in merchandise exports and a pickup in merchandise imports (Table 12). Merchandise imports rose to an 18-quarter high driven by the impact of rising oil prices on the oil import bill. Net service exports rose to an all-time high of US$20.9 billion. Accompanied by rising net private transfer receipts and slowing net primary income payments, net invisibles receipts climbed to an 11-quarter high of US$30.6 billion.
Table 12: CAB
CAB
(- deficit/ +surplus) (US$
billion)
CAB as a % of nominal GDP
Goods account net
(US$ billion)
Services account net (US$ billion)
Income account
net (US$ billion)
Transfers net
(US$ billion)
FY14 -32.4 -1.7 -147.6 73.0 -23.0 65.3 FY15 -26.8 -1.3 -144.9 76.6 -24.1 65.7 FY16 -22.2 -1.0 -130.1 69.7 -24.4 62.6 FY17 -15.3 -0.7 -112.4 67.5 -26.3 56.0 4QFY17 -3.5 -0.6 -29.7 17.6 -5.6 14.2 1QFY18 -15.0 -2.5 -42.0 18.3 -5.8 14.5 2QFY18 -7.2 -1.1 -32.8 18.4 -8.5 15.6 3QFY18 -13.5 -2.0 -44.1 20.9 -6.4 16.1
Source: Database on Indian Economy, RBI.
B. Merchandise trade and exchange rate ► Growth in merchandise exports eased to a four-month low of 4.5% in February 2018 from 9.1% in January — the third
successive month of decline from a six-year high of 30.5% in November 2017 (Chart 25). ► The slowdown was driven by a contraction in exports of engineering goods at (-) 1.9% and gems and jewelry at (-) 5.1%
from 15.8% and 0.9% respectively in January besides the easing of growth in oil exports to 27.9% from 39.5% in January.
► Import growth, too, eased to a four-month low of 10.4% from an eight-month high of 26.1% in January partly due to base effect. Most of the major import items, especially oil and transport equipment, recorded a fall in growth in February.
► Growth in oil imports moderated to 32.1% in February from a 10-month high of 42.6% in January. Imports of transport equipment contracted by (-) 49.1%, the sharpest fall in over two years, as compared to a growth of 4.0% in January.
► Trade deficit eased to a four-month low of US$12.0 billion from a 56-month high of US$16.3 billion in January. Despite services surplus climbing to US$6.5 billion in January, combined goods and services trade deficit rose to 38-month high of US$9.8 billion in the same month.
► The Indian rupee depreciated to INR64.3 per US dollar from INR63.6 per US dollar in January partly due to FPI outflows.
7. Trade and CAB: CAD rose to 2% in 3QFY18 even as exports growth eased further to 4.5% in February
Chart 25: Developments in merchandise trade
Chart 26: CAD
-50
-25
0
25
50
-30-20-10
0102030
Feb-
16
Apr
-16
Jun-
16
Aug
-16
Oct
-16
Dec
-16
Feb-
17
Apr
-17
Jun-
17
Aug
-17
Oct
-17
Dec
-17
Feb-
18
Trade balance (US$ billion, LHS)Exports (% ann, RHS)Imports (% ann, RHS)
Source: Ministry of Commerce and Industry.
-8-6-4-202
-40
-30
-20
-10
0
3QFY
12
1QFY
13
3QFY
13
1QFY
14
3QFY
14
1QFY
15
3QFY
15
1QFY
16
3QFY
16
1QFY
17
3QFY
17
1QFY
18
3QFY
18
CAD (US$ billion, LHS) CAD (% of GDP, RHS)
Source: Database on Indian Economy, RBI.
CAB as a percentage of GDP reached (-) 2.0% in 3QFY18 from (-) 1.2% in 2QFY18 as merchandise trade deficit increased to an 18-quarter high of US$44.1 billion from US$32.8 billion in 2QFY18.
Home

Economy Watch: March 2018 20
A. Global growth outlook ► As per the UN (World Economic Situation and Prospects, WESP 2018), global growth is estimated at 3.0% in 2017, driven
by a strengthening growth in major developed countries and a few emerging economies (Chart 27). In their assessment, a steady global growth is anticipated in 2018-19, led largely by developing economies.
► For the US, GDP growth is estimated at 2.2% in 2017 and 2.1% in 2018 largely supported by an improvement in business investment and to a lesser extent, by net trade. There has been a sustained growth in household expenditure but it has led to a fall in the real disposable income due to a fall in savings. This has resulted in a fall in the personal savings ratio, which in December 2017 was at its lowest level since 2005.
► For the EU, growth has been estimated at 2.2% in 2017 and 2.1% in 2018 driven by improvement in private consumption. Within the region, Spain and Ireland are expected to lead the growth performance while Italy and the UK are projected to witness slower growth rates.
► In the UK, growth is projected at 1.7% in 2017 and 1.4% in 2018. Weaker pound sterling has led to a rise in import cost pressures and subdued domestic demand. Further, business investment has been suffering from the uncertainty regarding the future framework for economic relations of the UK with the EU and the rest of the world.
► GDP growth in Japan is estimated to be robust at 1.7% in 2017 driven by a continuous accommodative macroeconomic policy stance, led by a significant expansion in domestic demand. Steady external demand growth from Asia and North America has also contributed to the growth. However, GDP growth is projected to slow down in 2018 and 2019 as the impact of the fiscal stimulus measures ease.
► Among the emerging economies, growth in China is estimated at 6.8% in 2017, moderating to 6.5% in 2018. The stronger-than-expected growth in 2017 was attributed to the implementation of policy stimulus measures, including higher infrastructure spending. Private consumption is expected to continue to remain the main driver of growth supported by rising wage growth and steady job creation.
► In India, despite the growth slowdown witnessed in 2017, the outlook remains positive. Growth is estimated at 6.7% in 2017 and is forecasted to pick up to 7.2% in 2018. The World Bank (India Development Update, released on 14 March 2018) also projects India’s growth at 6.7% in 2017-18 and expects it to accelerate to 7.3% in 2018-19 and 7.5% in 2019-20.
Chart 25: Global growth projections
Chart 26: Global crude and coal prices
3.0
6.5
7.2
2.1
2.1
1.9
1.4
1.2
1.8
2.0
3.0
6.8
6.7
2.2
2.2
1.8
1.7
1.7
0.6
0.7
0.0 5.0 10.0
World
China
India*
EU
US
Russia
UK
Japan
South Africa
Brazil
2017
2018
2030405060708090
100110120130
Feb-
10Ju
n-10
Oct
-10
Feb-
11Ju
n-11
Oct
-11
Feb-
12Ju
n-12
Oct
-12
Feb-
13Ju
n-13
Oct
-13
Feb-
14Ju
n-14
Oct
-14
Feb-
15Ju
n-15
Oct
-15
Feb-
16Ju
n-16
Oct
-16
Feb-
17Ju
n-17
Oct
-17
Feb-
18
Coal average price (US$/mt) Crude oil (US$/brl)
Souce: World Bank, Pinksheet.
8. Global growth: UN estimates a strengthening of global growth driven by an investment recovery
The UN, in its 2018 issue of the WESP, has projected global growth to strengthen to 3.0% in 2017 and 2018 driven by a revival in investment. However, the recovery remains moderate and limited to a narrow set of countries, and a firmer and more broad-based investment rebound will depend on the extent to which the available financing can be channelled into productive investment, rather than financial assets.
Source: World Economic Situation and Prospects, 2018, United Nations *Forecast pertains to fiscal year FY18 and FY19 accordingly.
Home

Economy Watch: March 2018 21
B. Global energy prices
► After reaching a peak of US$66.2/bbl. in January 2018, average global crude price3 decreased to US$63.5/bbl. in
February 2018 (Chart 28). This could be attributed partly to increased crude production by the US during the month. As per the US Energy Information Administration (EIA) estimates in its Short-term Energy Outlook released on 6 March 2018), US crude oil production averaged 10.3 mb/d in February, up 230,000 b/d from the January level.
► Average global coal price4 fell to US$92.1/mt. in February 2018 from its recent peak of US$95.3/mt. in January 2018.
3 Simple average of three spot prices, namely, Dated Brent, West Texas Intermediate and Dubai Fateh. 4 Simple average of Australian, Columbian and South African coal prices
Average global crude price fell from its recent peak in January 2018 to US$63.5/bbl. in February 2018, partly on account of increased crude supply from the US during the month. Average global coal price also fell marginally from its peak in January 2018.
Home

Economy Watch: March 2018 22
► The IMI is obtained by adding the percentage deviation of inflation rate (based on new CPI 2011—12=100), fiscal deficit
(as a percentage of GDP) and current account deficit (as a percentage of GDP) from their respective benchmarks of 4% of GDP, 3% of GDP and 1.3% of GDP5. All three components of IMI have been given equal weightage (33.33%). The state of “balance” is judged by a value of “0.”
► An index value > 0 indicates the presence of an imbalance in the economy. In considering the percentage deviation of each of the indicators from its selected norm, only the positive deviations are taken. Negative deviations are equated to zero to ensure that the negative and positive deviations across indices are not canceled out.
► IMI rose sharply in 3QFY18 from a near-full balance in 2QFY17, indicating a deterioration in the macro balance of the
economy (Chart 29). Two out of three components of IMI, namely, CPI inflation (4.6%) and CAD (2.0% of GDP) crossed their respective benchmarks during 3QFY18, thereby increasing the imbalance in the economy.
With CPI inflation and CAD crossing their respective benchmark values, the IMI increased to 23.2 in 3QFY18 as compared to a near full balance in 2QFY18. Imbalance is expected to continue on account of higher CPI inflation and CAD in the coming quarter.
10. Index of aggregate demand (IAD): Aggregate demand
weakened in January 2018
► The y-o-y growth in IAD fell to 4.6% in January 2018 from a three year high of 10.4% in December 2017 (Chart 30). Unfavorable base effect coupled with lower demand conditions in the manufacturing has more than offset the recovery in demand conditions in the services and agricultural sector.
5 Rangarajan, C (2016): “Can India grow at 8 to 9 per cent?” The Hindu, http://www.thehindu.com/opinion/lead/can-india-grow-at-8-to-9-per-cent/article8596824.ece, Accessed on 17 May 2016.
9. Index of macro imbalance (IMI): Macro balance deteriorated in 3QFY18
Chart 27: IMI (Quarterly)
Source (Basic data): RBI, MOSPI and EY estimate
23.2
-500
50100150200250
4QFY
13
1QFY
14
2QFY
14
3QFY
14
4QFY
14
1QFY
15
2QFY
15
3QFY
15
4QFY
15
1QFY
16
2QFY
16
3QFY
16
4QFY
16
1QFY
17
2QFY
17
3QFY
17
4QFY
17
1QFY
18
2QFY
18
3QFY
19
Chart 28: Growth in the IAD (y-o-y)
-15-55
152535
Jan
10
Jul 1
0
Jan
11
Jul 1
1
Jan
12
Jul 1
2
Jan
13
Jul 1
3
Jan
14
Jul 1
4
Jan
15
Jul 1
5
Jan
16
Jul 1
6
Jan
17
Jul 1
7
Jan
18
Source (Basic data): RBI, MOSPI and EY estimate
From a three-year high in December 2017, growth in the IAD fell to 4.6% in January 2018 due to unfavorable base effect and a sharp moderation in the demand conditions in manufacturing sector.
Home

Economy Watch: March 2018 23
Introduction
Expansionary policies are generally analyzed in terms of their impact on macro indicators such as the growth rate or inflation, rate but their effects spread out to individual sectors affecting different sectors differently. In this write-up, we undertake an analysis of the sectoral impact of the expansionary thrust of the Union Budget FY19.
Sectoral transmission channels
Increase in government expenditures either directly results in additional purchases of goods and services or is paid out as additional incomes in the form of payments to the private sector as pensions, salaries or interest payments. These incomes result in additional consumption or savings that are converted into demand for investment goods. When the entire circuit is tracked, there is an increase in final demand, which leads to further increases in economic activities through a multiplier process. Charts 31 and 32 depict the channels of impact for an expansionary fiscal policy separately for revenue and capital expenditures.
Chart 29: Expansionary fiscal policy — case of revenue expenditure
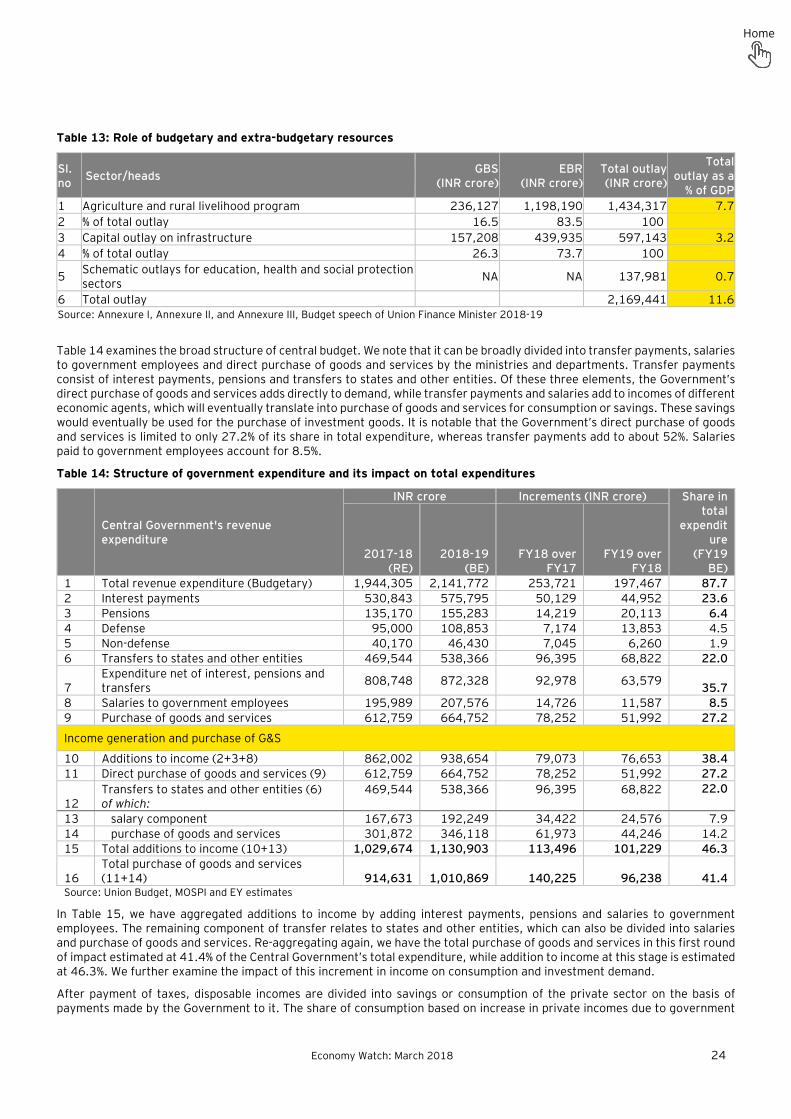
In the Union Budget of FY19, the Government has proposed an ambitious spending program, which is to be financed by both budgetary and extra-budgetary resources. The total outlays for three focus areas of the Government — namely (a) agriculture and rural livelihoods, (b) infrastructure and education and (c) health and social sectors — amount to 11.6% of GDP. The details are given in Annexures1, 2 and 3 of the Finance Minister’s speech. Budgetary resources constitute only 16.4 % of this total outlay. The balance of 83.6% is to be raised as extra-budgetary resources by the concerned public sector enterprises, special purpose vehicles and other similar institutions. Thus, the extra budgetary resources are meant to contribute nearly 9.7% of GDP to finance the stipulated outlays (Table 13). The strategy is to leverage budgetary resources to induce much larger expenditures by supplementing these by extra-budgetary resources.
Chart 30: Case of capital expenditure — transmission to sectors
11. Special feature: Expansionary potential of the Center’s FY19 Budget — Sectoral impact
Government consumption/revenue expenditure
Direct purchases of goods and
services by government departments
Additional consumption/
savings
Demand for goods and services
(consumption and investment goods)
Differential demand – by share of
consumption
Sectoral impact
Inflation
Transfer and salary payments including
pensions and interest payments
Defense Defense equipment
Capital expenditure
Non-defense
Demand for domestic production /imports (investment goods)
Increase in capacity
utilization
Additional private investment
Machinery Cement steel
Home
Economy Watch: March 2018 24
Table 13: Role of budgetary and extra-budgetary resources
Sl. no Sector/heads GBS
(INR crore) EBR
(INR crore) Total outlay
(INR crore)
Total outlay as a
% of GDP 1 Agriculture and rural livelihood program 236,127 1,198,190 1,434,317 7.7 2 % of total outlay 16.5 83.5 100 3 Capital outlay on infrastructure 157,208 439,935 597,143 3.2 4 % of total outlay 26.3 73.7 100
5 Schematic outlays for education, health and social protection sectors NA NA 137,981 0.7
6 Total outlay 2,169,441 11.6 Source: Annexure I, Annexure II, and Annexure III, Budget speech of Union Finance Minister 2018-19
Table 14 examines the broad structure of central budget. We note that it can be broadly divided into transfer payments, salaries to government employees and direct purchase of goods and services by the ministries and departments. Transfer payments consist of interest payments, pensions and transfers to states and other entities. Of these three elements, the Government’s direct purchase of goods and services adds directly to demand, while transfer payments and salaries add to incomes of different economic agents, which will eventually translate into purchase of goods and services for consumption or savings. These savings would eventually be used for the purchase of investment goods. It is notable that the Government’s direct purchase of goods and services is limited to only 27.2% of its share in total expenditure, whereas transfer payments add to about 52%. Salaries paid to government employees account for 8.5%.
Table 14: Structure of government expenditure and its impact on total expenditures
Central Government's revenue expenditure
INR crore Increments (INR crore) Share in total
expenditure
(FY19 BE)
2017-18 (RE)
2018-19 (BE)
FY18 over FY17
FY19 over FY18
1 Total revenue expenditure (Budgetary) 1,944,305 2,141,772 253,721 197,467 87.7 2 Interest payments 530,843 575,795 50,129 44,952 23.6 3 Pensions 135,170 155,283 14,219 20,113 6.4 4 Defense 95,000 108,853 7,174 13,853 4.5 5 Non-defense 40,170 46,430 7,045 6,260 1.9 6 Transfers to states and other entities 469,544 538,366 96,395 68,822 22.0
7 Expenditure net of interest, pensions and transfers 808,748 872,328 92,978 63,579 35.7
8 Salaries to government employees 195,989 207,576 14,726 11,587 8.5 9 Purchase of goods and services 612,759 664,752 78,252 51,992 27.2
Income generation and purchase of G&S
10 Additions to income (2+3+8) 862,002 938,654 79,073 76,653 38.4 11 Direct purchase of goods and services (9) 612,759 664,752 78,252 51,992 27.2
12 Transfers to states and other entities (6) of which:
469,544
538,366
96,395
68,822
22.0
13 salary component 167,673 192,249 34,422 24,576 7.9 14 purchase of goods and services 301,872 346,118 61,973 44,246 14.2 15 Total additions to income (10+13) 1,029,674 1,130,903 113,496 101,229 46.3
16 Total purchase of goods and services (11+14) 914,631 1,010,869 140,225 96,238 41.4
Source: Union Budget, MOSPI and EY estimates
In Table 15, we have aggregated additions to income by adding interest payments, pensions and salaries to government employees. The remaining component of transfer relates to states and other entities, which can also be divided into salaries and purchase of goods and services. Re-aggregating again, we have the total purchase of goods and services in this first round of impact estimated at 41.4% of the Central Government’s total expenditure, while addition to income at this stage is estimated at 46.3%. We further examine the impact of this increment in income on consumption and investment demand.
After payment of taxes, disposable incomes are divided into savings or consumption of the private sector on the basis of payments made by the Government to it. The share of consumption based on increase in private incomes due to government
Home

Economy Watch: March 2018 25
payments is close to 30.0% of the Government’s capital expenditure. Thus, adding the Government’s direct purchase of goods and services and the private sector income-based purchase of goods and services, it amounts to nearly 71% of the Center’s total expenditure that is converted for purchase of goods and services. The structure of this demand is different for government purchases vis-à-vis private purchases. Furthermore, the balance of income after excluding taxes paid by the private sector, amounting to nearly 13.5% of the Government’s total expenditure, would be converted into savings and eventually purchase of investment goods by the private sector. Thus, even the Government’s revenue expenditure results in some additional demand for capital goods.
Table 15: Consumption demand from income generated out of central budget
Generation of demand
INR crore Increments (INR crore) Shares in total
expenditure (FY19 BE)
2017-18 (RE)
2018-19 (BE)
FY18 over FY17
FY19 over FY18
1 Total private sector income 1,029,674 1,130,903 113,496 101,229 46.3 2 Less taxes on income 62,774 68,946 6,919 6,171 2.8 3 Disposable income of private sector 966,900 1,061,957 106,576 95,057 43.5 4 Savings 301,267 330,885 33,207 29,618 13.5 5 Consumption 665,633 731,072 73,369 65,439 29.9 Source: Union Budget, MOSPI and EY estimates
Next, we consider the size and structure of the Government’s capital expenditure, which can be divided into defense and non-defense categories. Non-defense capital expenditure is further divided into loans and other capital expenditure. Assuming that a large portion of the loans given by the Central Government on the capital account would also be spent on purchase of investment goods, we can consider the entire capital expenditure budget as being spent on investment goods, although the structure of demand for investment goods may be quite different for defense and non-defense categories. Adding together purchase of investment goods through increase in private incomes and direct purchase of investment goods by the Central Government (defense and non-defense), we have a share of about 26% in total expenditure while the balance 71.3% excluding taxes accounts for the purchase of consumption goods.
Table 16: Final demand generated out of central budget
Central Government's revenue expenditure
INR crore Increments (INR crore) Shares in total
expenditure (FY19 BE)
2017-18 (RE)
2018-19 (BE)
FY18 over FY17
FY19 over FY18
1 Total consumption demand 1,580,264 1,741,942 213,595 161,677 71.3 2 Total purchase of goods and services 914,631 1,010,869 140,225 96,238 41.4 3 Consumption 665,633 731,072 73,369 65,439 29.9 4 Total investment demand 574,712 631,326 22,042 56,614 12.3 5 Government's investment demand 273,445 300,441 -11,165 26,997 12.3 6 Defense 91,461 99,564 -21 8,102 4.1 7 Non-defense 181,983 200,877 -11,143 18,894 8.2 8 Final demand 1,853,709 2,042,383 202,430 188,674 83.6 Source: Union Budget, MOSPI and EY estimates
In order to analyze the incremental impact of the Government’s budget on purchase of different consumption and investment goods, we have taken the increase in budgeted FY19 expenditures compared to revised estimates of FY18 expenditures. This increase can be divided into increases in total demand for consumption goods and investment goods. Further analysis can be done (i) for certain aggregate categories of consumption goods based on increase in government direct purchases and (ii) purchases by the private sector based on increase in incomes resulting from the budget. In the case of capital goods, purchases can be disaggregated into certain broad categories.
The relevant results for consumption goods are summarized in Table 17, which shows the main categories of private final consumption expenditure based on National Income Accounts data. We have estimated the sector-wise impact of the increase in government demand on private final consumption expenditure by using the relative shares of segment-wise consumption in total consumption as per national accounts data 2016-17. It can be seen that a relatively large share of increment in demand is for the category of (i) food and non-alcoholic beverages, followed by (ii) housing, water, electricity, gas and other fuels, (iii) miscellaneous goods and services and (iv) transport.
Home

Economy Watch: March 2018 26
The additional income that the private sector gets on the basis of additional government expenditure results partly in increased consumption as analyzed earlier and partly in increased savings. These savings are kept in two forms: physical and financial. Since financial savings represent the surplus savings of the household (HH) sector, they are used by the Government or the private corporate sector for financing their deficits. We consider that most of it is taken up by the Government for financing its fiscal deficit. Of the total government expenditure, these financial savings amount to 5.6%, which is close to 1% of GDP. The savings in physical form are converted into physical investment, adding to the demand for capital goods. These initial additions to demand result in much larger increases in final demand through a multiplier process as discussed in the next section.
Table 17: Consumption demand and savings from income generated out of central budget
C Consumption demand
INR crore Increments (INR crore) Shares in total
expenditure
2017-18 (RE)
2018-19 (BE)
FY18 over FY17
FY19 over FY18
1 Consumption 665,633 731,072 73,369 65,439 29.9 2 Food and non-alcoholic beverages 200,060 219,728 22,052 19,668 9.0 3 Alcoholic beverages, tobacco and narcotics 16,225 17,820 1,788 1,595 0.7 4 Clothing and footwear 44,428 48,796 4,897 4,368 2.0 5 Housing, water, electricity, gas and other fuels 100,240 110,095 11,049 9,855 4.5 6 Furnishings, HHs equipment and maintenance 20,417 22,424 2,250 2,007 0.9 7 Health 28,654 31,471 3,158 2,817 1.3 8 Transport 96,547 106,039 10,642 9,492 4.3 9 Communication 16,342 17,949 1,801 1,607 0.7 10 Recreation and culture 5,659 6,215 624 556 0.3 11 Education 26,277 28,860 2,896 2,583 1.2 12 Restaurants and hotels 13,352 14,664 1,472 1,313 0.6 13 Miscellaneous goods and services 97,433 107,012 10,740 9,579 4.4 Savings and investment 14 Savings private sector 301,267 330,885 33,207 29,618 13.5 15 Physical (including valuables) 176,959 194,356 19,505 17,397 8.0 16 Financial savings 124,308 136,529 13,702 12,221 5.6 Source: Union Budget, MOSPI and EY estimates
Review of estimates of fiscal multipliers — selected literature
A number of studies have estimated the fiscal multipliers for the Indian economy. In Table 18, we summarize the results of two recent studies: Bose and Bhanumurthy (2013) and Goyal and Sharma (2015).
Table 18: Fiscal multiplier estimates selected literature
Policy variables Bose and Bhanumurthy6
(2013)
Goyal and Sharma7 (2015) – cumulative multiplier estimates in the presence of
Short-term restrictions
Supply shocks
Monetary response
Supply shocks plus endogenous monetary
response Capital expenditure 2.45 2.36 2.35 3.06 4.02 Revenue expenditure --- 0.70 0.62 0.47 1.69 Transfer Payments 0.98 --- --- --- --- Other revenue expenditure*
0.99 --- --- --- ---
Total expenditure --- 0.23 --- --- --- * Other revenue expenditure of the government is the revenue expenditure after netting out the transfer payment
In the case of Bose and Bhanumurthy, a macroeconometric model was used with a detailed fiscal sector to obtain the value of the fiscal multipliers. These are obtained by estimating fiscal multipliers under two scenarios: (i) when there is no restriction on fiscal deficit and (ii) when there is a restriction on fiscal deficit as suggested by the 13th Finance Commission.At the aggregate level, our analysis has estimated revenue expenditure multiplier at close to 2 and capital expenditure multiplier at
6 Bose.S and N R Bhanumurthy, 2013. “Fiscal Multipliers for India”, NIPFP Working Paper No.125. 7 Goyal A, Sharma B (2015) Government expenditure in India: composition, cyclicality and multipliers. IGIDR Working Paper No. 32. IGIDR, Mumbai
Home

Economy Watch: March 2018 27
2.9, thereby confirming the results of some of the earlier studies. These studies highlight that capital expenditure multipliers are higher than those for revenue expenditures.
We have utilized an input-output framework for deriving the multipliers. This serves two purposes: First, it can provide a more detailed disaggregation of purchase of consumption or capital goods and, second, it can be used to generate the sector-wise long-term multiplier effects of an increase in the Government’s budgetary outlay. Table 19 shows sectoral fiscal multipliers, which indicate the sector-wise responsiveness of the incremental government expenditure measured at 2011-12 prices. A high multiplier value indicates the presence of large indirect effects resulting from induced demands given the initial stimulus. The overall fiscal multiplier is 2.1, which is in line with the results given in some of the macro studies that were discussed earlier. The sectors showing high level of real impact include construction, which has the highest impact in terms of the magnitude measured at constant prices. It also has a high multiplier at 2.5. Leaving defence, which shows only direct impact with a multiplier of 1.0, the next important sector is transport, which has a multiplier of 9.0.
Table 19: Sectoral fiscal multipliers
Sl. No
Sector Initial change in domestic
demand (INR crore)
Final change in domestic
demand including
indirect effects
(INR crore)
Sectoral fiscal
multipliers (Final
change over initial
change) 1 Agriculture and allied activates 890,504 3,124,797 3.5 2 Manufacturing of food items 723,440 1,322,785 1.8 3 Clothing and footwear 353,428 577,016 1.6 4 Manufacturing of electronic and electrical equipment 356,634 1,238,215 3.5 5 Manufacturing of transport equipment 603,061 758,368 1.3 6 Pharma and other cosmetics 69,487 697,892 10.0 7 Manufacturing of paper, wood and furniture 172,272 953,589 5.5 8 Manufacturing of jewelry and other products 642,533 2,785,768 4.3 9 Construction (including iron and steel and cement, paints) 2,278,373 5,735,723 2.5 10 Electricity, gas and water supply 157,047 1,062,630 6.8
11 Transport including crude petroleum and petroleum products 396,060 3,555,983 9.0
12 Trade, hotels and communications 284,216 677,447 2.4 13 Financial, insurance and real estate 757,991 1,584,187 2.1 14 Professional services including education and health 2,186,279 2,542,870 1.2 15 Community, social and personal services 611,025 623,886 1.0
16 Public administration and defense 4,634,134 4,634,134 1.0
Total 1,5116,483 31,875,289 2.1 The Central Government’s expenditure priorities, focusing on agriculture, construction and transport, are well justified as these sectors are characterized by relatively high multipliers at 3.5, 2.5 and 9 respectively. Conclusion Our analysis of the Center’s FY19 Budget highlights the following:
a. Given the constraints on budgetary resources, including the need to limit the slippage of fiscal deficit relative to the target, the Central Government has relied heavily on the use of extra-budgetary resources to finance outlays on selected priority sectors.
b. This Budget has the potential of stimulating the economy through the increase of these extra-budgetary resources and by the choices made for sectoral emphasis. In particular, sectors such as agriculture, construction and transport are characterized by high fiscal multipliers.
c. Earlier macro studies as well as our sectorally disaggregated study indicate that in the Indian context, the Government’s capital expenditure multiplier is higher than that of revenue expenditure. In this sense, the move toward reducing the relative share of capital expenditure in total expenditure is required to be reversed in the future so as to optimize the stimulating effect of the Government budget.
Home
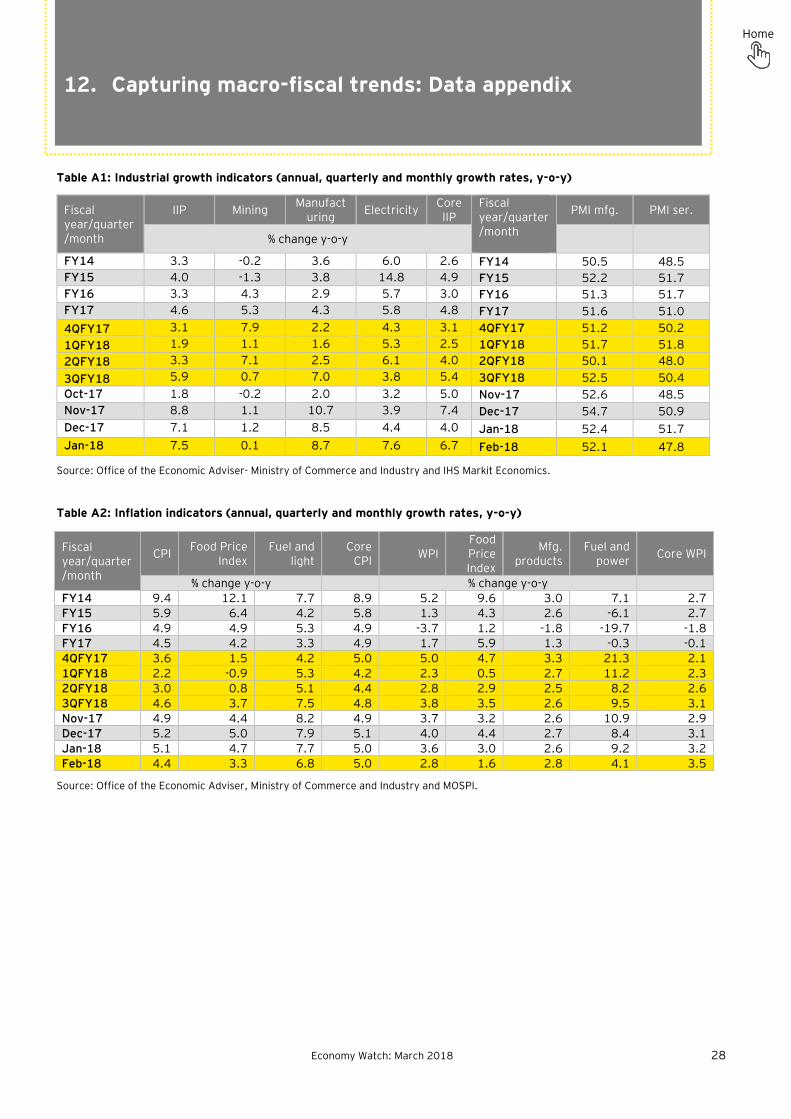
Economy Watch: March 2018 28
Table A1: Industrial growth indicators (annual, quarterly and monthly growth rates, y-o-y)
Fiscal year/quarter/month
IIP Mining Manufacturing Electricity Core
IIP Fiscal year/quarter/month
PMI mfg. PMI ser.
% change y-o-y
FY14 3.3 -0.2 3.6 6.0 2.6 FY14 50.5 48.5 FY15 4.0 -1.3 3.8 14.8 4.9 FY15 52.2 51.7 FY16 3.3 4.3 2.9 5.7 3.0 FY16 51.3 51.7 FY17 4.6 5.3 4.3 5.8 4.8 FY17 51.6 51.0 4QFY17 3.1 7.9 2.2 4.3 3.1 4QFY17 51.2 50.2 1QFY18 1.9 1.1 1.6 5.3 2.5 1QFY18 51.7 51.8 2QFY18 3.3 7.1 2.5 6.1 4.0 2QFY18 50.1 48.0 3QFY18 5.9 0.7 7.0 3.8 5.4 3QFY18 52.5 50.4 Oct-17 1.8 -0.2 2.0 3.2 5.0 Nov-17 52.6 48.5 Nov-17 8.8 1.1 10.7 3.9 7.4 Dec-17 54.7 50.9 Dec-17 7.1 1.2 8.5 4.4 4.0 Jan-18 52.4 51.7 Jan-18 7.5 0.1 8.7 7.6 6.7 Feb-18 52.1 47.8
Source: Office of the Economic Adviser- Ministry of Commerce and Industry and IHS Markit Economics. Table A2: Inflation indicators (annual, quarterly and monthly growth rates, y-o-y)
Source: Office of the Economic Adviser, Ministry of Commerce and Industry and MOSPI.
12. Capturing macro-fiscal trends: Data appendix
Fiscal year/quarter/month
CPI Food Price Index
Fuel and light
Core CPI WPI
Food Price Index
Mfg. products
Fuel and power Core WPI
% change y-o-y % change y-o-y FY14 9.4 12.1 7.7 8.9 5.2 9.6 3.0 7.1 2.7 FY15 5.9 6.4 4.2 5.8 1.3 4.3 2.6 -6.1 2.7 FY16 4.9 4.9 5.3 4.9 -3.7 1.2 -1.8 -19.7 -1.8 FY17 4.5 4.2 3.3 4.9 1.7 5.9 1.3 -0.3 -0.1 4QFY17 3.6 1.5 4.2 5.0 5.0 4.7 3.3 21.3 2.1 1QFY18 2.2 -0.9 5.3 4.2 2.3 0.5 2.7 11.2 2.3 2QFY18 3.0 0.8 5.1 4.4 2.8 2.9 2.5 8.2 2.6 3QFY18 4.6 3.7 7.5 4.8 3.8 3.5 2.6 9.5 3.1 Nov-17 4.9 4.4 8.2 4.9 3.7 3.2 2.6 10.9 2.9 Dec-17 5.2 5.0 7.9 5.1 4.0 4.4 2.7 8.4 3.1 Jan-18 5.1 4.7 7.7 5.0 3.6 3.0 2.6 9.2 3.2 Feb-18 4.4 3.3 6.8 5.0 2.8 1.6 2.8 4.1 3.5
Home

Economy Watch: March 2018 29
Table A3: Fiscal indicators (annual growth rates, cumulated monthly growth rates, y-o-y)
Source: Monthly Accounts, Controller General of Accounts-Government of India, Union Budget Documents. *Includes corporation tax and income tax **includes customs duty, excise duty, service tax, CGST, UTGST, IGST and GST compensation cess.
Source: Monthly Accounts, Controller General of Accounts-Government of India, Union Budget Documents.
Fiscal year/month
Gross tax revenue
Corporate tax
Income tax Direct taxes*
Indirect taxes**
Fiscal deficit Revenue deficit
% of GDP % of GDP FY15 9.3 8.7 8.7 8.7 9.8 4.0 2.9 FY16 17.0 6.0 8.5 6.9 30.1 3.9 2.5 FY17 17.9 6.7 21.5 12.3 21.6 3.5 2.1 FY18 (RE over Budget Actuals) 13.4 16.3 21.0 18.3 8.6 3.5 2.6
Cumulated growth (%, y-o-y) % of budgeted target Jul-17 17.1 24.2 18.8 21.1 13.9 92.4 131.5
Aug-17 20.0 15.5 13.3 14.2 23.6 96.1 133.9
Sep-17 19.9 11.3 16.4 13.5 23.0 91.3 118
Oct-17 18.9 11.8 16.2 13.8 21.1 96.1 124.7
Nov-17 16.5 12.4 15.3 13.7 18.3 112.0 152.2
Dec-17 17.3 17.1 17.0 17.1 17.3 104.4 (RE) 102.2 (RE)
Jan-18 17.0 19.0 17.5 18.4 15.6 113.7 (RE) 109.4 (RE)
Fiscal Year/ Month CGST UTGST IGST GST compensation cess Total GST
INR crore FY18 (RE) 2, 21, 400 - 1, 61, 900 61, 331 4, 44, 631
FY19 (BE) 6, 03, 900 - 50, 000 90, 000 7, 43, 900 Monthly tax collection (INR crore)
Jul-17 - - 34 - 34
Aug-17 15, 253 - 70,918 7,749 93,920
Sep-17 15, 135 - 30, 395 8024 53, 554
Oct-17 31, 187 21 18, 370 8031 57, 609
Nov-17 23, 839 75 18, 627 7103 49, 644
Dec-17 24, 215 216 17, 142 7899 49, 472
Jan-18 23, 133 193 19, 402 8024 50, 752
Home

Economy Watch: March 2018 30
Table A4: Monetary and financial indicators (annual, quarterly and monthly growth rates, y-o-y)
Fiscal year/ month
Repo rate
(end of period)
Fiscal year/ quarter/ month
M1 M3 Bank credit
Agg. deposits
10 yr. Govt. B
Yield Net FDI Net FPI FX
reserves
% % change y-o-y % US$ billion
US$ billion
US$ billion
Apr-17 6.25 FY14 8.5 13.4 14.9 14.2 8.3 21.6 4.8 304.2 May-17 6.25 FY15 11.3 10.9 11.0 12.1 8.3 31.3 42.2 341.6 Jun-17 6.25 FY16 13.5 10.1 9.7 10.5 7.7 36.0 -4.1 355.6 Jul-17 6.25 FY17 3.1 10.1 7.9 11.6 7.0 35.6 7.6 370.0 Aug-17 6.00 4QFY17 3.1 10.1 5.8 13.6 7.0 5.0 10.8 370.0 Sep-17 6.00 1QFY18 1.3 7.0 5.1 10.6 7.0 7.2 12.5 386.5 Oct-17 6.00 2QFY18 1.6 5.6 6.1 9.3 6.6 12.4 2.1 399.7 Nov-17 6.00 3QFY18 45.8 10.6 9.0 5.3 7.1 4.6 5.3 409.4 Dec-17 6.00 Oct-17 2.7 6.5 6.8 8.7 6.9 1.6 3.0 398.8 Jan-18 6.00 Nov-17 35.0 8.8 9.3 3.0 7.1 -1.3 2.7 400.7 Feb-18 6.00 Dec-17 45.8 10.6 10.6 4.0 7.4 4.3 -0.4 409.4
Mar-18 6.00 Jan-18 39.3 10.8 10.2 4.6 7.2 1.9 3.5 417.8
Source: Database on Indian Economy-RBI.
Table A5: External trade and global growth
Source: Database on Indian Economy- RBI, Pink Sheet-World Bank and IMF World Economic Outlook October 2017, IMF World Economic Outlook Update January 2018; *forecasted data as according to October 2017 issue of WEO, **forecasted data as according to January 2018 update of WEO.
External trade indicators (annual, quarterly and monthly growth rates)
Global growth (annual)
Fiscal year/quarter/month
Exports Imports Trade balance
Ex. rate (avg.)
Crude prices (avg.)
Coal prices (avg.)
Calendar year
World GDP
Adv. econ.
Emer. econ.
% change y-o-y US$ billion INR/US$ US$/ bbl
US$/ mt
% change y-o-y
FY14 4.7 -8.3 -135.8 60.5 103.7 76.1 2011 4.2 1.7 6.3 FY15 -1.3 -0.5 -137.7 61.1 83.2 65.9 2012 3.5 1.2 5.3 FY16 -15.5 -15.0 -117.7 65.5 46.0 52.7 2013 3.3 1.2 5.0 FY17 5.0 0.0 -105.6 67.1 47.9 70.4 2014 3.4 1.9 4.6 4QFY17 16.8 25.6 -29.2 67.0 52.9 79.8 2015 3.4 2.1 4.3 1QFY18 10.6 32.8 -40.1 64.5 49.4 75.3 2016 3.2 1.7 4.3 2QFY18 13.4 19.1 -32.1 64.3 50.2 85.9 2017** 3.7 2.3 4.7 3QFY18 13.1 16.1 -42.7 64.7 58.7 90.0 2018** 3.9 2.3 4.9 Nov-17 30.5 19.6 -13.8 64.9 59.9 89.1 2019** 3.9 2.2 5.0 Dec-17 12.4 21.1 -14.9 64.2 61.2 92.0 2020* 3.7 1.7 5.0 Jan-18 9.1 26.1 -16.3 63.6 66.2 95.3 2021* 3.8 1.7 5.1 Feb-18 4.5 10.4 -12.0 64.3 63.5 92.1 2022* 3.8 1.7 5.0
Home

Economy Watch: March 2018 31
Table A6: Macroeconomic aggregates (annual and quarterly real growth rates, % change y-o-y)
Fiscal year/quarter Output: Major sectors IPD inflation
Fiscal year/quarter GVA Agr. Ming. Mfg. Elec. Cons. Trans. Fin. Publ
. GVA
FY15 7.2 -0.2 9.7 7.9 7.2 4.3 9.4 11.0 8.3 3.6
FY16 8.1 0.6 13.8 12.8 4.7 3.7 10.3 10.9 6.1 1.0
FY17 (1st RE) 7.1 6.3 13.0 7.9 9.2 1.3 7.2 6.0 10.7 2.9
FY18 (2nd AE) 6.4 3.0 3.0 5.1 7.3 4.3 8.3 7.2 10.1 3.0
3QFY16 7.3 -2.3 12.0 14.8 3.9 4.3 10.4 10.2 6.9 1.8
4QFY16 8.7 1.5 10.5 12.7 7.6 6.0 12.8 9.0 6.7 1.6
1QFY17 8.3 4.3 10.5 9.9 12.4 3.0 8.9 10.5 7.7 1.2
2QFY17 7.2 5.5 9.1 7.7 7.1 3.8 7.2 8.3 8.0 2.3
3QFY17 6.9 7.5 12.1 8.1 9.5 2.8 7.5 2.8 10.6 2.8
4QFY17 5.6 5.2 6.4 5.3 6.1 -3.7 6.5 2.2 17.0 5.4
1QFY18 5.6 2.7 1.8 -1.8 7.1 1.5 8.4 8.9 13.2 2.3
2QFY18 6.2 2.7 7.1 6.9 7.7 2.8 9.3 6.4 5.6 2.8
3QFY18 6.7 4.1 -0.1 8.1 6.1 6.8 9.0 6.7 7.2 3.8
Expenditure components IPD inflation Fiscal year/quarter GDP PCE GCE GFCF EX IM GDP
FY15 7.4 6.4 7.6 2.6 1.8 0.9 3.3
FY16 8.2 7.4 6.8 5.2 -5.6 -5.9 2.1
FY17 (1st RE) 7.1 7.3 12.2 10.1 5.0 4.0 3.5
FY18 (2nd AE) 6.6 6.1 10.9 7.6 4.4 9.9 3.0
3QFY16 7.3 9.9 6.4 4.9 -9.1 -10.1 2.2
4QFY16 9.0 11.8 2.4 3.9 -1.6 -3.7 1.6
1QFY17 8.1 8.3 8.3 15.9 3.6 0.1 2.7
2QFY17 7.6 7.5 8.2 10.5 2.4 -0.4 2.9
3QFY17 6.8 9.3 12.3 8.7 6.7 10.1 3.8
4QFY17 6.1 7.3 31.9 -2.1 10.3 11.9 6.0
1QFY18 5.7 6.6 17.1 1.6 5.9 16.0 3.3
2QFY18 6.5 6.6 2.9 6.9 6.5 5.4 3.4
3QFY18 7.2 5.6 6.1 12.0 2.5 8.7 4.4
Source: National Accounts Statistics, MOSPI.
Home
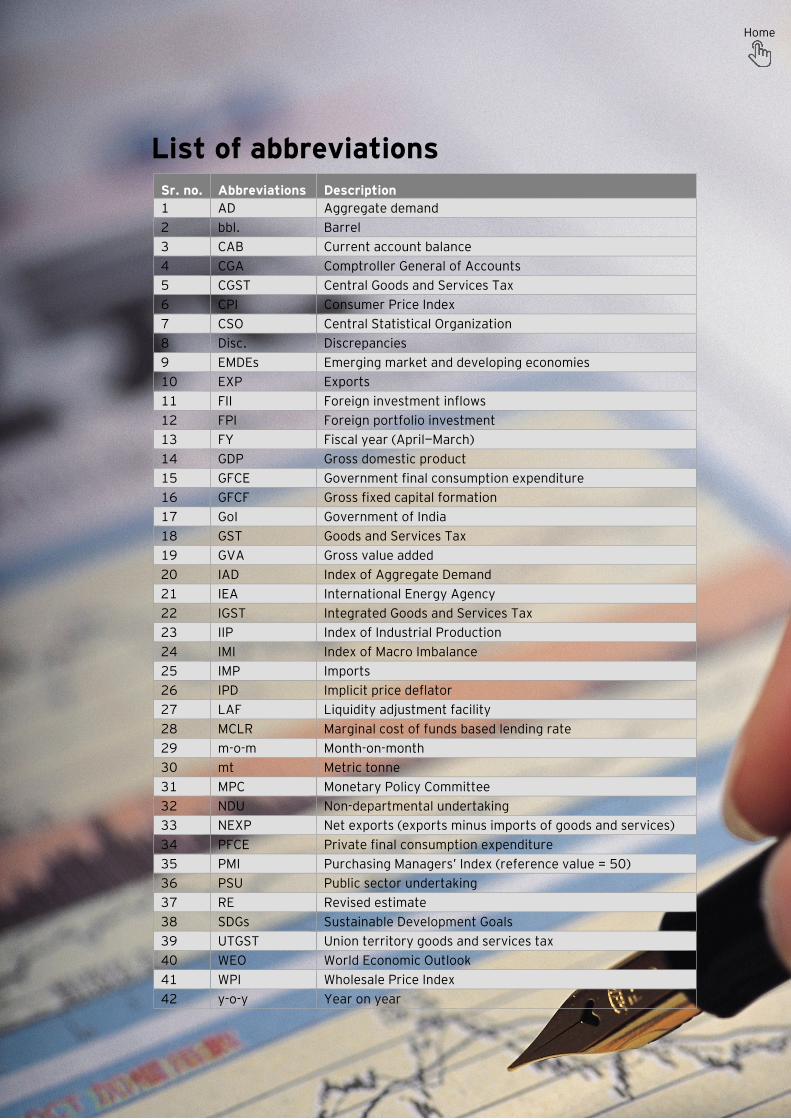
Economy Watch: March 2018 32
List of abbreviations
Sr. no. Abbreviations Description 1 AD Aggregate demand 2 bbl. Barrel 3 CAB Current account balance 4 CGA Comptroller General of Accounts 5 CGST Central Goods and Services Tax 6 CPI Consumer Price Index 7 CSO Central Statistical Organization 8 Disc. Discrepancies 9 EMDEs Emerging market and developing economies 10 EXP Exports 11 FII Foreign investment inflows 12 FPI Foreign portfolio investment 13 FY Fiscal year (April—March) 14 GDP Gross domestic product 15 GFCE Government final consumption expenditure 16 GFCF Gross fixed capital formation 17 GoI Government of India 18 GST Goods and Services Tax 19 GVA Gross value added 20 IAD Index of Aggregate Demand 21 IEA International Energy Agency 22 IGST Integrated Goods and Services Tax 23 IIP Index of Industrial Production 24 IMI Index of Macro Imbalance 25 IMP Imports 26 IPD Implicit price deflator 27 LAF Liquidity adjustment facility 28 MCLR Marginal cost of funds based lending rate 29 m-o-m Month-on-month 30 mt Metric tonne 31 MPC Monetary Policy Committee 32 NDU Non-departmental undertaking 33 NEXP Net exports (exports minus imports of goods and services) 34 PFCE Private final consumption expenditure 35 PMI Purchasing Managers’ Index (reference value = 50) 36 PSU Public sector undertaking 37 RE Revised estimate 38 SDGs Sustainable Development Goals 39 UTGST Union territory goods and services tax 40 WEO World Economic Outlook 41 WPI Wholesale Price Index 42 y-o-y Year on year
Home

Economy Watch: March 2018 33
Hyderabad Oval Office, 18, iLabs Centre Hitech City, Madhapur Hyderabad - 500 081 Tel: + 91 40 6736 2000 Fax: + 91 40 6736 2200 Jamshedpur 1st Floor, Shantiniketan Building Holding No. 1, SB Shop Area Bistupur, Jamshedpur – 831 001 Tel: +91 657 663 1000 BSNL: +91 657 223 0441 Kochi 9th Floor, ABAD Nucleus NH-49, Maradu PO Kochi - 682 304 Tel: + 91 484 304 4000 Fax: + 91 484 270 5393 Kolkata 22 Camac Street 3rd Floor, Block ‘C’ Kolkata - 700 016 Tel: + 91 33 6615 3400 Fax: + 91 33 2281 7750 Mumbai 14th Floor, The Ruby 29 Senapati Bapat Marg Dadar (W), Mumbai - 400 028 Tel: + 91 22 6192 0000 Fax: + 91 22 6192 1000 5th Floor, Block B-2 Nirlon Knowledge Park Off. Western Express Highway Goregaon (E) Mumbai - 400 063 Tel: + 91 22 6192 0000 Fax: + 91 22 6192 3000 Pune C-401, 4th floor Panchshil Tech Park Yerwada (Near Don Bosco School) Pune - 411 006 Tel: + 91 20 6603 6000 Fax: + 91 20 6601 5900
Ahmedabad 2nd floor, Shivalik Ishaan Near C.N. Vidhyalaya Ambawadi Ahmedabad - 380 015 Tel: + 91 79 6608 3800 Fax: + 91 79 6608 3900 Bengaluru 6th, 12th & 13th floor “UB City,” Canberra Block No. 24 Vittal Mallya Road Bengaluru - 560 001 Tel: + 91 80 4027 5000 + 91 80 6727 5000 + 91 80 2224 0696 Fax: + 91 80 2210 6000 Ground Floor, ‘A’ wing Divyasree Chambers # 11, O’Shaughnessy Road Langford Gardens Bengaluru - 560 025 Tel: +91 80 6727 5000 Fax: +91 80 2222 9914 Chandigarh 1st Floor, SCO: 166-167 Sector 9-C, Madhya Marg Chandigarh - 160 009 Tel: +91 172 331 7800 Fax: +91 172 331 7888 Chennai Tidel Park, 6th & 7th Floor A Block, No. 4, Rajiv Gandhi Salai Taramani, Chennai - 600 113 Tel: + 91 44 6654 8100 Fax: + 91 44 2254 0120 Delhi NCR Golf View Corporate Tower B Sector 42, Sector Road Gurgaon - 122 002 Tel: + 91 124 464 4000 Fax: + 91 124 464 4050 3rd & 6th Floor, Worldmark-1 IGI Airport Hospitality District Aerocity, New Delhi - 110 037 Tel: + 91 11 6671 8000 Fax + 91 11 6671 9999 4th & 5th Floor, Plot No 2B Tower 2, Sector 126 NOIDA - 201 304 Gautam Budh Nagar, U.P. Tel: + 91 120 671 7000 Fax: + 91 120 671 7171
Our offices
Ernst & Young LLP
EY | Assurance | Tax | Transactions | Advisory
About EY
EY is a global leader in assurance, tax, transaction and advisory services. The insights and quality services we deliver help build trust and confidence in the capital markets and in economies the world over. We develop outstanding leaders who team to deliver on our promises to all of our stakeholders. In so doing, we play a critical role in building a better working world for our people, for our clients and for our communities.
EY refers to the global organization, and may refer to one or more, of the member firms of Ernst & Young Global Limited, each of which is a separate legal entity. Ernst & Young Global Limited, a UK company limited by guarantee, does not provide services to clients. For more information about our organization, please visit ey.com.
Ernst & Young LLP is one of the Indian client serving member firms of EYGM Limited. For more information about our organization, please visit www.ey.com/in.
Ernst & Young LLP is a Limited Liability Partnership, registered under the Limited Liability Partnership Act, 2008 in India, having its registered office at 22 Camac Street, 3rd Floor, Block C, Kolkata - 700016
© 2018 Ernst & Young LLP. Published in India.
All Rights Reserved.
EYIN1803-017
ED None
This publication contains information in summary form and is therefore intended for general guidance only. It is not intended to be a substitute for detailed research or the exercise of professional judgment. Neither Ernst & Young LLP nor any other member of the global Ernst & Young organization can accept any responsibility for loss occasioned to any person acting or refraining from action as a result of any material in this publication. On any specific matter, reference should be made to the appropriate advisor.