Economics@ANZ ANZ International Economics Monthly 2008.pdf · Country Updates .....10 Economics@ANZ...
26
Authors: Amy Auster Head of International Economics +61 3 9273 5417 [email protected] Katie Dean Senior Economist, International +61 3 9273 1381 [email protected] Jasmine Robinson Senior Economist, International +61 3 9273 6289 [email protected] Amber Rabinov Economist, International +61 3 9273 4853 [email protected] Mark Rodrigues Senior Economist, Australia +61 3 9273 6286 [email protected] Riki Polygenis Economist, Australia +61 3 9273 4060 [email protected] January 2008 ANZ International Economics Monthly Looking into 2008 … Consumer prices up, Asset prices down Our Vision: For Economics@ANZ to be the most respected, sought-after and commercially valued source of economics research and information on Australia, New Zealand, the Pacific and Asia. Inside: Main article...............................1 Financial Markets Update............5 FX and Policy Rate Forecasts.......7 Macro Economic Forecasts ..........8 LT FC Govt. Bond Ratings ...........9 Country Updates ..................... 10 Economics@ANZ The global outlook for the first half of 2008 hinges on one key variable: Oil prices. Through the turmoil of December, as the Google word count on “recession” mushroomed, oil prices have not budged. Why is oil the one to watch, and what do we expect to happen? • The turmoil in the financial markets that began in August is spreading, as evidenced by widening credit spreads, a permanent rise in market volatility, new measures by central banks to provide market liquidity, and, most recently, a sell off in the global equity markets. Asset markets are desperate for the costs of funds to be lowered to help boost returns and improve the prospects for growth and consumption. • At the same time, the annual rate of headline consumer price inflation in the G7 has risen from 1.58% in August to 2.66% as of October. The rise in headline inflation is mainly due to higher energy and food prices, as the core measure of inflation continues to decline. With oil prices at high levels despite slowing US growth, however, central banks cannot ascertain whether higher CPI is transitory. Continued high oil prices are a key concern, with evidence of more pass through into food prices. • The Fed, ECB and BOE therefore face two conflicting mandates. The first mandate is price stability, and the second is financial system stability. The first mandate suggests higher interest rates, and the second would send interest rates lower. Financial system stability does not equate to asset price stability, but the rapid drop in asset prices in the credit market over the past few months is now becoming a systemic issue. • However, there are other policy tools that can be used to stabilise the financial system, as recent central bank actions have shown. In contrast, there is no substitute for interest rates to control consumer price inflation. In the choice now taking shape between CPI and API, the targeting of CPI will win. Only a sharp and sustained drop in oil prices could preserve the rate of growth (and perhaps present level of) asset prices we have witnessed over the past few years. G7 Inflation and equity markets 1.0 1.5 2.0 2.5 3.0 00 01 02 03 04 05 06 07 Annual % change (trend) Core Headline G7 inflation Sources: Bloomberg, Datastream and Economics@ANZ G7 equity movements 60 70 80 90 100 110 120 130 140 150 00 01 02 03 04 05 06 07 Jan 99=100 T .
Transcript of Economics@ANZ ANZ International Economics Monthly 2008.pdf · Country Updates .....10 Economics@ANZ...

Authors:
Amy Auster Head of International Economics +61 3 9273 5417 [email protected]
Katie Dean Senior Economist, International +61 3 9273 1381 [email protected]
Jasmine Robinson Senior Economist, International +61 3 9273 6289 [email protected]
Amber Rabinov Economist, International +61 3 9273 4853 [email protected]
Mark Rodrigues Senior Economist, Australia +61 3 9273 6286 [email protected]
Riki Polygenis Economist, Australia +61 3 9273 4060 [email protected]
January 2008
ANZ International Economics Monthly
Looking into 2008 …
Consumer prices up, Asset prices down
Our Vision:
For Economics@ANZ to be the most respected, sought-after and commercially valued source of economics research and information on Australia, New Zealand, the Pacific and Asia.
Inside:
Main article...............................1
Financial Markets Update............5
FX and Policy Rate Forecasts.......7
Macro Economic Forecasts ..........8
LT FC Govt. Bond Ratings ...........9
Country Updates .....................10
Economics@ANZ
The global outlook for the first half of 2008 hinges on one key variable: Oil prices. Through the turmoil of December, as the Google word count on “recession” mushroomed, oil prices have not budged. Why is oil the one to watch, and what do we expect to happen?
• The turmoil in the financial markets that began in August is spreading, as evidenced by widening credit spreads, a permanent rise in market volatility, new measures by central banks to provide market liquidity, and, most recently, a sell off in the global equity markets. Asset markets are desperate for the costs of funds to be lowered to help boost returns and improve the prospects for growth and consumption.
• At the same time, the annual rate of headline consumer price inflation in the G7 has risen from 1.58% in August to 2.66% as of October. The rise in headline inflation is mainly due to higher energy and food prices, as the core measure of inflation continues to decline. With oil prices at high levels despite slowing US growth, however, central banks cannot ascertain whether higher CPI is transitory. Continued high oil prices are a key concern, with evidence of more pass through into food prices.
• The Fed, ECB and BOE therefore face two conflicting mandates. The first mandate is price stability, and the second is financial system stability. The first mandate suggests higher interest rates, and the second would send interest rates lower. Financial system stability does not equate to asset price stability, but the rapid drop in asset prices in the credit market over the past few months is now becoming a systemic issue.
• However, there are other policy tools that can be used to stabilise the financial system, as recent central bank actions have shown. In contrast, there is no substitute for interest rates to control consumer price inflation. In the choice now taking shape between CPI and API, the targeting of CPI will win. Only a sharp and sustained drop in oil prices could preserve the rate of growth (and perhaps present level of) asset prices we have witnessed over the past few years.
G7 Inflation and equity markets
1.0
1.5
2.0
2.5
3.0
00 01 02 03 04 05 06 07
Annual % change (trend)
Core
Headline
G7 inflation
Sources: Bloomberg, Datastream and Economics@ANZ
G7 equity movements
60
70
80
90
100
110
120
130
140
150
00 01 02 03 04 05 06 07
Jan 99=100
T
.

Economics@ANZ ANZ International Economics Monthly – January 2008
Page 2
Market turmoil becomes systemic December has been a dismal month – so dismal, in fact, that it has caused a careful re-examination of our economic outlook for 2008 and is mainly to blame for the delayed release of this publication. The earthquake of subprime defaults and the structured credit market is the epicentre of the disaster, but aftershocks are continuing to reverberate and even deepen across the rest of the globe. The charts below highlight two indicators of distress. On the left, the VIX index of volatility in the S&P500 equity market in the United States has ticked up again after falling briefly when the US Federal Reserve cut interest rates in mid-December. The right-hand chart shows how credit default swaps – representing the risk of default in corporate bonds – have widened markedly over the past month, even for stalwart companies such as Kraft Foods and Union Pacific.
Distress evident in equity and credit markets
Sources: Bloomberg and Economics@ANZ
0
5
10
15
20
25
30
35
Jan-07 Apr-07 Jul-07 Nov-07
Index
Vix index
0
10
20
30
40
50
60
70
80
90
100
Jun-07
Aug-07
Oct-07
Dec-07
DisneyUnion PacificAT&T CorpKraft FoodsHome Depot
Basis points
Credit default swaps for major US corporates
Pessimism in the asset markets in the US continues to spread, despite falling funding costs. The rate for 30-day LIBOR has fallen by 40 bps since August; 6-month commercial paper costs 4.55% now versus 5.22% as of 1 August; and the US Treasury 10-year bond suggests a risk free rate of only 4.0%. Yet, liquidity still seems short, and the reason why is because the crisis is now systemic. Have a look at the balance sheet of the US banking system.
Composition of US bank system credit, end-November 2008
Source: US Federal Reserve and Economics@ANZ
10.3
12.6
13.2
33.1
7.4
2.6
6.1
8.9
US Gov't securities
Other securities
Corporate & industrialloansReal estate loans
Consumer loans
Security
Other loans
Other assets
As the chart shows, credit to the real estate sector comprised 33% of all assets in the balance sheet of the US banking system as of the end of November. With US national average home prices having declined by 4.5% over the past year, and prospects for commercial property bleak in many locations, the value of these assets appears to be in decline.
The total exposure to the real estate sector becomes complicated by the off-balance sheet holdings of mortgage-backed securities, most often referred to in the context of this crisis as collateralised debt obligations (CDOs) held by Structured Investment Vehicles (SIVs). The announced write-downs of these assets among major banks now total about US$60 bn, which is not yet at the US$100 bn originally estimated by analysts. New estimates suggest that write-offs could reach US$500 bn.
Estimated and announced write downs
1.9RBS
2.8Barclays
4.3Goldman Sachs
3.3Deutsche Bank
7.2UBS
10.2Merrill Lynch
64.0Citigroup
Estimated write-down (US$ bn)
Institution
Analysts estimate of write-downs as of 1 November 2007
Announced write downs as of 20 December 2007
3.1Deutsche Bank
3.0Bank of America
2.6RBS
9.4Morgan Stanley
1.0Barclays
1.9Bear Stearns
3.4HSBC
13.4UBS8.4Merrill Lynch8.0Citigroup
Announced write-down (US$ bn)
Institution
The ever-widening hole in bank’s balance sheets has prompted a scramble for funding. As the chart below shows, banks’ borrowing from other US institutions has dropped sharply since September. Deposits, which represent 68% of the funding base, have compensated somewhat. Banks have also raised US$22 bn in funding (so far) from the sovereign wealth funds of the UAE, China and Singapore, and are also accessing liquidity from central banks.
Growth in liabilities of US commercial banks
-10
0
10
20
30
40
50
Jan-07 Mar-07 May-07 Jul-07 Sep-07 Nov-07
Deposits
From US Banks
From Others
% annual change
The present financial crisis in the US is widely being referred to as a “credit crunch,” which may sound odd considering that credit growth in the system is
Economics@ANZ ANZ International Economics Monthly – January 2008
Page 3
still rising at an annual rate in excess of 10% per annum. The quality and desirability of that credit growth must be questioned, however. The below chart shows that recent credit growth has been strong in “other securities” and in corporate and industrial loans. The cause of the growth is unclear, but the growth of “other securities” could represent the forced re-intermediation of the CDOs that were once held off balance sheet. Roughly US$231 bn of “other securities” have come onto bank’s balance sheets since the end of July, funded primarily through a rise in deposits and increased offshore borrowings by banks. That would cover the US$206 bn of senior debt issued by SIVs that are sponsored by major banks, as estimated by S&P.
Other securities are the credit crunch?
-20
-10
0
10
20
30
40
50
60
70
80
90
100
Jan-07 Mar-07 May-07 Jul-07 Sep-07 Nov-07
US government securities
Other securities
Corporate & industrial loans
Real estate loans
Consumer loans
Total
% annual change
The structured credit market was the start of the problem, but it looks like it will not be the end. Meanwhile, the crunch is so deep that it is affecting the ability of the financial system to function. Funding costs have risen, not just in the US but elsewhere. The below chart shows the rise in wholesale funding costs in Australia since July.
Australia’s rise in funding costs
12
Source: Reserve Bank of Australia and Economics@ANZ
0 10 20 30 40 50 60 70 80
"Low Doc" variablemortgage rate*
"Prime" variablemortgage rate*
3y swap spread
10y swap spread
3m BBSW/3m OIS spread
ANZ sub debt (5y)
RBA cash rate
Change (bps)*rates are approximate
Rise in wholesale funding costs are persistent
Fed sending LOL As the lenders of last resort to the banking system, the Fed – as well as the ECB and BOE – have spent the past two months working out how to return stability to the financial system. The Fed cut its discount window rate in August, and the ECB and the BOE pumped billions in funding into the market.
The BOE assisted with failing Northern Rock, and the Fed extended the term structure of its open market operations, allowing for repos into 2008. Most recently, the Fed created a term auction facility through which US and non-US banks could access credit at below market rates; on 17 December, the Fed sold US$20 bn in 28-day credit at a rate of 4.65%, amid total bids amounting to US$61 bn.
But the news keeps getting worse. In late December, S&P slashed the credit rating of six bond insurers from A- to CCC. Ambac Financial Group, known as ACA, and MBIA Insurance Group are two of the largest bond insurers in the world, and together insure US$1.2 trillion of outstanding bonds. The downgrades were the result of the erosion of capital due to the impact of defaults on the CDOs that they had insured. Most institutional investors require that their portfolios to be insured, as a backup in the event of default of the issuer. The downgrade of the insurers strips the insurance, lowering the value of the bonds and making it all the more difficult for new issuers to tap the market. The ructions felt by this action may be long and deep, unless it is quickly resolved. The liquidity shortage that had been confined to the money markets has staked its claim on the long-term bond markets.
Given the depth of the funding problem in the banking system in the US, the call among financial market economists for aggressive cuts to the Fed funds rate can be well understood. The problem is that the Fed funds rate is also the primary signal of monetary policy, and must be balanced against the trend of inflation in the real economy. And that is where the problems come in. Inflation in the US has not subsided alongside rising concerns about the economy. In fact, it accelerated with annual headline CPI rising from 1.9% in August to 3.5% in October. Core CPI rose from 2.10% to 2.14% over the same period, while the core PCE deflator also rose from 1.9% to 2.01%. The story is the same across the G7, where inflation has accelerated markedly in the past few months. This combined with the cuts to the US Fed funds rate has brought real interest rates in the G7 to 1.3% as of October.
G7 CPI and real interest rate
1.0
1.5
2.0
2.5
3.0
00 01 02 03 04 05 06 07
Annual % change (trend)
Core
Headline
G7 inflation
Sources: Datastream and Economics@ANZ
G7 interest rates
-1
0
1
2
3
4
5
6
00 01 02 03 04 05 06 07
% p.a.
Real cash rate*
Nominal cash rate*
*Using PPP weights
It is evident from the data that the pricing pressure is mainly due to oil and food, as the exclusion-based

Economics@ANZ ANZ International Economics Monthly – January 2008
Page 4
measures of core inflation are much more benign. Exclusion-based measures are based upon the presumption that any increase in oil and/or food prices is related to a short-term lack of supply – due for example to unusual weather patterns – and therefore temporary. However, the rise in oil prices has not been temporary at all, and central bankers are wary of the continued risk of a lagged pass through of higher oil prices into underlying inflation, in this case via increased food prices.1
Hey crude, what’s up? The persistence of high oil prices over the past few months is a bit of a puzzle. To be sure, global supply is tight, with 2007 the lowest year of crude production since 2002. However many observers had assumed that the rise of oil prices to nearly US$100/bbl earlier this year was at least in part due to speculative activity in the oil futures market, in line with rising prices for other commodities. Since September, however, prices for other heavily traded commodities such as copper have declined but oil prices have remained stubbornly around the US$90/bbl mark. Even a relatively mild winter in the US and lack of any notable supply issues from the hurricane season or geopolitical uncertainty have been unable to tumble oil from its lofty perch. Futures curves, at least to date, suggest that nothing will change in this picture any time soon.
Crude oil vs copper prices
50
60
70
80
90
100
110
Jan07
Feb07
Mar07
Apr07
May07
Jun07
Jul07
Aug07
Sep07
Oct07
Nov07
Dec07
5000
5500
6000
6500
7000
7500
8000
8500
9000
Copper (RHS)
Crude oil (WTI) (LHS)
US$/bbl US$/t
Source: Bloomberg
Given the clear rise in volatility and falls in the equity, bond and currency markets, it is difficult to believe that the commodity markets are still full of froth. Assuming speculative activity has declined, the only possible explanation for the continued high price of oil is that there is little expectation that demand will ease substantially in the coming months. This is interesting because the US is responsible for 25% of global oil consumption. A slowing US economy should see fuel demand decline and stocks rise, but this turnaround has been slow to eventuate. Indeed, in the US crude petroleum stocks are falling, in line with seasonal demand.
Meanwhile, oil consumption elsewhere remains strong – either through real-time consumption, or
1 See ANZ Rural & Regional Report “Food Stress”, 16 October 2007
possibly through a hoarding of oil stocks given concerns about energy security and long-term supplies. US consumption of crude fell by 1.3% in 2006 on an annual basis, and this did not affect oil prices. Meanwhile, Middle East and African consumption rose by more than 2.0% and Chinese consumption by 6.7%. A mere 0.7% rise in global consumption in 2006 took oil prices from US$59/bbl to over US$70/bbl at the peak of oil prices in 2006. Even if the US slows further, will there be a commensurate drop in global oil demand such that CPI will be able to decline significantly in 2008?
Oil supply is tight and stocks are falling
1.60
1.62
1.64
1.66
1.68
1.70
1.72
1.74
1.76
1.78
1.80
07 07 07 07 07 07 07 07 07
'000 bbls
2007
2006
US crude petroleum stocks
Sources: DOE, BP World Energy Review, OPEC and Economics@ANZ
World oil supply
-2
-1
0
1
2
3
4
5
91 93 95 97 99 01 03 05 07 09
% annual change Forecasts
Watch out for that lag We do expect oil prices to soften in 2008, falling from US$89/bbl to US$85/bbl by the end of the first quarter and US$82/bbl by the second quarter. Overall, prices are expected to decline by about 10% over the coming year, but that is after a 45% increase over the past year. The decline is unlikely to substantially offset the slower growth and higher inflation that follows higher oil prices with a lag.
The IMF estimates that delayed pass through of a US$10/bbl rise in the price of oil raises core inflation by 0.3 percentage points in the US and Japan, and 0.2 percentage points in the EU, in the following year. As oil prices rose by US$28/bbl this year, the implied rise in core inflation in the US and the EU is at least 0.5 percentage points for 2008. The effect on real GDP growth is worse: a decline of 0.8 percentage points in the US, 0.6 ppt in Japan and 0.5 ppt in the EU.
A more significant fall in the price of oil is required to offset the negative effects on growth and inflation that are headed our way from oil reaching nearly US$100/bbl this year. Unless this occurs, central banks will be forced to allow further asset price deterioration in order to ensure consumer price inflation is kept in check.
Amy Auster Head of International Economics [email protected] +61 3 9273 5417
Katie Dean Senior Economist International [email protected] +61 3 9273 1381

Economics@ANZ ANZ International Economics Monthly – January 2008
Page 5
Financial Markets Update
4.0
4.5
5.0
5.5
6.0
6.5
1 day
15day
30day
60day
4 mth
6 mth
%
1-August-07
30-August-07
26-October-0727-September-07
20-December-07
30-November-07
VIX US$ commercial paper yield curve
5
10
15
20
25
30
35
Jan-07 Apr-07 Jul-07 Oct-07
Index
Source: Bloomberg and Economics@ANZ
Money markets • The final two months of the year have the turmoil in
financial markets worsen. Risk is elevated and liquidity has remained tight amidst a further wave of larger than expected sub-prime related losses and heightened demand for cash in the lead up to year-end.
• December saw the central banks of the US, Europe, England, Canada and Switzerland launch a co-ordinated attempt to ease liquidity pressures by introducing a new temporary term auction facility for short-term funds. Under this facility, the central banks will provide liquidity directly to banks at a lower rate than is offered in interbank markets.
• These actions, together with further cuts in US policy interest rates, have helped to ease funding pressures across some money markets, including the US$ commercial paper market.
Policy rates
0
1
2
3
4
5
6
7
8
9
10
Jun-06 Sep-06 Jan-07 May-07 Sep-07
Korea
Taiwan
% pa.
US
Australia
New Zealand
Japan
China
0
2
4
6
8
10
12
14
Jun-06 Sep-06 Jan-07 May-07 Sep-07
Thailand
Malaysia
Philippines
% pa.
Singapore
Indonesia
Source: Bloomberg
Policy rates
• The Federal Reserve cut the Fed funds rate by 25 bps a piece in November and December and cut the discount rate by a further 25 bps in December. With US consumer spending heading south and the housing market yet to bottom, further cuts in the Fed Funds rate in the new year are highly likely.
• Lower inflation and concerns over the US economy have also prompted the central banks of the Philippines and Indonesia to cut policy interest rates in recent months.
• In contrast, continued strong growth has prompted further monetary tightening in China. Authorities lifted the lending rate by a further 18 bps to 7.47% in December, the sixth interest rate rise this year.
• The RBA and RBNZ have also maintained a hawkish stance in communications, despite the weaker global backdrop.
Government Bond Index
1
2
3
4
5
6
7
8
Oct-06 Feb-07 Jun-07 Oct-07
Hong Kong
Yield (on traded index)
Australia
New Zealand
China
Japan
Korea
US
1
3
5
7
9
11
13
Oct-06 Feb-07 Jun-07 Oct-07
Indonesia
Thailand
Yield (on traded index)
India
Malaysia
Singapore
Source: JPMorgan. Philippines’ index is the 10-year bond yield as
there is no GBI index
Bond markets
• Flight to quality is dominating bond markets at the moment. Safe haven flows, together with the deterioration in the domestic outlook, has pushed US bond yields down sharply.
• However, global bond markets also highlight the ongoing concern with inflation. Rising price pressures has seen bond yields across most of South East Asia as well as Australia and New Zealand drift higher.
• A test for bond markets in the coming months coul come from the recent downgrade in the outlook for the world’s two largest bond insurers. Any downgrade in the actual ratings of these insurers will trigger a re-pricing of all the bonds they insure. This could cause a significant re-pricing of risk across the entire bond market. It is unclear if such elevated risk would outweigh the price of ‘quality’ for US treasury instruments.

Economics@ANZ ANZ International Economics Monthly – January 2008
Page 6
Exchange rates, US$ per local currency unit, indexed
80
85
90
95
100
105
110
115
120
Oct-06 Dec-06 Feb-07 Apr-07 Jul-07 Sep-07 Nov-07
03 Jan 2005 = 100
Korea
Australia
Japan
China
New Zealand
Taiwan
95
100
105
110
115
120
125
130
135
140
Oct-06 Dec-06 Mar-07 May-07 Aug-07 Oct-07
03 Jan 2005 = 100
Indonesia
Singapore
Thailand(onshore rate)
Philippines
Malaysia
Vietnam
Source: Bloomberg and Economics@ANZ
Exchange rates
• Elevated risk aversion is dominating currency markets. This has allowed the US dollar to rebound off its record lows to reach a two-month high in the last week.
• The Japanese yen has been another beneficiary of elevated risk aversion. In contrast, concerns about the domestic outlook have pushed the Euro off its recent highs.
• Hawkish central banks have failed to provide support to either the Australian or New Zealand dollar in recent weeks. Higher yield has not been enough to compensate investors from holding these ‘risky’ currencies. Carry-trades have been unwound and these currencies have subsequently fallen to two-month lows.
• The Chinese yuan meanwhile has continued its slow but steady appreciation against the US dollar. The yuan is on track for a gain of around 6% this year, double the 3% appreciation recorded in 2006.
100
150
200
250
300
350
400
Jun-06 Jul-06 Sep-06 Nov-06 Jan-07 Mar-07 May-07 Jul-07 Sep-07 Nov-07
Gold
Copper
Oil (Tapis)
Jan 2004=100
Base metals
Commodity Prices
Source: Datastream, Bloomberg
Commodities
• Base metal prices have collapsed in recent months, weighed down by the deterioration in the global economy. Copper, a key input into building construction, has been hit particularly hard by the downturn in the US housing market. Having fallen by 22% since early October, prices for this commodity may post an annual fall for 2007, the first annual fall since 2001.
• In contrast, oil prices have continued to climb, trading perilously close to US$100/bbl in recent months. Tight global supply is partly to blame, however demand is also holding up more strongly than in previous periods of US economic weakness. This largely reflects the increased appetite for energy across the developing world.
• Gold has retained its status as the world’s ultimate safe haven and inflation hedge and is now trading at US$800/oz, up nearly 30% from US$630/oz since the start of the year.
Share price indices
100
120
140
160
180
200
220
240
260
280
300
320
340
360
380
400
420
Oct-06
Dec-06
Feb-07
Apr-07
Jun-07
Aug-07
Oct-07
Dec-07
1 Jan 2004 = 100
Korea
Taiwan
China
HK
Aust
India
75
100
125
150
175
200
225
250
275
300
325
350
375
400
425
Oct-06
Dec-06
Feb-07
Apr-07
Jun-07
Aug-07
Oct-07
Dec-07
1 Jan 2004 = 100
Singapore
Malaysia
Indonesia
Philippines
Thailand
Source: Datastream and Economics@ANZ
Equity markets
• Having initially held up well, equity markets are starting to feel the pain from the turmoil in global money markets.
• The Taiwan equity market, which is heavy with stocks that export to the United States, has been hit hardest in the Asian region, dropping 16% since the start of October.
• The stock markets of China, Japan and Singapore have also been hit hard, each dropping by 10% in the last two months. Despite the sharp fall in the mainland equity market, the Hang Seng has held up well, remaining essentially flat in this period.
• The Australian market has dropped 5% since early October but remains 11% higher for the year.

Economics@ANZ ANZ International Economics Monthly – January 2008
Page 7
Foreign Exchange and Policy Rate Forecasts Oct-07 Nov-07 Dec-07 Mar-08 Jun-08 Sep-08 Dec-08
China
USD/CNY, eop 7.51 7.47 7.40 7.40 7.31 7.22 7.13
AUD/CNY, eop 6.66 6.97 6.54 6.58 6.94 6.93 6.63
One year base lending rate 7.29 7.29 7.47 7.65 7.65 7.65 7.65
Hong Kong
USD/HKD, eop 7.77 7.75 7.79 7.78 7.79 7.79 7.79
AUD/HKD, eop 6.90 7.24 6.89 6.92 7.40 7.48 7.24
HKMA discount rate 6.25 6.25 6.00 5.75 5.25 5.25 5.25
India
USD/INR, eop 39.8 39.4 39.6 39.0 38.5 38.0 38.3
AUD/INR, eop 35.3 36.8 35.0 34.7 36.6 36.5 35.6
Repo rate 7.75 7.75 7.75 7.75 7.75 7.75 7.75
Indonesia
USD/IDR, eop 9,105 9,052 9,365 8,950 8,875 8,800 8,850
AUD/IDR, eop 8,084 8,455 8,282 7,966 8,431 8,448 8,231
BI rate 8.25 8.25 8.00 8.00 8.00 8.00 8.00
Korea
USD/KRW, eop 915 902 925 900 890 880 875
AUD/KRW, eop 813 843 818 801 846 845 814
Overnight call rate 5.00 5.00 5.00 5.00 5.00 5.00 5.00
Malaysia
USD/MYR, eop 3.41 3.33 3.36 3.35 3.34 3.33 3.32
AUD/MYR, eop 3.03 3.11 2.97 2.98 3.17 3.20 3.09
Overnight policy rate 3.50 3.50 3.50 3.50 3.50 3.50 3.50
Philippines
USD/PHP, eop 44.9 43.6 42.4 42.0 41.5 41.0 42.0
AUD/PHP, eop 39.9 40.7 37.5 37.4 39.4 39.4 39.1
Overnight Reverse Repo rate 6.00 5.75 5.25 5.25 5.25 5.25 5.50
Singapore
USD/SGD, eop 1.49 1.45 1.45 1.44 1.42 1.41 1.39
AUD/SGD, eop 1.32 1.35 1.28 1.28 1.35 1.35 1.29
3-month interbank rate 2.63 2.50 2.56 2.50 2.50 2.50 2.50
Taiwan
USD/TWD, eop 32.7 32.4 32.3 32.8 32.5 32.8 33.0
AUD/TWD, eop 29.0 30.3 28.5 29.2 30.9 31.5 30.7
Discount rate 3.250 3.250 3.375 3.375 3.500 3.500 3.500
Thailand
USD/THB, eop 34.3 34.0 33.9 34.0 33.9 33.8 34.0
AUD/THB, eop 30.4 31.8 29.9 30.3 32.2 32.4 31.6
1-day repo rate 3.25 3.25 3.25 3.25 3.25 3.25 3.25
Vietnam
USD/VND, eop 16,086 16,081 16,045 16,040 16,020 16,000 15,980
AUD/VND, eop 14,283 15,021 14,190 14,276 15,219 15,360 14,861
Japan
USD/JPY, eop 114.8 115.4 111.2 110.0 110.0 108.0 106.0
AUD/JPY, eop 101.9 107.8 98.4 97.9 104.5 103.7 98.6
Overnight call rate 0.50 0.50 0.50 0.50 0.50 0.75 0.75
Australia
AUD/USD, eop 0.89 0.93 0.88 0.89 0.95 0.96 0.93
Cash rate 6.50 6.50 6.75 6.75 7.00 7.25 7.25
New Zealand
NZD/USD, eop 0.76 0.77 0.76 0.76 0.76 0.74 0.71
AUD/NZD, eop 1.17 1.21 1.16 1.17 1.25 1.30 1.31
Overnight call rate 8.25 8.25 8.25 8.25 8.25 8.00 7.50
United States Fed Funds Rate, eop 4.75 4.50 4.25 3.75 3.75 3.75 3.75

Economics@ANZ ANZ International Economics Monthly – January 2008
Page 8
Macro Economic Forecasts Real GDP Growth (%)
2006 2007f 2008f 2009f
Australia 2.8 3.9 3.9 3.5
Cambodia 10.7 9.5 8.5 8.0
China 10.7 11.3 10.3 9.0
Hong Kong 6.8 6.3 5.7 4.2
India+ 9.4 8.8 8.5 8.5
Indonesia 5.6 6.2 6.5 6.0
Japan 2.2 1.4 1.2 2.1
Korea 5.0 4.8 4.1 4.3
Malaysia 5.9 6.1 5.8 6.3
New Zealand 1.6 3.0 1.6 2.9
Philippines 5.4 6.9 5.3 4.9
Singapore 7.9 8.0 5.5 6.3
Taiwan 4.6 4.6 4.2 3.2
Thailand 5.0 4.4 5.4 5.8
United States 2.9 2.2 2.1 2.9
Vietnam 8.2 8.5 8.0 7.0
Nominal GDP (US$ bn)
2006 2007f 2008f 2009f
Australia 761.0 915.1 1091.0 1050.6
Cambodia 7.2 8.4 9.5 10.6
China 2529.6 2888.9 3234.3 3659
Hong Kong 223.3 236.5 249.8 264
India+ 886.9 1027 1186 1364
Indonesia 364.2 411 465 521
Japan 4882.2 4970 5095 5280
Korea 847.2 911 974 1040
Malaysia 150.9 163 177 192
New Zealand 105.3 126.4 131.1 121.1
Philippines 118.0 130 142 154
Singapore 132.2 145 159 172
Taiwan 379.6 392.3 410 428
Thailand 206.3 220 237 256
United States 13,195 13,839 14,416 15,113
Vietnam 61.0 70.1 79.0 89.0
Inflation (%)
2006 2007f 2008f 2009f
Australia 3.5 2.3 3.2 2.8
Cambodia 4.7 7.0 5.0 5.0
China 1.5 4.6 3.4 3.8
Hong Kong 2.0 2.0 3.6 1.5
India+ 6.2 6.7 6.5 6.0
Indonesia 13.3 6.4 6.2 5.7
Japan 0.2 0.4 1.3 1.5
Korea 2.5 2.6 2.8 2.3
Malaysia 3.6 2.1 2.7 2.2
New Zealand 2.6 3.0 2.9 2.5
Philippines 6.3 2.7 4.0 3.8
Singapore 1.0 1.6 4.0 2.0
Taiwan 0.6 1.5 3.2 1.2
Thailand 4.7 2.0 2.2 2.1
United States 3.2 2.8 2.4 1.4
Vietnam 7.5 8.3 7.5 6.5
Fiscal Balance (% of GDP)*
2006 2007f 2008f 2009f
Australia 1.7 1.6 1.2 1.0
Cambodia -2.0 -3.0 -3.5 -3.5
China -2.0 -1.9 -2.1 -2.5
Hong Kong -0.2 -0.5 -0.5 -0.5
India+ -3.8 -3.3 -3.0 -3.0
Indonesia -1.0 -1.6 -1.8 -1.6
Japan -6.0 -5.8 -5.5 -5.5
Korea 1.8 1.9 2.4 2.2
Malaysia -3.5 -3.2 -3.1 -3.0
New Zealand 7.3 4.8 4.5 3.5
Philippines -4.9 -5.0 -4.0 -3.5
Singapore -0.8 -0.3 0.1 0.1
Taiwan -2.0 -2.6 -2.0 -2.0
Thailand -0.8 -2.0 -1.8 -1.5
United States -1.6 -1.3 -1.6 -1.8
Vietnam -1.8 -1.9 -1.8 -1.8
Current Account (% of GDP)
2006 2007f 2008f 2009f
Australia -5.5 -5.8 -5.7 -5.5
Cambodia -7.2 -7.0 -8.0 -7.0
China 9.5 9.8 9.6 9.5
Hong Kong 9.0 10.0 8.5 8.0
India+ -1.1 -1.0 -1.1 -1.1
Indonesia 2.6 2.0 1.5 1.5
Japan 3.7 3.5 2.5 2.5
Korea 1.7 1.2 1.1 0.9
Malaysia 15.8 15.3 15.0 14.5
New Zealand -8.6 -8.1 -6.8 -6.8
Philippines 4.3 4.6 2.5 2.0
Singapore 27.5 25.0 24.0 22.0
Taiwan 5.8 5.5 6.0 5.5
Thailand 1.6 5.0 4.0 3.0
United States -6.2 -5.6 -5.0 -4.3
Vietnam 1.5 -1.2 -1.8 -1.5
Foreign Exchange Reserves (US$ bn)
2006 2007f 2008f 2009f
Australia 55.1 n/a n/a n/a
Cambodia 1.09 1.4 1.6 1.8
China 1066 1500 1750 2000
Hong Kong 154 150 160 170
India 170.2 262 300 315
Indonesia 40.7 53 60 66
Japan 875 950 1045 1150
Korea 238 263 289 315
Malaysia 81.7 102 114 125
New Zealand 13.8 n/a n/a n/a
Philippines 22.3 30 35 38
Singapore 136.3 155 165 180
Taiwan 266 271 276 282
Thailand 65.1 83 95 103
United States 41.5 n/a n/a n/a
Vietnam 13.0 22.0 31.0 35.0
+: Fiscal year beginning April; *:Fiscal balance for Australia, New Zealand, Malaysia and Singapore corresponds to fiscal year

Economics@ANZ ANZ International Economics Monthly – January 2008
Page 9
Long Term Foreign Currency Government Bond Ratings Investment Grade Sub-Investment Grade
Moody’s S&P Moody’s S&P
Aaa AAA Ba1 BB+ Australia Australia Brazil Egypt Canada Canada Costa Rica Peru France France Egypt Brazil
Germany Germany Morocco Costa Rica Japan Singapore Panama
New Zealand United Kingdom Singapore United States Ba2 BB
United Kingdom Colombia Cook Islands United States Fiji Jordan
Guatemala Panama Aa1 AA+ Jordan Guatemala
Belgium Belgium Peru Vietnam New Zealand
Aa2 AA Ba3 BB- Hong Kong Hong Kong Indonesia Indonesia
Italy Japan Turkey Philippines Qatar Vietnam Serbia Kuwait Turkey UAE Venezuela Aa3 AA- Ukraine
Cayman Islands Kuwait Uruguay Macau Qatar Oman Taiwan
Taiwan Saudi Arabia
A1 A+ China Chile B1 B+ Cyprus Italy Pakistan Argentina
Czech Republic Papua New Guinea Ghana Saudi Arabia Philippines Pakistan
A2 A Suriname Cambodia Chile China Ukraine Papua New Guinea
Hungary Cyprus Uruguay Israel Czech Republic Korea Israel B2 B Poland Korea Honduras Fiji
Oman Venezuela Paraguay Cambodia
A3 A- B3 B- Malaysia Argentina Bolivia
Malaysia Poland Bolivia Ecuador Lebanon Lebanon
Baa1 BBB+ Mexico Hungary Caa1 and below CCC and below
South Africa Mexico Cuba Thailand Russia Ecuador
South Africa Nicaragua Thailand Paraguay
Baa2 BBB Mauritius Tunisia Tunisia Russia
Baa3 BBB-
Bulgaria Romania India India
Romania Colombia Morocco
Economics@ANZ ANZ International Economics Monthly – January 2008
Page 10
Country Update: Australia Economic growth surges to three-year high
-2
-1
0
1
2
3
4
5
6
7
90 92 94 96 98 00 02 04 06
year-ended % ch.
Source: Australian Bureau of Statistics
Wages showing signs of acceleration
Wa ge Price Inde x
2
3
3
4
4
5
5
99 00 01 02 03 04 05 06 07
Private
Public
Total
year- ended % ch.
Ave ra ge c ompensa tion of e mployee s*
1
2
3
4
5
6
7
99 00 01 02 03 04 05 06 07
year- ended % ch.
* non-farm Source: Australian Bureau of Statistics
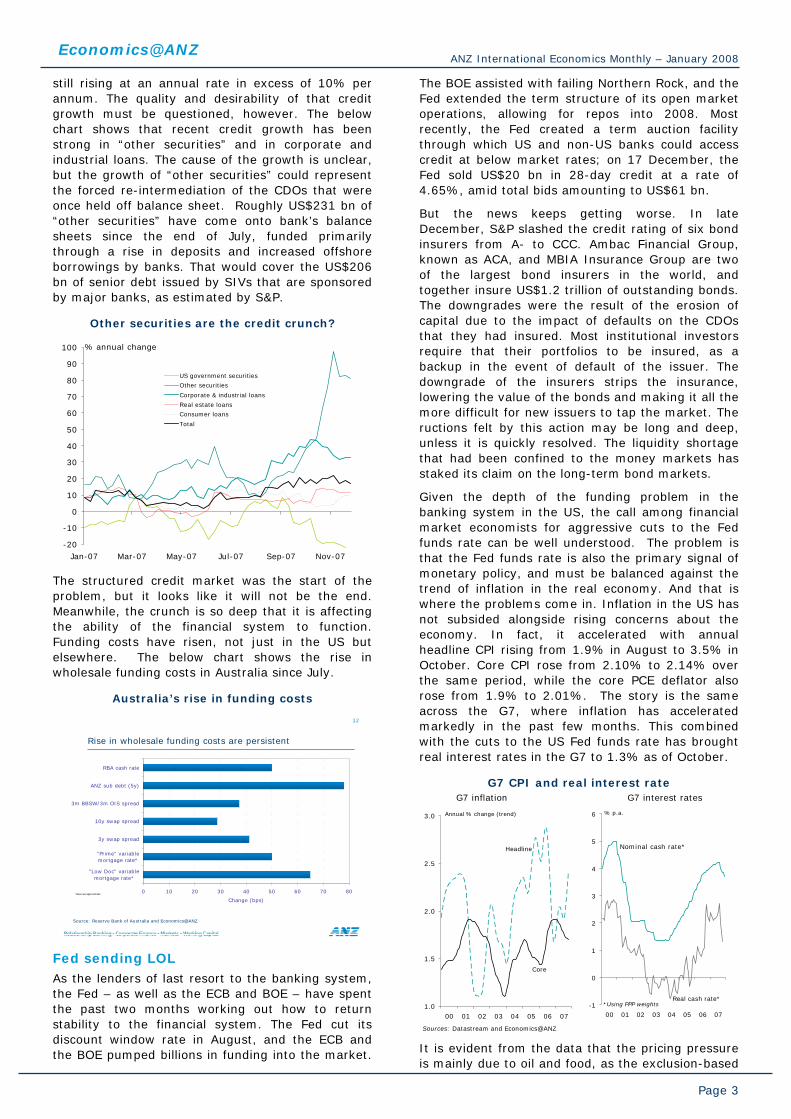
• The Australian economy is expanding at a healthy pace. Real GDP increased by 1.0% in the September quarter 2007 to be 4.3% higher over the year, the highest annual growth rate in three years. Growth in the quarter was driven by the household sector, with household consumption rising by 1.2% in the quarter.
• Strong economic momentum and high underlying inflation prompted the Reserve Bank to raise the cash rate by 25bp to 6.75% in November. In addition, minutes from the latest board meeting indicate that it was very close to hiking rates in December as well, and would have done so on domestic grounds, absent the tightening in market yields since the November meeting and increased uncertainty about the outlook for the US economy and global financial markets. The minutes are part of the RBA’s new communication strategy which also includes releasing a statement after each board meeting, regardless of whether there has been any decision to alter the policy rate and announcing the monetary policy decision on the same day as the Board meeting.
• The inflation outlook is of concern. The Reserve Bank has upgraded its forecasts, with both headline and underlying inflation expected to be above 3% in 2008 and then easing to around 3% by the end of 2009. High petrol and global food prices are adding to price pressures, and there is some evidence of a pickup in wages growth. The private sector wage price index increased by 4.3% over the year to the September quarter, the fastest pace since the series began in 1999. And broader measures of wages are growing more rapidly, with average non-farm compensation of employees increasing by 5.9% over the year to September, the fastest rate since 1996.
• Forecasts of inflation above the target band for the entire forecast horizon will be unacceptable to the Reserve Bank. However, the timing of future policy moves will be heavily influenced by developments in financial markets, the global economic outlook and the extent to which any market-induced tightening in financial conditions is passed on to end customers. Nevertheless, it is unlikely that any of this will change the imperative for the official cash rate in Australia to move higher in 2008.
Riki Polygenis
Economic data – Australia Monthly data Mar 07 Apr 07 May 07 Jun 07 Jul 07 Aug 07 Sep 07 Oct 07 Building Approvals, 000’s 12.4 12.8 12.1 13.0 13.1 12.8 13.9 13.6 Retail Sales, % YOY 7.7 5.9 5.6 6.9 7.3 7.9 8.1 7.4 Exports, % YOY 7.8 3.7 9.4 -3.7 3.1 4.0 0.9 -4.5 Imports, % YOY 9.2 5.3 2.0 4.5 5.6 10.7 6.9 4.4 Trade Balance, AUD bn -1.52 -1.00 -1.05 -1.93 -1.04 -1.76 -1.92 -2.98 Foreign Exchange Reserves, US$ bn 57.5 67.4 69.8 67.6 68.9 57.8 46.5 33.2 Quarterly data Dec 05 Mar 06 Jun 06 Sep 06 Dec 06 Mar 07 Jun 07 Sep 07 Real GDP, % YOY 3.4 3.3 2.5 2.6 2.8 3.6 3.7 4.3 - Private consumption 2.5 2.5 2.7 2.7 3.4 4.0 3.7 4.5 - Government consumption 2.6 1.7 3.6 6.4 3.6 4.5 2.6 1.3 - Gross fixed capital expenditure 9.8 10.4 5.3 2.2 2.7 5.2 9.4 10.6 Consumer Price Index, % YOY (nsa) 2.8 3.0 4.0 3.9 3.3 2.4 2.1 1.9 Current Account, AUD bn -14.2 -13.3 -13.7 -12.9 -15.2 -15.3 -15.6 -15.6 Capital Account, AUD bn (nsa) 14.3 13.5 12.6 14.1 15.1 15.3 14.4 18.0
Sources: Australian Bureau of Statistics, Reserve Bank of Australia Note: data seasonally adjusted unless otherwise stated
Economics@ANZ ANZ International Economics Monthly – January 2008
Page 11
Country Update: Cambodia The tourism sector is expanding strongly
50
70
90
110
130
150
170
190
210
230
Jan Feb Mar Apr May Jun Jul Aug Sep Oct Nov Dec
'000 persons
2007
2006
2005
Tourism arrivals
Source: CEIC
The stronger KHR is a USD story
Cambodian Riel
Source: Bloomberg, Economics@ANZ
3950
3970
3990
4010
4030
4050
4070
4090
4110
Feb-07 May-07 Aug-07 Nov-07
USD/KHR
4800
5000
5200
5400
5600
5800
6000
6200
Feb-07 May-07 Aug-07 Nov-0730
31
32
33
34
35
36
37
38EUR/KHR JPY/KHR
EUR/KHR (lhs)
JPY/KHR (rhs)
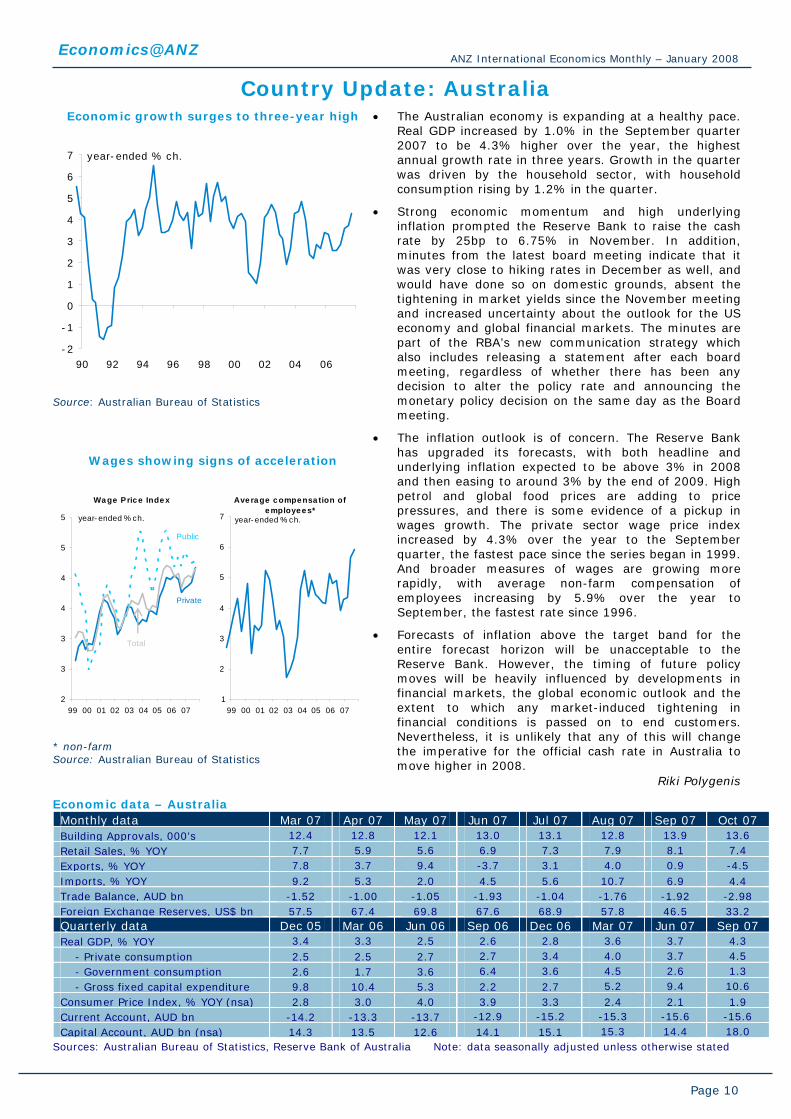
• Cambodian prime minister Hun Sen announced that the preliminary estimate for GDP growth in 2007 is 9.5%. Rising levels of foreign direct investment and stronger exports are likely to have been the main drivers of growth. In 2008 we expect growth will slow slightly around 8%, mainly as a softer global economy constrains demand for Cambodian exports.
• Cambodia’s fast-growing tourism sector will continue to gain importance as export and foreign exchange earner in the year ahead. While tourist arrivals dropped 9.6% in September, this largely reflects seasonal conditions, including the end of summer holidays in the Northern Hemisphere. Tourist arrivals to Cambodia are still a strong 20% higher than this time last year. An important boost to the sector will come from the signing, this month, of an agreement between Cambodia and Thailand to allow foreigners to travel to both these countries on a single visa. The government is seeking to tap into the tourist sector’s strong prospects, announcing the launch of Cambodia’s first national airline. The government will hold a 51% stake in the airline and the first flights are intended to launch within six months.
• Cambodia’s textile and garments industry should also remain an importer driver of growth. The Economic Institute of Cambodia is forecasting export earnings from this sector to grow by around 12% in 2008, broadly unchanged from this year.
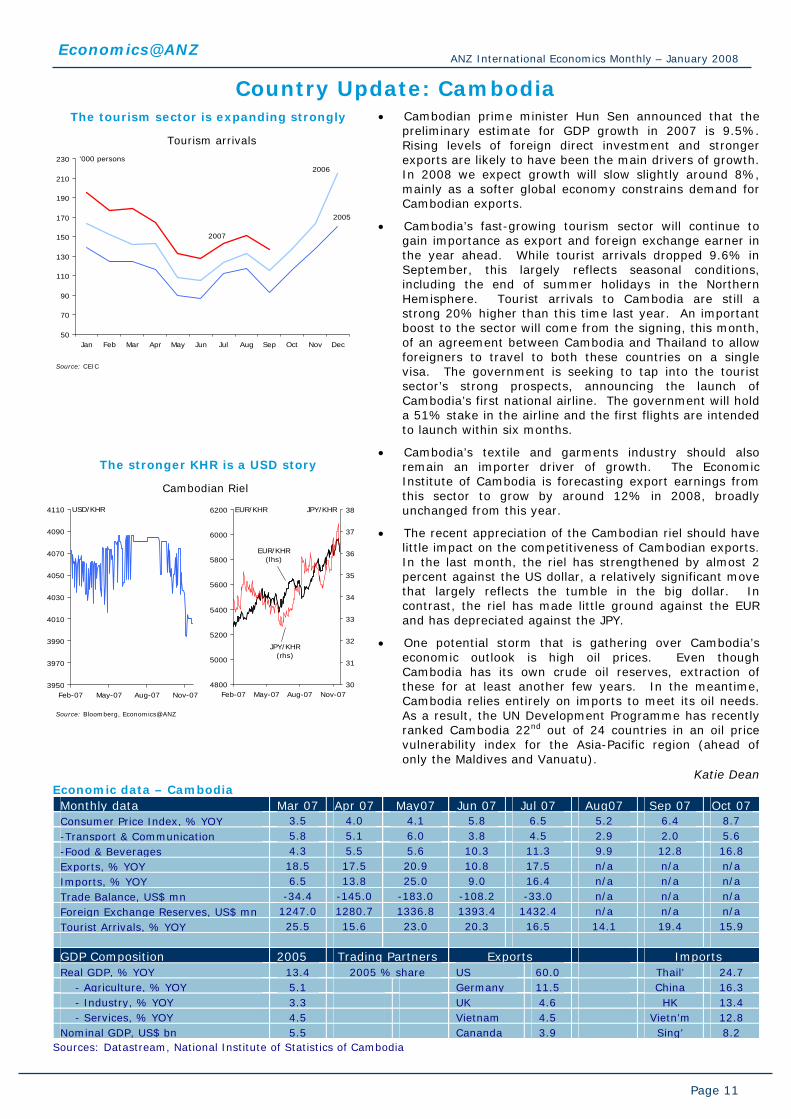
• The recent appreciation of the Cambodian riel should have little impact on the competitiveness of Cambodian exports. In the last month, the riel has strengthened by almost 2 percent against the US dollar, a relatively significant move that largely reflects the tumble in the big dollar. In contrast, the riel has made little ground against the EUR and has depreciated against the JPY.
• One potential storm that is gathering over Cambodia’s economic outlook is high oil prices. Even though Cambodia has its own crude oil reserves, extraction of these for at least another few years. In the meantime, Cambodia relies entirely on imports to meet its oil needs. As a result, the UN Development Programme has recently ranked Cambodia 22nd out of 24 countries in an oil price vulnerability index for the Asia-Pacific region (ahead of only the Maldives and Vanuatu).
Katie Dean Economic data – Cambodia Monthly data Mar 07 Apr 07 May07 Jun 07 Jul 07 Aug07 Sep 07 Oct 07 Consumer Price Index, % YOY 3.5 4.0 4.1 5.8 6.5 5.2 6.4 8.7 -Transport & Communication 5.8 5.1 6.0 3.8 4.5 2.9 2.0 5.6 -Food & Beverages 4.3 5.5 5.6 10.3 11.3 9.9 12.8 16.8 Exports, % YOY 18.5 17.5 20.9 10.8 17.5 n/a n/a n/a Imports, % YOY 6.5 13.8 25.0 9.0 16.4 n/a n/a n/a Trade Balance, US$ mn -34.4 -145.0 -183.0 -108.2 -33.0 n/a n/a n/a Foreign Exchange Reserves, US$ mn 1247.0 1280.7 1336.8 1393.4 1432.4 n/a n/a n/a Tourist Arrivals, % YOY 25.5 15.6 23.0 20.3 16.5 14.1 19.4 15.9 GDP Composition 2005 Trading Partners Exports Imports Real GDP, % YOY 13.4 2005 % share US 60.0 Thail’ 24.7 - Agriculture, % YOY 5.1 Germany 11.5 China 16.3 - Industry, % YOY 3.3 UK 4.6 HK 13.4 - Services, % YOY 4.5 Vietnam 4.5 Vietn’m 12.8 Nominal GDP, US$ bn 5.5 Cananda 3.9 Sing’ 8.2
Sources: Datastream, National Institute of Statistics of Cambodia

Economics@ANZ ANZ International Economics Monthly – January 2008
Page 12
Country Update: China Growth and inflation forecast to ease
Sources: Datastream, Economics@ANZ
GDP growth and inflation forecast
-5
0
5
10
15
20
Q1 1998 Q1 2001 Q1 2004 Q1 2007
% annual change
GDP growth
Inflation
Forecast
Monetary policy nearing its peak
-4
0
4
8
12
16
20
24
02 03 04 05 06 07
% annual change
M2
Headline CPI
CPI and base money
Sources: Datastream
0
3
6
9
12
15
02 03 04 05 06 07 08
Reserve requirement ratio
% pa
Lending rate
PBOC measures
Forecast
• The Chinese economy is expected to slow throughout 2008, as a result of the continued tightening of monetary and administrative measures that have been passed over the past 18 months. We forecast real GDP will slow from 11.5% in the third quarter to sub-11% in 2008, with Q4 2008 GDP growth of 9.5%. The forecast depends upon reduced trade surpluses and, more importantly, a slowdown in the rate of fixed asset investment growth given tighter lending conditions and increased SOE dividend payments to the government.
• Although we are expecting a slowdown, recent data releases suggest our Q4 2007 real GDP growth of 10.9% YOY may be pessimistic. Industrial production rose 17.3% on an annual basis in November, around the level of expansion seen in the second half of this year. Fixed asset investment rose 26.8% on an annual basis in November, although the fact that the index is cumulative makes it difficult to determine what happens month-to-month. Consumption has also been robust, with retail sales rising by 18.8% per annum in November, the strongest growth rate since late 2005. Export growth is set to slow by 5 percentage point to 21% in the fourth quarter, but the trade surplus will widen to US$82 bn from US$73 bn in the third quarter.
• Although inflation remains problematic, we believe PBOC has nearly reached the end of its tightening cycle. The lending rate was raised to 7.47% this month as we expected, and we anticipate one more rate hike to 7.65% after Chinese New Year. After that, the slowdown in the economy should become more evident and allow inflation to ease over time. Our forecast is for inflation to decline from around 7% in February to 5% by June, and to less than 3% by the end of next year. However, this decline in inflation depends upon a fall in oil prices and in domestic food prices in China.
• The Chinese RMB is expected to continue its gradual path of appreciation against the US dollar. Although many observers expect a faster pace of appreciation from March under the new leadership, a severe slowdown in the US economy could put this decision on hold.
Amy Auster
Economic data – China Monthly data Mar 07 Apr 07 May 07 Jun 07 Jul 07 Aug 07 Sep 07 Oct 07 Industrial Production, % YOY 17.6 17.4 18.1 19.4 18.0 17.5 18.9 17.9 Retail Sales, % YOY 15.3 15.5 15.9 16.0 16.4 17.1 17.0 18.1 Consumer Price Index, % YOY 3.3 3.0 3.4 4.4 5.6 6.5 6.2 6.5 Exports, % YOY 6.9 26.8 28.7 27.1 34.1 22.7 22.7 22.3 Imports, % YOY 14.5 21.3 19.1 14.3 26.9 20.1 16.1 25.5 Trade Balance, US$ bn 6.8 16.8 22.4 26.8 24.3 25.0 23.8 27.1 Foreign Exchange Reserves, US$ 1202.0 15.5 15.9 16.0 16.4 17.1 17.0 18.1 Quarterly data Dec 05 Mar 06 Jun 06 Sep 06 Dec 06 Mar 07 Jun 07 Sep 07 Real GDP, % YOY 9.9 10.4 11.5 10.6 10.4 11.1 11.9 11.5 - Primary sector 5.2 4.5 5.1 4.9 5.0 4.4 4.0 4.3 - Secondary sector 11.7 12.7 13.3 13.3 12.5 13.2 13.6 13.5 - Tertiary sector 10.5 8.9 9.3 9.5 10.3 9.9 10.6 11.0 Nominal GDP, US$ bn 615.4 604.5 630.3 658.7 733.8 710.4 761.6 810.0 Current Account, US$ bn 177.2 243.7 247.0 249.7 259.0 302.1 341.6 380.5 FDI (actual), US$ bn* YTD 60.3 14.2 28.4 42.6 63.0 15.9 31.9 47.2 Sources: Datastream, Bloomberg * - Quarterly sum

Economics@ANZ ANZ International Economics Monthly – January 2008
Page 13
Country Update: Hong Kong The Hong Kong economy is performing
strongly
Trade data
-12
-7
-2
3
8
13
18
23
05 06 07
YOY %
Retail sales
Visitor arrivals
Retail sales and arrivals
Source: Datastream, Economics@ANZ
-15
-10
-5
0
5
10
15
20
25
02 03 05 06
% YOY, 3mma
Imports
Exports
The HKMA is expected to follow the Fed and cut interest rates next month
M2 growth & Prime rate Unemployment and CPI
Source: Datastream, Economics@ANZ
-5
0
5
10
15
20
25
01 02 03 04 05 06 07
% M2, annual growth
Prime interest rate, % pa
HKMA official rate
-8
-6
-4
-2
0
2
4
6
8
10
00 01 02 03 04 05 06 07
%
CPI, YOY
Unemployment
• Real GDP growth appears likely to hit 6% per annum in 2007, as tourism and asset price inflation has boosted private consumption, overcoming soft government expenditure and lacklustre investment. The trend in the national accounts is confirmed by high frequency data releases. Visitor arrivals rose more than 17% on an annual basis in October 2007 and are up 6.8% year to date, as growth in visitors from the mainland rose 7.5% year to date. Tourism inflows are supporting robust retail sales, with volumes up 12.5% per annum as of October on an annual basis. The labour market is strengthening; unemployment fell to a 10-year low of 3.9% in October.
• Rising real estate and equity prices are have also been fuelling consumption. Property prices are up more than 11% on an annual basis. Monthly mortgage approvals have started to respond to the positive real estate market, rising by 72% in October year-to-date. The recovery in real estate has not yet fed through strongly to overall investment in the economy, where was weak in the third quarter. However, the fourth quarter should show a stronger surge.
• The conundrum between strong growth and higher inflation versus the Hong Kong dollar peg to the US dollar continues. The 1-year interbank rate in Hong Kong has declined by 95 bps in the first half of 2007, and has actually fallen faster than the 1-year interbank lending rate in the US. Falling interest rates in the US are lowering funding costs in Hong Kong, just as annual headline inflation accelerated to 3.4% Food and housing are mainly to blame for rising prices, but prices of retail goods also rose. In addition to low interest rates, Hong Kong’s real effective exchange rate has weakened by nearly 6% over the past year, thanks to a very weak US dollar; this has tended to fuel imported inflation.
• The HKMA was forced to intervene heavily in the currency markets in November in order to keep the Hong Kong dollar within its two-way peg to the US dollar. Pressure has eased in December, but the issue of the US$ peg will persist through 2008 and beyond.
Amy Auster
Economic data – Hong Kong Monthly data Mar 07 Apr 07 May 07 Jun 07 Jul 07 Aug 07 Sep 07 Oct 07 Visitor Arrivals, %YOY 2.9 2.3 12.6 7.7 12.3 16.9 15.9 17.0 Retail Sales, % YOY 3.5 1.7 9.4 12.8 12.1 12.7 12.9 12.9 Consumer Price Index, % YOY 2.4 1.3 1.3 1.4 1.6 1.7 1.7 3.2 Exports, % YOY 6.2 11.8 11.1 10.4 8.0 6.9 8.4 10.2 Imports, % YOY 10.3 13.9 10.2 12.3 9.1 8.4 9.3 12.5 Trade Balance, US$ bn -3.6 -2.6 -1.8 -2.5 -1.0 -1.7 -1.9 -1.1 Foreign Exchange Reserves, US$ bn 135.0 137.0 136.0 136.0 137.0 138.0 141.0 142.0 Quarterly data Dec 05 Mar 06 Jun 06 Sep 06 Dec 06 Mar 07 Jun 07 Sep 07 Real GDP, % YOY 7.2 8.1 5.0 6.8 7.2 5.5 6.3 6.2 - Private consumption 3.5 5.7 7.0 4.5 6.2 4.8 5.7 9.7 - Government consumption -4.0 1.3 -1.6 -1.1 2.3 2.4 2.7 1.2 - Gross fixed capital expenditure 6.1 5.5 3.8 9.5 6.4 2.8 10.0 2.0 Nominal GDP, US$ bn 45.7 46.3 46.6 48.0 48.9 49.0 49.6 n/a Current Account, US$ bn 5.9 4.8 1.8 6.5 7.0 8.0 3.4 n/a Capital Account, US$ bn -0.1 -0.1 0.1 -0.2 -0.1 -0.2 0.5 n/a Source: Datastream

Economics@ANZ ANZ International Economics Monthly – January 2008
Page 14
Country Update: India Economy slows but still growth still healthy
Source: CEIC
-15
-10
-5
0
5
10
15
20
25
30
01 02 03 04 05 06 07
GDP
Manufacturing
Agriculture, forestry, fishing
Trade, Hotels, Tpt & communications
Financing, insurance, real estate & business svcs
Annual % change
Inflation remains a concern
M3 growth Credit growth
Sources: Bloomberg, Datastream
0
5
10
15
20
25
30
35
03 04 05 06 07
Annual % changeAnnual % change
Claims on the private sector
10
15
20
25
03 04 05 06 07
• The Indian economy slowed to 8.9% YOY in the September quarter, reflecting the impact of monetary tightening measures. Manufacturing growth eased to 8.6% YOY compared with 11.9% YOY in the previous quarter as demand was adversely affected by higher interest rates and a strong rupee which dampened export competitiveness. This brings growth for the first half of the fiscal year FY2007/08 (beginning 1 April) to 9.1% YOY. Our forecast is for growth to moderate to 8.5-8.9% over the next couple of years as monetary conditions remain firm.
• Inflation ticked up again in December after moving close to five-year lows but remains within the central bank’s target of 5% for this financial year. The benchmark wholesale price index rose 3.75% YOY in the week ended 1 December. Upside risks from high oil prices and robust domestic demand will keep interest rates steady in the months ahead. India, which imports more than half of its energy requirements, has not raised fuel prices this year but the acceleration in crude oil prices through the year raises expectations of an increase in retail fuel prices in January. Money supply continues to accelerate although recent measures to moderate capital inflows are likely to be felt in the months ahead. Finance Minister Chidambaram has indicated that no further steps have been planned to curb capital inflows as the impact of recent measures are monitored.
• The central government’s budget deficit for April-October 2007 reached 54.5% of the target. The deficit is expected to narrow to 3.3% in FY2007/08 and 3% in FY2008/09. However, the rising cost of fuel subsidies and higher debt service payments due to the rise in interest rates are likely to put pressure on these targets.
• The Indian rupee has been one of the best performers among Asian currencies, strengthening by 12% against the US dollar since the start of the year. A further appreciation of around 4½% is expected over the next six months supported by capital inflows on the back of relatively healthy economic growth as well as a weak US dollar track.
Jasmine Robinson
Economic data – India Monthly data Mar 07 Apr 07 May 07 Jun 07 Jul 07 Aug 07 Sep 07 Oct 07 Industrial Production, %YOY 15.2 11.0 10.5 8.7 8.1 10.4 6.7 11.5 Passenger car sales, % YOY 6.2 7.7 6.5 12.1 14.5 15.7 8.7 13.9 Consumer Price Index, % YOY 6.8 6.7 6.6 5.7 6.5 7.3 6.4 5.5 Exports, % YOY 12.3 26.7 26.8 19.1 18.5 22.2 24.2 38.3 Imports, % YOY 20.1 40.4 37.0 39.5 20.4 41.1 10.1 31.3 Trade Balance, US$ bn -4.2 -7.1 -6.2 -7.3 -5.0 -6.9 -4.4 -7.5 Foreign Exchange Reserves, US$ bn 192.0 197.0 201.0 206.0 220.0 222.0 240.0 256.0 Quarterly data Dec 05 Mar 06 Jun 06 Sep 06 Dec 06 Mar 07 Jun 07 Sep 07 Real GDP, % YOY (at factor cost) 9.3 10.0 9.6 10.2 8.7 9.1 9.3 8.9 - Industry 7.2 8.6 10.6 11.3 10.8 11.2 10.6 8.3 - Agriculture 8.7 6.2 2.8 2.9 1.6 3.8 3.8 3.6 - Services 10.0 12.1 12.0 11.1 11.3 9.9 10.6 n/a Nominal GDP, US$ bn 193.4 200.2 187.1 184.8 223.6 233.2 237.4 239.8 Current Account, US$ bn -4.8 1.8 -4.6 -4.8 -2.8 2.6 -4.7 n/a Capital Account, US$ bn 0.1 10.5 10.6 6.8 10.3 17.9 15.3 n/a Source: Datastream, Bloomberg

Economics@ANZ ANZ International Economics Monthly – January 2008
Page 15
Country Update: Indonesia Economy gains momentum
Economic growth Realised FDI*
Sources: Datastream, Investment Coordinating Board (BKPM)
-5
0
5
10
15
20
25
03 04 05 06 070
1
2
3
4
5
6
7
8
9
10
01 02 03 04 05 06 07
Annual % change US$ bn
Jan-Oct
*: excludes oil & gas and finance-related institutions
Investment
Pte cons
GDP
Inflation pressures mount
Inflation
-8
-6
-4
-2
0
2
4
6
02 03 04 05 06 07
Real interest rates
-5
0
5
10
15
20
02 03 04 05 06 07
CPI
Source: Datastream, Economics@ANZ
CPI-Food
Annual % change % pa.
• Bank Indonesia surprised markets when it cut its policy rate to 8% at its December meeting. This decision came after a mild easing in inflation in November to 6.7% YOY. However, higher oil and food prices as well as a pick-up in domestic demand are fuelling inflation concerns. We expect the rupiah to appreciate against the US dollar over the coming year and this will assist in containing imported inflation. Nevertheless, meeting the central bank’s end-year target range of 4-6% will be difficult against these underlying pressures. Our forecast is for annual inflation to average 6.2% in 2008 from an estimated 6.4% in 2007.
• Having successfully moved to an inflation-targeting framework, Bank Indonesia will, in 2008, switch its benchmark rate to an overnight rate from the current 1-month rate to better manage liquidity. The outlook in the coming months is for the rate to remain steady unless inflation persistently surprises on the upside.
• With third quarter GDP growth exceeding expectations, the Indonesian economy is headed for its strongest year in a decade. Real GDP is forecast to expand by 6.2% in 2007. The momentum is expected to pick up in 2008, bolstered by investment and private consumption. For the first ten months of 2007, actual foreign direct investment more than doubled to IDR81.7 tn (US$8.9 bn) while domestic investment approvals jumped by 144%. The government also plans to step up investment, spending an estimated IDR100 tn (US$10.6 bn) on infrastructure projects in 2008. Our forecast is for real GDP to expand by 6.5%. This falls within the government’s projection of 6.4-6.7%.
• High fuel prices are also putting pressure on the fiscal balance. The budget deficit could widen to 1.8% of GDP from the initial estimate of 1.7% if the Indonesian crude oil price stays above the budget assumption of US$60/bbl (it has averaged US$69/bbl this year). Although Indonesia is an oil producer, generating around 1 mn bbl/day, and will benefit from increased oil-related revenue, fuel subsidies remain in place and the cost is rising. With presidential and parliamentary elections due in 2009, fuel and electricity tariffs are unlikely to be hiked. The government will need to rein in spending to prevent a more significant widening of the deficit.
Jasmine Robinson
Economic data – Indonesia Monthly data Mar 07 Apr 07 May 07 Jun 07 Jul 07 Aug 07 Sep 07 Oct 07 Industrial Production, %YOY 9.3 9.2 6.6 5.1 4.37 4.42 2.42 8.26 Motor cycle sales, % YOY 31.6 16.2 16.6 7.8 -1.6 -3.0 -3.4 22.6 Consumer Price Index, % YOY 6.5 6.3 6.0 5.8 6.1 6.5 7.0 6.88 Exports, % YOY 22.6 15.8 16.0 11.4 10.5 7.8 7.6 17.59 Imports, % YOY 23.3 18.1 27.3 3.6 15.4 20.1 19.6 36.54 Trade Balance, US$ bn 3.8 3.2 3.2 3.5 3.6 2.8 2.8 3.99 Foreign Exchange Reserves, US$ bn 45.7 47.7 48.6 49.4 50.3 49.9 51.2 n/a Quarterly data Dec 05 Mar 06 Jun 06 Sep 06 Dec 06 Mar 07 Jun 07 Sep 07 Real GDP, % YOY 4.8 5.1 5.0 5.9 5.9 6.0 6.4 6.7 - Private consumption 4.1 3.0 3.0 2.9 3.8 4.6 4.7 5.3 - Government consumption 26.8 11.3 27.9 2.3 0.5 6.3 3.4 6.1 - Gross fixed capital expenditure 2.7 1.5 1.1 0.5 8.7 7.7 6.9 9.0 Nominal GDP, US$ bn 76.7 84.8 89.4 94.0 96.2 101.2 107.1 109.6 Current Account, US$ bn 0.8 2.8 1.7 3.5 1.9 3.0 2.6 n/a Capital & Financial Account, US$ bn 4.0 2.3 0.0 -1.2 1.5 2.3 2.1 n/a Sources: Bloomberg, Datastream, Bank Indonesia
Economics@ANZ ANZ International Economics Monthly – January 2008
Page 16
Country Update: Japan Exports losing steam
Industrial production
Sources: Datastream, Economics@ANZ
-20
-15
-10
-5
0
5
10
15
20
25
01 02 03 04 05 06 07
% YOY
Manufacturing machinery orders
Industrial production
-15
-10
-5
0
5
10
15
20
25
30
35
01 02 03 04 05 06 07
% YOYImports
Exports
External trade
Slide in domestic demand throw doubt over reflation prospects
Housing starts and construction orders
Price trends
Sources: Datastream, Economics@ANZ
-50
-40
-30
-20
-10
0
10
20
30
01 02 03 04 05 06
% YOY (smoothed)
-3
-2
-1
0
1
2
3
4
01 02 03 04 05 06 07
Corporate goodsprice index
% YOY
Headline CPI
Core CPI
Housing starts
Construction orders
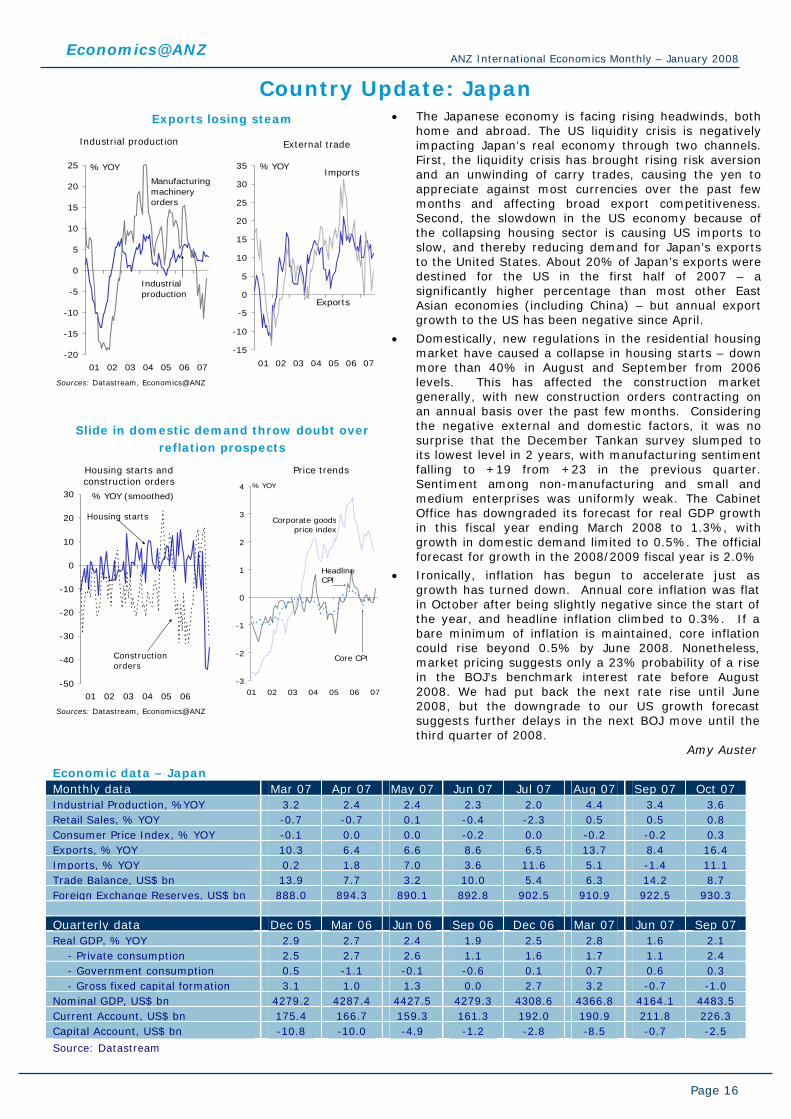
• The Japanese economy is facing rising headwinds, both home and abroad. The US liquidity crisis is negatively impacting Japan’s real economy through two channels. First, the liquidity crisis has brought rising risk aversion and an unwinding of carry trades, causing the yen to appreciate against most currencies over the past few months and affecting broad export competitiveness. Second, the slowdown in the US economy because of the collapsing housing sector is causing US imports to slow, and thereby reducing demand for Japan’s exports to the United States. About 20% of Japan’s exports were destined for the US in the first half of 2007 – a significantly higher percentage than most other East Asian economies (including China) – but annual export growth to the US has been negative since April.
• Domestically, new regulations in the residential housing market have caused a collapse in housing starts – down more than 40% in August and September from 2006 levels. This has affected the construction market generally, with new construction orders contracting on an annual basis over the past few months. Considering the negative external and domestic factors, it was no surprise that the December Tankan survey slumped to its lowest level in 2 years, with manufacturing sentiment falling to +19 from +23 in the previous quarter. Sentiment among non-manufacturing and small and medium enterprises was uniformly weak. The Cabinet Office has downgraded its forecast for real GDP growth in this fiscal year ending March 2008 to 1.3%, with growth in domestic demand limited to 0.5%. The official forecast for growth in the 2008/2009 fiscal year is 2.0%
• Ironically, inflation has begun to accelerate just as growth has turned down. Annual core inflation was flat in October after being slightly negative since the start of the year, and headline inflation climbed to 0.3%. If a bare minimum of inflation is maintained, core inflation could rise beyond 0.5% by June 2008. Nonetheless, market pricing suggests only a 23% probability of a rise in the BOJ’s benchmark interest rate before August 2008. We had put back the next rate rise until June 2008, but the downgrade to our US growth forecast suggests further delays in the next BOJ move until the third quarter of 2008.
Amy Auster
Economic data – Japan Monthly data Mar 07 Apr 07 May 07 Jun 07 Jul 07 Aug 07 Sep 07 Oct 07 Industrial Production, %YOY 3.2 2.4 2.4 2.3 2.0 4.4 3.4 3.6 Retail Sales, % YOY -0.7 -0.7 0.1 -0.4 -2.3 0.5 0.5 0.8 Consumer Price Index, % YOY -0.1 0.0 0.0 -0.2 0.0 -0.2 -0.2 0.3 Exports, % YOY 10.3 6.4 6.6 8.6 6.5 13.7 8.4 16.4 Imports, % YOY 0.2 1.8 7.0 3.6 11.6 5.1 -1.4 11.1 Trade Balance, US$ bn 13.9 7.7 3.2 10.0 5.4 6.3 14.2 8.7 Foreign Exchange Reserves, US$ bn 888.0 894.3 890.1 892.8 902.5 910.9 922.5 930.3 Quarterly data Dec 05 Mar 06 Jun 06 Sep 06 Dec 06 Mar 07 Jun 07 Sep 07 Real GDP, % YOY 2.9 2.7 2.4 1.9 2.5 2.8 1.6 2.1 - Private consumption 2.5 2.7 2.6 1.1 1.6 1.7 1.1 2.4 - Government consumption 0.5 -1.1 -0.1 -0.6 0.1 0.7 0.6 0.3 - Gross fixed capital formation 3.1 1.0 1.3 0.0 2.7 3.2 -0.7 -1.0 Nominal GDP, US$ bn 4279.2 4287.4 4427.5 4279.3 4308.6 4366.8 4164.1 4483.5 Current Account, US$ bn 175.4 166.7 159.3 161.3 192.0 190.9 211.8 226.3 Capital Account, US$ bn -10.8 -10.0 -4.9 -1.2 -2.8 -8.5 -0.7 -2.5
Source: Datastream

Economics@ANZ ANZ International Economics Monthly – January 2008
Page 17
Country Update: Korea Consumer sentiment is strong
Source: CEIC
80
85
90
95
100
105
110
115
00 01 02 03 04 05 06 07
Index
Series average
Consumer Expectation Index
BOK on hold, but prices accelerate
Inflation
2
3
4
5
6
2003 2004 2005 2006 2007
% pa.
Interest rates
Sources: Bloomberg, CEIC, Datastream
0
1
2
3
4
5
6
2003 2004 2005 2006 2007
Annual % change
Overnight call rate
core
Headline
• Korea ushered in its first conservative president in ten years following elections held in December 2007. It appears that voters pardoned the front runner and former mayor of Seoul from accusations of criminal activity, with Lee Myung-bak winning convincingly with 48.7% of the vote. The next-best candidate, Chung Dong Young, took just 26.2%. Disappointingly, voter turnout was a record low of 63%. In his victory speech, Lee promised to revitalise the economy and unite Korea’s divided society.
• Inflation raced ahead to a three-year high of 3.5% YOY in October. As in much of the rest of the world, strongest price rises were in food (4.3% YOY), transportation (7.6%) and agricultural products and oils (12.3%), although education costs continued to also rise strongly (6.0%). The core measure of inflation has also ticked up to 2.4%, although is down from its recent peak of 2.6% in April 2007.
• Interest rates kept on hold at 5% by the Bank of Korea in November and December. In its latest statement, the BoK cited the strength of the domestic economy underpinned by strong growth in exports and consumption, while highlighting the uncertainty surrounding future economic developments due to continued international financial market turmoil and high oil prices. The Bank also noted that domestic financial markets remain liquid, and both corporate and household credit maintains solid growth.
• The BoK also announced that it would change its key interest rate target to “official bank rates” from the overnight inter-bank lending call rate. The bank said that this would help to bring policy into line with that of other advanced economies, noting that the new benchmark would be set using a mixture of rates on repurchase agreements, deposits and loans that apply between the central bank and financial companies.
• After more than five decades, the first regular freight train service between South and North Korea began in December. In time, this connection should provide a boost to both economies, but is mostly symbolic at present, part of a broader five-year South Korean ‘peace and prosperity’ plan to improve relations with its northern neighbour.
Amber RabinovEconomic data – Korea Monthly data Mar 07 Apr 07 May 07 Jun 07 Jul 07 Aug 07 Sep 07 Oct 07 Industrial Production, %YOY 3.2 6.9 6.7 7.7 14.4 11.2 7.3 10.1 Retail Sales, % YOY 5.2 2.7 3.8 3.8 4.3 4.4 10.4 3.6 Consumer Price Index, % YOY 2.2 2.5 2.3 2.5 2.5 2.0 2.3 3.0 Exports (US$), % YOY 13.2 17.0 11.1 14.5 17.2 13.6 -1.1 22.9 Imports (US$), % YOY 12.9 20.8 13.8 9.6 14.5 9.6 -1.8 27.4 Trade Balance, US$ bn 1.1 0.4 1.2 3.5 1.0 1.4 2.2 1.8 Foreign Exchange Reserves, US$ bn 243.4 246.8 250.3 250.2 254.4 254.9 256.8 259.7 Quarterly data Dec 05 Mar 06 Jun 06 Sep 06 Dec 06 Mar 07 Jun 07 Sep 07 Real GDP, % YOY 5.7 6.1 5.2 4.8 4.0 3.9 5.0 5.1 - Private consumption 4.7 5.4 4.0 3.9 3.6 3.9 4.2 4.6 - Government consumption 5.4 5.4 5.2 5.8 6.8 5.6 5.9 3.9 - Gross fixed capital expenditure 4.3 3.5 0.1 4.6 4.5 7.0 6.7 1.4 Nominal GDP, US$ bn 200.9 213.2 221.5 223.4 229.7 232.9 241.0 245.5 Current Account, US$ bn 5.2 -1.1 0.7 0.4 6.1 -1.7 0.0 4.4 Capital Account, US$ bn -0.5 -0.7 -0.8 -0.7 -0.9 -0.8 -0.7 -0.6 Source: Datastream
Economics@ANZ ANZ International Economics Monthly – January 2008
Page 18
Country Update: Malaysia Strong consumption demand driving GDP
-1
0
1
2
3
4
5
6
7
8
9
01 02 03 04 05 06 07
GDP
Source: CEIC
0
3
6
9
12
15
01 02 03 04 05 06 07
Consumption
Annual % changeAnnual % change
Signs of economic growth are picking up
Trade trends
-6
0
6
12
18
02 03 04 05 06 07
Annual % change, 3-mth mvg avg
Industrial production
Source: Datastream
-15
-10
-5
0
5
10
15
20
25
30
35
02 03 04 05 06 07
Exports
Annual % change, 3-mth mvg avg
Imports
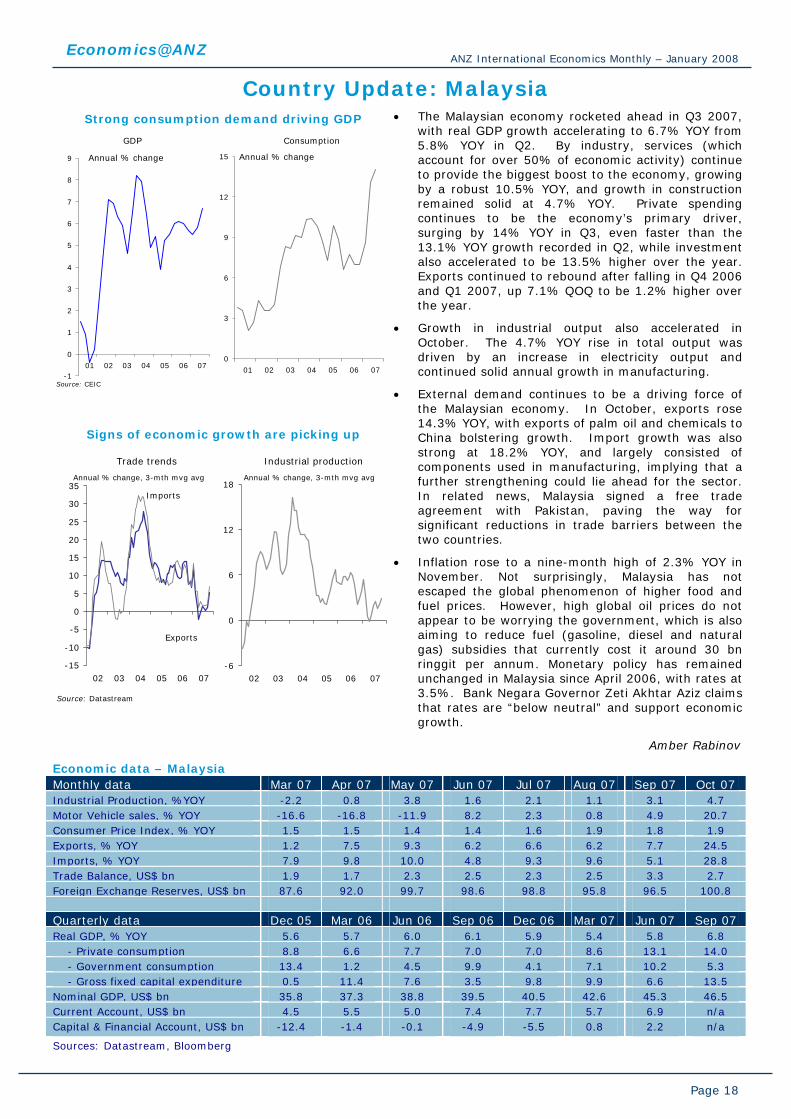
• The Malaysian economy rocketed ahead in Q3 2007, with real GDP growth accelerating to 6.7% YOY from 5.8% YOY in Q2. By industry, services (which account for over 50% of economic activity) continue to provide the biggest boost to the economy, growing by a robust 10.5% YOY, and growth in construction remained solid at 4.7% YOY. Private spending continues to be the economy’s primary driver, surging by 14% YOY in Q3, even faster than the 13.1% YOY growth recorded in Q2, while investment also accelerated to be 13.5% higher over the year. Exports continued to rebound after falling in Q4 2006 and Q1 2007, up 7.1% QOQ to be 1.2% higher over the year.
• Growth in industrial output also accelerated in October. The 4.7% YOY rise in total output was driven by an increase in electricity output and continued solid annual growth in manufacturing.
• External demand continues to be a driving force of the Malaysian economy. In October, exports rose 14.3% YOY, with exports of palm oil and chemicals to China bolstering growth. Import growth was also strong at 18.2% YOY, and largely consisted of components used in manufacturing, implying that a further strengthening could lie ahead for the sector. In related news, Malaysia signed a free trade agreement with Pakistan, paving the way for significant reductions in trade barriers between the two countries.
• Inflation rose to a nine-month high of 2.3% YOY in November. Not surprisingly, Malaysia has not escaped the global phenomenon of higher food and fuel prices. However, high global oil prices do not appear to be worrying the government, which is also aiming to reduce fuel (gasoline, diesel and natural gas) subsidies that currently cost it around 30 bn ringgit per annum. Monetary policy has remained unchanged in Malaysia since April 2006, with rates at 3.5%. Bank Negara Governor Zeti Akhtar Aziz claims that rates are “below neutral” and support economic growth.
Amber Rabinov
Economic data – Malaysia Monthly data Mar 07 Apr 07 May 07 Jun 07 Jul 07 Aug 07 Sep 07 Oct 07 Industrial Production, %YOY -2.2 0.8 3.8 1.6 2.1 1.1 3.1 4.7 Motor Vehicle sales, % YOY -16.6 -16.8 -11.9 8.2 2.3 0.8 4.9 20.7 Consumer Price Index, % YOY 1.5 1.5 1.4 1.4 1.6 1.9 1.8 1.9 Exports, % YOY 1.2 7.5 9.3 6.2 6.6 6.2 7.7 24.5 Imports, % YOY 7.9 9.8 10.0 4.8 9.3 9.6 5.1 28.8 Trade Balance, US$ bn 1.9 1.7 2.3 2.5 2.3 2.5 3.3 2.7 Foreign Exchange Reserves, US$ bn 87.6 92.0 99.7 98.6 98.8 95.8 96.5 100.8 Quarterly data Dec 05 Mar 06 Jun 06 Sep 06 Dec 06 Mar 07 Jun 07 Sep 07 Real GDP, % YOY 5.6 5.7 6.0 6.1 5.9 5.4 5.8 6.8 - Private consumption 8.8 6.6 7.7 7.0 7.0 8.6 13.1 14.0 - Government consumption 13.4 1.2 4.5 9.9 4.1 7.1 10.2 5.3 - Gross fixed capital expenditure 0.5 11.4 7.6 3.5 9.8 9.9 6.6 13.5 Nominal GDP, US$ bn 35.8 37.3 38.8 39.5 40.5 42.6 45.3 46.5 Current Account, US$ bn 4.5 5.5 5.0 7.4 7.7 5.7 6.9 n/a Capital & Financial Account, US$ bn -12.4 -1.4 -0.1 -4.9 -5.5 0.8 2.2 n/a
Sources: Datastream, Bloomberg
Economics@ANZ ANZ International Economics Monthly – January 2008
Page 19
Country Update: Philippines
Economy grows at robust pace in 2007 with inflation contained
Inflation
-15
-10
-5
0
5
10
15
20
25
01 02 03 04 05 06 07
Annual % change
Economic growth
0
1
2
3
4
5
6
7
8
9
10
03 04 05 06 07
Annual % change
Exports of gds & svcs
Core CPI
Total CPI
Sources: Bloomberg, Datastream
Privateconsumption
GDP
Private consumption remains healthy
Overseas workers remittances to the Philippines
Unemployment rate
Sources: Bloomberg, Datastream
4
6
8
10
12
14
16
01 02 03 04 05 06 07
%
4
6
8
10
12
14
16
01 02 03 04 05 06 07
US$ bn (12-mth mvg totals)
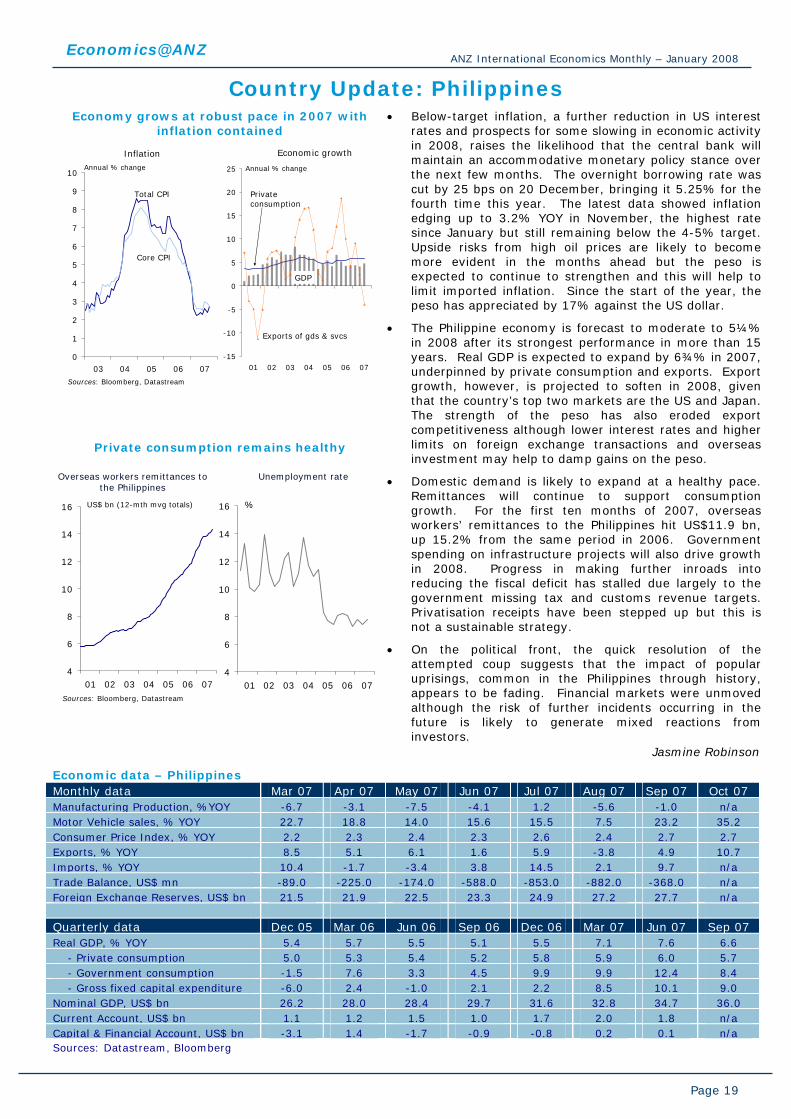
• Below-target inflation, a further reduction in US interest rates and prospects for some slowing in economic activity in 2008, raises the likelihood that the central bank will maintain an accommodative monetary policy stance over the next few months. The overnight borrowing rate was cut by 25 bps on 20 December, bringing it 5.25% for the fourth time this year. The latest data showed inflation edging up to 3.2% YOY in November, the highest rate since January but still remaining below the 4-5% target. Upside risks from high oil prices are likely to become more evident in the months ahead but the peso is expected to continue to strengthen and this will help to limit imported inflation. Since the start of the year, the peso has appreciated by 17% against the US dollar.
• The Philippine economy is forecast to moderate to 5¼% in 2008 after its strongest performance in more than 15 years. Real GDP is expected to expand by 6¾% in 2007, underpinned by private consumption and exports. Export growth, however, is projected to soften in 2008, given that the country’s top two markets are the US and Japan. The strength of the peso has also eroded export competitiveness although lower interest rates and higher limits on foreign exchange transactions and overseas investment may help to damp gains on the peso.
• Domestic demand is likely to expand at a healthy pace. Remittances will continue to support consumption growth. For the first ten months of 2007, overseas workers’ remittances to the Philippines hit US$11.9 bn, up 15.2% from the same period in 2006. Government spending on infrastructure projects will also drive growth in 2008. Progress in making further inroads into reducing the fiscal deficit has stalled due largely to the government missing tax and customs revenue targets. Privatisation receipts have been stepped up but this is not a sustainable strategy.
• On the political front, the quick resolution of the attempted coup suggests that the impact of popular uprisings, common in the Philippines through history, appears to be fading. Financial markets were unmoved although the risk of further incidents occurring in the future is likely to generate mixed reactions from investors.
Jasmine Robinson
Economic data – Philippines Monthly data Mar 07 Apr 07 May 07 Jun 07 Jul 07 Aug 07 Sep 07 Oct 07 Manufacturing Production, %YOY -6.7 -3.1 -7.5 -4.1 1.2 -5.6 -1.0 n/a Motor Vehicle sales, % YOY 22.7 18.8 14.0 15.6 15.5 7.5 23.2 35.2 Consumer Price Index, % YOY 2.2 2.3 2.4 2.3 2.6 2.4 2.7 2.7 Exports, % YOY 8.5 5.1 6.1 1.6 5.9 -3.8 4.9 10.7 Imports, % YOY 10.4 -1.7 -3.4 3.8 14.5 2.1 9.7 n/a Trade Balance, US$ mn -89.0 -225.0 -174.0 -588.0 -853.0 -882.0 -368.0 n/a Foreign Exchange Reserves, US$ bn 21.5 21.9 22.5 23.3 24.9 27.2 27.7 n/a Quarterly data Dec 05 Mar 06 Jun 06 Sep 06 Dec 06 Mar 07 Jun 07 Sep 07 Real GDP, % YOY 5.4 5.7 5.5 5.1 5.5 7.1 7.6 6.6 - Private consumption 5.0 5.3 5.4 5.2 5.8 5.9 6.0 5.7 - Government consumption -1.5 7.6 3.3 4.5 9.9 9.9 12.4 8.4 - Gross fixed capital expenditure -6.0 2.4 -1.0 2.1 2.2 8.5 10.1 9.0 Nominal GDP, US$ bn 26.2 28.0 28.4 29.7 31.6 32.8 34.7 36.0 Current Account, US$ bn 1.1 1.2 1.5 1.0 1.7 2.0 1.8 n/a Capital & Financial Account, US$ bn -3.1 1.4 -1.7 -0.9 -0.8 0.2 0.1 n/a Sources: Datastream, Bloomberg

Economics@ANZ ANZ International Economics Monthly – January 2008
Page 20
Country Update: Singapore Inflation – the key theme in 2008
Sources: Datastream, Monetary Authority of Singapore
Inflation S$ NEER
-8
-6
-4
-2
0
2
4
6
8
10
01 02 03 04 05 06 07
Annual % change
Import price index
96
97
98
99
100
101
102
103
104
105
106
01 02 03 04 05 06 07
1999=100 (end-mth)
HeadlineCPI
Economic momentum moderates
Sources: Datastream, Ministry of Trade and Industry,Singapore
Composite leading index
-20
-15
-10
-5
0
5
10
15
20
25
01 02 03 04 05 06 07
services manufacturing
Annual % change
Real GDP growth
90
95
100
105
110
115
120
125
01 02 03 04 05 06 07
Index: 2000=100
GDP
• Inflation is expected to be the key theme as we enter the New Year. The consumer price index jumped to 3.6% YOY in October 2007 – the highest rate since 1991. This brought the annual average for the first ten months of this year to 1.6% compared with 1% for the same period in 2006. While the spike in inflation reflects the one-off impact of the hike in the GST, the reliance on imported food and oil as well as wage and rental growth mean that the risks to inflation are clearly to the upside. Singapore’s monetary policy, which is centred on exchange rate management, was adjusted in October to allow for a stronger appreciation of the currency to help stem imported inflation. The Monetary Authority of Singapore recently raised its annual inflation forecast range for 2008 to 3.5-4.5% from 2-3% previously. Persistent inflation pressures raise the potential for a further tightening in policy in April when the next monetary policy statement is released. Against the US dollar, the Singapore dollar has climbed by 0.9% since October and a further appreciation of 3½% is forecast in the next six months.
• Meanwhile, the economy has shown some signs of slowing. Third quarter growth was a lower-than-expected 8.9% YOY compared to the advance estimate of 9.4% YOY. The composite leading index, which tracks activity about 9 months ahead, rose 0.2% in Q3 2007 against 3.5% in the previous quarter, signalling some softening in coming months. For 2008, the economy is projected to moderate to around 5.5% as external demand slows as well as base effects. Growth in the manufacturing sector is forecast to slow in H1 2008 but an upturn has been factored in for the second half in anticipation of a pick-up in external demand in 2009. The services sector should hold up well, supported by tourism-related activity. The government has forecast real GDP to expand by 4.5-6.5%.
• On the cabinet front, PM Lee has relinquished the post of finance minister to education minister Tharman Shanmugaratnam. Prior to December, he was also second finance minister and delivered the 2007 budget.
Jasmine Robinson
Economic data – Singapore Monthly data Mar 07 Apr 07 May 07 Jun 07 Jul 07 Aug 07 Sep 07 Oct 07 Industrial Production, %YOY -3.1 19.0 17.7 -7.6 21.9 13.1 -2.5 0.9 Retail Sales, % YOY -5.3 0.9 2.1 14.9 -1.9 6.4 6.3 4.0 Consumer Price Index, % YOY 0.7 0.6 1.0 1.3 2.6 2.9 2.7 3.6 Exports, % YOY 8.4 14.1 4.0 4.1 14.0 6.2 5.7 19.9 Imports, % YOY 9.8 14.3 2.2 4.3 7.6 2.0 4.7 29.4 Trade Balance, US$ bn 3.9 3.0 2.6 2.6 3.4 3.5 4.1 2.6 Foreign Exchange Reserves, US$ bn 137.7 140.0 140.9 144.1 147.0 147.6 152.4 n/a Quarterly data Dec 05 Mar 06 Jun 06 Sep 06 Dec 06 Mar 07 Jun 07 Sep 07 Real GDP, % YOY 8.2 10.3 8.1 6.9 6.5 6.6 8.8 8.9 - Private consumption 3.3 2.8 1.9 2.5 2.7 2.6 5.2 5.8 - Government consumption 11.0 11.5 11.8 19.7 3.6 0.4 0.9 -1.8 - Gross fixed capital expenditure 18.0 10.5 8.3 10.1 17.0 18.8 26.7 14.7 Nominal GDP, US$ bn 30.4 31.3 32.3 33.4 35.2 36.4 38.3 39.8 Current Account, US$ bn 7.4 8.1 9.3 9.0 9.8 10.8 12.0 13.7 Capital & Financial Account, US$ bn -4.0 -3.6 -6.2 -5.7 -5.5 -8.8 -5.1 -8.0 Sources: Bloomberg, Datastream, Economic Survey of Singapore

Economics@ANZ ANZ International Economics Monthly – January 2008
Page 21
Country Update: Taiwan Inflation pressures lift interest rates
-2
-1
0
1
2
3
4
5
6
05 06 07
Annual % change
Core
Headline
Interest rates
Sources: Datastream, Bloomberg
CPI
0
2
4
6
8
00 01 02 03 04 05 06 07
% pa
Taiwan discount rate
Fed funds
Taiwan’s GDP grows strongly in Q3 2007
0
1
2
3
4
5
6
7
8
05 06 07
Annual % change
Source: Datastream, Economics@ANZ
GDP Components of growth
-15
-10
-5
0
5
10
15
20
05 06 07
Annual % change
Exports
Investment
Household consumption
• Upside risks to inflation have also been felt in Taiwan where the CPI rose 5.3% YOY in October and 4.8% YOY in November, more than three times the average rate achieved in 2004-2006 of 1.5%. The acceleration was due largely to high oil prices as well as crop damage from typhoons which put further upward pressure on food prices. In response to the hike in CPI, the Central Bank of China (CBC) increased its benchmark interest rate by 12.5 bps to 3.375% on 20 December, the fourth increase in 2007.
• Taiwan’s interest rates have, historically, tended to move in line with the US but the central bank has, in recent times, not mirrored the actions of the Fed. Lower real interest rates compared with many of its Asian neighbours, which has prompted an outflow of capital, have also underpinned the central bank’s firm stance. The CBC is faced with a difficult task in 2008 as it balances the need to address inflation concerns and capital outflows against the prospect of a slowdown in the US and Europe - major export markets for Taiwan.
• The Taiwan economy grew by 6.9% YOY in Q3 2007, the strongest pace of expansion in three years, fuelled by exports and a gradual recovery in sentiment which has lifted private consumption. Our forecast is for real GDP to expand by 4.2% in 2008 after an estimated 4.6% in 2007. Export growth has, thus far, been relatively healthy. While the slowdown in the US and Europe is likely to adversely impact exports, strong demand from China, its top market, will help to support further, albeit more moderate, growth in overall exports.
• On the political front, parliamentary elections on 12 January and the presidential poll in March 2008 will be closely watched. Tensions will remain high as the election is fought between the ruling Democratic Progressive Party (DPP) and the opposition pan-blue alliance, dominated by the Kuomintang (KMT).
Jasmine Robinson
Economic data – Taiwan Monthly data Mar 07 Apr 07 May 07 Jun 07 Jul 07 Aug 07 Sep 07 Oct 07 Industrial Production, %YOY 0.4 3.3 6.6 7.2 13.3 10.3 9.18 15.95 Retail Sales, % YOY 0.8 1.4 2.3 1.8 4.1 6.8 3.8 n/a Consumer Price Index, % YOY 0.9 0.7 0.0 0.1 -0.3 1.6 3.1 5.3 Exports, % YOY 10.5 4.4 3.4 12.2 8.1 9.8 10.5 15.2 Imports, % YOY 8.6 10.7 -0.2 11.9 16.6 -0.9 10.4 10.6 Trade Balance, US$ bn 2.1 1.4 1.3 1.4 0.4 3.2 3.1 3.4 Foreign Exchange Reserves, US$ bn 267.5 266.5 265.7 266.1 266.3 261.4 262.9 265.9 Quarterly data Dec 05 Mar 06 Jun 06 Sep 06 Dec 06 Mar 07 Jun 07 Sep 07 Real GDP, % YOY 6.8 5.2 4.6 5.4 4.3 4.5 5.09 6.96 - Private consumption 2.4 2.3 0.9 1.3 2.5 2.2 2.4 3.6 - Government consumption 2.9 -1.0 -0.7 0.1 -0.1 0.2 0.0 1.8 - Gross fixed capital expenditure -12.8 -3.0 -4.8 3.7 7.4 1.1 6.2 5.2 Nominal GDP, US$ bn 88.6 89.3 89.9 92.5 93.7 91.8 92.1 98.6 Current Account, US$ bn 9.1 5.5 4.5 6.2 8.5 8.7 5.3 6.0 Capital Account, US$ bn -7.5 -5.8 -6.3 -5.2 -8.5 -10.7 -5.8 -6.1 Sources: Bloomberg, Datastream, National Statistics

Economics@ANZ ANZ International Economics Monthly – January 2008
Page 22
Country Update: Thailand Economy forecast to pick up and inflation
pressures emerge
Inflation
-10
-5
0
5
10
15
20
01 02 03 04 05 06 07
Annual % change
Economic growth
-1
0
1
2
3
4
5
6
7
03 04 05 06 07
Annual % change
Exports of gds & svcs
Core CPI
Total CPI
Sources: Bloomberg, Datastream
Pte. consumption
GDP
Thailand chalks up healthy current account surplus
Current Account Balance Merchandise Trade Performance
-10
-5
0
5
10
15
01 02 03 04 05 06 07
US$ bn, 12-mth mvg total
Source: Datastream
50
60
70
80
90
100
110
120
130
140
150
01 02 03 04 05 06 07
US$ bn, 12-mth mvg total
imports
exports
• Elections for the 480-seat House of Representatives are scheduled for 23 December. A total of 18 parties have registered but the two main contenders are the Democratic Party, which was the main opposition party in the previous elected parliament, and the newly-formed People’s Power Party, which has the largest group of former Thai Rak Thai members.
• The economy is expected to gain momentum as consumer and business sentiment improves once an elected government is restored. We have forecast real GDP to expand by 5½% in 2008. Thanks largely to exports, economic growth in 2007 has continued to surprise on the upside with recently-released data for Q3 2007 showing an expansion of 4.9% YOY, well ahead of expectations. This has brought growth for the first three quarters of 2007 to 4.5%. The risk to the outlook for 2008 is that a weak coalition will emerge from these elections which could lead to a lower growth outlook if policy implementation is delayed through lack of consensus. With global growth forecast to moderate, exports are not expected to perform as well as in 2007 and domestic demand needs to kick-in to underpin growth.
• The robust export performance has lifted Thailand’s current account surplus to US$11.1 bn for the first ten months of 2007. However, the surplus is expected to narrow in 2008 with export growth forecast to moderate and imports likely to pick up as public and private sector investment accelerates.
• Inflation has edged up and upside risks are becoming more evident. CPI rose 3% in annual terms in November, the highest rate since January. The retail price of LPG was lifted from 1 December as the government sought to contain subsidy costs amidst high oil prices, and the minimum wage was raised. An anticipated pick-up in domestic demand is also likely to drive price growth. The central bank is likely to keep its key policy rate unchanged at 3.25% in coming months.
Jasmine Robinson
Economic data – Thailand Monthly data Mar 07 Apr 07 May 07 Jun 07 Jul 07 Aug 07 Sep 07 Oct 07 Manufacturing Production, %YOY 3.8 6.7 6.3 3.9 7.8 10.0 8.8 12.4 Car Sales, % YOY -15.2 -7.2 -7.8 -4.2 1.0 0.9 8.3 12.6 Consumer Price Index, % YOY 2.0 1.8 1.9 1.9 1.7 1.1 2.1 2.5 Exports, % YOY 18.4 18.5 20.9 17.7 6.3 17.9 10.4 26.7 Imports, % YOY 2.2 10.6 6.7 5.1 2.4 14.0 7.4 20.3 Trade Balance, US$ bn 2.1 0.1 0.8 0.9 0.2 0.8 2.0 1.5 Foreign Exchange Reserves, US$ bn 69.1 69.3 69.3 71.3 72.2 72.6 78.7 80.3 Quarterly data Dec 05 Mar 06 Jun 06 Sep 06 Dec 06 Mar 07 Jun 07 Sep 07 Real GDP, % YOY 4.3 6.4 5.4 4.4 4.4 4.2 4.3 4.9 - Private consumption 3.8 4.1 3.1 2.8 2.7 1.3 0.8 1.8 - Government consumption 5.6 3.4 5.7 3.0 -2.8 9.2 9.3 11.5 - Gross fixed capital expenditure 6.1 6.1 3.6 3.9 1.5 -1.5 0.1 2.5 Nominal GDP, US$ bn 45.3 48.7 50.9 52.3 54.8 60.4 63.7 66.8 Current Account, US$ bn -0.2 0.7 -2.3 1.2 2.6 5.0 1.4 2.9 Capital & Financial Account, US$ bn 2.0 2.3 2.4 1.7 -0.7 -2.9 1.0 2.2
Sources: Bloomberg, Datastream,

Economics@ANZ ANZ International Economics Monthly – January 2008
Page 23
Country Update: United States
The US housing market recession continues to deepen…
1.0
1.2
1.4
1.6
1.8
2.0
2.2
2.4
00 01 02 03 04 05 06 07400
425
450
475
500
525
550
575
600
625
Permits(LHS)
No. (million), trend
Starts(LHS)
Real dwelling
investment(RHS)
$bn
Housing construction activity
Sources: Thomson Financial Datastream, Economics@ANZ
…but rising inflationary pressures will inhibit the monetary policy response
0
1
2
3
4
5
03 04 05 06 07
Headline
annual % change
Core
Notional Fed target range
Source: Thomson Financial Datastream
US CPI
• The outlook for the US economy has deteriorated. Financial conditions have tightened significantly since early November and the flow of economic data has generally been on the weaker side of expectations, pointing to a marked slowdown in activity in Q4 and into 2008.
• The epicentre of the slowdown remains the housing sector, which has, as yet, shown few signs of finding a floor. Starts fell a further 3.7% in November while permits fell 1.5%. In trend terms, both indicators are at their lowest levels since around 1992-93.
• Consumers are battling multiple headwinds with falling house prices placing downward pressure on wealth at the same time that higher gas and food prices are eating into disposable incomes. Not surprisingly, spending has slowed, with core retail sales broadly flat in October and September having fallen sharply in August.
• To date, the labour market has held up relatively well with employment growing by a surprisingly strong 94,000 jobs in November and the unemployment rate holding steady at 4.7%. However, recent readings of initial jobless claims and the ISM employment indexes portend a weakening in 2008.
• The Fed cut the federal funds rate by 25bp to 4.25% at its December meeting. Markets were generally disappointed that the Fed did not act more decisively, although this was tempered the next day with the announcement of a temporary Term Auction Facility to alleviate pressures in short-term funding markets. The Fed is reticent to ‘get ahead of the curve’ and cut rates aggressively while inflation is still a concern. Recent readings reinforce the case for caution with the headline CPI rising by 0.8% in November and core by 0.3%. That said, the case for further rate cuts early in 2008 is likely to be made by the evolution of the economic data.
Mark Rodrigues
Economic data – United States Monthly data Mar 07 Apr 07 May 07 Jun 07 Jul 07 Aug 07 Sep 07 Oct 07 Building permits, 000’s 1569 1457 1520 1413 1389 1322 1261 1170 Retail Sales, % YOY 4.3 2.6 5.0 3.7 3.3 3.4 5.0 4.9 Consumer Price Index, % YOY 2.8 2.6 2.7 2.7 2.4 1.9 2.8 3.5 Core Consumer Price Index, % YOY 2.5 2.4 2.3 2.2 2.2 2.1 2.1 2.1 Exports, % YOY 10.7 10.9 11.7 11.0 15.1 13.6 13.8 13.7 Imports, % YOY 7.3 5.2 4.4 4.6 5.2 3.2 5.4 9.2 Trade Balance, USD bn -62.7 -58.9 -59.9 -59.6 -59.1 -57.0 -57.1 -57.8 Quarterly data Dec 05 Mar 06 Jun 06 Sep 06 Dec 06 Mar 07 Jun 07 Sep 07 Real GDP, % YOY 2.9 3.3 3.2 2.4 2.6 1.5 1.9 2.8 - Private consumption 2.8 3.3 3 2.7 3.4 3.2 2.9 3.0 - Government consumption 0.9 1.8 1.8 1.2 2.5 1.2 1.9 2.7 - Gross fixed capital expenditure 5.1 7.5 7.3 6.4 5.2 2.5 4.1 5.1 Unit labour costs (non-farm), %YOY 1.6 2.8 2.2 2.6 4.1 4.3 4.2 3.0 Current Account, US$ bn -215.8 -200.6 -205.6 -217.3 -187.9 -197.1 -188.9 -178.5 Capital & Financial Account, US$ bn 291.2 192.4 142.2 239.5 226.4 166.6 153.2 92.8
Sources: Datastream Note: data seasonally adjusted unless otherwise stated

ANZ International Economics Monthly – January 2008
Page 24
Country Update: Vietnam The stronger dong won't be enough to stem
inflation problems
4
6
8
10
12
14
16
2006 2007
Food
All items
Housing & construction materials
% yearly change
Inflation and its components
Source: National Statistics Office of Vietnam, CEIC, Bloomberg and Economics@ANZ
15800
15850
15900
15950
16000
16050
16100
16150
16200
16250
16300
Jan-07 Apr-07 Aug-07 Dec-07
USD/VND
Vietnamese dong
Rapid domestic credit growth will increase the banking sector’s vulnerability
0
5
10
15
20
25
30
35
40
45
2001 2003 2004 2005 2006 2007
% annual change
Domestic credit growth
Mar-07
Jun-07
• The Vietnamese economy is on track to finish 2007 strongly with annual GDP growth of around 8.5% expected to be easily reached.
• The number one issue facing economic policy-makers in Vietnam is inflation which has steadily climbed higher from 6.5% YOY in January to a 3-year high of 10% YOY in November. Sharply higher food prices, have been the main driver of inflation, although high domestic credit growth, rising global commodity prices and dong depreciation have also contributed. Initial forecasts suggest the CPI will rise by a further 1.5% this month, pushing inflation up to 11% YOY. Inflation now seems set to stay in double-digit figures for at least the first few months of 2008. Despite a recent cut in import tariffs on food products, prices for food are unlikely to ease in the lead up to Vietnamese New Year Tet celebrations in February. A recent rise in administered gasoline prices will also put some short-term pressure on inflation.
• Rapidly rising inflation has put further pressure on local authorities to allow greater volatility in the exchange rate. Having initially targeted a currency depreciation of around 0.5% for this year, authorities look like they will settle for a flat exchange rate performance with the dong appreciating by 1.3% against the US dollar since mid-September. We expect continued inflation pressures will see authorities accept a small appreciation in the dong, of around 0.2% in 2008.
• Rapid credit growth in Vietnam, another key driver of inflation, also requires urgent policy attention. The World Bank estimates credit growth reached 42% YOY in September. This is above the SBV’s forecast for credit growth to rise by 38% in 2007, which itself is above the official target of 25-28%. As well as strong economic growth and ample local liquidity, the banking sector’s bid to complete year-end financial targets appears to be driving strong lending. Anecdotally, there are reports that banks have recently launched programmes to attract more borrowers, including increasing lending limits, lowering property-lending rates and extending debt repayment deadlines. Such actions will not only add to local inflation but also increase the vulnerability of the banking sector to internal or external shocks. Both the IMF and World Bank are now urging authorities to tighten monetary conditions and enhance supervision of banks.
Katie Dean Economic data – Vietnam Monthly data Mar 07 Apr 07 May 07 Jun 07 Jul 07 Aug 07 Sep 07 Oct 07 Industrial Production, %YOY+ 16.6 16.7 16.8 16.9 17.0 17.1 17.1 17.0 Retail Sales, % YOY 21.3 24.5 27.7 27.3 25.1 22.7 22.8 22.7 Consumer Price Index, % YOY 7.5 7.5 7.3 7.8 8.4 8.6 8.8 9.3 CPI-Food & Foodstuffs, %YOY 8.1 8.3 9.2 9.9 11.1 11.9 13.3 13.9 Exports, % YOY+ 23.5 17.9 22 18.4 19.6 19.3 19.4 18.6 Imports, % YOY+ 33.6 32.8 26.9 30.4 29.8 29.9 30.3 30.5 Trade Balance, US$ bn + -1.7 -2.6 -3.2 -4.7 -5.4 -6.4 -7.6 -8.9 Tourist Arrivals, %YOY+ 13.4 12.5 12.7 14.7 16.2 23.5 18.5 17.8 Quarterly data Growth Q3-2007 Real GDP+, % YOY 8.2 Agriculture, forestry, fishery, % YOY 3.0 Industry & construction, % YOY 10.2 Services, % YOY 8.5 +: January-to date vs same period in previous year , *: January to date, ^: US$ bn. Source: General Statistics Office of Vietnam

ANZ International Economics Monthly – January 2008
Page 25
ANZ Research Economics@ANZ Saul Eslake Fiona Allen Chief Economist Business Manager +61 3 9273 6251 +61 3 9273 6224 [email protected] [email protected] Tony Pearson Mark Rodrigues Riki Polygenis Dr. Alex Joiner Head of Australian Economics Senior Economist,
Australia Economist, Australia
Economist, Australia
+61 3 9273 5083 +61 3 9273 6286 +61 3 9273 4060 +61 3 9273 6123 [email protected] [email protected] [email protected] [email protected]
Julie Toth Wain Yuen
Senior Economist, Industry
Economist, Industry
+61 3 9273 6252 +61 3 9273 6295
[email protected] [email protected]
Amy Auster Katie Dean Jasmine Robinson Amber Rabinov
Head of International Economics
Senior Economist, International
Senior Economist, International
Economist, International
+61 3 9273 5417 +61 3 9273 1381 +61 3 9273 6289 +61 3 9273 4853 [email protected] [email protected] [email protected] [email protected] Paul Braddick Ange Montalti Dr. Alex Joiner Stephanie Wayne Head of Financial System Analysis
Senior Economist, Financial System Analysis
Economist, Financial System Analysis
Research Analyst, Financial System Analysis
+61 3 9273 5987 +61 3 9273 6288 +61 3 9273 6123 +61 3 9273 4075 [email protected] [email protected] [email protected] [email protected] Warren Hogan Cherelle Murphy Head of Markets Research Senior Economist, Markets +61 2 9227 1562 +61 3 9273 1995 [email protected] [email protected] ANZ Markets Warren Hogan Sally Auld Tony Morriss Cherelle Murphy Mark Pervan Head of Markets Research Senior Interest Rate Strategist Senior Currency Strategist Senior Economist, Markets Senior Commodity
Strategist +61 2 9227 1562 +61 2 9227 1809 +61 2 9226 6757 +61 3 9273 1995 +61 3 9273 3716 [email protected] [email protected] [email protected] [email protected] [email protected]
David Croy Patricia Gacis Strategist Market Strategist +44 20 7378 2070 +61 2 9227 1272 [email protected] [email protected]
Research & Information Services
Mary Yaxley Marilla Rough Manesha Jayasuriya Head of Research & Information Services
Senior Information Officer Information Officer
+61 3 9273 6265 +61 3 9273 6263 +61 3 9273 4121 [email protected] [email protected] [email protected]
ANZ New Zealand Cameron Bagrie Khoon Goh Philip Borkin Chief Economist Senior Economist Economist +64 4 802 2212 +64 4 802 2357 +64 4 802 2199 [email protected] [email protected] [email protected]
Sean Comber Steve Edwards Kevin Wilson Economist Economist Rural Economist +64 4 802 2286 +64 4 802 2217 +64 4 802 2361 [email protected] [email protected] [email protected]

ANZ International Economics Monthly – January 2008
Page 26
Important Notice
Australia and New Zealand Banking Group Limited is represented in:
AUSTRALIA by:
Australia and New Zealand Banking Group Limited ABN 11 005 357 522
10th Floor 100 Queen Street, Melbourne 3000, Australia
Telephone +61 3 9273 6224 Fax +61 3 9273 5711
UNITED KINGDOM by:
Australia and New Zealand Banking Group Limited
ABN 11 005 357 522
40 Bank Street, Canary Wharf, London, E14 5EJ, United Kingdom
Telephone +44 20 3229 2121 Fax +44 20 7378 2378
UNITED STATES OF AMERICA by:
ANZ Securities, Inc. (Member of NASD and SIPC)
6th Floor 1177 Avenue of the Americas
New York, NY 10036, United States of America
Tel: +1 212 801 9160 Fax: +1 212 801 9163
NEW ZEALAND by:
ANZ National Bank Limited
Level 7, 1-9 Victoria Street, Wellington, New Zealand
Telephone +64 4 802 2000 This document (“document”) is distributed to you in Australia and the United Kingdom by Australia and New Zealand Banking Group Limited ABN 11 005 357 522 (“ANZ”) and in New Zealand by ANZ National Bank Limited (“ANZ NZ”). ANZ holds an Australian Financial Services licence no. 234527 and is authorised in the UK by the Financial Services Authority (“FSA”).
This document is being distributed in the United States by ANZ Securities, Inc. (“ANZ S”) (an affiliated company of ANZ), which accepts responsibility for its content. Further information on any securities referred to herein may be obtained from ANZ S upon request. Any US person(s) receiving this document and wishing to effect transactions in any securities referred to herein should contact ANZ S, not its affiliates.
This document is being distributed in the United Kingdom by ANZ for the information of its market counterparties and intermediate customers only. It is not intended for and must not be distributed to private customers. In the UK, ANZ is regulated by the FSA. Nothing here excludes or restricts any duty or liability to a customer which ANZ may have under the UK Financial Services and Markets Act 2000 or under the regulatory system as defined in the Rules of the FSA.
This document is issued on the basis that it is only for the information of the particular person to whom it is provided. This document may not be reproduced, distributed or published by any recipient for any purpose. This document does not take into account your personal needs and financial circumstances. Under no circumstances is this document to be used or considered as an offer to sell, or a solicitation of an offer to buy.
In addition, from time to time ANZ, ANZ NZ, ANZ S, their affiliated companies, or their respective associates and employees may have an interest in any financial products (as defined by the Australian Corporations Act 2001), securities or other investments, directly or indirectly the subject of this document (and may receive commissions or other remuneration in relation to the sale of such financial products, securities or other investments), or may perform services for, or solicit business from, any company the subject of this document. If you have been referred to ANZ, ANZ NZ, ANZ S or their affiliated companies by any person, that person may receive a benefit in respect of any transactions effected on your behalf, details of which will be available upon request.
The information herein has been obtained from, and any opinions herein are based upon, sources believed reliable. The views expressed in this document accurately reflect the author’s personal views, including those about any and all of the securities and issuers referred to herein. The author however makes no representation as to its accuracy or completeness and the information should not be relied upon as such. All opinions and estimates herein reflect the author’s judgement on the date of this document and are subject to change without notice. No part of the author's compensation was, is or will directly or indirectly relate to specific recommendations or views expressed about any securities or issuers in this document. ANZ, ANZ NZ, ANZ S, their affiliated companies, their respective directors, officers, and employees disclaim any responsibility, and shall not be liable, for any loss, damage, claim, liability, proceedings, cost or expense (“Liability”) arising directly or indirectly (and whether in tort (including negligence), contract, equity or otherwise) out of or in connection with the contents of and/or any omissions from this communication except where a Liability is made non-excludable by legislation.
Where the recipient of this publication conducts a business, the provisions of the Consumer Guarantees Act 1993 (NZ) shall not apply.